Attached files
| file | filename |
|---|---|
| 8-K - CURRENT REPORT - PALTALK, INC. | f8k081214_snapinteract.htm |
EXHIBIT 99.1
Snap Interactive Reports Higher Revenues, Reduced Net Loss and Positive Adjusted EBITDA for the Quarter Ended June 30, 2014
| ● | Second Quarter Revenues up 9% Over Comparable 2013 Period, 5% Sequentially | |
| ● | Net Loss of $260 Thousand; an Improvement of $1.2 Million Year over Year and an Improvement of $0.7 million Sequentially | |
| ● | Snap Achieves Positive Adjusted EBITDA |
New York, August 12, 2014 — Snap Interactive, Inc. (“SNAP” or the “Company”) (OTCQB: STVI), a leading online dating provider and owner of AYI.com, today announced the following financial and operational results for the quarter ended June 30, 2014:
| ● | total revenues for the second quarter of 2014 increased by approximately 9% to $3.5 million as compared to the comparable period of 2013, and increased approximately 5% sequentially over the first quarter of 2014; | |
| ● | incurred a net loss of approximately $260 thousand, an improvement of approximately $1.2 million year over year, and $0.7 million sequentially; | |
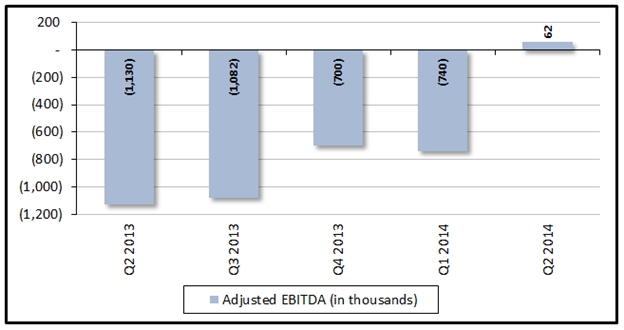
| ● | generated positive adjusted EBITDA of approximately $62 thousand, an improvement of approximately $1.2 million year over year, and $0.8 million sequentially; | |
| ● | enjoyed available sources of liquidity (including cash, cash equivalents and restricted cash) totaling $941 thousand at June 30, 2014, which reflected an increase of $123 thousand compared to March 31, 2014; | |
| ● | increased active subscriber count by 26% in the first six months of 2014 from approximately 77,700 as of December 31, 2013 to approximately 98,000 as of June 30, 2014, and increased active subscriber count to approximately 100,400 as of August 11, 2014; and | |
| ● | signed a Membership Acquisition Agreement with Zoosk.com, Inc. in June 2014. |
Financial Highlights
Current period compared with same period in prior year:
| Three Months Ended | ||||||||||||
| GAAP Results | June 30, 2014 | June 30, 2013 | Change | |||||||||
| Total revenues | $ | 3,450,010 | $ | 3,151,989 | 9 | % | ||||||
| Advertising and marketing expense | $ | 1,110,726 | $ | 952,248 | 17 | % | ||||||
| Deferred subscription revenue (at period end) | $ | 1,958,767 | $ | 2,031,702 | (4 | )% | ||||||
| Net loss | $ | (259,678 | ) | $ | (1,472,413 | ) | (82 | )% | ||||
| Net cash used in operating activities | $ | (301,174 | ) | $ | (1,480,086 | ) | (80 | )% | ||||
| Non-GAAP Results | ||||||||||||
| Bookings | $ | 3,021,860 | $ | 3,114,169 | (3 | )% | ||||||
| Overall liquidity (at period end) | $ | 941,167 | $ | 2,992,944 | (69 | )% | ||||||
| Adjusted EBITDA | $ | 61,746 | $ | (1,130,476 | ) | N/A | ||||||
Current period compared to prior period:
| Three Months Ended | ||||||||||||
| GAAP Results | June 30, 2014 | March 31, 2014 | Change | |||||||||
| Total revenues | $ | 3,450,010 | $ | 3,292,353 | 5 | % | ||||||
| Advertising and marketing expense | $ | 1,110,726 | $ | 1,472,210 | (25 | )% | ||||||
| Deferred subscription revenue (at period end) | $ | 1,958,767 | $ | 2,087,909 | (6 | )% | ||||||
| Net loss | $ | (259,678 | ) | $ | (933,094 | ) | (72 | )% | ||||
| Net cash used in operating activities | $ | (301,174 | ) | $ | (464,520 | ) | (35 | )% | ||||
| Non-GAAP Results | ||||||||||||
| Bookings | $ | 3,021,860 | $ | 3,400,158 | (11 | )% | ||||||
| Overall liquidity (at period end) | $ | 941,167 | $ | 818,196 | 15 | % | ||||||
| Adjusted EBITDA | $ | 61,746 | $ | (739,504 | ) | N/A | ||||||
Management Commentary
During the quarter ended June 30, 2014, SNAP’s management has been focused on two principal initiatives: increasing revenue and subscriber growth in a cost-effective manner, while implementing cost reductions to reduce cash “burn,” with the goal of becoming cash flow positive in the third quarter of 2014. Management believes this goal is achievable and that the Company will become cash flow positive in the third quarter of 2014.
| 2 |
Initiative 1: Capital-Efficient Growth
AYI.com showed growth in key areas during the second quarter of 2014, including:
| ● | Revenues - total revenues for the second quarter of 2014 increased 9% to $3.5 million over the comparable period in 2013, and by 5% on a sequential basis; |
| ● | Advertising revenue – advertising revenue increased in the second quarter of 2014 by 17,805% over the comparable period in 2013 and by 95% on a sequential basis as a result of the business development agreement renewal with Match.com, LLC; |
| ● | Active subscribers - active subscribers increased 9% during the second quarter of 2014, reaching approximately 98,000 at June 30, 2014, which represents a 26% increase from December 31, 2013; |
| ● | New subscription transactions - new subscription transactions increased approximately 33% in the six month period ended June 30, 2014 as compared to the same period in 2013; and |
| ● | Marketing efficiency – The Company generated approximately $6.7 million in total revenues for the six months ended June 30, 2014 based on approximately $2.6 million of advertising and marketing expense for the same period. |
SNAP’s Chief Executive Officer, Clifford Lerner, commented, “Over the past several months, we’ve been intensely focused on achieving our third quarter objective of positive cash flow coupled with continued top-line growth. Our progress is highlighted by our reaching positive Adjusted EBITDA in the second quarter, a major milestone for the Company. We have continued to increase our revenues and ramp up our active subscriber base while reducing our overhead and lowering our advertising and marketing expense. This accomplishment was made possible by our continual process of test-driven improvement in the acquisition and engagement of our users.”
Mr. Lerner continued, “We believe that the three drivers of revenue growth - new and incremental advertising deals, improving the conversion of free users to paying subscribers, and cost-effective advertising and marketing, should continue for the remainder of the year. We have tremendous momentum heading into second half of 2014.”
Initiative 2: Cost Reductions
| ● | Decrease in net loss - net loss of $260 thousand for the second quarter of 2014, representing a $1.2 million decrease in net loss as compared to the second quarter of 2013 and a $673 thousand decrease on a sequential basis; | |
| ● | Advertising and marketing expenses – though compared to the second quarter of 2013 advertising and marketing expense increased by 17% during the second quarter of 2014, the Company reduced advertising and marketing expense by 25% relative to the first quarter of 2014; | |
| ● | Overhead reductions - total costs and expenses were reduced by 21% in the second quarter of 2014 as compared to the second quarter of 2013 and by 14% as compared to the first quarter of 2014; and | |
| ● | Headcount - the Company also significantly decreased headcount since the fourth quarter of 2013 – from 42 employees at December 31, 2013 to a headcount of 33 employees as of June 30, 2014, a 21% decrease. | |
SNAP’s Chief Operating Officer, Alex Harrington, added, “We’ve made great progress in increasing the efficiency of the business across the board. We’re operating leanly, but even now the personnel and infrastructure we have assembled at SNAP could support the growth of the Company to a much larger scale. In addition, the majority of our expenses do not increase with revenues, providing operational leverage that we expect will increase earnings in the future.”
| 3 |
Liquidity and Cash Flow
| ● | Increased liquidity - overall liquidity (including cash, cash equivalents and restricted cash) increased to $941 thousand at June 30, 2014, a $123 thousand increase over the quarter ended March 31, 2014; | |
| ● | Promissory notes - the Company issued two promissory notes equaling $400 thousand in the aggregate in April 2014 and May 2014; | |
| ● | Advertising revenue agreements - in April 2014, we amended our Business Development Agreement with Match.com, LLC, which was accompanied by a cash payment from Match.com, LLC of $300 thousand. In June 2014, the Company entered into a Membership Acquisition Agreement with Zoosk.com which commences in August 2014 and provided for a cash advance of $500 thousand paid in two installments; | |
| ● | Operating leverage – growing revenue and consistent expenses are expected to improve cash flow and profitability in future quarters; and | |
| ● | Break-even cash flow – management believes that the Company is on target to achieve positive net cash from operating activities for the third quarter of 2014. |
Mr. Lerner concluded, “We are as excited as ever about the future at SNAP, as we believe the outstanding results of the second quarter of 2014 position the Company to be a growing business generating positive net cash from operating activities for the remainder of the fiscal year.”
IR Contact:
IR@snap-interactive.com
Stephen Hart
Hayden IR
hart@haydenir.com
917-658-7878
PR Contact:
Joanna Barber
jbarber@snap-interactive.com
212-967-5120 ext. 111
About Snap Interactive, Inc.
Snap Interactive, Inc. develops, owns and operates an online dating application for social networking websites and mobile platforms. SNAP’s flagship brand, AYI.com is one of the largest online and mobile dating applications on the Internet and offers a completely integrated Facebook, iPhone, Android and Web dating application. AYI.com’s mission is to improve the online dating experience of meeting new people by integrating a user’s friends and interests to enable more meaningful connections.
| 4 |
For more information on SNAP, please visit http://www.snap-interactive.com/ or its online dating blog at http://www.ayi.com/dating-blog.
The contents of our websites are not part of this press release, and you should not consider the contents of these websites in making an investment decision with respect to our common stock.
Facebook® is a registered trademark of Facebook, Inc. iPhone® is a registered trademark of Apple Inc. Android® is a registered trademark of Google Inc. AYI.com® is a registered trademark of Snap Interactive, Inc.
Forward-Looking Statements
This press release contains “forward-looking statements” made under the “safe harbor” provisions of the Private Securities Litigation Reform Act of 1995 that are based on current expectations, estimates, forecasts and assumptions and are subject to risks and uncertainties. Words such as “anticipate,” “assume,” “believe,” “estimate,” “expect,” “goal,” “intend,” “plan,” “project,” “seek,” “target,” and variations of such words and similar expressions are intended to identify forward-looking statements. Such forward-looking statements are subject to certain risks, uncertainties and assumptions that may cause actual results to differ materially from those expressed by the forward-looking statements, including, but not limited to, the following: general economic, industry and market sector conditions; the Company’s future growth and the ability to obtain additional financing to implement the Company’s growth strategy; the ability to achieve break-even cash flow; or positive Adjusted EBITDA the ability to increase or recognize revenue, decrease expenses and increase the number of active subscribers or new subscription transactions; the ability to enter into new advertising agreements; the ability to diversify new user acquisition channels or improve the conversion of users to paid subscribers; the ability to anticipate and respond to changing user and industry trends and preferences; the intense competition in the online dating marketplace; and circumstances that could disrupt the functioning of the Company’s application and websites. In evaluating these statements, you should carefully consider these risks and uncertainties and those described under the headings “Management’s Discussion and Analysis of Financial Condition and Results of Operations” and “Risk Factors” in the Company’s most recent Annual Report on Form 10-K, Quarterly Reports on Form 10-Q and other Securities and Exchange Commission filings.
All forward-looking statements speak only as of the date on which they are made. The Company undertakes no obligation to update any forward-looking statement or statements to reflect events or circumstances after the date on which such statement was made, except to the extent required by applicable securities laws.
| 5 |
SNAP INTERACTIVE, INC.
CONDENSED CONSOLIDATED BALANCE SHEETS
| June 30, | December 31, | |||||||
| 2014 | 2013 | |||||||
| (Unaudited) | ||||||||
| Assets | ||||||||
| Current assets: | ||||||||
| Cash and cash equivalents | $ | 555,745 | $ | 927,352 | ||||
| Restricted cash | 385,422 | 490,315 | ||||||
| Credit card holdback receivable | 686,016 | 232,264 | ||||||
| Accounts receivable, net of allowances and reserves of $33,653 and $37,850, respectively | 276,881 | 385,370 | ||||||
| Prepaid expense and other current assets | 132,916 | 114,863 | ||||||
| Total current assets | 2,036,980 | 2,150,164 | ||||||
| Fixed assets and intangible assets, net | 439,320 | 522,462 | ||||||
| Notes receivable | 122,749 | 170,566 | ||||||
| Investments | 150,000 | 100,000 | ||||||
| Total assets | $ | 2,749,049 | $ | 2,943,192 | ||||
| Liabilities and stockholders’ equity (deficit) | ||||||||
| Current liabilities: | ||||||||
| Accounts payable | 949,854 | 861,730 | ||||||
| Accrued expenses and other current liabilities | 485,858 | 671,142 | ||||||
| Promissory notes | 400,000 | - | ||||||
| Deferred subscription revenue | 1,958,767 | 1,826,771 | ||||||
| Deferred advertising revenue | 446,667 | 300,000 | ||||||
| Total current liabilities | 4,241,146 | 3,659,643 | ||||||
| Long term deferred rent | - | 12,058 | ||||||
| Warrant liability | 70,275 | 140,550 | ||||||
| Total liabilities | 4,311,421 | 3,812,251 | ||||||
| Stockholders' equity (deficit): | ||||||||
| Preferred stock, $0.001 par value, 10,000,000 shares authorized, none issued and outstanding | - | - | ||||||
| Common stock, $0.001 par value, 100,000,000 shares authorized, 49,507,826 and 49,987,826 shares issued, respectively, and 39,182,826 and 39,132,826 shares outstanding, respectively | 39,183 | 39,133 | ||||||
| Additional paid-in capital | 11,312,617 | 10,813,205 | ||||||
| Accumulated deficit | (12,914,172 | ) | (11,721,397 | ) | ||||
| Total stockholders' equity (deficit) | (1,562,372 | ) | (869,059 | ) | ||||
| Total liabilities and stockholders' equity (deficit) | $ | 2,749,049 | $ | 2,943,192 | ||||
| 6 |
SNAP INTERACTIVE, INC.
CONDENSED CONSOLIDATED STATEMENTS OF OPERATIONS
(Unaudited)
| Three Months Ended | Six Months Ended | |||||||||||||||
| June 30, | June 30, | |||||||||||||||
| 2014 | 2013 | 2014 | 2013 | |||||||||||||
| Revenues: | ||||||||||||||||
| Subscription revenue | $ | 3,151,002 | $ | 3,150,319 | $ | 6,290,022 | $ | 6,578,210 | ||||||||
| Advertising revenue | 299,008 | 1,670 | 452,341 | 43,339 | ||||||||||||
| Total revenues | 3,450,010 | 3,151,989 | 6,742,363 | 6,621,549 | ||||||||||||
| Costs and expenses: | ||||||||||||||||
| Programming, hosting and technology expense | 669,795 | 1,339,930 | 1,612,206 | 2,701,321 | ||||||||||||
| Compensation expense | 864,859 | 1,078,536 | 1,634,262 | 1,899,606 | ||||||||||||
| Professional fees | 262,876 | 206,703 | 513,031 | 473,807 | ||||||||||||
| Advertising and marketing expense | 1,110,726 | 952,248 | 2,582,937 | 2,083,929 | ||||||||||||
| General and administrative expense | 795,854 | 1,118,700 | 1,659,272 | 2,264,725 | ||||||||||||
| Total costs and expenses | 3,704,110 | 4,696,117 | 8,001,708 | 9,423,388 | ||||||||||||
| Loss from operations | (254,100 | ) | (1,544,128 | ) | (1,259,345 | ) | (2,801,839 | ) | ||||||||
| Interest income (expense), net | (5,578 | ) | 1,440 | (3,705 | ) | 3,106 | ||||||||||
| Gain on change in fair value of warrants | - | 70,275 | 70,275 | 1,171,250 | ||||||||||||
| Loss before provision for income taxes | (259,678 | ) | (1,472,413 | ) | (1,192,775 | ) | (1,627,483 | ) | ||||||||
| Provision for income taxes | - | - | - | - | ||||||||||||
| Net loss | $ | (259,678 | ) | $ | (1,472,413 | ) | $ | (1,192,775 | ) | $ | (1,627,483 | ) | ||||
| Net loss per common share: | ||||||||||||||||
| Basic and diluted | $ | (0.01 | ) | $ | (0.04 | ) | $ | (0.03 | ) | $ | (0.04 | ) | ||||
| Weighted average number of common shares used in calculating net loss per common share: | ||||||||||||||||
| Basic and diluted | 39,152,713 | 38,932,826 | 39,155,340 | 38,920,671 | ||||||||||||
| 7 |
SNAP INTERACTIVE, INC.
CONDENSED CONSOLIDATED STATEMENTS OF CASH FLOWS
(Unaudited)
| Six Months Ended | ||||||||
| June 30, | ||||||||
| 2014 | 2013 | |||||||
| Cash flows from operating activities: | ||||||||
| Net loss | $ | (1,192,775 | ) | $ | (1,627,483 | ) | ||
| Adjustments to reconcile net loss to net cash used in operating activities: | ||||||||
| Depreciation and amortization | 86,873 | 85,563 | ||||||
| Stock-based compensation expense | 494,712 | 445,069 | ||||||
| Gain on change in fair value of warrants | (70,275 | ) | (1,171,250 | ) | ||||
| Changes in operating assets and liabilities: | ||||||||
| Decrease (increase) in restricted cash | 104,893 | (270,211 | ) | |||||
| Decrease (increase) in credit card holdback receivable | (453,752 | ) | 30,369 | |||||
| Decrease (increase) in accounts receivable | 108,489 | (13,163 | ) | |||||
| Decrease (increase) in prepaid expenses and other current assets | (13,303 | ) | 34,688 | |||||
| Increase (decrease) in accounts payable, accrued expenses and other current liabilities | (89,913 | ) | 341,601 | |||||
| Decrease in deferred rent | (19,306 | ) | (14,587 | ) | ||||
| Increase (decrease) in deferred subscription revenue | 131,996 | (492,527 | ) | |||||
| Increase in deferred advertising revenue | 146,667 | - | ||||||
| Net cash used in operating activities | (765,694 | ) | (2,651,931 | ) | ||||
| Cash flows from investing activities: | ||||||||
| Purchase of fixed assets | (3,731 | ) | (35,550 | ) | ||||
| Purchase of non-marketable equity securities | (50,000 | ) | (50,000 | ) | ||||
| Repayment of notes receivable issued to employees and accrued interest | 47,818 | (2,382 | ) | |||||
| Net cash used in investing activities | (5,913 | ) | (87,932 | ) | ||||
| Cash flows from financing activities: | ||||||||
| Proceeds from issuance of promissory notes | 400,000 | - | ||||||
| Net cash provided by financing activities | 400,000 | - | ||||||
| Decrease in cash and cash equivalents | (371,607 | ) | (2,739,863 | ) | ||||
| Balance of cash and cash equivalents at beginning of period | 927,352 | 5,357,596 | ||||||
| Balance of cash and cash equivalents at end of period | $ | 555,745 | $ | 2,617,733 | ||||
| Supplemental disclosure of cash flow information | ||||||||
| AYI.com domain name purchase in exchange for 100,000 shares of common stock | $ | - | $ | 100,000 | ||||
| Warrants issued for debt issuance costs | $ | 4,750 | - | |||||
| 8 |
SNAP INTERACTIVE, INC
RECONCILIATION OF GAAP TO NON-GAAP RESULTS
(unaudited)
| Three Months Ended | ||||||||||||
| June 30, 2014 | June 30, 2013 | March, 31 2014 | ||||||||||
| Reconciliation of Subscription Revenue to Bookings | ||||||||||||
| Subscription revenue | $ | 3,151,002 | $ | 3,150,319 | $ | 3,139,020 | ||||||
| Change in deferred subscription revenue | (129,142 | ) | (36,150 | ) | 261,138 | |||||||
| Bookings | $ | 3,021,860 | $ | 3,114,169 | $ | 3,400,158 | ||||||
| Three Months Ended | ||||||||||||
| June 30, | June 30, | March, 31 | ||||||||||
| 2014 | 2013 | 2014 | ||||||||||
| Reconciliation of Cash and Cash Equivalents to Overall Liquidity
(at period end) | ||||||||||||
| Cash and cash equivalents | $ | 555,745 | $ | 2,617,733 | $ | 432,869 | ||||||
| Restricted cash | 385,422 | 375,211 | 385,327 | |||||||||
| Overall liquidity | $ | 941,167 | $ | 2,992,944 | $ | 818,196 | ||||||
| Three Months Ended | ||||||||||||||||||||
| Reconciliation of net income (loss) to Adjusted EBITDA: | June 30, 2014 | March 31, 2014 | December 31, 2014 | September 30, 2013 | June 30, 2013 | |||||||||||||||
| Net income (loss) | $ | (259,678 | ) | $ | (933,094 | ) | $ | (659,782 | ) | $ | (1,718,747 | ) | $ | (1,472,413 | ) | |||||
| Interest expense (income) | $ | 5,578 | $ | (1,874 | ) | $ | (4,627 | ) | $ | (1,405 | ) | $ | (1,440 | ) | ||||||
| Depreciation and amortization expense | $ | 43,610 | $ | 43,263 | $ | 44,620 | $ | 44,457 | $ | 43,530 | ||||||||||
| Loss (gain) on change in fair value of warrants | $ | - | $ | (70,275 | ) | $ | (468,500 | ) | $ | 163,975 | $ | (70,275 | ) | |||||||
| Stock compensation expense | $ | 272,236 | $ | 222,476 | $ | 388,664 | $ | 429,900 | $ | 370,122 | ||||||||||
| Adjusted EBITDA | $ | 61,746 | $ | (739,504 | ) | $ | (699,625 | ) | $ | (1,081,820 | ) | $ | (1,130,476 | ) | ||||||
| 9 |
Non-GAAP Financial Measures
We have provided in this release non-GAAP financial information including bookings and overall liquidity to supplement the consolidated financial statements, which are prepared in accordance with generally accepted accounting principles in the United States ("GAAP"). Management uses these non-GAAP financial measures internally in analyzing our financial results to assess operational performance and to determine our future capital requirements. The presentation of this financial information is not intended to be considered in isolation or as a substitute for the financial information prepared in accordance with GAAP. We believe that both management and investors benefit from referring to these non-GAAP financial measures in assessing our performance and when planning, forecasting and analyzing future periods. We believe these non-GAAP financial measures are useful to investors because it allows for greater transparency with respect to key financial metrics we use in making operating decisions and because our investors and analysts use such information to help assess the health of our business.
Some limitations of bookings, overall liquidity and adjusted EBITDA as financial measures include that:
| ● | Bookings does not reflect that we defer and recognize revenue from subscription fees and micro-transactions over the length of the subscription term; |
| ● | Overall liquidity does not reflect the Company's ability to convert restricted cash into cash and cash equivalents; |
| ● | Adjusted EBITDA does not (i) reflect cash capital expenditure requirements for assets underlying depreciation and amortization expense that may need to be replaced or for new capital expenditures; (ii) consider the potentially dilutive impact of stock-based compensation; (iii) reflect interest expense or interest payments on our outstanding indebtedness; and (iv) reflect the change in fair value of warrants; and |
| ● | Other companies, including companies in our industry, may calculate bookings overall liquidity and adjusted EBITDA differently or choose not to calculate bookings, overall liquidity or adjusted EBITDA at all, which reduces their usefulness as comparative measures. |
Because of these limitations, you should consider non-GAAP metrics along with other financial performance measures, including total revenues, deferred revenue, net income (loss), cash and cash equivalents, restricted cash, net cash used in operating activities and our financial results presented in accordance with GAAP.
10