Attached files
| file | filename |
|---|---|
| EX-32.1 - CERTIFICATION - PALTALK, INC. | f10q0915ex32i_snapinter.htm |
| EX-31.1 - CERTIFICATION - PALTALK, INC. | f10q0915ex31i_snapinter.htm |
UNITED STATES
SECURITIES AND EXCHANGE COMMISSION
Washington, D.C. 20549
Form 10-Q
☒ QUARTERLY REPORT PURSUANT TO SECTION 13 OR 15(d) OF THE SECURITIES EXCHANGE ACT OF 1934
For the quarterly period ended September 30, 2015
OR
☐ TRANSITION REPORT PURSUANT TO SECTION 13 OR 15(d) OF THE SECURITIES EXCHANGE ACT OF 1934
For the transition period from to
Commission File Number 000-52176
SNAP INTERACTIVE, INC.
(Exact name of registrant as specified in its charter)
| Delaware | 20-3191847 | |
|
(State or other jurisdiction
of |
(I.R.S. Employer |
320 W 37th Street, 13th Floor
New York, NY 10018
(Address of principal executive offices)
(Zip Code)
(212) 594-5050
(Registrant’s telephone number, including area code)
Indicate by check mark whether the registrant (1) has filed all reports required to be filed by Section 13 or 15(d) of the Securities Exchange Act of 1934 during the preceding 12 months (or for such shorter period that the registrant was required to file such reports), and (2) has been subject to such filing requirements for the past 90 days. Yes ☒ No ☐
Indicate by check mark whether the registrant has submitted electronically and posted on its corporate Web site, if any, every Interactive Data File required to be submitted and posted pursuant to Rule 405 of Regulation S-T (§232.405 of this chapter) during the preceding 12 months (or for such shorter period that the registrant was required to submit and post such files). Yes ☒ No ☐
Indicate by check mark whether the registrant is a large accelerated filer, an accelerated filer, a non-accelerated filer or a smaller reporting company. See the definitions of “large accelerated filer,” “accelerated filer” and “smaller reporting company” in Rule 12b-2 of the Exchange Act. (Check one):
| Large accelerated filer | ☐ | Accelerated filer | ☐ |
| Non-accelerated filer | ☐ | Smaller reporting company | ☒ |
| (Do not check if a smaller reporting company) | |||
Indicate by check mark whether the registrant is a shell company (as defined in Rule 12b-2 of the Exchange Act). Yes ☐ No ☒
Indicate the number of shares outstanding of each of the issuer’s classes of common stock, as of the latest practicable date.
| Class | Outstanding on November 6, 2015 | |
| Common Stock, par value $0.001 per share | 39,692,826* |
*Excludes 10,325,000 shares of unvested restricted stock.
SNAP INTERACTIVE, INC.
QUARTERLY REPORT ON FORM 10-Q
FOR THE QUARTER ENDED SEPTEMBER 30, 2015
Table of Contents
| Page Number | |||
| PART I. FINANCIAL INFORMATION | |||
| ITEM 1. | Financial Statements | ||
| Condensed Consolidated Balance Sheets as of September 30, 2015 (Unaudited) and December 31, 2014 | 1 | ||
| Condensed Consolidated Statements of Operations for the Three and Nine Months Ended September 30, 2015 and 2014 (Unaudited) | 2 | ||
| Condensed Consolidated Statement of Changes in Stockholders’ Equity (Deficit) for the Nine Months Ended September 30, 2015 (Unaudited) | 3 | ||
| Condensed Consolidated Statements of Cash Flows for the Nine Months Ended September 30, 2015 and 2014 (Unaudited) | 4 | ||
| Notes to Condensed Consolidated Financial Statements (Unaudited) | 5 | ||
| ITEM 2. | Management's Discussion and Analysis of Financial Condition and Results of Operations | 18 | |
| ITEM 3. | Quantitative and Qualitative Disclosures About Market Risk | 30 | |
| ITEM 4. | Controls and Procedures | 30 | |
| PART II. OTHER INFORMATION | |||
| ITEM 1. | Legal Proceedings | 32 | |
| ITEM 1A. | Risk Factors | 32 | |
| ITEM 2. | Unregistered Sales of Equity Securities and Use of Proceeds | 32 | |
| ITEM 3. | Defaults Upon Senior Securities | 32 | |
| ITEM 4. | Mine Safety Disclosures | 32 | |
| ITEM 5. | Other Information | 32 | |
| ITEM 6. | Exhibits | 33 |
Unless the context otherwise indicates, references to “Snap,” “we,” “our,” “us” and the “Company” refer to Snap Interactive, Inc. and its subsidiary on a consolidated basis.
AYI, the AYI logo, Snap, the Snap logo and other trademarks or service marks appearing in this report are the property of Snap Interactive, Inc. Trade names, trademarks and service marks of other companies appearing in this report are the property of their respective owners.
A reference to a swipe is a gesture that a user of The Grade makes when browsing a profile, swiping to the right to signify interest or to the left to signify lack of interest, which in either case advances the user to the next profile. Unless otherwise indicated, metrics for users are based on information that is reported by Facebook and internally-derived metrics for users across all platforms through which our application is accessed. References in this report to users means those persons that have created a user name and password, and active subscribers means users that have prepaid a subscription fee for current unrestricted communication on the AYI application and whose subscription period has not yet expired. The metrics for active subscribers are based on internally-derived metrics across all platforms through which our application is accessed.
FORWARD-LOOKING STATEMENTS
Certain statements contained in this Quarterly Report on Form 10-Q constitute “forward-looking statements” as defined in Section 27A of the Securities Act of 1933, as amended (the “Securities Act”), and Section 21E of the Securities Exchange Act of 1934, as amended (the “Exchange Act”), that are based on current expectations, estimates, forecasts and assumptions and are subject to risks and uncertainties. Words such as “anticipate,” “assume,” “believe,” “budget,” “continue,” “could,” “estimate,” “expect,” “forecast,” “goal,” “intend,” “may,” “plan,” “potential,” “predict,” “project,” “seek,” “should,” “began,” “target,” “would” and variations of such words and similar expressions are intended to identify such forward-looking statements. All forward-looking statements speak only as of the date on which they are made. Such forward-looking statements are subject to certain risks, uncertainties and assumptions relating to factors that could cause actual results to differ materially from those anticipated in such statements, including, without limitation, the following:
| ● | our ability to generate and sustain increased revenue levels and achieve profitability in the future; |
| ● | our ability to maintain good relationships with Apple Inc., Facebook, Inc. and Google Inc., our heavy reliance on their platforms and their ability to discontinue, limit or restrict access to their platforms by us or our applications, change their terms and conditions or other policies or features (including restricting methods of collecting payments, sending notifications or placing advertisements), establish more favorable relationships with one or more of our competitors or develop applications or features that compete with our applications; |
| ● | our reliance on our executive officers; |
| ● | the intense competition in the online dating industry; |
| ● | our ability to release new applications or derive revenue from new applications such as The Grade; |
| ● | our reliance on a small percentage of our total users for substantially all of our revenue; |
| ● | our ability to develop, establish and maintain a strong brand; |
| ● | our ability to update our applications to respond to the trends and preferences of online dating consumers; |
| ● | our ability to adapt or modify our applications for the international market and derive revenue therefrom; |
| ● | our ability to develop and market new technologies to respond to rapid technological changes; |
| ● | our ability to effectively manage our headcount, including attracting and retaining qualified employees; |
| ● | our ability to generate subscribers through advertising and marketing agreements with third party advertising and marketing providers; |
| ● | our reliance on third party email service providers for delivery of email campaigns to convert users to subscribers and to retain subscribers; |
| ● | our ability to manage our affiliate marketers’ compliance with internal brand standards or state and federal marketing laws and regulations; |
| ● | our reliance in internal systems to maintain and control marketing expenditures and corresponding return on investments; |
| ● | the effect of an interruption or failure of our data center, programming code, servers or technological infrastructure; |
| ● | the effect of security breaches, computer viruses and computer hacking attacks; |
| ● | our ability to comply with laws and regulations regarding privacy and protection of user data; |
| ● | our reliance upon credit card processors and related merchant account approvals; |
| ● | governmental regulation or taxation of the online dating or the Internet industries; |
| ● | the impact of any claim that we have infringed on intellectual property rights of others; |
| ● | our ability to protect our intellectual property rights; |
| ● | the risk that we might be deemed a “dating service” or an “Internet dating service” under various state regulations; |
| ● | the possibility that our users or third parties may be physically or emotionally harmed following interaction with other users; |
| ● | our ability to manage or mitigate adverse changes in foreign currency exchange rates relating to international bookings; |
| ● | our ability to obtain additional capital or financing to execute our business plan; and |
| ● | our ability to repay indebtedness or maintain minimum cash balances required by our agreements governing our indebtedness. |
| For a more detailed discussion of these and other factors that may affect our business, see the discussion in “Management’s Discussion and Analysis of Financial Condition and Results of Operations” in this report. We caution that the foregoing list of factors is not exclusive, and new factors may emerge, or changes to the foregoing factors may occur, that could impact our business. We do not undertake any obligation to update any forward-looking statement, whether written or oral, relating to the matters discussed in this report, except to the extent required by applicable securities laws. |
PART I - FINANCIAL INFORMATION
ITEM 1. FINANCIAL STATEMENTS
SNAP INTERACTIVE, INC.
CONDENSED CONSOLIDATED BALANCE SHEETS
September 30, 2015 | December 31, 2014 | |||||||
| (Unaudited) | ||||||||
| Assets | ||||||||
| Current assets: | ||||||||
| Cash and cash equivalents | $ | 2,151,058 | $ | 1,138,385 | ||||
| Credit card holdback receivable | 203,240 | 648,759 | ||||||
| Accounts receivable, net of allowances and reserves of $60,330 and $42,533, respectively | 225,426 | 221,128 | ||||||
| Short term security deposits | - | 115,104 | ||||||
| Prepaid expense and other current assets | 142,769 | 93,542 | ||||||
| Total current assets | 2,722,493 | 2,216,918 | ||||||
| Fixed assets and intangible assets, net | 390,122 | 563,123 | ||||||
| Notes receivable | 80,459 | 78,520 | ||||||
| Long term security deposits | 335,659 | 135,000 | ||||||
| Investments | 200,000 | 200,000 | ||||||
| Total assets | $ | 3,728,733 | $ | 3,193,561 | ||||
| Liabilities and stockholders’ equity (deficit) | ||||||||
| Current liabilities: | ||||||||
| Accounts payable | $ | 968,635 | $ | 1,074,345 | ||||
| Accrued expenses and other current liabilities | 394,944 | 1,062,836 | ||||||
| Notes payable | - | 400,000 | ||||||
| Deferred subscription revenue | 1,655,346 | 1,952,075 | ||||||
| Deferred advertising revenue | - | 13,427 | ||||||
| Total current liabilities | 3,018,925 | 4,502,683 | ||||||
| Deferred rent, net of current portion | 92,291 | - | ||||||
| Convertible note payable, net of discount | 1,329,803 | - | ||||||
| Derivative liabilities | 833,425 | 23,425 | ||||||
| Capital lease obligations, net of current portion | 94,973 | 149,055 | ||||||
| Total liabilities | 5,369,417 | 4,675,163 | ||||||
| Commitments | ||||||||
| Stockholders' equity (deficit): | ||||||||
| Preferred stock, $0.001 par value, 10,000,000 shares authorized, none issued and outstanding | - | - | ||||||
| Common stock, $0.001 par value, 100,000,000 shares authorized, 50,017,826 and 49,507,826 shares issued, respectively, and 39,692,826 and 39,182,826 shares outstanding, respectively | 39,693 | 39,183 | ||||||
| Additional paid-in capital | 12,637,709 | 11,858,489 | ||||||
| Accumulated deficit | (14,318,086 | ) | (13,379,274 | ) | ||||
| Total stockholders' equity (deficit) | (1,640,684 | ) | (1,481,602 | ) | ||||
| Total liabilities and stockholders' equity (deficit) | $ | 3,728,733 | $ | 3,193,561 | ||||
The accompanying notes are an integral part of these condensed consolidated financial statements.
| 1 |
SNAP INTERACTIVE, INC.
CONDENSED CONSOLIDATED STATEMENTS OF OPERATIONS
(Unaudited)
| Three Months Ended | Nine Months Ended | |||||||||||||||
| September 30, | September 30, | |||||||||||||||
| 2015 | 2014 | 2015 | 2014 | |||||||||||||
| Revenues: | ||||||||||||||||
| Subscription revenue | $ | 2,791,722 | $ | 3,240,317 | $ | 8,996,899 | $ | 9,529,346 | ||||||||
| Advertising revenue | 134,971 | 244,183 | 304,415 | 697,516 | ||||||||||||
| Total revenues | 2,926,693 | 3,484,500 | 9,301,314 | 10,226,862 | ||||||||||||
| Costs and expenses: | ||||||||||||||||
| Programming, hosting and technology expense | 414,199 | 687,162 | 1,418,633 | 2,299,768 | ||||||||||||
| Compensation expense | 661,069 | 820,872 | 2,174,764 | 2,455,134 | ||||||||||||
| Professional fees | 114,271 | 151,806 | 525,632 | 664,837 | ||||||||||||
| Advertising and marketing expense | 990,173 | 1,285,889 | 4,054,340 | 3,875,148 | ||||||||||||
| General and administrative expense | 644,276 | 721,462 | 2,246,391 | 2,374,012 | ||||||||||||
| Total costs and expenses | 2,823,988 | 3,667,191 | 10,419,760 | 11,668,899 | ||||||||||||
| Income (loss) from operations | 102,705 | (182,691 | ) | (1,118,446 | ) | (1,442,037 | ) | |||||||||
| Interest expense, net | (433,351 | ) | (11,433 | ) | (1,100,366 | ) | (15,137 | ) | ||||||||
| Change in fair value of derivative liabilities | 870,000 | (23,425 | ) | 1,280,000 | 46,850 | |||||||||||
| Income (loss) before provision for income taxes | 539,354 | (217,549 | ) | (938,812 | ) | (1,410,324 | ) | |||||||||
| Provision for income taxes | - | - | - | - | ||||||||||||
| Net income (loss) | $ | 539,354 | $ | (217,549 | ) | $ | (938,812 | ) | $ | (1,410,324 | ) | |||||
| Earnings (loss) per share of common stock: | ||||||||||||||||
| Basic and diluted | $ | 0.01 | $ | (0.01 | ) | $ | (0.03 | ) | $ | (0.04 | ) | |||||
| Weighted average number of shares of common stock used in calculating net loss per share of common stock: | ||||||||||||||||
| Basic and diluted | 39,686,087 | 39,152,713 | 39,591,540 | 39,164,603 | ||||||||||||
The accompanying notes are an integral part of these condensed consolidated financial statements.
| 2 |
SNAP INTERACTIVE, INC.
CONDENSED CONSOLIDATED STATEMENT OF CHANGES IN STOCKHOLDERS’ EQUITY (DEFICIT)
(Unaudited)
| Additional | Stockholders’ | |||||||||||||||||||
| Common Stock | Paid-in | Accumulated | Equity | |||||||||||||||||
| Shares | Amount | Capital | Deficit | (Deficit) | ||||||||||||||||
| Balance on December 31, 2014 | 39,182,826 | $ | 39,183 | $ | 11,858,489 | $ | (13,379,274 | ) | $ | (1,481,602 | ) | |||||||||
| Common stock issued in connection with Securities Purchase Agreement | 350,000 | 350 | (350 | ) | - | - | ||||||||||||||
| Common stock issued in connection with Advisory Services Agreement | 150,000 | 150 | 29,850 | - | 30,000 | |||||||||||||||
| Stock-based compensation expense for restricted stock awards and shares issued for consulting services | 10,000 | 10 | 651,201 | - | 651,211 | |||||||||||||||
| Stock-based compensation expense for stock options | - | - | 98,519 | - | 98,519 | |||||||||||||||
| Net loss | - | - | - | (938,812 | ) | (938,812 | ) | |||||||||||||
| Balance on September 30, 2015 | 39,692,826 | $ | 39,693 | $ | 12,637,709 | $ | (14,318,086 | ) | $ | (1,640,684 | ) | |||||||||
The accompanying notes are an integral part of these condensed consolidated financial statements
| 3 |
SNAP INTERACTIVE, INC.
CONDENSED CONSOLIDATED STATEMENTS OF CASH FLOWS
(Unaudited)
Nine Months Ended September 30, | ||||||||
| 2015 | 2014 | |||||||
| Cash flows from operating activities: | ||||||||
| Net loss | $ | (938,812 | ) | $ | (1,410,324 | ) | ||
| Adjustments to reconcile net loss to net cash used in operating activities: | ||||||||
| Depreciation and amortization | 131,583 | 130,141 | ||||||
| Stock-based compensation expense | 749,730 | 789,085 | ||||||
| Loss on disposal of fixed assets | 79,628 | - | ||||||
| Amortization of debt issuance cost | 99,801 | 1,583 | ||||||
| Amortization of debt discount | 665,041 | - | ||||||
| Change in fair value of derivative liabilities | (1,280,000 | ) | (46,850 | ) | ||||
| Changes in operating assets and liabilities: | ||||||||
| Restricted cash | - | 319,847 | ||||||
| Credit card holdback receivable | 445,519 | (514,696 | ) | |||||
| Accounts receivable | (4,298 | ) | 107,730 | |||||
| Security deposits | (85,555 | ) | (115,104 | ) | ||||
| Prepaid expenses and other current assets | (50,017 | ) | (12,367 | ) | ||||
| Accounts payable, accrued expenses and other current liabilities | (770,215 | ) | 13,145 | |||||
| Deferred rent | 81,414 | (28,371 | ) | |||||
| Deferred subscription revenue | (296,729 | ) | 274,318 | |||||
| Deferred advertising revenue | (13,427 | ) | 103,630 | |||||
| Net cash used in operating activities | (1,186,337 | ) | (388,233 | ) | ||||
| Cash flows from investing activities: | ||||||||
| Purchase of property and equipment | (44,210 | ) | (3,731 | ) | ||||
| Proceeds from sale of fixed assets | 6,000 | - | ||||||
| Purchase of non-marketable equity securities | - | (100,000 | ) | |||||
| Repayment (issuance) to employees of note receivable and accrued interest | (1,939 | ) | 92,689 | |||||
| Notes receivable | - | - | ||||||
| Net cash used in investing activities | (40,149 | ) | (11,042 | ) | ||||
| Cash flows from financing activities: | ||||||||
| Payments of capital lease obligations | (46,592 | ) | - | |||||
| Repayment of proceeds from promissory notes | (400,000 | ) | - | |||||
| Payment of financing costs | (314,249 | ) | - | |||||
| Proceeds from issuance of promissory notes | 3,000,000 | 400,000 | ||||||
| Net cash provided by financing activities | 2,239,159 | 400,000 | ||||||
| Net increase in cash and cash equivalents | 1,012,673 | 725 | ||||||
| Balance of cash and cash equivalents at beginning of period | 1,138,385 | 927,352 | ||||||
| Balance of cash and cash equivalents at end of period | $ | 2,151,058 | $ | 928,077 | ||||
| Supplemental disclosure of cash flow information: | ||||||||
| Cash paid in interest and taxes | $ | 226,000 | $ | - | ||||
| Non-cash investing and financing activities: | ||||||||
| Compound embedded derivative under the Note and Securities Purchase Agreement recorded as derivative liabilities (See Note 5) | $ | 1,748,000 | $ | - | ||||
| Warrants issued under the Advisory Services Agreement as additional consideration for the Note and recorded as derivative liabilities (See Note 5) | $ | 342,000 | $ | - | ||||
| Warrants issued for debt issuance costs | $ | - | $ | 4,750 | ||||
| Common stock issued under the Advisory Services Agreement as additional consideration for the Note | $ | 30,000 | $ | - | ||||
The accompanying notes are an integral part of these condensed consolidated financial statements
| 4 |
SNAP INTERACTIVE, INC.
NOTES TO CONDENSED CONSOLIDATED FINANCIAL STATEMENTS
(Unaudited)
1. Organization and Basis of Presentation
The accompanying unaudited condensed consolidated financial statements include Snap Interactive, Inc. and its wholly owned subsidiary, Snap Mobile Limited (collectively, the “Company”). The Company was organized to operate an online dating application and a stand-alone website. The condensed consolidated financial statements included in this report have been prepared in accordance with generally accepted accounting principles in the United States of America (“GAAP”) and the rules and regulations of the Securities and Exchange Commission (the “SEC”) for interim financial information. The Company has not included certain information normally included in annual financial statements pursuant to those rules and regulations, although it believes that the disclosure included herein is adequate to make the information presented not misleading.
The condensed consolidated financial statements contained herein should be read in conjunction with the Company’s audited consolidated financial statements and the related notes included in the Company’s Annual Report on Form 10-K for the year ended December 31, 2014 (the “Form 10-K”), filed with the SEC on March 5, 2015.
In the opinion of management, the accompanying unaudited condensed consolidated financial information contains all normal and recurring adjustments necessary to fairly present the condensed consolidated financial condition, results of operations, cash flows and changes in the stockholders’ equity (deficit) of the Company for the interim periods presented. The Company’s historical results are not necessarily indicative of future operating results and the results for the three and nine months ended September 30, 2015 are not necessarily indicative of results for the year ending December 31, 2015, or for any other period.
2. Summary of Significant Accounting Policies
During the three and nine months ended September 30, 2015, there were no material changes to the Company’s significant accounting policies from those disclosed in the Form 10-K, except for the following:
Significant Estimates and Judgments
The preparation of financial statements in conformity with GAAP requires management to make estimates and assumptions that affect the reported amounts of assets and liabilities at the date of the financial statements and the reported amounts of revenue and expenses during the reporting period. Significant estimates relied upon in preparing these financial statements include the provision for future credit card chargebacks and subscription revenue refunds, estimates used to determine the fair value of our common stock, stock options, non-cash capital stock issuances, stock-based compensation, derivative instruments, debt discounts, conversion features and common stock warrants, collectability of our accounts receivable and the valuation allowance on deferred tax assets. Management evaluates these estimates on an ongoing basis. Changes in estimates are recorded in the period in which they become known. We base estimates on historical experience and various other assumptions that we believe to be reasonable under the circumstances. Actual results may differ from our estimates.
Convertible Instruments
The Company evaluates and bifurcates conversion features from the instruments containing such features and accounts for them as free standing derivative financial instruments according to certain criteria. The criteria include circumstances in which (a) the economic characteristics and risks of the embedded derivative instrument are not clearly and closely related to the economic characteristics and risks of the underlying instrument, (b) the hybrid instrument that contains both the embedded derivative instrument and the underlying instrument is not re-measured at fair value under otherwise applicable GAAP with changes in fair value reported in earnings as they occur and (c) a separate instrument with the same terms as the embedded derivative instrument would be considered a derivative instrument. An exception to this rule is when the underlying instrument is deemed to be conventional as that term is described under applicable GAAP.
| 5 |
SNAP INTERACTIVE, INC.
NOTES TO CONDENSED CONSOLIDATED FINANCIAL STATEMENTS
(Unaudited)
Common Stock Purchase Warrants and Other Derivative Financial Instruments
The Company classifies common stock purchase warrants and other free standing derivative financial instruments as equity if the contracts (i) require physical settlement or net-share settlement in common stock or (ii) give the Company a choice of net-cash settlement or settlement in common stock (physical settlement or net-share settlement). The Company classifies the following contracts as either an asset or a liability: contracts that (i) require net-cash settlement (including a requirement to net cash settle the contract if an event occurs and if that event is outside the control of the Company), (ii) give the counterparty a choice of net-cash settlement or settlement in common stock (physical settlement or net-share settlement) or (iii) contain reset provisions. The Company assesses classification of its freestanding derivatives at each reporting date to determine whether a change in classification between assets and liabilities is required. The Company determined that certain freestanding derivatives, including the conversion feature embedded in the 12% Senior Secured Convertible Note (the “Note”) and warrants issued under the Securities Purchase Agreement (the “Securities Purchase Agreement”), dated as of February 13, 2015, by and between the Company and Sigma Opportunity Fund II, LLC (“Sigma II”), contained various price and interest rate reset provisions and have been classified as derivative liabilities as more fully described in Note 5.
Recently Issued Accounting Pronouncements
In April 2015, the Financial Accounting Standards Board (“FASB”) issued ASU No. 2015-03 (“ASU 2015-03”), Interest - Imputation of Interest (Subtopic 835-30): Simplifying the Presentation of Debt Issuance Costs. This standard amends the existing guidance to require that debt issuance costs be presented in the balance sheet as a deduction from the carrying amount of the related debt liability instead of as a deferred charge. ASU 2015-03 is effective on a retrospective basis for annual and interim reporting periods beginning after December 15, 2015, but early adoption is permitted. The Company has elected to early-adopt ASU 2015-03 in connection with the issuance of these condensed consolidated financial statements, and, as a result, recorded the $314,249 of offering costs incurred in connection with the issuance of the Note as a debt discount on the date the Note was issued that will be amortized over the term of the Note.
3. Accounts Receivable, Net
Accounts receivable, net consisted of the following as of September 30, 2015 and December 31, 2014:
| September 30, | December 31, | |||||||
| 2015 | 2014 | |||||||
| (Unaudited) | ||||||||
| Accounts receivable | $ | 285,756 | $ | 263,661 | ||||
| Less: reserve for future chargebacks | (60,330 | ) | (42,533 | ) | ||||
| Total accounts receivable, net | $ | 225,426 | $ | 221,128 | ||||
Credit card payments for subscriptions and micro-transactions typically settle several days after the date of purchase. The amount of unsettled transactions due from credit card payment processors was $104,541 as of September 30, 2015, as compared to $135,535 as of December 31, 2014. The amount of accounts receivable due from Apple Inc. was $110,139, or 48.9% of the Company’s accounts receivable, as of September 30, 2015, compared to $116,427, or 52.6% of the Company’s accounts receivable, as of December 31, 2014.
4. Security Deposits
In October 2014, the Company issued a $135,000 security deposit which replaced the previous letter of credit as part of the new capital lease obligations for equipment with Hewlett Packard Financial Services Company (“HP”). The Company recorded $135,000 under long-term security deposits on its Condensed Consolidated Balance Sheet as of September 30, 2015 and December 31, 2014.
In February 2015, the Company issued $200,659 as a security deposit as part of a new office rent lease (see Note 14). The Company recorded the $200,659 under long-term security deposits on its Condensed Consolidated Balance Sheet as of September 30, 2015.
| 6 |
SNAP INTERACTIVE, INC.
NOTES TO CONDENSED CONSOLIDATED FINANCIAL STATEMENTS
(Unaudited)
5. Fair Value Measurements
The fair value framework under the FASB’s guidance requires the categorization of assets and liabilities into three levels based upon the assumptions used to measure the assets or liabilities. Level 1 provides the most reliable measure of fair value, whereas Level 3, if applicable, would generally require significant management judgment. The three levels for categorizing assets and liabilities under the fair value measurement requirements are as follows:
| ● |
Level 1: Fair value measurement of the asset or liability using observable inputs such as quoted prices in active markets for identical assets or liabilities;
| |
| ● |
Level 2: Fair value measurement of the asset or liability using inputs other than quoted prices that are observable for the applicable asset or liability, either directly or indirectly, such as quoted prices for similar (as opposed to identical) assets or liabilities in active markets and quoted prices for identical or similar assets or liabilities in markets that are not active; and
| |
| ● | Level 3: Fair value measurement of the asset or liability using unobservable inputs that reflect the Company’s own assumptions regarding the applicable asset or liability. |
The following table summarizes the liabilities measured at fair value on a recurring basis as of September 30, 2015:
| Level 1 | Level 2 | Level 3 | Total | |||||||||||||
| LIABILITIES: | ||||||||||||||||
| Warrant liabilities | $ | - | $ | - | $ | 493,425 | $ | 493,425 | ||||||||
| Compound embedded derivative | - | - | 340,000 | 340,000 | ||||||||||||
| Total derivative liabilities | $ | - | $ | - | $ | 833,425 | $ | 833,425 | ||||||||
The following table summarizes the liabilities measured at fair value on a recurring basis as of December 31, 2014:
| Level 1 | Level 2 | Level 3 | Total | |||||||||||||
| LIABILITIES: | ||||||||||||||||
| Warrant liability | $ | - | $ | - | $ | 23,425 | $ | 23,425 | ||||||||
| Total derivative liability | $ | - | $ | - | $ | 23,425 | $ | 23,425 | ||||||||
Level 3 liabilities are valued using unobservable inputs to the valuation methodology that are significant to the measurement of the fair value of the liabilities. For fair value measurements categorized within Level 3 of the fair value hierarchy, the Company’s accounting and finance department, who report to the Chief Financial Officer, determine its valuation policies and procedures. The development and determination of the unobservable inputs for Level 3 fair value measurements and fair value calculations are the responsibility of the Company’s accounting and finance department and are approved by the Chief Financial Officer.
Level 3 Valuation Techniques:
Level 3 financial liabilities consist of the derivative liabilities for which there is no current market for these securities such that the determination of fair value requires significant judgment or estimation. Changes in fair value measurements categorized within Level 3 of the fair value hierarchy are analyzed each period based on changes in estimates or assumptions and recorded as appropriate.
| 7 |
SNAP INTERACTIVE, INC.
NOTES TO CONDENSED CONSOLIDATED FINANCIAL STATEMENTS
(Unaudited)
The Company deems financial instruments which do not have fixed settlement provisions to be derivative instruments. The common stock purchase warrants and the conversion feature embedded in the Note do not have fixed settlement provisions because their exercise prices may be lowered if the Company issues securities at a lower price in the future. In addition, the Company issued warrants to purchase common stock in January 2011 in conjunction with an equity financing. In accordance with Accounting Standards Codification (“ASC”) Topic 480, Distinguishing Liabilities from Equity, the fair value of these warrants is classified as a liability on the Company’s Condensed Consolidated Balance Sheets because, according to the terms of the warrants, a fundamental transaction could give rise to an obligation of the Company to pay cash to its warrant holders. In addition, the Company entered into an Advisory Services Agreement (the “Advisory Agreement”), dated as of February 13, 2015, by and between the Company and Sigma Capital Advisors, LLC (“Sigma”), that contains certain provisions whereby the Company will be required to make certain make-whole cash payments to the holder of the Note payable upon the occurrence of certain future events, as more fully described in Note 10. Such instruments do not have fixed settlement provisions and have also been recorded as derivative liabilities. Corresponding changes in the fair value of the derivative liabilities are recognized in earnings on the Company’s Condensed Consolidated Statements of Operations in each subsequent period.
The Company’s derivative liabilities are carried at fair value and were classified as Level 3 in the fair value hierarchy due to the use of significant unobservable inputs. In order to calculate fair value, the Company uses a custom model developed with the assistance of an independent third-party valuation expert. This model calculates the fair value of the warrant derivative liabilities at each measurement date using a Monte-Carlo style simulation, as the value of certain features of the warrant derivative liabilities would not be captured by the standard Black-Scholes model.
The following table summarizes the values of certain assumptions used by the Company’s custom model to estimate the fair value of the warrant liabilities as of September 30, 2015 and December 31, 2014:
| September 30, | December 31, | |||||||
| 2015 | 2014 | |||||||
| (Unaudited) | ||||||||
| Stock price | $ | 0.10 | $ | 0.20 | ||||
| Weighted average strike price | $ | 0.64 | $ | 2.48 | ||||
| Remaining contractual term (years) | 1.37 | 1.1 | ||||||
| Volatility | 95.0 | % | 125.7 | % | ||||
| Risk-free rate | 0.3 | % | 0.3 | % | ||||
| Dividend yield | 0.0 | % | 0.0 | % | ||||
The following table summarizes the values of certain assumptions used by the Company’s custom model to estimate the fair value of the conversion feature liability as of September 30, 2015:
| September 30, | ||||
| 2015 | ||||
| (Unaudited) | ||||
| Stock price | $ | 0.10 | ||
| Strike price | $ | 0.20 | ||
| Remaining contractual term (years) | 1.37 | |||
| Volatility | 95.0 | % | ||
| Risk-free rate | 0.3 | % | ||
| Dividend yield | 0.0 | % | ||
For the purposes of determining fair value, the Company used “adjusted volatility” in favor of “historical volatility” in its Monte-Carlo style simulation. Historical volatility of the Company was calculated using weekly stock prices over a look back period corresponding to the remaining contractual term of the warrants as of each valuation date. Management considered the lack of marketability of these instruments by incorporating a 10% incremental discount rate through a reduction of the volatility estimate (also known as volatility haircut) to calculate the adjusted volatility as of each valuation date.
| 8 |
SNAP INTERACTIVE, INC.
NOTES TO CONDENSED CONSOLIDATED FINANCIAL STATEMENTS
(Unaudited)
The following table sets forth a summary of the changes in the fair value of our Level 3 financial liabilities that are measured at fair value on a recurring basis:
| Three Months Ended | Nine Months Ended | |||||||||||||||
| September 30, | September 30, | |||||||||||||||
| 2015 | 2014 | 2015 | 2014 | |||||||||||||
| Beginning balance | $ | 1,703,425 | $ | 70,275 | $ | 23,425 | $ | 140,550 | ||||||||
| Fair value of derivatives issued | - | - | 2,090,000 | - | ||||||||||||
| Change in fair value of derivative liabilities | (870,000 | ) | 23,425 | (1,280,000 | ) | (46,850 | ) | |||||||||
| Ending balance | $ | 833,425 | $ | 93,700 | $ | 833,425 | $ | 93,700 | ||||||||
6. Fixed Assets and Intangible Assets, Net
Fixed assets and intangible assets, net consisted of the following on September 30, 2015 and December 31, 2014:
| September 30, | December 31, | |||||||
| 2015 | 2014 | |||||||
| (Unaudited) | ||||||||
| Computer equipment | $ | 241,369 | $ | 256,610 | ||||
| Furniture and fixtures | 98,160 | 142,856 | ||||||
| Leasehold improvements | 21,026 | 382,376 | ||||||
| Software | 10,968 | 10,968 | ||||||
| Website domain name | 124,938 | 124,938 | ||||||
| Website costs | 40,500 | 40,500 | ||||||
| Equipment under capital leases | 218,605 | 218,605 | ||||||
| Total fixed assets | 755,566 | 1,176,853 | ||||||
| Less: Accumulated depreciation and amortization | (365,444 | ) | (613,730 | ) | ||||
| Total fixed assets and intangible assets, net | $ | 390,122 | $ | 563,123 | ||||
Depreciation and amortization expense for the three and nine months ended September 30, 2015 was $35,576 and $131,583, respectively, as compared to $43,268 and $130,141 for the three and nine months ended September 30, 2014, respectively. The Company only holds fixed assets in the United States.
As of September 30, 2015, the Company held equipment under capital leases in the amount of $218,605. Amortization expense for the capital leases for the three and nine months ended September 30, 2015 was $17,359 and $54,651, respectively.
During March 2015, the Company disposed of fixed assets, primarily consisting of leasehold improvements and furniture and fixtures, in connection with the relocation of the Company’s corporate headquarters. The net loss on the disposal of the fixed assets for the nine months ended September 30, 2015 was $79,628.
7. Notes Receivable
On September 30, 2015, the Company had notes receivable due in the aggregate amount of $80,459 from two former employees. The employees issued the notes to the Company since the Company paid taxes for stock-based compensation on these employees’ behalf in 2011 and 2012. The outstanding amounts under the notes are secured by pledged stock certificates and are due at various times during 2021-2023. Interest accrues on these notes at rates ranging from 2.80% to 3.57% per annum.
8. Income Taxes
The Company had no income tax benefit or provision for the nine months ended September 30, 2015 and 2014. Since the Company incurred a net loss for the nine months ended September 30, 2015 and 2014, there was no income tax expense for either period. Increases in deferred tax balances have been offset by a valuation allowance and have no impact on the Company’s deferred income tax provision.
| 9 |
SNAP INTERACTIVE, INC.
NOTES TO CONDENSED CONSOLIDATED FINANCIAL STATEMENTS
(Unaudited)
In calculating the provision for income taxes on an interim basis, the Company estimates the annual effective income tax rate based upon the facts and circumstances known for the period and applies that rate to the earnings or losses for the most recent interim period. The Company’s effective income tax rate is based on expected income and statutory tax rates and takes into consideration permanent differences between financial statement income and tax return income applicable to the Company in the various jurisdictions in which the Company operates. The effect of a discrete item, such as changes in estimates, changes in enacted tax laws or rates or tax status, and unusual or infrequently occurring events, is recognized in the interim period in which the discrete item occurs. The accounting estimates used to compute the provision for income taxes may change as new events occur, additional information is obtained or as the result of new judicial interpretations or changes in tax laws or regulations.
9. Accrued Expenses and Other Current Liabilities
Accrued expenses and other current liabilities consisted of the following on September 30, 2015 and December 31, 2014:
| September 30, | December 31, | |||||||
| 2015 | 2014 | |||||||
| (Unaudited) | ||||||||
| Compensation and benefits | $ | 208,875 | $ | 360,515 | ||||
| Deferred rent | - | 10,877 | ||||||
| Professional fees | 102,404 | 254,807 | ||||||
| Repayment of advertising agreement advance | - | 329,165 | ||||||
| Other accrued expenses | 83,665 | 107,472 | ||||||
| Total accrued expenses and other current liabilities | $ | 394,944 | $ | 1,062,836 | ||||
10. Notes and Convertible Note Payable
Notes Payable
On April 24, 2014, the Company issued a promissory note in the amount of $300,000 to a related party, Clifford Lerner, President of The Grade and the Chairman of the Company’s Board of Directors. The promissory note was originally due and payable on January 24, 2015, but was subsequently amended to extend its maturity for an additional nine months and was due and payable on October 24, 2015 and bore interest at the rate of nine percent (9%) per annum. On March 25, 2015, the promissory note was repaid in full.
On May 20, 2014, the Company issued a promissory note in the amount of $100,000 and a warrant to purchase 25,000 shares of its common stock to Thomas Carrella. The promissory note was due and payable on February 20, 2015 and bore interest at the rate of fifteen percent (15%) per annum. The Company calculated the fair value of the warrant using Black-Scholes option pricing model and recorded $4,750 of deferred financing costs related to the issuance of the warrant that were amortized over the term of the promissory note. On February 20, 2015, the promissory note was repaid in full.
Securities Purchase Agreement
On February 13, 2015, pursuant to the Securities Purchase Agreement, the Company closed a private placement of debt and equity securities for aggregate gross proceeds of $3,000,000. In connection with the Securities Purchase Agreement, the Company issued Sigma II (i) 350,000 shares of the Company’s common stock, (ii) the Note in the aggregate principal amount of $3,000,000 and (iii) a warrant to purchase up to 10,500,000 shares of the Company’s common stock. The Company incurred financing costs of $314,249 in connection with the Securities Purchase Agreement that will be amortized over the term of the Note. Amortization for the deferred financing cost was $39,604 and $99,801 for the three and nine months ended September 30, 2015, respectively.
| 10 |
SNAP INTERACTIVE, INC.
NOTES TO CONDENSED CONSOLIDATED FINANCIAL STATEMENTS
(Unaudited)
The Note bears interest at a rate of 12% per annum and matures on the earlier of February 13, 2017 or a change in control. During any time while the Note is outstanding, the outstanding principal balance of the Note, together with all accrued and unpaid interest, is convertible into shares of the Company’s common stock at the option of Sigma II at a conversion price of $0.20 per share, subject to certain adjustments, including reset adjustments to the conversion price if the Company issues securities at lower prices in the future, as disclosed in Note 5. The Company’s obligations under the Note are secured by a first priority lien on all of its assets and property. The Note is also secured by up to 65% of the outstanding capital stock and other equity interests of Snap Mobile Limited, the Company’s wholly owned subsidiary. Snap Mobile Limited is also a guarantor of the Note. An event of default under the Note includes, among other things, (i) the Company’s failure to pay any amounts due and payable when and as required, (ii) failure of a representation or warranty made by the Company to be correct and accurate when made, (iii) the institution of bankruptcy or similar proceedings against the Company and (iv) the Company’s inability to pay debts as they become due. The Note also requires the Company to maintain an aggregate cash balance of $1,350,000 in its bank accounts or it will be required to make partial prepayments on the Note. If the Company fails to maintain this aggregate cash balance in its bank accounts for a thirty day period, it is required to make a $125,000 prepayment on the Note. For each subsequent calendar month that the aggregate cash balance in the Company’s bank accounts does not equal or exceed $1,500,000, the Company must make an additional $125,000 prepayment on the Note.
The Note contains a compound embedded derivative consisting of an embedded conversion feature and interest make-whole provisions and was accounted for as a derivative liability with an aggregate fair value of $950,000. In addition, the fair value of the warrants was $798,000 and was also required to be accounted for as a derivative liability. Both instruments were also recorded as debt discounts on the date the Note was issued. The Company is amortizing the debt discount using the effective interest method over the life of the Note, which is two years. Contractual interest expense under the Note incurred for the three and nine months ended September 30, 2015 was $90,000 and $226,000, respectively.
Simultaneously with the closing of the private placement, the Company entered into the Advisory Agreement with Sigma pursuant to which Sigma agreed to provide the Company with certain advisory and consulting services. In connection with the Advisory Agreement, the Company issued Sigma 150,000 shares of the Company’s common stock and a warrant to purchase up to 4,500,000 shares of the Company’s common stock. Both the shares of common stock and the warrant issued were fully vested and non-forfeitable on the date that the Advisory Agreement was entered into. Based on the terms of the Advisory Agreement and the criteria outlined in ASC 505-50, Equity-Based Payments to Non-Employees, the Company determined that the common stock and warrants issued were additional consideration provided to Sigma in connection with the issuance of the Note. As a result, the Company recorded the grant date fair value of the common stock and warrants of $30,000 and $342,000, respectively, as debt discounts on the accompanying Condensed Consolidated Balance Sheet.
In addition to the issuance of common stock and warrants under the Advisory Agreement, the Company also agreed to pay Sigma a monthly advisory fee of $10,000, up to an aggregate limit of $240,000, subject to certain exceptions, over the life of the Note (the “Cash Payment”). If the Company were to prepay the Note or the repayment of the Note was accelerated for certain reasons, the Company would still be required to remit either a portion or the full amount of the Cash Payment. The Company also agreed to pay Sigma a cash payment of $150,000 if the Company effectuates a dilutive issuance (as defined) while the Note is outstanding (the “Dilutive Cash Payment”). The Company determined that, based on the make-whole features associated with the Cash Payment and the contingent make-whole features associated with the Dilutive Cash Payment, that these payments are required to be treated as derivative instruments in accordance with ASC 815. The fair value of these instruments was included in the value of the compound embedded derivative discussed above.
Amortization expense relating to the aggregate debt discounts for the three and nine months ended September 30, 2015 was $267,178 and $665,041, respectively, which is included as interest expense on the accompanying Condensed Consolidated Statements of Operations.
11. Stock-Based Compensation
The Snap Interactive, Inc. Amended and Restated 2011 Long-Term Incentive Plan (the “Plan”) permits the Company to award stock options (both incentive stock options and non-qualified stock options), stock appreciation rights, restricted stock, restricted stock units, shares of performance stock, dividend equivalent rights, and other stock-based awards and cash-based incentive awards to its employees (including an employee who is also a director or officer under certain circumstances), non-employee directors and consultants. The maximum number of shares of common stock that may be issued pursuant to awards under the Plan is 7,500,000 shares, 100% of which may be issued pursuant to incentive stock options. As of September 30, 2015, there were 3,528,547 shares available for future issuance under the Plan.
| 11 |
SNAP INTERACTIVE, INC.
NOTES TO CONDENSED CONSOLIDATED FINANCIAL STATEMENTS
(Unaudited)
Stock Options
The following table summarizes the assumptions used in the Black-Scholes pricing model to estimate the fair value of the options granted during the nine months ended September 30, 2015:
| Nine Months Ended September 30, 2015 | ||||
| Expected volatility | 179.7 | % | ||
| Expected life of option | 6.0 | |||
| Risk free interest rate | 1.7 | % | ||
| Expected dividend yield | 0.0 | % | ||
The expected life of the options is the period of time over which employees and non-employees are expected to hold their options prior to exercise. The expected life of options has been determined using the "simplified" method as prescribed by Staff Accounting Bulletin 110, which uses the midpoint between the vesting date and the end of the contractual term. The volatility of the Company’s common stock is calculated using the Company’s historical volatilities beginning at the grant date and going back for a period of time equal to the expected life of the award.
The following table summarizes stock option activity for the nine months ended September 30, 2015:
Number of Options | Weighted Average Exercise Price | |||||||
| Stock Options: | ||||||||
| Outstanding on December 31, 2014 | 3,808,253 | $ | 0.55 | |||||
| Granted | 550,300 | 0.22 | ||||||
| Expired or canceled, during the period | - | - | ||||||
| Forfeited, during the period | (362,100 | ) | 0.28 | |||||
| Outstanding on September 30, 2015 | 3,996,453 | 0.53 | ||||||
| Exercisable on September 30, 2015 | 2,443,398 | $ | 0.68 | |||||
On September 30, 2015, the aggregate intrinsic value of stock options that were outstanding and exercisable was $151 and $0, respectively. On September 30, 2014, the aggregate intrinsic value of stock options that were outstanding and exercisable was $104,300 and $10,000, respectively. The intrinsic value for stock options is calculated based on the exercise price of the underlying awards and the fair value of such awards as of the period-end date. The aggregate fair value for the options granted during the nine months ended September 30, 2015 was $119,184.
Stock-based compensation expense relating to stock options for the three and nine months ended September 30, 2015 was $28,113 and $98,519, respectively, as compared to $52,507 and $128,540 for the three and nine months ended September 30, 2014, respectively. The Company estimates potential forfeitures of stock awards and adjusts recorded stock-based compensation expense accordingly. The estimate of forfeitures is adjusted over the requisite service period to the extent that actual forfeitures differ, or are expected to differ, from such estimates. Changes in estimated forfeitures are recognized through a cumulative catch-up adjustment in the period of change and will also impact the amount of stock-based compensation expense that is recognized in future periods.
On September 30, 2015, there was $370,800 of total unrecognized compensation expense related to stock options, which is expected to be recognized over a weighted average period of 7.37 years.
| 12 |
SNAP INTERACTIVE, INC.
NOTES TO CONDENSED CONSOLIDATED FINANCIAL STATEMENTS
(Unaudited)
Non-employee stock option activity described below is also included in the stock option activity summarized on the previous table. The following table summarizes non-employee stock option activity for the nine months ended September 30, 2015:
Number of Options | Weighted Average Exercise Price | |||||||
| Non-Employee Stock Options: | ||||||||
| Outstanding on December 31, 2014 | 250,000 | $ | 0.81 | |||||
| Granted | 25,000 | 0.20 | ||||||
| Outstanding on September 30, 2015 | 275,000 | 0.75 | ||||||
| Exercisable on September 30, 2015 | 275,000 | $ | 0.75 | |||||
On September 30, 2015, the aggregate intrinsic value of non-employee stock options that were outstanding and exercisable was $0 and $0, respectively, and $250 and $24,500, respectively, on September 30, 2014.
Stock-based compensation expense relating to non-employee stock options for the three and nine months ended September 30, 2015 was $(333) and $4,080, respectively, as compared to $2,174 and $5,379 for the three and nine months ended September 30, 2014, respectively.
The aggregate fair value for the options granted during the nine months ended September 30, 2015 was $1,353.
Restricted Stock Awards
The following table summarizes restricted stock award activity for the nine months ended September 30, 2015:
Number of RSAs | Weighted Average Grant Date Fair Value | |||||||
| Restricted Stock Awards: | ||||||||
| Outstanding on December 31, 2014 | 10,325,000 | $ | 0.56 | |||||
| Vested | - | - | ||||||
| Forfeited, during the period | - | - | ||||||
| Outstanding on September 30, 2015 | 10,325,000 | $ | 0.56 | |||||
On September 30, 2015, there was $2,799,736 of total unrecognized compensation expense related to unvested restricted stock awards, which is expected to be recognized over a weighted average period of 3.74 years.
Stock-based compensation expense relating to restricted stock awards for the three and nine months ended September 30, 2015 was $215,162 and $651,211, respectively, as compared to $241,866 and $660,545 for the three and nine months ended September 30, 2014, respectively.
Non-employee restricted stock award activity described below is also included in total restricted stock award activity summarized on the previous table. The following table summarizes non-employee restricted stock award activity for the nine months ended September 30, 2015:
Number of RSAs | Weighted Average Grant Date Fair Value | |||||||
| Non-Employee Restricted Stock Awards: | ||||||||
| Outstanding on December 31, 2014 | 1,075,000 | $ | 0.42 | |||||
| Vested | - | - | ||||||
| Outstanding on September 30, 2015 | 1,075,000 | $ | 0.42 | |||||
| 13 |
SNAP INTERACTIVE, INC.
NOTES TO CONDENSED CONSOLIDATED FINANCIAL STATEMENTS
(Unaudited)
On September 30, 2015, there was $93,498 of total unrecognized stock-based compensation expense related to non-employee unvested restricted stock awards, which is expected to be recognized over a weighted average period of 6.61 years.
Stock-based compensation expense relating to non-employee restricted stock awards for the three and nine months ended September 30, 2015 was $(18,004) and $(40,682), respectively, as compared to $8,700 and $14,065 for the three and nine months ended September 30, 2014, respectively.
12. Common Stock Warrants
Warrant Liability
In January 2011, the Company completed an equity financing that raised gross proceeds of $8,500,000 from the issuance of 4,250,000 shares of common stock at a price of $2.00 per share and warrants to purchase an aggregate of 2,125,000 shares of common stock. The warrants are exercisable any time on or before January 19, 2016 and have an exercise price of $2.50 per share. The Company received $7,915,700 in net proceeds from the equity financing after deducting offering expenses of $584,300. The exercise price of the warrants and number of shares of common stock to be received upon the exercise of the warrants are subject to adjustment for reverse and forward stock splits, stock dividends, stock combinations and other similar transactions.
The Company also issued warrants to purchase an aggregate of 255,000 shares of its common stock to the Company’s placement agent and advisors in January 2011 in connection with the equity financing as consideration for their services. These warrants have the same terms, including exercise price, registration rights and expiration, as the warrants issued to the investors in the equity financing.
The Company has recorded a derivative liability on its Condensed Consolidated Balance Sheet at the end of each reporting period based on the estimated fair value of the warrants. The warrants are valued at the end of each reporting period with changes recorded as marked-to-market adjustment on derivative liability on the Company’s Condensed Consolidated Statements of Operations. The fair value of these warrants was $23,425 on September 30, 2015 and December 31, 2014, based on a model developed with the assistance of an independent third-party valuation expert. The gain (loss) on change in fair value of these warrants was $0 and $(23,425) for the three months ended September 30, 2015 and 2014, respectively, and $0 and $46,850 for the nine months ended September 30, 2015 and 2014, respectively, and was not presented within loss from operations.
On February 13, 2015, the Company issued a warrant to each of Sigma II and Sigma to purchase up to 10,500,000 shares and 4,500,000 shares, respectively, of the Company’s common stock in connection with the issuance of the Note and the execution of the Advisory Agreement as previously disclosed in Note 10. The warrants were immediately exercisable on February 13, 2015 and expire on the earlier of (a) February 13, 2020 or (b) a change in control. The warrants have an exercise price of $0.35 per share, subject to certain adjustments, including reset adjustments to the exercise price if the Company issues securities at lower prices in the future, as disclosed in Note 5.
The Company has recorded a derivative liability on its Condensed Consolidated Balance Sheet at the end of each reporting period based on the estimated fair value of the warrants. The warrants are valued at the end of each reporting period with changes recorded as marked-to-market adjustment on derivative liability on the Company’s Condensed Consolidated Statements of Operations. The fair value of these warrants was $470,000 on September 30, 2015, based on a model developed with the assistance of an independent third-party valuation expert. The gain (loss) on change in fair value of these warrants was $440,000 for the three months ended September 30, 2015 and $470,000 for the nine months ended September 30, 2015, and was not presented within loss from operations.
Warrant Equity
On May 20, 2014, the Company issued a warrant to purchase 25,000 shares of its common stock to Thomas Carrella in connection with the issuance of a promissory note. The warrant has an exercise price equal to $0.32 per share and, if unexercised, expires on May 20, 2019. The Company calculated the fair value of the warrant issued to Mr. Carrella using Black-Scholes option pricing model and recorded $4,750 of deferred financing costs related to the issuance of the warrant that was amortized over the term of the promissory note.
| 14 |
SNAP INTERACTIVE, INC.
NOTES TO CONDENSED CONSOLIDATED FINANCIAL STATEMENTS
(Unaudited)
The following table summarizes warrant activity for the nine months ended September 30, 2015:
Number of Warrants | Weighted Average Exercise Price | |||||||
| Stock Warrants: | ||||||||
| Outstanding on December 31, 2014 | 2,367,500 | $ | 2.48 | |||||
| Granted | 15,000,000 | 0.35 | ||||||
| Exercised | - | - | ||||||
| Forfeited | - | - | ||||||
| Outstanding on September 30, 2015 | 17,367,500 | 0.64 | ||||||
| Warrants exercisable on September 30, 2015 | 17,367,500 | $ | 0.64 | |||||
13. Earnings (Loss) Per Share of Common Stock
Basic earnings (loss) per share of common stock is computed based upon the number of weighted average shares of common stock outstanding as defined by ASC Topic 260, Earnings Per Share. Diluted earnings (loss) per share of common stock includes the dilutive effects of stock options, warrants and stock equivalents. To the extent stock options, stock equivalents, shares underlying the Note and warrants are antidilutive, they are excluded from the calculation of diluted net loss per share of common stock. For the three and nine months ended September 30, 2015, 46,688,953 shares issuable upon the conversion of the Note payable, the exercise of stock options and warrants, and unvested restricted stock awards were not included in the computation of diluted earnings (loss) per share because their inclusion would be antidilutive. For the three and nine months ended September 30, 2014, 16,863,528 shares issuable upon the exercise of stock options and warrants were not included in the computation of diluted earnings (loss) per share because their inclusion would have been antidilutive.
The following table provides a reconciliation of the numerator and denominator used in computing basic and diluted earnings (loss) per share of common stock:
| Three Months Ended | Nine Months Ended | |||||||||||||||
| September 30, | September 30, | |||||||||||||||
| 2015 | 2014 | 2015 | 2014 | |||||||||||||
| Numerator: | ||||||||||||||||
| Net income (loss) | $ | 539,354 | $ | (217,549 | ) | $ | (938,812 | ) | $ | (1,410,324 | ) | |||||
| Denominator: | ||||||||||||||||
| Basic shares: | ||||||||||||||||
| Weighted-average number of shares of common stock outstanding | 39,686,087 | 39,152,713 | 39,591,540 | 39,164,603 | ||||||||||||
| Diluted shares: | ||||||||||||||||
| Weighted-average number of shares used to compute basic net loss per share of common stock | 39,686,087 | 39,152,713 | 39,591,540 | 39,164,603 | ||||||||||||
| Weighted-average number of shares used to compute diluted net loss per share of common stock | 39,686,087 | 39,152,713 | 39,591,540 | 39,164,603 | ||||||||||||
| Earnings (loss) per share of common stock: | ||||||||||||||||
| Basic | $ | 0.01 | $ | (0.01 | ) | $ | (0.03 | ) | $ | (0.04 | ) | |||||
| Diluted | $ | 0.01 | $ | (0.01 | ) | $ | (0.03 | ) | $ | (0.04 | ) | |||||
| 15 |
SNAP INTERACTIVE, INC.
NOTES TO CONDENSED CONSOLIDATED FINANCIAL STATEMENTS
(Unaudited)
14. Commitments
Operating Lease Agreements
During 2013, the Company entered into a two-year service agreement with Equinix Operating Co., Inc. (“Equinix”) whereby Equinix agreed to provide certain products and services to the Company from January 2013 to January 2015. Pursuant to the service agreement, the Company agreed to pay monthly recurring fees in the amount of $8,450 and certain nonrecurring fees in the amount of $9,700. The agreement automatically renews for additional twelve month terms unless earlier terminated by either party. Hosting expense under this lease for the three and nine months ended September 30, 2015 was $46,592 and $139,840, respectively, as compared to $44,480 and $132,737 for the three and nine months ended September 30, 2014, respectively. On November 2, 2015, the Company gave 90-days’ notice to Equinix to terminate the operating lease agreement.
On February 4, 2015, the Company entered into a lease for office space located at 320 West 37th Street, 13th Floor, New York, NY 10018 and paid a security deposit in the amount of $200,659. The term of the lease runs until March 4, 2022. The Company’s monthly office rent payments under the lease will be approximately $25,000 per month for the first year of the term of the lease, which will escalate on an annual basis each year thereafter. Rent expense under this lease for the three and nine months ended September 30, 2015 was $82,551 and $192,620, respectively.
Capital Lease Agreements
In October 2014, two HP lease agreements were canceled due to price negotiations and we entered into two new three-year lease agreements with HP for equipment and certain financed items. In December 2014, we cancelled our remaining operating lease agreements and entered into two additional three-year capital lease agreements with notes. The Company recognized these leases on its Condensed Consolidated Balance Sheets under capitalized lease obligations. Amortization for equipment under capital leases was $18,217 and $54,651 for the three and nine months ended September 30, 2015, respectively.
Other Agreements
In June 2014, the Company entered into a Membership Acquisition Agreement (the “Acquisition Agreement”) with Zoosk, Inc. (“Zoosk”) whereby it received an upfront payment of $500,000 in two installments in exchange for implementing certain integration features on the Company’s AYI.com website and application that advertise Zoosk during the term of the Acquisition Agreement. The Company was entitled to a payout for each person that registered with Zoosk through the integration features during the term of the Acquisition Agreement. The term of the Acquisition Agreement commenced on August 15, 2014 and ended on November 13, 2014. In 2014, the Company earned $170,835 under the Acquisition Agreement and recorded the remaining amount of $329,165 as an advance repayment under accrued expenses and other current liabilities on its Condensed Consolidated Balance Sheet on December 31, 2014. During the nine months ended September 30, 2015, the Company repaid the advance repayment.
15. Related Party Transactions
On January 31, 2013, the Company entered into a subscription agreement with Darrell Lerner and DCL in connection with his separation from the Company. Pursuant to this agreement, the Company purchased (i) 50,000 shares of DCL’s common stock for an aggregate purchase price of $50,000 in April 2013, (ii) 25,000 shares of DCL’s common stock for an aggregate purchase price of $25,000 in July 2013, (iii) 25,000 shares of DCL’s common stock for an aggregate purchase price of $25,000 in October 2013, (iv) 25,000 shares of DCL’s common stock for an aggregate purchase price of $25,000 in January 2014, (v) 25,000 shares of DCL’s common stock for an aggregate purchase price of $25,000 in April 2014, (vi) 25,000 shares of DCL’s common stock for an aggregate price of $25,000 in July 2014 and (vii) 25,000 shares of DCL’s common stock for an aggregate price of $25,000 in September 2014. These nonmarketable securities have been recorded in “Investments” on the Company’s Condensed Consolidated Balance Sheet measured on a cost basis.
| 16 |
On January 31, 2013, the Company entered into a consulting agreement with Darrell Lerner, pursuant to which Mr. Lerner agreed to serve as a consultant to the Company for a three-year period, beginning on February 1, 2013 (the “Effective Date”). Pursuant to the agreement, Mr. Lerner agreed to assist and advise the Company on legal, financial and other matters for which he has knowledge that pertains to the Company, as the Company reasonably requests. As compensation for his services, the Company agreed to pay Mr. Lerner a monthly fee of $25,000 for the initial two year period of the agreement and a monthly fee of $5,000 for every month thereafter. The monthly payments under the agreement are conditioned upon Mr. Lerner’s compliance with a customary confidentiality covenant covering certain information concerning the Company, a covenant not to compete during the term of the agreement and for a period of one year following the termination of the agreement, a non-disparagement covenant regarding the Company and a non-solicitation covenant for a period of six months immediately following the later of the termination of the agreement or the end of the term of the agreement.
The consulting agreement is for a three-year period; provided, however, that the Company may terminate the agreement at any time without notice and may renew the term of the agreement by providing written notice to Mr. Lerner prior to or at the expiration of the term. If the Company terminates the agreement without “cause” (as defined in the agreement) prior to the three-year anniversary of the Effective Date, the Company has agreed to (i) pay Mr. Lerner the amount of the monthly fees owed to Mr. Lerner for the period from the Effective Date to the two year anniversary of the Effective Date and (ii) take all commercially reasonably actions to cause (A) 325,000 shares of restricted common stock of the Company previously granted to Mr. Lerner, (B) 600,000 shares of restricted common stock of the Company previously granted to Mr. Lerner and (iii) 150,000 shares of restricted common stock of the Company granted to Mr. Lerner pursuant to the agreement, to be vested as of the date of such termination.
On April 24, 2014, the Company issued a promissory note in the amount of $300,000 to a related party, Clifford Lerner, President of The Grade and the Chairman of the Company’s Board of Directors. The promissory note bears interest at the rate of nine percent (9%) per annum. On March 25, 2015, the promissory note was repaid in full.
16. Subsequent Events
Management has evaluated subsequent events or transactions occurring through the date the condensed consolidated financial statements were issued and determined that no events or transactions are required to be disclosed herein.
| 17 |
ITEM 2. MANAGEMENT’S DISCUSSION AND ANALYSIS OF FINANCIAL CONDITION AND RESULTS OF OPERATIONS
This Management’s Discussion and Analysis of Financial Condition and Results of Operations is intended to provide a reader of our financial statements with a narrative from the perspective of our management on our financial condition, results of operations, liquidity, and certain other factors that may affect our future results. The following discussion and analysis should be read in conjunction with: (i) the accompanying unaudited condensed consolidated financial statements and notes thereto for the three and nine months ended September 30, 2015, (ii) the consolidated financial statements and notes thereto for the year ended December 31, 2014 included in our Annual Report on Form 10-K (the “Form 10-K”) filed with the Securities and Exchange Commission (the “SEC”) on March 5, 2015 and (iii) the discussion under the caption “Management’s Discussion and Analysis of Financial Condition and Results of Operations” of our Form 10-K. Aside from certain information as of December 31, 2014, all amounts herein are unaudited. Unless the context otherwise indicates, references to “Snap,” “we,” “our,” “us” and the “Company” refer to Snap Interactive, Inc. and its subsidiary on a consolidated basis.
Forward-Looking Statements
In addition to historical financial information, the following discussion and analysis contains forward-looking statements that involve risks, uncertainties and assumptions. See “Forward-Looking Statements.” Our results and the timing of selected events may differ materially from those anticipated in these forward-looking statements as a result of many factors, including those discussed under “Item 1A. Risk Factors” in the Form 10-K.
Overview
We operate a portfolio of two dating applications, AYI and The Grade, which are available through desktop and mobile platforms. We also intend to expand our portfolio through the development of new applications. Our dating applications and the revenues generated therefrom are supported by a large user database of approximately 30 million users. Our management believes that the scale of our user database presents a competitive advantage in the dating industry and can present growth opportunities to build future dating brands or to commercialize by presenting third party advertising.
AYI
We provide a leading online dating application under the AYI brand that is native on Facebook, iOS and AndroidTM platforms and is also accessible on mobile devices and desktops at AYI.com. We intend to rebrand and relaunch AYI during the first quarter of 2016 with user interface improvements and a new brand identity. As a result, we have recently decreased our marketing investment in AYI to reserve cash for the relaunched service, as well as other growth initiatives.
Our AYI application is available to users and active subscribers. AYI is extremely scalable and requires limited incremental operational cost to add users, active subscribers or new features catering to additional discrete audiences. We believe that the number of active subscribers is directly correlated to our spending on advertising and marketing. For the three months ended September 30, 2015, our spending on advertising and marketing was 26.0% lower than the three months ended June 30, 2015 and 42.6% lower than the three months ended March 31, 2015, which we believe resulted in a decrease in the number of active subscribers, as seen in the chart below:
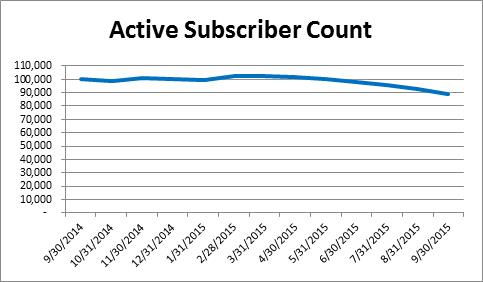
AYI was the #9 grossing application in the U.S. Lifestyle Category on Apple® App StoreSM in the United States as of November 6, 2015. As of November 6, 2015, AYI had approximately 86,100 active subscribers which constituted a 14% decrease in active subscribers since December 31, 2014. New subscription transactions for AYI for the three months ended September 30, 2015 decreased 32% as compared to the same period in 2014.
| 18 |
The Grade
We also provide an online dating application under The Grade brand that is native on iOS and AndroidTM. The Grade is a new mobile application that we launched in November 2014 to pursue our strategy of providing a portfolio of dating and social applications. The Grade is a mobile dating application that holds users accountable to a high standard of behavior by using a proprietary algorithm that assigns letter grades to users ranging from “A+” to “F” based on profile quality, messaging quality and reviews from other users of the application. Users with a grade of “D” receive a warning and instructions on how to improve their grade, while users who fail to improve an “F” grade are at risk of expulsion. By providing user grades and expelling low-quality users who receive an “F” grade, The Grade aims to create a community of high-quality users who are desirable, articulate and responsive.
The Grade is presently building an audience focusing on New York as its core market for user adoption. During this introductory growth phase, the application is offered free to users and there are no immediate plans to monetize The Grade. Since its launch through September 30, 2015, The Grade has achieved cumulative user activity of more than 30.9 million swipes.
Recent Developments
Appointment of Chief Executive Officer and President of The Grade
Effective October 13, 2015, we appointed Alexander Harrington as the Company’s Chief Executive Officer and Clifford Lerner as the Company’s President of The Grade. Mr. Harrington previously served as the Company’s Chief Operating Officer and Chief Financial Officer since March 2014 and will retain the role of Chief Financial Officer in connection with the transition. Mr. Lerner previously served as the Company’s President and Chief Executive Officer since the Company’s founding in 2005. Each of Messrs. Harrington and Lerner will continue to serve as members of our Board of Directors. In connection with Mr. Harrington’s and Mr. Lerner’s appointments, the Company amended its employment agreements with each of Mr. Harrington and Mr. Lerner to update the description of such individual’s positions with, and responsibilities to, the Company.
Strategic Review
In the third quarter of 2015, we initiated a strategic review process to identify ways to unlock shareholder value. As a result, we developed a new company strategy centered around the proactive commercialization of our 30 million user database via the development of a portfolio of products that are cross-sold to our users. In connection with this strategy, we have begun working towards a relaunched version of AYI, which we anticipate launching in the first quarter of 2016, and we are exploring opportunities to expand our portfolio through the development of new applications.
Operational Highlights and Objectives
During the nine months ended September 30, 2015, we executed key components of our objectives:
| ● | appointed an independent director to our Board of Directors; | |
| ● | reactivated 1.2 million users from the AYI database via targeted email campaigns; | |
| ● | reduced operating expenses by $1.2 million compared to the nine months ended September 30, 2014; and | |
| ● | increased user activity on “The Grade,” our new mobile dating application, exceeding a milestone of 30 million swipes. |
For the near term, our business objectives include:
| ● | relaunching AYI under a new brand with user interface enhancements; | |
| ● | building a recognizable brand for The Grade by expanding our user acquisition efforts; | |
| ● | re-engineering AYI mobile apps to share a common technology base in order to reduce maintenance and improvement costs; | |
| ● | continuing to reengage inactive users in AYI’s large user database; and | |
| ● | appointing additional members to our management team and additional independent directors to our Board of Directors. |
Sources of Revenue
AYI operates on a “freemium” model, whereby certain application features are free to all users and other features are only available to paid subscribers. We generate revenue primarily when users purchase a subscription to obtain unlimited messaging and certain other premium features. We also generate a small portion of our revenue through advertisements and micro-transactions that allow users to access other premium features on our AYI application.
| 19 |
Currently, while The Grade is building its user community, it is offered for free to users. We have no immediate plans to introduce a means of generating revenue from The Grade.
Subscription. We provide AYI users with the opportunity to purchase a subscription that provides for unlimited messaging and other premium features for the length of the subscription term. We believe that AYI users choose to become paid subscribers to communicate freely with potential matches and to enhance the online dating experience.
The majority of our revenue is generated from AYI subscriptions originating through the Facebook platform, and a significant amount of our revenue is generated from subscriptions through mobile platforms.
Users can purchase AYI subscriptions through various payment methods including credit card, electronic check, PayPal, Fortumo or as an in-App purchase through Apple Inc.’s App Store. Pursuant to Apple Inc.’s terms of service, Apple Inc. retains 30% of the revenue that is generated from sales through in-App purchases in the United States.
We recognize revenue from monthly AYI premium subscription fees in the month in which the services are provided during the subscription term.
Micro-transactions. We introduced micro-transactions to allow users to increase the visibility of their profile and messages on AYI by paying for such services. In addition, micro-transactions include activation fees for new subscriptions. While micro-transactions are not currently a significant driver of revenue, we believe that such micro-transactions increase user engagement with the application and the likelihood that users will become a paid subscriber. Revenue from micro-transactions is recognized over a two-month period.
Advertising. Our advertising revenue derived from AYI primarily consists of revenue from display ads. We generally reported our advertising revenue net of amounts due to agencies, brokers and counterparties. We recognize advertising revenue as earned on a click-through, impression, registration or subscription basis. When a user clicks an advertisement (CPC basis), views an advertisement impression (CPM basis), registers for an external website via an advertisement clicks on or through our application (CPA basis), or clicks on an offer to subscribe to premium features on our application, the contract amount is recognized as revenue.
We also generate advertising revenue from AYI through advertising agreements with third parties. In June 2014, we entered into a Membership Acquisition Agreement (the “Acquisition Agreement”) with Zoosk, Inc. (“Zoosk”) whereby we received an upfront payment of $500,000 in two installments in exchange for implementing certain integration features on our AYI.com website and application that advertise Zoosk during the term of the Acquisition Agreement. We were entitled to a payout for each person that registered with Zoosk through the integration features during the term of the Acquisition Agreement. The term of the Acquisition Agreement commenced on August 15, 2014 and ended on November 13, 2014. In 2014, we earned $170,835 under the Acquisition Agreement and recorded the remaining amount of $329,165 as advance repayment under accrued expenses and other current liabilities on our Condensed Consolidated Balance Sheet. During the nine months ended September 30, 2015, we repaid the advance repayment.
Costs and Expenses
Programming, hosting and technology. Our programming, hosting and technology expense includes salary and stock-based compensation for our engineers and developers, data center, domain name and other hosting expenses, software licensing fees and various other technology related expenses.
Compensation. Our compensation expense includes salary and stock-based compensation for management and employees (other than expense for engineers and developers recorded in programming, hosting and technology expenses above).
Professional fees. Our professional fees include fees paid to our independent accounting firm, legal expenses and various other professional fees and expenses incurred in our business.
Advertising and marketing. Our advertising and marketing expense consists of online advertising, primarily consisting of user acquisition campaigns. We execute these campaigns through direct media buys, affiliates or affiliate networks that advertise or promote our application and earn a fee whenever visitors click through their advertisement to our application or website and create a profile on our application. For our user acquisition campaigns, we pay to market and advertise our applications across the Internet and mobile devices, including on Facebook and other third party platforms.
General and administrative. Our general and administrative expense includes investor relations, public relations, credit card processing fees, overhead and various other employee related expenses.
| 20 |
Non-Operating Expenses
Change in fair value of derivative securities. The conversion feature in our outstanding 12% Senior Secured Convertible Note (the “Note”), our outstanding warrants, and certain interest make-whole instruments are considered derivative instruments that require liability classification and marked-to-market accounting. Our derivative liability is marked-to-market at the end of each reporting period on our Condensed Consolidated Balance Sheets, with the changes in fair value reported in earnings on our Condensed Consolidated Statements of Operations. We have included the marked-to-market adjustment on derivative liability as a non-operating expense as we do not believe that it is indicative of our core operating results.
We use a custom model that, at each measurement date, calculates the fair value of the derivative liability using a Monte-Carlo style simulation that uses the following assumptions at each valuation date: (i) closing common stock price, (ii) contractual exercise price, (iii) remaining contractual term, (iv) historical volatility of the common stock price, (v) an adjusted volatility that incorporates a 10% incremental discount rate premium (a reduction of the volatility estimate) to reflect the lack of marketability of the conversion feature in the Note and our outstanding warrants, (vi) risk-free interest rates that are commensurate with the term of the conversion feature in the Note and our outstanding warrants and (vii) management assessment of the probability of a change of control at various price points.
An increase or decrease in the fair value of the derivative liability will decrease or increase the amount of our earnings, respectively, separate from income or loss from operations. The primary cause of the change in the fair value of the derivative liability is the value of our common stock. If our common stock price goes up, the value of these derivatives will generally increase and if our common stock price goes down, the value of these derivatives will generally decrease.
Key Metrics
Our management relies on certain performance indicators to manage and evaluate our business. The key performance indicators set forth below help us evaluate growth trends, establish budgets, measure the effectiveness of our advertising and marketing efforts and assess operational efficiencies. We also discuss net cash used in operating activities under the ‟Results of Operations” and ‟Liquidity and Capital Resources” sections below. Active subscribers, bookings and Adjusted EBITDA are discussed below.
| Three Months Ended | Nine Months Ended | |||||||||||||||
| September 30, | September 30, | |||||||||||||||
| 2015 | 2014 | 2015 | 2014 | |||||||||||||
| Active subscribers (at period end) | 89,000 | 100,700 | 89,000 | 100,700 | ||||||||||||
| Bookings | $ | 2,624,196 | $ | 3,382,639 | $ | 8,700,170 | $ | 9,803,664 | ||||||||
| Net cash provided by (used in) operating activities | $ | 260,306 | $ | 377,461 | $ | (1,186,337 | ) | $ | (388,233 | ) | ||||||
| Net income (loss) | $ | 539,354 | $ | (217,549 | ) | $ | (938,812 | ) | $ | (1,410,324 | ) | |||||
| Adjusted EBITDA | $ | 381,556 | $ | 154,950 | $ | (157,505 | ) | $ | (522,811 | ) | ||||||
| Adjusted EBITDA as percentage of total revenues | 13.0 | % | 4.4 | % | (1.7 | )% | (5.1 | )% | ||||||||
Active Subscribers
We believe that the number of active subscribers is a key operating metric to assess the potential of the recurring revenue stream of the AYI application. "Active subscribers" means current users that have prepaid a subscription fee for current access to the AYI application and whose subscription period has not yet expired. We plan to increase this metric by building a recognizable brand and increasing user engagement on AYI through the development of a superior feature set.
Bookings
Bookings is a financial measure representing the aggregate dollar value of subscription fees and micro-transactions received during the period but is not a financial measure that is calculated and presented in accordance with generally accepted accounting principles in the United States of America (“GAAP”). We calculate bookings as subscription revenue recognized during the period plus the change in deferred subscription revenue recognized during the period. We record subscription revenue from subscription fees and micro-transactions as deferred subscription revenue and then recognize that revenue ratably over the length of the subscription term. Our management uses bookings internally in analyzing our financial results to assess operational performance and to assess the effectiveness of, and plan future, user acquisition campaigns. We believe that this non-GAAP financial measure is useful in evaluating our business because we believe, as compared to subscription revenue, it is a better indicator of the subscription activity in a given period. We believe that both management and investors benefit from referring to bookings in assessing our performance and when planning, forecasting and analyzing future periods.
| 21 |
While the factors that affect bookings and subscription revenue are generally the same, certain factors may affect subscription revenue more or less than such factors affect bookings in any period. While we believe that bookings is useful in evaluating our business, it should be considered as supplemental in nature and it is not meant to be a substitute for subscription revenue recognized in accordance with GAAP.
The following table presents a reconciliation of subscription revenue to bookings for each of the periods presented:
| Three Months Ended | Nine Months Ended | |||||||||||||||
| September 30, | September 30, | |||||||||||||||
| 2015 | 2014 | 2015 | 2014 | |||||||||||||
| Reconciliation of Subscription Revenue to Bookings | ||||||||||||||||
| Subscription revenue | $ | 2,791,722 | $ | 3,240,317 | $ | 8,996,899 | $ | 9,529,346 | ||||||||
| Change in deferred subscription revenue | (167,526 | ) | 142,322 | (296,729 | ) | 274,318 | ||||||||||
| Bookings | $ | 2,624,196 | $ | 3,382,639 | $ | 8,700,170 | $ | 9,803,664 | ||||||||
Limitations of Bookings
Some limitations of bookings as a financial measure include that:
| ● | bookings does not reflect that we recognize subscription revenue from subscription fees and micro-transactions over the length of the subscription term or a two-month period, respectively; and | |
| ● | other companies, including companies in our industry, may calculate bookings differently or choose not to calculate bookings at all, which reduces its usefulness as a comparative measure. |
Because of these limitations, you should consider bookings along with other financial performance measures, including total revenues, subscription revenue, deferred subscription revenue, net loss and our financial results presented in accordance with GAAP.
Adjusted EBITDA
Adjusted EBITDA is a non-GAAP financial measure. Adjusted EBITDA is defined as net loss adjusted to exclude interest income (expense), net, depreciation and amortization expense, gain (loss) on change in fair value of derivative liabilities, loss on disposal of fixed assets and stock-based compensation expense.
We present Adjusted EBITDA because it is a key measure used by our management and Board of Directors to understand and evaluate our core operating performance and trends, to develop short- and long-term operational plans, and to allocate resources to expand our business. In particular, the exclusion of certain expenses in calculating Adjusted EBITDA can provide a useful measure for period-to-period comparisons of the cash operating income generated by our business. We believe that Adjusted EBITDA is useful to investors and others to understand and evaluate our operating results and it allows for a more meaningful comparison between our performance and that of competitors.
Limitations of Adjusted EBITDA
Our use of Adjusted EBITDA has limitations as an analytical tool, and you should not consider this performance measure in isolation from or as a substitute for analysis of our results as reported under GAAP. Some of these limitations are:
| ● | Adjusted EBITDA does not reflect cash capital expenditures for assets underlying depreciation and amortization expense that may need to be replaced or for new capital expenditures; | |
| ● | Adjusted EBITDA does not reflect our working capital requirements; | |
| ● | Adjusted EBITDA does not consider the potentially dilutive impact of stock-based compensation; | |
| ● | Adjusted EBITDA does not reflect interest expense or interest payments on our outstanding indebtedness; | |
| ● | Adjusted EBITDA does not reflect the change in fair value of warrants; and | |
| ● | other companies, including companies in our industry, may calculate Adjusted EBITDA differently, which reduces its usefulness as a comparative measure. |
| 22 |
Because of these limitations, you should consider Adjusted EBITDA alongside other financial performance measures, including various cash flow metrics, net loss and our other GAAP results. The following unaudited table presents a reconciliation of net loss, the most directly comparable financial measure calculated and presented in accordance with GAAP, to Adjusted EBITDA for each of the periods indicated:
|
Three Months Ended September 30, |
Nine Months Ended September 30, |
|||||||||||||||
| 2015 | 2014 | 2015 | 2014 | |||||||||||||
| Reconciliation of Net income (loss) to Adjusted EBITDA: | ||||||||||||||||
| Net income (loss) | $ | 539,354 | $ | (217,549 | ) | $ | (938,812 | ) | $ | (1,410,324 | ) | |||||
| Interest expense, net | 433,351 | 11,433 | 1,100,366 | 15,137 | ||||||||||||
| Depreciation and amortization expense | 35,576 | 43,268 | 131,583 | 130,141 | ||||||||||||
| Change in fair value of derivative liabilities | (870,000 | ) | 23,425 | (1,280,000 | ) | (46,850 | ) | |||||||||
| Loss on disposal of fixed assets | - | - | 79,628 | - | ||||||||||||
| Stock-based compensation expense | 243,275 | 294,373 | 749,730 | 789,085 | ||||||||||||
| Adjusted EBITDA | $ | 381,556 | $ | 154,950 | $ | (157,505 | ) | $ | (522,811 | ) | ||||||
Results of Operations
The following table sets forth Condensed Consolidated Statements of Operations data for each of the periods indicated as a percentage of total revenues:
| Three Months Ended | Nine Months Ended | |||||||||||||||
| September 30, | September 30, | |||||||||||||||
| 2015 | 2014 | 2015 | 2014 | |||||||||||||
| Revenues | 100.0 | % | 100.0 | % | 100.0 | % | 100.0 | % | ||||||||
| Costs and expenses: | ||||||||||||||||
| Programming, hosting and technology expense | 14.2 | % | 19.7 | % | 15.3 | % | 22.5 | % | ||||||||
| Compensation expense | 22.6 | % | 23.6 | % | 23.4 | % | 24.0 | % | ||||||||
| Professional fees | 3.9 | % | 4.4 | % | 5.7 | % | 6.5 | % | ||||||||
| Advertising and marketing expense | 33.8 | % | 36.9 | % | 43.6 | % | 37.9 | % | ||||||||
| General and administrative expense | 22.0 | % | 20.7 | % | 24.2 | % | 23.2 | % | ||||||||
| Total costs and expenses | 96.5 | % | 105.3 | % | 112.2 | % | 114.1 | % | ||||||||
| Income (loss) from operations | 3.5 | % | (5.2 | )% | (12.0 | )% | (14.1 | )% | ||||||||
| Interest expense, net | (14.8 | )% | (0.3 | )% | (11.8 | )% | (0.1 | )% | ||||||||
| Change in fair value of derivative liabilities | 29.7 | % | (0.7 | )% | 13.8 | % | 0.5 | % | ||||||||
| Income (loss) before provision for income taxes | 18.4 | % | (6.2 | )% | (10.1 | )% | (13.8 | )% | ||||||||
| Provision for income taxes | 0.0 | % | 0.0 | % | 0.0 | % | 0.0 | % | ||||||||
| Net income (loss) | 18.4 | % | (6.2 | )% | (10.1 | )% | (13.8 | )% | ||||||||
Three Months Ended September 30, 2015 Compared to Three Months Ended September 30, 2014
Revenues
Revenues decreased to $2,926,693 for the three months ended September 30, 2015, from $3,484,500 for the three months ended September 30, 2014. The decrease is mainly driven by a decrease in subscription revenue as a result of a decreased number of new transactions and a decrease in active subscribers.
| 23 |
The following table sets forth our subscription revenue, advertising revenue and total revenues for the three months ended September 30, 2015 and the three months ended September 30, 2014, the decrease between those periods, the percentage decrease between those periods, and the percentage of total revenue that each represented for those periods:
| % Revenue | ||||||||||||||||||||||||
| Three Months Ended | Three Months Ended | |||||||||||||||||||||||
| September 30, | % | September 30, | ||||||||||||||||||||||
| 2015 | 2014 | Decrease | Decrease | 2015 | 2014 | |||||||||||||||||||
| Subscription revenue | $ | 2,791,722 | $ | 3,240,317 | $ | (448,595 | ) | (13.8 | )% | 95.4 | % | 93.0 | % | |||||||||||
| Advertising revenue | 134,971 | 244,183 | (109,212 | ) | (44.7 | )% | 4.6 | % | 7.0 | % | ||||||||||||||
| Total revenues | $ | 2,926,693 | $ | 3,484,500 | $ | (557,807 | ) | (16.0 | )% | 100.0 | % | 100.0 | % | |||||||||||
Subscription - Our subscription revenue for the three months ended September 30, 2015 decreased by $448,595, or 13.8%, as compared to the three months ended September 30, 2014. This decrease in subscription revenue for the three months ended September 30, 2015 was primarily due to a decrease in new transaction volume, particularly in new six-month and one-month subscriptions, as we reduced advertising and marketing expense in anticipation of a relaunch of the AYI application. A lesser contributor to the decrease in revenue was lower subscription pricing, driven by periodic promotions and adverse changes in foreign currency exchange rates. Subscription revenue as a percentage of total revenue was 95.4% for the three months ended September 30, 2015, as compared to 93.0% for the three months ended September 30, 2014.
Advertising - Our advertising revenue for the three months ended September 30, 2015 decreased by $109,212, or 44.7%, as compared to the three months ended September 30, 2014. The decrease in advertising revenue primarily resulted from the termination of the Business Development Agreement with Match.com in August 2014. We have recently entered into arrangements with multiple advertising partners which has led to an increase in advertising revenue through the present quarter. Advertising revenue as a percentage of total revenue was 4.6% for the three months ended September 30, 2015, as compared to 7.0% for the three months ended September 30, 2014.
Costs and Expenses
Total costs and expenses for the three months ended September 30, 2015 reflect a decrease in costs and expenses of $843,203, or 23.0%, as compared to the three months ended September 30, 2014. The following table presents our costs and expenses for the three months ended September 30, 2015 and 2014, the increase or decrease between those periods and the percentage increase or decrease between those periods:
| Three Months Ended | ||||||||||||||||
| September 30, | % | |||||||||||||||
| 2015 | 2014 | Decrease | Decrease | |||||||||||||
| Programming, hosting and technology expense | $ | 414,199 | $ | 687,162 | $ | (272,963 | ) | (39.7 | )% | |||||||
| Compensation expense | 661,069 | 820,872 | (159,803 | ) | (19.5 | )% | ||||||||||
| Professional fees | 114,271 | 151,806 | (37,535 | ) | (24.7 | )% | ||||||||||
| Advertising and marketing expense | 990,173 | 1,285,889 | (295,716 | ) | (23.0 | )% | ||||||||||
| General and administrative expense | 644,276 | 721,462 | (77,186 | ) | (10.7 | )% | ||||||||||
| Total costs and expenses | $ | 2,823,988 | $ | 3,667,191 | $ | (843,203 | ) | (23.0 | )% | |||||||
Programming, Hosting and Technology - Our programming, hosting and technology expense for the three months ended September 30, 2015 decreased by $272,963, or 39.7%, as compared to the three months ended September 30, 2014. The decrease in this expense for the three months ended September 30, 2015 was primarily driven by reduced headcount. Programming, hosting and technology expense as a percentage of total revenues was 14.2% for the three months ended September 30, 2015, as compared to 19.7% for the three months ended September 30, 2014.
Compensation - Our compensation expense for the three months ended September 30, 2015, which excludes the cost of developers and programmers included in programming, hosting and technology expense decreased by $159,803, or 19.5%, as compared to the three months ended September 30, 2014. The decrease in compensation expense for the three months ended September 30, 2015 was primarily driven by reduced headcount in management and support areas and lower consulting expenses as compared to the comparable period in 2014. Compensation expense as a percentage of total revenues was 22.6% for the three months ended September 30, 2015, as compared to 23.6% for the three months ended September 30, 2014.
| 24 |
Professional fees - Our professional fees for the three months ended September 30, 2015 decreased by $37,535, or 24.7%, as compared to the three months ended September 30, 2014. The decrease in professional fees for the three months ended September 30, 2015 was primarily due to reduced accounting fees. Professional fees as a percentage of total revenues were 3.9% for the three months ended September 30, 2015, as compared to 4.4% for the three months ended September 30, 2014.
Advertising and Marketing - Our advertising and marketing expense for the three months ended September 30, 2015 decreased by $295,716, or 23.0%, as compared to the three months ended September 30, 2014. The decrease in advertising and marketing expense for the three months ended September 30, 2015, as compared to the prior year period, was primarily driven by a decrease in the number and magnitude of user acquisition campaigns. Advertising and marketing expense as a percentage of total revenues was 33.8% for the three months ended September 30, 2015, as compared to 36.9% for the three months ended September 30, 2014.
General and Administrative - Our general and administrative expense for the three months ended September 30, 2015 decreased by $77,186, or 10.7%, as compared to the three months ended September 30, 2014. The decrease in general and administrative expense for the three months ended September 30, 2015, as compared to the comparable period in the prior year, was primarily driven by lower fixed asset depreciation, decrease in third party server license expense and a decrease in external recruiter fees. General and administrative expense as a percentage of total revenues was 22.0% for the three months ended September 30, 2015, as compared to 20.7% for the three months ended September 30, 2014.
Non-Operating Income (Expense)
The following table presents the components of non-operating income (expense) for the three months ended September 30, 2015 and the three months ended September 30, 2014, the increase or decrease between those periods and the percentage increase or decrease between those periods:
| Three Months Ended | % | |||||||||||||||
| September 30, | Increase | Increase | ||||||||||||||
| 2015 | 2014 | (Decrease) | (Decrease) | |||||||||||||
| Interest expense, net | $ | (433,351 | ) | $ | (11,433 | ) | $ | (421,918 | ) | 3,690.4 | % | |||||
| Gain (loss) on change in fair value of derivative liabilities | 870,000 | (23,425 | ) | 893,425 | N/A | |||||||||||
| Total non-operating income (expense) | $ | 436,649 | $ | (34,858 | ) | $ | 471,507 | N/A | ||||||||
Interest expense, net
Interest expense, net for the three months ended September 30, 2015 was $433,351, a net increase of $421,918, or 3,690.4%, as compared to $11,433 for the three months ended September 30, 2014. The interest expense represents the amortization of debt discount and debt issuance cost relating to the issuance of the Note, along with the contractual interest incurred on the Note. Interest expense, net represented (14.8)% and (0.3)% of total revenues for the three months ended September 30, 2015 and 2014, respectively.
Change in fair value of derivative liabilities
Our derivative liability is marked-to-market in each reporting period, with changes in fair value reported in earnings. The marked-to-market gain of $870,000 for the three months ended September 30, 2015 and $(23,425) for the three months ended September 30, 2014 represented the changes in fair value of the derivative liability during those periods. The gain (loss) on change in fair value of derivative liabilities represented 29.7% and (0.7)% of total revenues for the three months ended September 30, 2015 and 2014, respectively.
| 25 |
Nine Months Ended September 30, 2015 Compared to Nine Months Ended September 30, 2014
Revenues
Revenues decreased to $9,301,314 for the nine months ended September 30, 2015, from $10,226,862 for the nine months ended September 30, 2014. The decrease is mainly driven by a decrease in subscription revenue driven by the overall new transaction volume.
The following table sets forth our subscription revenue, advertising revenue and total revenues for the nine months ended September 30, 2015 and the nine months ended September 30, 2014, the increase or decrease between those periods, the percentage increase or decrease between those periods, and the percentage of total revenue that each represented for those periods:
| % Revenue | ||||||||||||||||||||||||
| Nine Months Ended | Nine Months Ended | |||||||||||||||||||||||
| September 30, | % | September 30, | ||||||||||||||||||||||
| 2015 | 2014 | Decrease | Decrease | 2015 | 2014 | |||||||||||||||||||
| Subscription revenue | $ | 8,996,899 | $ | 9,529,346 | $ | (532,447 | ) | (5.6 | )% | 96.7 | % | 93.2 | % | |||||||||||
| Advertising revenue | 304,415 | 697,516 | (393,101 | ) | (56.4 | )% | 3.3 | % | 6.8 | % | ||||||||||||||
| Total revenues | $ | 9,301,314 | $ | 10,226,862 | $ | (925,548 | ) | (9.1 | )% | 100.0 | % | 100.0 | % | |||||||||||
Subscription – Our subscription revenue for the nine months ended September 30, 2015 decreased by $532,447, or 5.6%, as compared to the nine months ended September 30, 2014. The decrease in subscription revenue for the nine months ended September 30, 2015, was primarily driven by a decrease in new transaction volume, particularly in new six-month subscriptions, and a decrease in new and recurring one-month subscriptions, offset by an increase in recurring six-month subscriptions. In addition, there was a negative impact to the year-over-year revenues resulting from unfavorable foreign exchange rates in recent periods. Subscription revenue as a percentage of total revenue was 96.7% for the nine months ended September 30, 2015, as compared to 93.2% for the nine months ended September 30, 2014.
Advertising – Our advertising revenue for the nine months ended September 30, 2015 decreased by $393,101, or 56.4%, as compared to the nine months ended September 30, 2014. The decrease in advertising revenue resulted from revenue recognized in 2014 under our Business Development Agreement with Match.com, which was terminated in August 2014. We have recently entered into arrangements with multiple advertising partners which has led to an increase in advertising revenue through the present quarter. Advertising revenue as a percentage of total revenue was 3.3% for the nine months ended September 30, 2015, as compared to 6.8% for the nine months ended September 30, 2014.
Costs and Expenses
Total costs and expenses for the nine months ended September 30, 2015 reflect a decrease in costs and expenses of $1,249,139, or 10.7%, as compared to the nine months ended September 30, 2014. The following table presents our costs and expenses for the nine months ended September 30, 2015 and the nine months ended September 30, 2014, the increase or decrease between those periods and the percentage increase or decrease between those periods:
| Nine Months Ended | % | |||||||||||||||
| September 30, | Increase | Increase | ||||||||||||||
| 2015 | 2014 | (Decrease) | (Decrease) | |||||||||||||
| Programming, hosting and technology expense | $ | 1,418,633 | $ | 2,299,768 | $ | (881,135 | ) | (38.3 | )% | |||||||
| Compensation expense | 2,174,764 | 2,455,134 | (280,370 | ) | (11.4 | )% | ||||||||||
| Professional fees | 525,632 | 664,837 | (139,205 | ) | (20.9 | )% | ||||||||||
| Advertising and marketing expense | 4,054,340 | 3,875,148 | 179,192 | 4.6 | % | |||||||||||
| General and administrative expense | 2,246,391 | 2,374,012 | (127,621 | ) | (5.4 | )% | ||||||||||
| Total costs and expenses | $ | 10,419,760 | $ | 11,668,899 | $ | (1,249,139 | ) | (10.7 | )% | |||||||
Programming, Hosting and Technology – Our programming, hosting and technology expense for the nine months ended September 30, 2015 decreased by $881,135 or 38.3%, as compared to the nine months ended September 30, 2014. The decrease in this expense for the nine months ended September 30, 2015, was primarily driven by reduced consulting expense, the capitalization of equipment leased and reduced headcount. Programming, hosting and technology expense as a percentage of total revenues was 15.3% for the nine months ended September 30, 2015, as compared to 22.5% for the nine months ended September 30, 2014.
| 26 |
Compensation – Our compensation expense for the nine months ended September 30, 2015, which excludes the cost of developers and programmers included in programming, hosting and technology expense, decreased by $280,370, or 11.4%, as compared to the nine months ended September 30, 2014. The decrease in compensation expense for the nine months ended September 30, 2015 was primarily driven by reduced headcount in management and support areas and reduced consulting expense as compared to the comparable period in 2014. Compensation expense as a percentage of total revenues was 23.4% and 24.0% for the nine months ended September 30, 2015 and September 30, 2014, respectively.
Professional fees – Our professional fees for the nine months ended September 30, 2015 decreased by $139,205, or 20.9%, as compared to the nine months ended September 30, 2014. The decrease in professional fees for the nine months ended September 30, 2015, was primarily driven by a decrease in legal and accounting fees. Professional fees as a percentage of total revenues were 5.7% for the nine months ended September 30, 2015, as compared to 6.5% for the nine months ended September 30, 2014.
Advertising and Marketing – Our advertising and marketing expense for the nine months ended September 30, 2015 increased by $179,192, or 4.6%, as compared to the nine months ended September 30, 2014. The increase in advertising and marketing expense for the nine months ended September 30, 2015, as compared to the prior year period, was primarily driven by a slight increase in the number and magnitude of user acquisition campaigns. Advertising and marketing expense as a percentage of total revenues was 43.6% for the nine months ended September 30, 2015, as compared to 37.9% for the nine months ended September 30, 2014.
General and Administrative – Our general and administrative expense for the nine months ended September 30, 2015 decreased by $127,621, or 5.4%, as compared to the nine months ended September 30, 2014. The decrease in general and administrative expense for the nine months ended September 30, 2015, as compared to the comparable period in the prior year, was primarily driven by lower investor relations expenses, reduced headcount and a decrease in third party server license expense partially offset by the loss from disposal of fixed assets relating to the relocation of the corporate office. General and administrative expense as a percentage of total revenues was 24.2% for the nine months ended September 30, 2015, as compared to 23.2% for the nine months ended September 30, 2014.
Non-Operating Income
The following table presents the components of non-operating income for the nine months ended September 30, 2015 and the nine months ended September 30, 2014, the decrease between those periods and the percentage decrease between those periods:
| Nine Months Ended | % | |||||||||||||||
| September 30, | Increase | Increase | ||||||||||||||
| 2015 | 2014 | (Decrease) | (Decrease) | |||||||||||||
| Interest expense, net | $ | (1,100,366 | ) | $ | (15,137 | ) | $ | (1,085,229 | ) | 7,169.4 | % | |||||
| Gain on change in fair value of derivative liabilities | 1,280,000 | 46,850 | 1,233,150 | 2,632.1 | % | |||||||||||
| Total non-operating income | $ | 179,634 | $ | 31,713 | $ | 147,921 | 466.4 | % | ||||||||
Interest expense, net
Interest expense, net for the nine months ended September 30, 2015 was $1,100,366, an increase of $1,085,229, or 7,169.4%, as compared to $15,137 for the nine months ended September 30, 2014. The interest expense represents the amortization of debt discount and debt issuance cost relating to the issuance of the Note, along with the contractual interest on the Note. Interest expense, net represented (11.8)% of total revenues for the nine months ended September 30, 2015 as compared to (0.1)% for the nine months ended September 30, 2014.
Change in fair value of derivative liabilities
Our derivative liability is marked-to-market at each reporting period, with changes in fair value reported in earnings. The marked-to-market gain of $1,280,000 for the nine months ended September 30, 2015 and $46,850 for the nine months ended September 30, 2014 represented the changes in fair value of the derivative liability during those periods. The gain on change in fair value of derivative liabilities represented 13.8% and 0.5% of total revenues for the nine months ended September 30, 2015 and 2014, respectively.
| 27 |
Liquidity and Capital Resources
| Nine Months Ended | ||||||||
| September 30, | ||||||||
| 2015 | 2014 | |||||||
| Condensed Consolidated Statements of Cash Flows Data: | ||||||||
| Net cash used in operating activities | $ | (1,186,337 | ) | $ | (388,233 | ) | ||
| Net cash used in investing activities | (40,149 | ) | (11,042 | ) | ||||
| Net cash provided by financing activities | 2,239,159 | 400,000 | ||||||
| Net increase in cash and cash equivalents | $ | 1,012,673 | $ | 725 | ||||
We have historically financed our operations through cash generated from debt and equity offerings, cash provided from operations and promissory notes from investors.
A significant portion of our expenses are related to user acquisition costs. Our advertising and marketing expenses are primarily spent on channels where we can estimate the return on investment without long-term commitments. Accordingly, we can adjust our advertising and marketing expenditures quickly based on the expected return on investment, which provides flexibility and enables us to manage our advertising and marketing expense.
As of September 30, 2015, we had $2,151,058 in cash and cash equivalents, as compared to cash and cash equivalents of $1,138,385 as of December 31, 2014. Historically, our working capital has been generated through operations and equity offerings. If we grow and expand our operations, our need for working capital will increase. We intend to finance our business and growth with cash on hand, cash provided from operations, borrowings, debt or equity offerings, or some combination thereof.
We have also incurred debt as a means of generating liquidity. During the nine months ended September 30, 2015, we repaid in full two promissory notes in the aggregate principal amount of $400,000. As of September 30, 2015, the outstanding principal amount of our debt was $3,000,000, which consisted of the Note, which is discussed in more detail below.
Our ability to continue to meet our obligations and make payments on the Note is dependent upon establishing consistently profitable operations, which may be supplemented by raising additional funds through public or private financings. As of September 30, 2015, we believe that we will likely need to raise additional capital in the future to fund our operations and repay the Note. If we are unable to raise additional capital, we may need to restructure or refinance the Note, and we may not be able to complete such restructuring or refinancing on terms that are acceptable to us or at all.
Sigma II Note
On February 13, 2015, we issued the Note in the aggregate principal amount of $3,000,000 to Sigma Opportunity Fund II, LLC (“Sigma II”) in a private placement. The Note bears interest at a rate of 12% per annum and matures on the earlier of February 13, 2017 or a change in control. During any time while the Note is outstanding, the outstanding principal balance of the Note, together with all accrued and unpaid interest, is convertible into shares of our common stock at the option of Sigma II at a conversion price of $0.20 per share, subject to certain adjustments. The Note requires us to maintain an aggregate cash balance of $1,350,000 million in our bank accounts or we will be required to make partial prepayments on the Note. If we fail to maintain this aggregate cash balance in our bank accounts for a thirty day period, we are required to make a $125,000 prepayment on the Note. For each subsequent calendar month that the aggregate cash balance in our bank accounts does not equal or exceed $1,500,000 million, we must make an additional $125,000 prepayment on the Note. Our obligations under the Note are secured by a first priority lien on all of our assets and property. The Note is secured by up to 65% of the outstanding capital stock and other equity interests of Snap Mobile Limited, our wholly owned subsidiary. Snap Mobile Limited is also a guarantor of the Note. We intend to use the proceeds from the private placement for general corporate purposes, including working capital. Contractual interest expense under the Note incurred for the three and nine months ended September 30, 2015 was $90,000 and $226,000, respectively.
Operating Activities
Net cash used in operating activities was $1,186,337 for the nine months ended September 30, 2015, as compared to net cash used in operating activities of $388,233 for the nine months ended September 30, 2014. This increase in net cash used in operating activities of $798,103 was a result of a decrease in our payables and accrued expenses mainly driven by the one-time repayment of the advance under the Acquisition Agreement with Zoosk, an increase of security deposit expenses in connection with the relocation of our corporate office and a decrease in deferred revenue. Other items impacting our cash flow were significant cash outlays relating to advertising and marketing expenses which were offset in part by collections in subscription revenue received during the period.
Significant items impacting cash flow in the nine months ended September 30, 2014 included significant cash outlays relating to advertising and marketing expense. These uses of cash were offset in part by collections in subscription revenue received during the period.
| 28 |
Investing Activities
Cash used in investing activities for the nine months ended September 30, 2015 and 2014 was $40,149 and $11,042, respectively. Cash used in investing activities included purchases of property and equipment totaling $44,210 and $3,731 during the nine months ended September 30, 2015 and 2014, respectively. These purchases consisted primarily of computers and office furniture. Purchases of property and equipment may vary from period to period due to the timing of the expansion of our operations and software development.
Financing Activities
Cash provided by financing activities for the nine months ended September 30, 2015 and 2014 was $2,239,159 and $400,000, respectively.
The increase relates to the issuance of the Note in the aggregate principal amount of $3,000,000 to Sigma II during the nine months ended September 30, 2015, which was partially offset by the repayment of two promissory notes in the aggregate principal amount of $400,000 and payments for our capital lease obligations.
Off-Balance Sheet Arrangements
As of September 30, 2015, we did not have any off-balance sheet arrangements.
Contractual Obligations and Commitments
On February 4, 2015, the Company entered into a lease for office space located at 320 West 37th Street, 13th Floor, New York, NY 10018 and paid a security deposit in the amount of $200,659. The term of the lease runs until March 4, 2022. The Company’s monthly office rent payments under the lease will be approximately $25,000 per month for the first year of the term of the lease, which will escalate on an annual basis each year thereafter.
Critical Accounting Policies and Estimates
The discussion and analysis of our financial condition and results of operations are based upon our condensed consolidated financial statements that have been prepared in accordance with GAAP. The preparation of these financial statements requires us to make estimates and assumptions that affect the reported amounts of assets and liabilities at the date of the financial statements and the reported amounts of revenue and expenses during the reporting period. Significant estimates relied upon in preparing these financial statements include the provision for future credit card chargebacks and refunds on subscription revenue, estimates used to determine the fair value of our common stock, stock options, non-cash capital stock issuances, stock-based compensation and common stock warrants, collectability of our accounts receivable and the valuation allowance on deferred tax assets. Management evaluates these estimates on an ongoing basis. Changes in estimates are recorded in the period in which they become known. We base estimates on historical experience and various other assumptions that we believe to be reasonable under the circumstances. Actual results may differ from our estimates.
During the nine months ended September 30, 2015, there were no material changes to our significant accounting policies from those contained in the Form 10-K, except for the following:
| 29 |
Significant Estimates and Judgments
The preparation of financial statements in conformity with GAAP requires management to make estimates and assumptions that affect the reported amounts of assets and liabilities and at the date of the financial statements and the reported amounts of revenue and expenses during the reporting period. Significant estimates relied upon in preparing these financial statements include the provision for future credit card chargebacks and refunds on subscription revenue, estimates used to determine the fair value of our common stock, stock options, non-cash capital stock issuances, stock-based compensation, derivative instruments, debt discounts, conversion features and common stock warrants, collectability of our accounts receivable and the valuation allowance on deferred tax assets. Management evaluates these estimates on an ongoing basis. Changes in estimates are recorded in the period in which they become known. We base estimates on historical experience and various other assumptions that we believe to be reasonable under the circumstances. Actual results may differ from our estimates.
Convertible Instruments
The Company evaluates and bifurcates conversion options from their host instruments and accounts for them as free standing derivative financial instruments according to certain criteria. The criteria include circumstances in which (a) the economic characteristics and risks of the embedded derivative instrument are not clearly and closely related to the economic characteristics and risks of the host contract, (b) the hybrid instrument that embodies both the embedded derivative instrument and the host contract is not re-measured at fair value under otherwise applicable GAAP with changes in fair value reported in earnings as they occur and (c) a separate instrument with the same terms as the embedded derivative instrument would be considered a derivative instrument. An exception to this rule is when the host instrument is deemed to be conventional as that term is described under applicable GAAP.
Common Stock Purchase Warrants and Other Derivative Financial Instruments
We classify common stock purchase warrants and other free standing derivative financial instruments as equity if the contracts (i) require physical settlement or net-share settlement or (ii) give us a choice of net-cash settlement or settlement shares of our common stock (physical settlement or net-share settlement). We classify the following contracts as either an asset or a liability: contracts that (i) require net-cash settlement (including a requirement to net cash settle the contract if an event occurs and if that event is outside our control, (ii) give the counterparty a choice of net-cash settlement or settlement in shares of our common stock (physical settlement or net-share settlement) or (iii) contain reset provisions. We assess classification of our freestanding derivatives at each reporting date to determine whether a change in classification between assets and liabilities is required. We determined that certain freestanding derivatives, including the embedded conversion feature and warrants issued in connection with the private placement completed in February of 2015 (See Note 10 in the Notes to the Condensed Consolidated Financial Statements) contained reset provisions and have been classified as derivative liabilities as more fully described in Note 5 to the Condensed Consolidated Financial Statements.
Recently Adopted Accounting Pronouncements
In April 2015, the Financial Accounting Standards Board (“FASB”) issued ASU No. 2015-03 (“ASU 2015-03”), Interest - Imputation of Interest (Subtopic 835-30): Simplifying the Presentation of Debt Issuance Costs. This standard amends the existing guidance to require that debt issuance costs be presented in the balance sheet as a deduction from the carrying amount of the related debt liability instead of as a deferred charge. ASU 2015-03 is effective on a retrospective basis for annual and interim reporting periods beginning after December 15, 2015, but early adoption is permitted. We have elected to early-adopt ASU 2015-03 in connection with the issuance of the condensed consolidated financial statements included elsewhere in this Quarterly Report on Form 10-Q, and, as a result, recorded the $314,249 of offering costs incurred in connection with the issuance of the Note as a debt discount on the date the Note was issued that will be amortized over the term of the Note.
ITEM 3. QUANTITATIVE AND QUALITATIVE DISCLOSURES ABOUT MARKET RISK
Not applicable.
ITEM 4. CONTROLS AND PROCEDURES
Evaluation of Disclosure Controls and Procedures
Our management, including our chief executive officer and chief financial officer, evaluated the effectiveness of our disclosure controls and procedures (as defined in Rules 13a-15(e) or 15d-15(e) under the Exchange Act) as of the end of the period covered by this report. There are inherent limitations to the effectiveness of any system of disclosure controls and procedures. In designing and evaluating the disclosure controls and procedures, management recognized that any controls and procedures, no matter how well designed and operated, can provide only reasonable assurance of achieving the desired control objectives.
Based on the evaluation as of September 30, 2015, for the reasons set forth below, our chief executive officer and chief financial officer concluded that our disclosure controls and procedures were not effective to provide reasonable assurance that information we are required to disclose in reports that we file or submit under the Exchange Act is recorded, processed, summarized and reported within the time periods specified in the SEC’s rules and forms, and that such information is accumulated and communicated to our management, including our chief executive officer and chief financial officer, as appropriate, to allow timely decisions regarding required disclosure.
| 30 |
A material weakness is a deficiency, or a combination of deficiencies, in internal control over financial reporting, such that there is a reasonable possibility that a material misstatement of the Company's annual or interim financial statements will not be prevented or detected on a timely basis. In its assessment of the effectiveness of internal control our financial reporting as of September 30, 2015, the Company determined that the following item constituted a material weakness:
| ● | the Company did not have an independent audit committee in place, which would provide oversight of the Company’s officers, operations and financial reporting function. |
Changes in Internal Control over Financial Reporting
There have been no changes in our internal control over financial reporting (as defined in Rules 13a-15(f) or 15d-15(f) under the Exchange Act) during the period covered by this report that have materially affected, or are reasonably likely to materially affect, our internal control over financial reporting.
| 31 |
PART II: OTHER INFORMATION
ITEM 1. LEGAL PROCEEDINGS
To our knowledge, there are no material pending legal proceedings to which we are a party or of which any of our property is the subject.
ITEM 1A. RISK FACTORS
There were no material changes to the Risk Factors disclosed in “Item 1A. Risk Factors” in the Form 10-K, as updated by the Risk Factors disclosed in “Item 1A. Risk Factors” of our Quarterly Report on Form 10-Q for the quarter ended June 30, 2015, filed with the SEC on August 13, 2015.
ITEM 2. UNREGISTERED SALES OF EQUITY SECURITIES AND USE OF PROCEEDS
On September 15, 2015, we issued 10,000 shares of our common stock to KCSA Strategic Communications as consideration for investor relations services. The issuance of the shares was exempt from the registration requirements of the Securities Act pursuant to Section 4(a)(2) thereof and Rule 506(b) of Regulation D promulgated thereunder as a transaction not involving a public offering.
On October 13, 2015, we awarded Alexander Harrington a stock option representing the right to purchase 1,000,000 shares of our common stock at an exercise price of $0.08 per share in exchange for Mr. Harrington agreeing to cancel a stock option representing the right to purchase 1,000,000 shares of common stock at an exercise price of $0.29 per share. The shares of common stock underlying the replacement stock option vested 20% on the date of grant and will vest 20% on each of February 28, 2016, February 28, 2017, February 28, 2018 and February 28, 2019, provided that Mr. Harrington is providing services to us on such dates. The issuance of the stock option was exempt from the registration requirements of the Securities Act pursuant to Section 4(a)(2) thereof and Rule 506(b) of Regulation D promulgated thereunder as a transaction not involving a public offering.
ITEM 3. DEFAULTS UPON SENIOR SECURITIES
None.
ITEM 4. MINE SAFETY DISCLOSURES
None.
ITEM 5. OTHER INFORMATION
None.
| 32 |
ITEM 6. EXHIBITS
(a) Exhibits required by Item 601 of Regulation S-K.
|
Exhibit Number |
Description | |
| 3.1 | Certificate of Incorporation, dated July 19, 2005 (incorporated by reference to Exhibit 3.1 to the Registration Statement on Form S-1 of the Company filed on February 11, 2011 by the Company with the SEC). | |
| 3.2 | Certificate of Amendment of Certificate of Incorporation, dated November 20, 2007 (incorporated by reference to Exhibit 3.2 to the Registration Statement on Form S-1 of the Company filed on February 11, 2011 by the Company with the SEC). | |
| 3.3 | Amended and Restated By-Laws of Snap Interactive, Inc., as amended April 19, 2012 (incorporated by reference to Exhibit 3.1 to the Current Report on Form 8-K of the Company filed on April 25, 2012 by the Company with the SEC). | |
| 10.1 | Second Amendment to Executive Employment Agreement, effective as of October 13, 2015, by and between Snap Interactive, Inc. and Alexander Harrington (incorporated by reference to Exhibit 10.1 to the Current Report on Form 8-K of the Company filed on October 14, 2015 by the Company with the SEC). | |
| 10.2 | First Amendment to Executive Employment Agreement, effective as of October 13, 2015, by and between Snap Interactive, Inc. and Clifford Lerner (incorporated by reference to Exhibit 10.2 to the Current Report on Form 8-K of the Company filed on October 14, 2015 by the Company with the SEC). | |
| 10.3 | Option Cancellation and Release Agreement, effective as of October 13, 2015, by and between Snap Interactive, Inc. and Alexander Harrington (incorporated by reference to Exhibit 10.3 to the Current Report on Form 8-K of the Company filed on October 14, 2015 by the Company with the SEC). | |
| 10.4 | Nonqualified Stock Option Agreement, dated as of October 13, 2015, by and between Snap Interactive, Inc. and Alexander Harrington (incorporated by reference to Exhibit 10.4 to the Current Report on Form 8-K of the Company filed on October 14, 2015 by the Company with the SEC). | |
| 31.1* | Certification of the Chief Executive Officer and Chief Financial Officer pursuant to Section 302 of the Sarbanes-Oxley Act of 2002. | |
| 32.1** | Certification of the Chief Executive Officer and Chief Financial Officer pursuant to Section 906 of the Sarbanes-Oxley Act of 2002. | |
| 101* | The following materials from the Company’s Quarterly Report on Form 10-Q for the quarter ended September 30, 2015, formatted in XBRL (eXtensible Business Reporting Language), (i) Condensed Consolidated Balance Sheets, (ii) Condensed Consolidated Statements of Operations, (iii) Condensed Consolidated Statement of Changes in Stockholders’ Equity, (iv) Condensed Consolidated Statements of Cash Flows and (v) Notes to Condensed Consolidated Financial Statements. |
* Filed herewith.
** The certification attached as Exhibit 32.1 is not deemed filed with the Securities and Exchange Commission and is not to be incorporated by reference into any filing of Snap Interactive, Inc. under the Securities Act of 1933, as amended, or the Securities Exchange Act of 1934, as amended, whether made before or after the date of the Quarterly Report on Form 10-Q, irrespective of any general incorporation language contained in such filing.
| 33 |
SIGNATURES
Pursuant to the requirements of the Securities Exchange Act of 1934, the registrant has duly caused this report to be signed on its behalf by the undersigned, thereunto duly authorized.
| SNAP INTERACTIVE, INC. | ||
| Date: November 10, 2015 | By: | /s/ Alexander Harrington |
|
Alexander Harrington Chief Executive Officer and Chief Financial Officer (Principal Executive, Financial and Accounting Officer) | ||
34