Attached files
| file | filename |
|---|---|
| 8-K - 8-K - NEW JERSEY RESOURCES CORP | d768817d8k.htm |
Exhibit 99.1
|
|

Exhibit 99.1
Laurence M. Downes
Chairman & Chief Executive Officer
August 6, 2014
|
|
Regarding Forward-Looking Statements
Certain statements contained in this presentation are forward-looking statements within the meaning of the Private Securities Litigation Reform Act of 1995. Words such as “anticipates,” “estimates,” “expects,” “projects,” “forecasts”, “may,” “will,” “intends,” “expects,” “believes,” or “should” and similar expressions may identify forward-looking information and such forward-looking statements are made based upon management’s current expectations and/or beliefs as of this date or a prior date concerning future developments and their potential effect upon New Jersey Resources (NJR or the Company). There can be no assurance that future developments will be in accordance with management’s expectations or that the effect of future developments on NJR will be those anticipated by management. NJR cautions persons reading or hearing this presentation that the assumptions that form the basis for forward-looking statements including, but not limited to, certain statements regarding NJR’s NFE guidance for fiscal 2014, forecasted contribution of business segments to fiscal 2014 NFE and to NFE beyond fiscal 2014, dividend growth and long-term NFE growth rate, future NJNG customer growth, future NJNG capital expenditures and infrastructure investments, NJNG incremental utility gross margin, the long-term outlook for NJRCEV, diversification of NJRCEV’s strategy, and the completion of Carroll Area wind farm include many factors that are beyond the Company’s ability to control or estimate precisely, such as estimates of future market conditions and the behavior of other market participants.
The factors that could cause actual results to differ materially from NJR’s expectations include, but are not limited to, weather and economic conditions; demographic changes in the NJNG service territory and their effect on NJNG’s customer growth; volatility of natural gas and other commodity prices and their impact on NJNG customer usage, NJNG’s Basic Gas Supply Service incentive programs, NJRES’ operations and on the Company’s risk management efforts; changes in rating agency requirements and/or credit ratings and their effect on availability and cost of capital to the Company; the impact of volatility in the credit markets on our access to capital; the ability to comply with debt covenants; the impact to the asset values and resulting higher costs and funding obligations of NJR’s pension and postemployment benefit plans as a result of downturns in the financial markets, a lower discount rate, and impacts associated with the Patient Protection and Affordable Care Act; accounting effects and other risks associated with hedging activities and use of derivatives contracts; commercial and wholesale credit risks, including the availability of creditworthy customers and counterparties and liquidity in the wholesale energy trading market; the ability to obtain governmental approvals and/or financing for the construction, development and operation of certain non-regulated energy investments; risks associated with the management of the Company’s joint ventures and partnerships; risks associated with our investments in renewable energy projects and our investment in an on-shore wind developer, including the availability of regulatory and tax incentives, logistical risks and potential delays related to construction, permitting, regulatory approvals and electric grid interconnection, the availability of viable projects and NJR’s eligibility for federal investment tax credits (ITC), and production tax credits (PTC), the future market for SRECs and operational risks related to projects in service; timing of qualifying for ITCs due to delays or failures to complete planned solar energy projects and the resulting effect on our effective tax rate and earnings; regulatory approval of NJNG’splanned infrastructure programs; the level and rate at which NJNG’s costs and expenses (including those related to restoration efforts resulting from Superstorm Sandy) are incurred and the extent to which they are allowed to be recovered from customers through the regulatory process; access to adequate supplies of natural gas and dependence on third-party storage and transportation facilities for natural gas supply; operating risks incidental to handling, storing, transporting and providing customers with natural gas; risks related to our employee workforce, including a work stoppage; the regulatory and pricing policies of federal and state regulatory agencies; the costs of compliance with present and future environmental laws, including potential climate change-related legislation; risks related to changes in accounting standards; the disallowance of recovery of environmental-related expenditures and other regulatory changes; environmental-related and other litigation and other uncertainties; risks related to cyber-attack or failure of information technology systems; and the impact of natural disasters, terrorist activities, and other extreme events on our operations and customers, including any impacts to utility gross margin and restoration costs. The aforementioned factors are detailed in the “Risk Factors” sections of our Annual Report on Form 10-K filed on November 26, 2013, as filed with the Securities and Exchange Commission (SEC) which is available on the SEC’s website at sec.gov. Information included in this presentation is representative as of today only and while NJR periodically reassesses material trends and uncertainties affecting NJR’s results of operations and financial condition in connection with its preparation of management’s discussion and analysis of results of operations and financial condition contained in its Quarterly and Annual Reports filed with the SEC, NJR does not, by including this statement, assume any obligation to review or revise any particular forward-looking statement referenced herein in light of future events.
| 1 |
|
|
|
Disclaimer Regarding Non-GAAP Financial Measures
This presentation includes the non-GAAP measures net financial earnings (NFE), financial margin and utility gross margin. As indicators of the Company’s operating performance, these measures should not be considered alternatives to, or more meaningful than, GAAP measures, such as cash flow, net income, operating income or earnings per share.
Net financial earnings (losses) and financial margin exclude unrealized gains or losses on derivative instruments related to the Company’s unregulated subsidiaries and certain realized gains and losses on derivative instruments related to natural gas that has been placed into storage at NJRES. Volatility associated with the change in value of these financial and physical commodity contracts is reported in the income statement in the current period. In order to manage its business, NJR views its results without the impacts of the unrealized gains and losses, and certain realized gains and losses, caused by changes in value of these financial instruments and physical commodity contracts prior to the completion of the planned transaction because it shows changes in value currently as opposed to when the planned transaction ultimately is settled. NJNG’s utility gross margin represents the results of revenues less natural gas costs, sales and other taxes and regulatory rider expenses, which are key components of the Company’s operations that move in relation to each other.
Management uses NFE, financial margin and utility gross margin as supplemental measures to other GAAP results to provide a more complete understanding of the Company’s performance. Management believes these non-GAAP measures are more reflective of the Company’s business model, provide transparency to investors and enable period-to-period comparability of financial performance. For a full discussion of our non-GAAP financial measures, please see NJR’s most recent Form 10-K, Item 7 and most recent Form 10-Q, Item 2. This information has been provided pursuant to the requirements of SEC Regulation G.
| 2 |
|
|
|
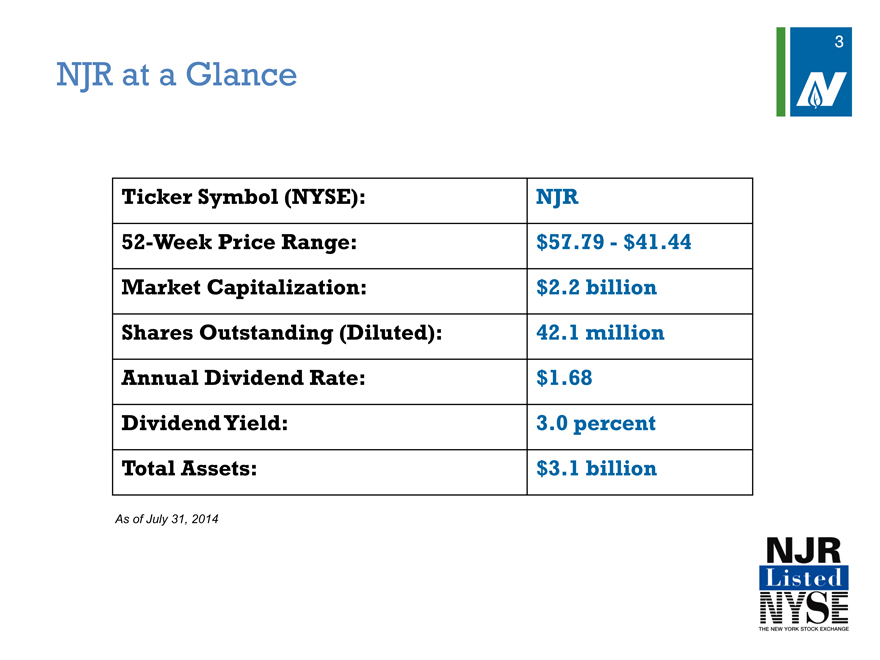
NJR at a Glance
Ticker Symbol (NYSE): NJR
52-Week Price Range: $57.79-$41.44
Market Capitalization: $2.2 billion
Shares Outstanding (Diluted): 42.1 million
Annual Dividend Rate: $1.68
Dividend Yield: 3.0 percent
Total Assets: $3.1 billion
As of July 31, 2014
| 3 |
|
|
|
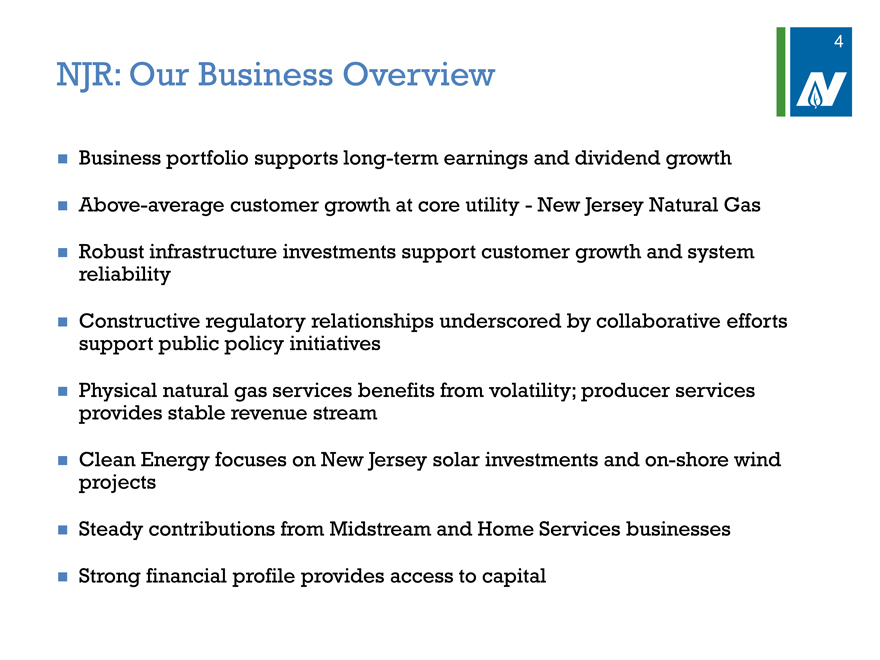
NJR: Our Business Overview
Business portfolio supports long-term earnings and dividend growth
Above-average customer growth at core utility-New Jersey Natural Gas
Robust infrastructure investments support customer growth and system reliability
Constructive regulatory relationships underscored by collaborative efforts support public policy initiatives
Physical natural gas services benefits from volatility; producer services provides stable revenue stream
Clean Energy focuses on New Jersey solar investments and on-shore wind projects
Steady contributions from Midstream and Home Services businesses
Strong financial profile provides access to capital
4
|
|
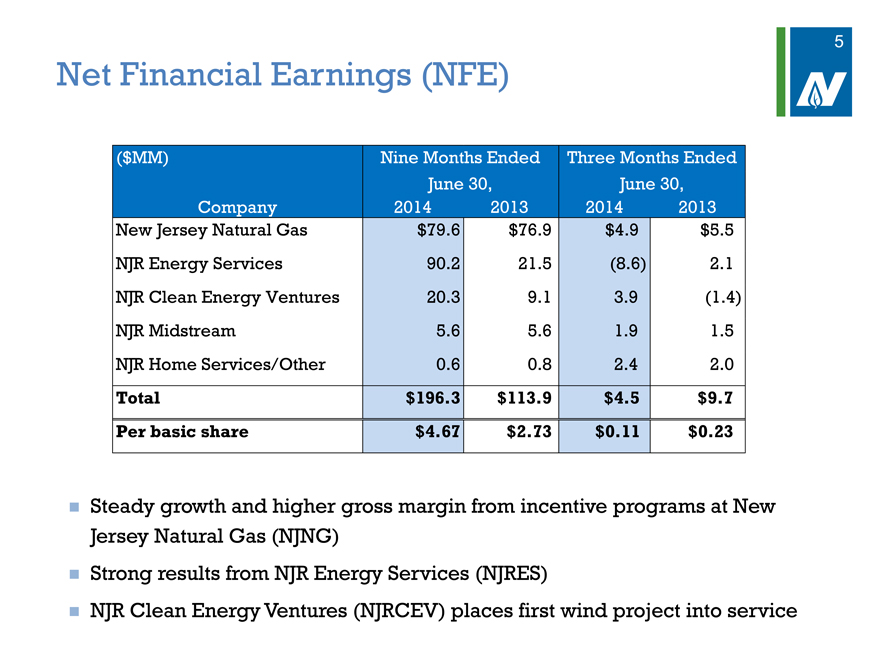
Net Financial Earnings (NFE)
($MM) Nine Months Ended Three Months Ended
June 30, June 30,
Company 2014 2013 2014 2013
New Jersey Natural Gas $79.6 $76.9 $4.9 $5.5
NJR Energy Services 90.2 21.5 (8.6) 2.1
NJR Clean Energy Ventures 20.3 9.1 3.9 (1.4)
NJR Midstream 5.6 5.6 1.9 1.5
NJR Home Services/Other 0.6 0.8 2.4 2.0
Total $196.3 $113.9 $4.5 $9.7
Per basic share $4.67 $2.73 $0.11 $0.23
Steady growth and higher gross margin from incentive programs at New Jersey Natural Gas (NJNG) Strong results from NJR Energy Services (NJRES) NJR Clean Energy Ventures (NJRCEV) places first wind project into service
| 5 |
|
|
|
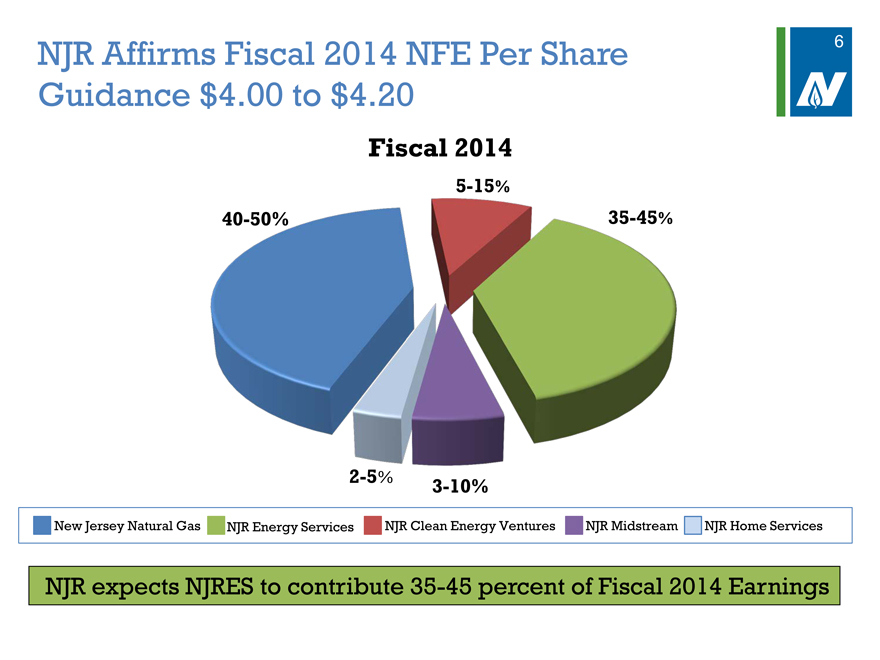
NJR Affirms Fiscal 2014 NFE Per Share Guidance $4.00 to $4.20
Fiscal 2014
5-15%
40-50% 35-45%
2-5% 3-10%
New Jersey Natural Gas NJR Energy Services NJR Clean Energy Ventures NJR Midstream NJR Home Services
NJR expects NJRES to contribute 35-45 percent of Fiscal 2014 Earnings
6
|
|
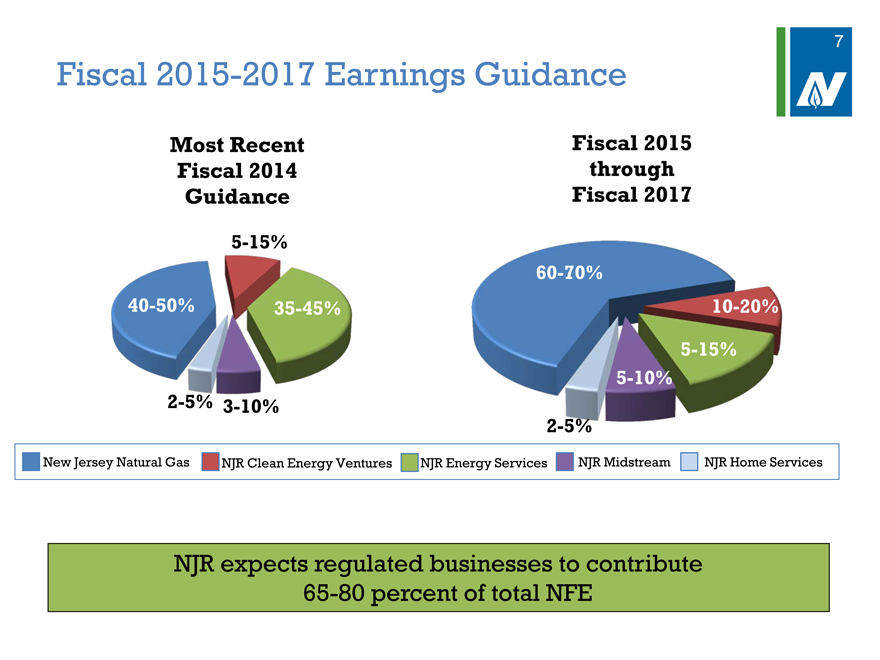
Fiscal 2015-2017 Earnings Guidance
Most Recent Fiscal 2015 Fiscal 2014 through Guidance Fiscal 2017
5-15%
60-70%
40-50% 35-45% 10-20%
5-15%
5-10%
2-5% 3-10%
2-5%
New Jersey Natural Gas NJR Clean Energy Ventures NJR Energy Services NJR Midstream NJR Home Services
NJR expects regulated businesses to contribute
65-80 percent of total NFE
| 7 |
|
|
|
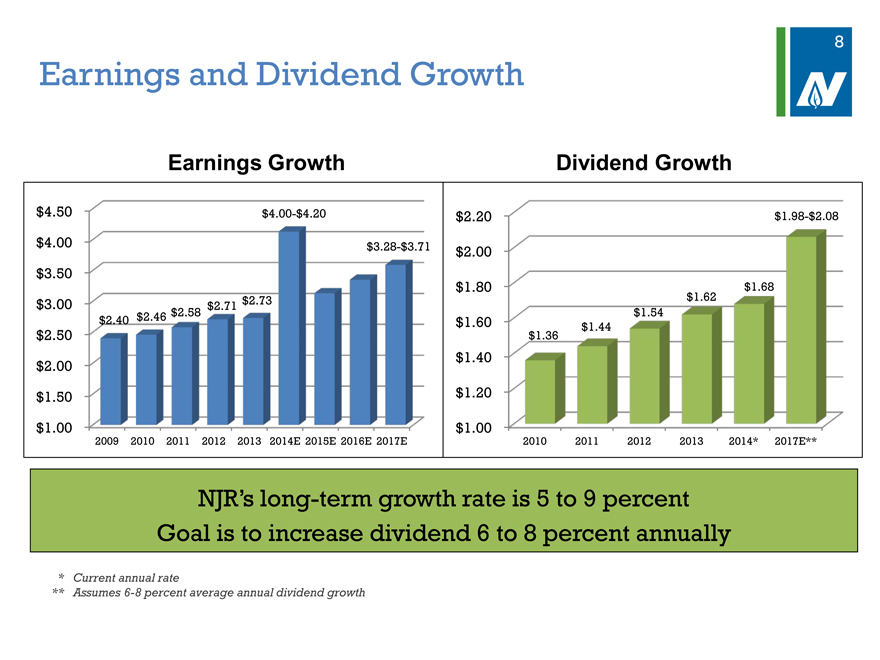
Earnings and Dividend Growth
Earnings Growth Dividend Growth
$4.50 $4.00-$4.20 $2.20 $1.98-$2.08
$4.00 $3.28-$3.71 $2.00
$3.50
$1.80 $1.68
$3.00 $2.71 $2.73 $1.62
$2.40 $2.46 $2.58 $1.60 $1.44 $1.54
$2.50 $1.36
$2.00 $1.40
$1.50 $1.20
$1.00 $1.00
2009 2010 2011 2012 2013 2014E 2015E 2016E 2017E 2010 2011 2012 2013 2014* 2017E**
NJR’s long-term growth rate is 5 to 9 percent Goal is to increase dividend 6 to 8 percent annually
| * |
|
Current annual rate |
** Assumes 6-8 percent average annual dividend growth
| 8 |
|
|
|
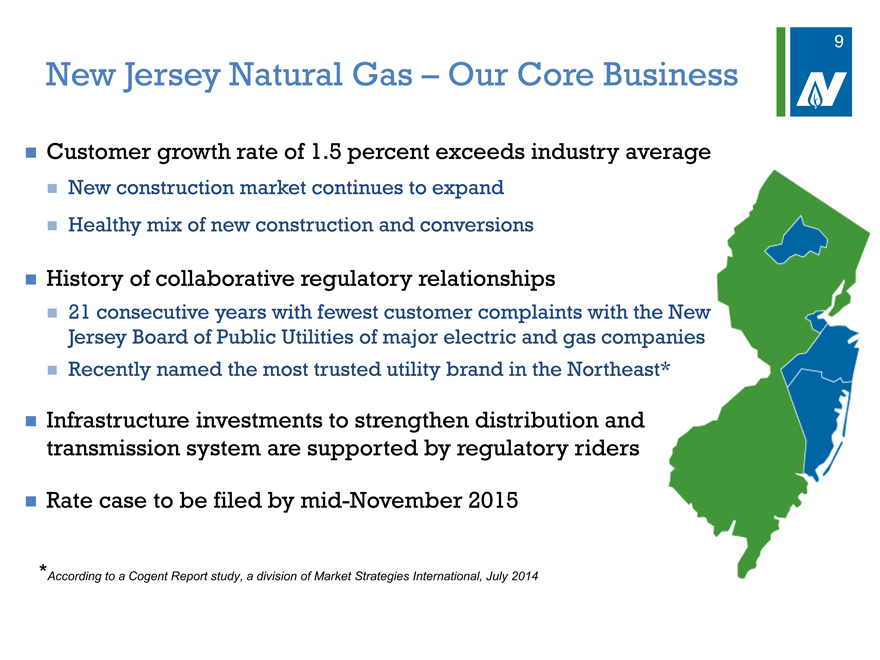
New Jersey Natural Gas – Our Core Business
Customer growth rate of 1.5 percent exceeds industry average
New construction market continues to expand Healthy mix of new construction and conversions
History of collaborative regulatory relationships
21 consecutive years with fewest customer complaints with the New Jersey Board of Public Utilities of major electric and gas companies Recently named the most trusted utility brand in the Northeast*
Infrastructure investments to strengthen distribution and transmission system are supported by regulatory riders
Rate case to be filed by mid-November 2015
*According to a Cogent Report study, a division of Market Strategies International, July 2014
9
|
|
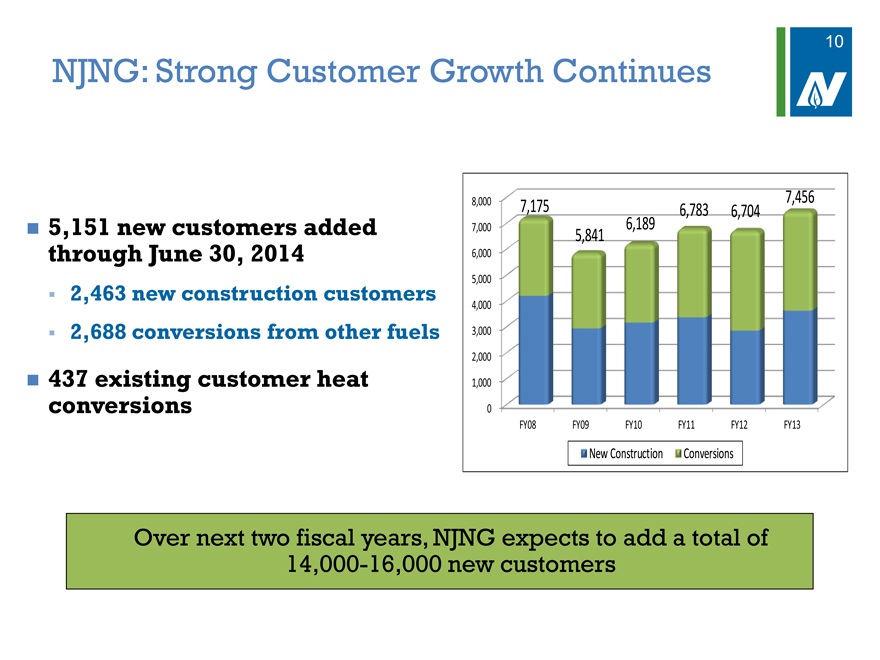
NJNG: Strong Customer Growth Continues
5,151 new customers added through June 30, 2014
2,463 new construction customers 2,688 conversions from other fuels
437 existing customer heat conversions
8,000 7,175 6,783 6,704 7,456
7,000 6,189
5,841
6,000
5,000
4,000
3,000
2,000
1,000
0
FY08 FY09 FY10 FY11 FY12 FY13
New Construction Conversions
Over next two fiscal years, NJNG expects to add a total of 14,000-16,000 new customers
10
|
|
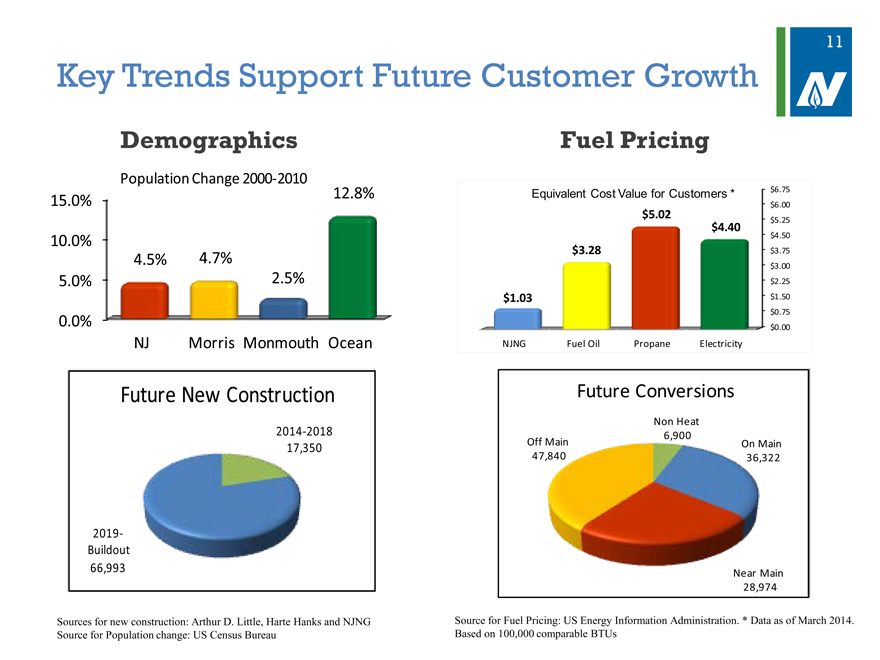
Key Trends Support Future Customer Growth
Demographics Fuel Pricing
Population Change 2000 2010
12.8% Equivalent Cost Value for Customers * $6.75
15.0% $6.00
$5.02 $5.25
$4.40
10.0% $4.50
4.5% 4.7% $3.28 $3.75
$3.00
5.0% 2.5% $2.25
$1.03 $1.50
$0.75
0.0% $0.00
NJ Morris Monmouth Ocean NJNG Fuel Oil Propane Electricity
Future New Construction Future Conversions
Non Heat
2014 2018 6,900
17,350 Off Main On Main
47,840 36,322
2019
Buildout
66,993 Near Main
28,974
Sources for new construction: Arthur D. Little, Harte Hanks and NJNG Source for Fuel Pricing: US Energy Information Administration. * Data as of March 2014.
Source for Population change: US Census Bureau Based on 100,000 comparable BTUs
11
|
|
12
The SAVEGREEN Project®
Investment in high-efficiency equipment In place through June 2015 Capital of up to $138 million New programs added Fiscal year-to-date results:
Invested $24.7 million on grants, incentives and on-bill repayment program 1,690 On-bill repayments Over 3,430 energy audits
NJNG earns a return on equity ranging from 9.75 percent to 10.3 percent on all programs
Constructive regulatory environment and support of public policy objectives create growth opportunities for NJNG
|
|
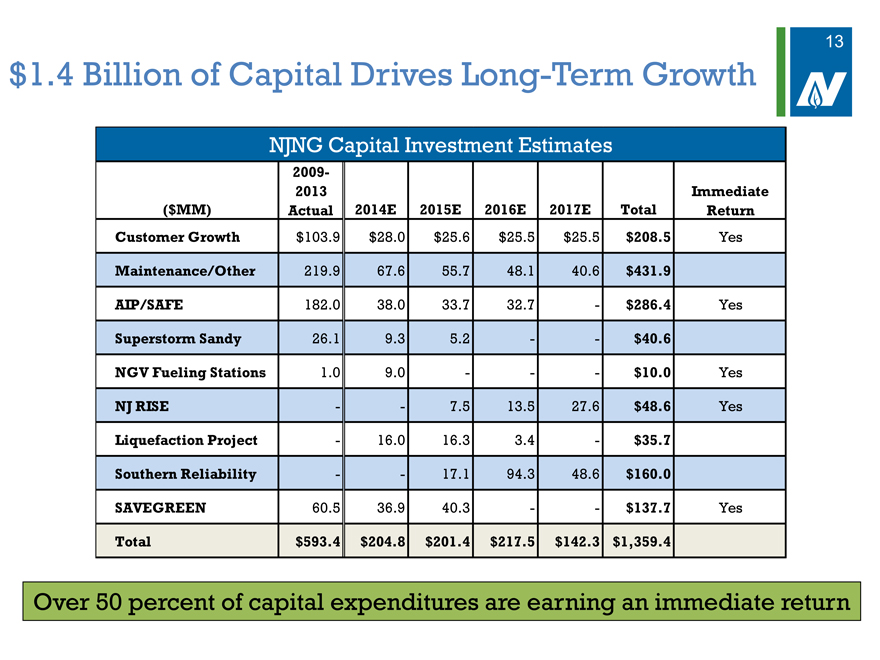
$1.4 Billion of Capital Drives Long-Term Growth
NJNG Capital Investment Estimates
2009-
2013 Immediate
($MM) Actual 2014E 2015E 2016E 2017E Total Return
Customer Growth $103.9 $28.0 $25.6 $25.5 $25.5 $208.5 Yes
Maintenance/Other 219.9 67.6 55.7 48.1 40.6 $431.9
AIP/SAFE 182.0 38.0 33.7 32.7 - $286.4 Yes
Superstorm Sandy 26.1 9.3 5.2 -- $40.6
NGV Fueling Stations 1.0 9.0 --- $10.0 Yes
NJ RISE -- 7.5 13.5 27.6 $48.6 Yes
Liquefaction Project - 16.0 16.3 3.4 - $35.7
Southern Reliability -- 17.1 94.3 48.6 $160.0
SAVEGREEN 60.5 36.9 40.3 -- $137.7 Yes
Total $593.4 $204.8 $201.4 $217.5 $142.3 $1,359.4
13
Over 50 percent of capital expenditures are earning an immediate return
|
|
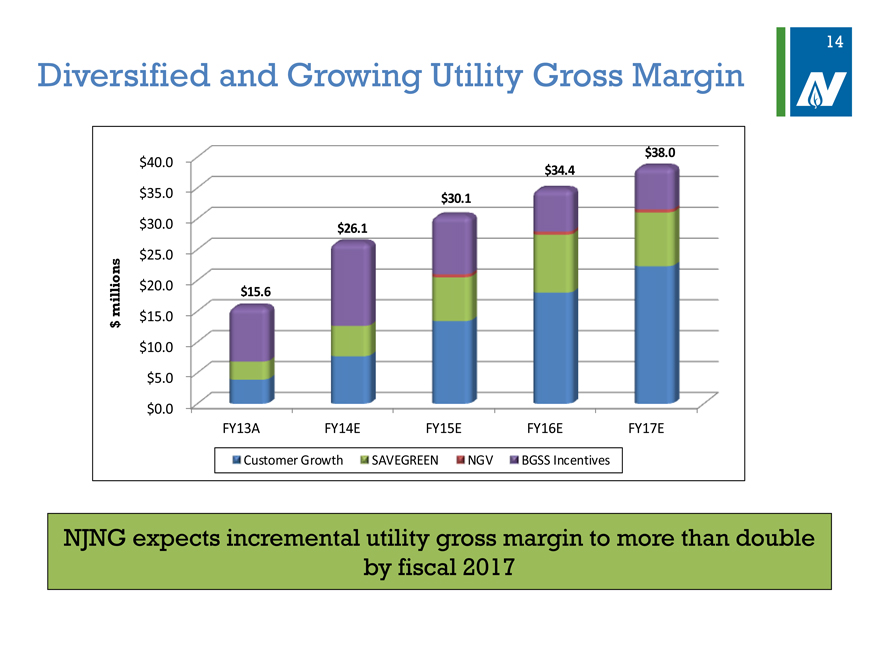
Diversified and Growing Utility Gross Margin
$38.0
$40.0 $34.4
$35.0 $30.1
$30.0 $26.1
$25.0
millions $20.0 $15.6
$15.0
$
$10.0
$5.0
$0.0
FY13A FY14E FY15E FY16E FY17E
Customer Growth SAVEGREEN NGV BGSS Incentives
NJNG expects incremental utility gross margin to more than double
by fiscal 2017
14
|
|
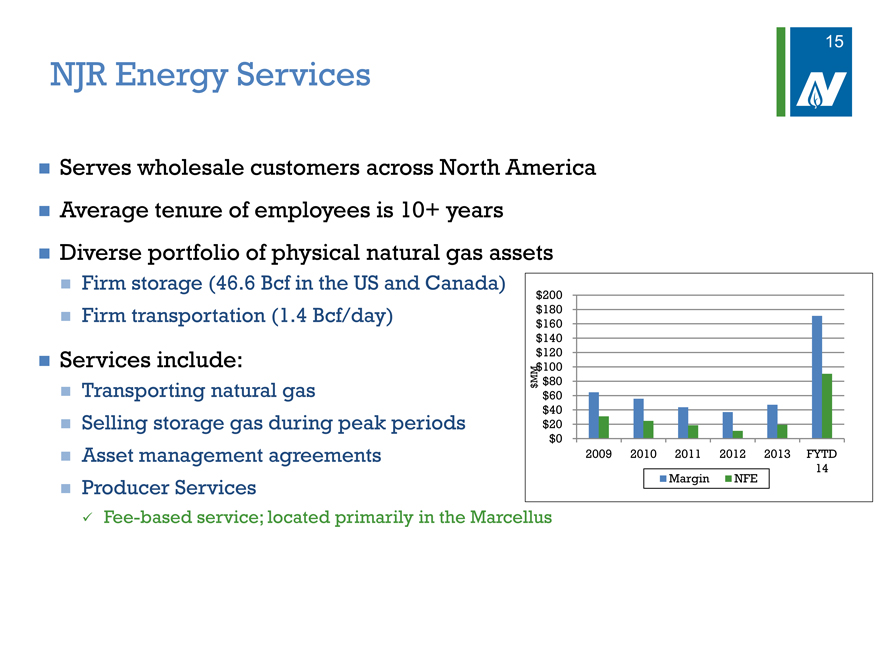
NJR Energy Services
Serves wholesale customers across North America Average tenure of employees is 10+ years Diverse portfolio of physical natural gas assets
Firm storage (46.6 Bcf in the US and Canada)
$200
transportation (1.4 $180 Firm Bcf/day) $160
$140 $120
Services include: $100
$MM $80
Transporting natural gas $60
$40
Selling storage gas during peak periods $20
$0
Asset management agreements 2009 2010 2011 2012 2013 FYTD
14 Margin NFE
Producer Services
Fee-based service; located primarily in the Marcellus
15
|
|
16
NJR Clean Energy Ventures
Unique opportunity created in New Jersey
Energy policy drives renewable investment Strong fundamentals for solar investments
Legislation supports solar investment
Growing Renewable Portfolio Standard (RPS)
Improving Solar Renewable Energy Certificates (SREC) fundamentals Rising residential solar demand
Goal to diversify our distributed power portfolio
Solar Investment Tax Credits (ITCs) expected to decline to 10 percent in January 2017 Gradual decline in solar capital spending by 2017 $64 million of committed capital for wind projects
|
|
17
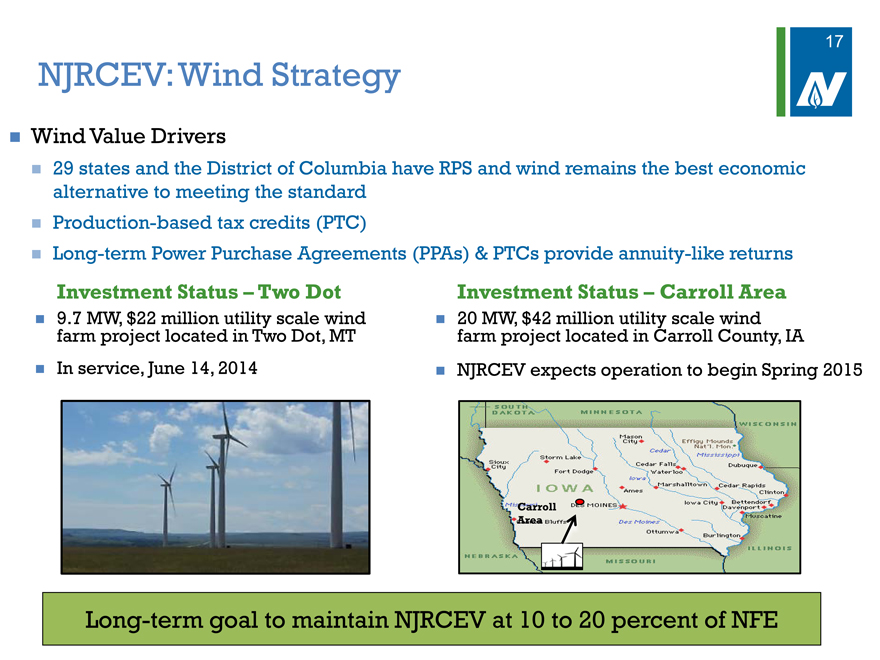
NJRCEV:Wind Strategy
Wind Value Drivers
29 states and the District of Columbia have RPS and wind remains the best economic alternative to meeting the standard Production-based tax credits (PTC) Long-term Power Purchase Agreements (PPAs) & PTCs provide annuity-like returns
Investment Status – Two Dot Investment Status – Carroll Area
farm 9.7 MW, project $22 million located utility in Two scale Dot, wind MT farm 20 MW, project $42 million located utility in Carroll scale County, wind IA In service, June 14, 2014 NJRCEV expects operation to begin Spring 2015
Long-term goal to maintain NJRCEV at 10 to 20 percent of NFE
|
|
18
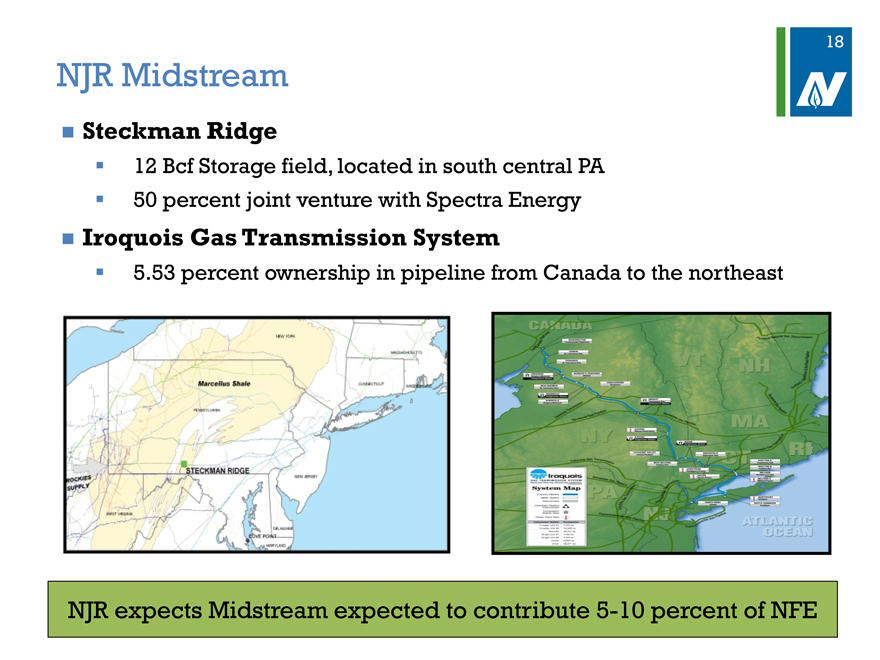
NJR Midstream
Steckman Ridge
12 Bcf Storage field, located in south central PA 50 percent joint venture with Spectra Energy
Iroquois Gas Transmission System
5.53 percent ownership in pipeline from Canada to the northeast
NJR expects Midstream expected to contribute 5-10 percent of NFE
|
|
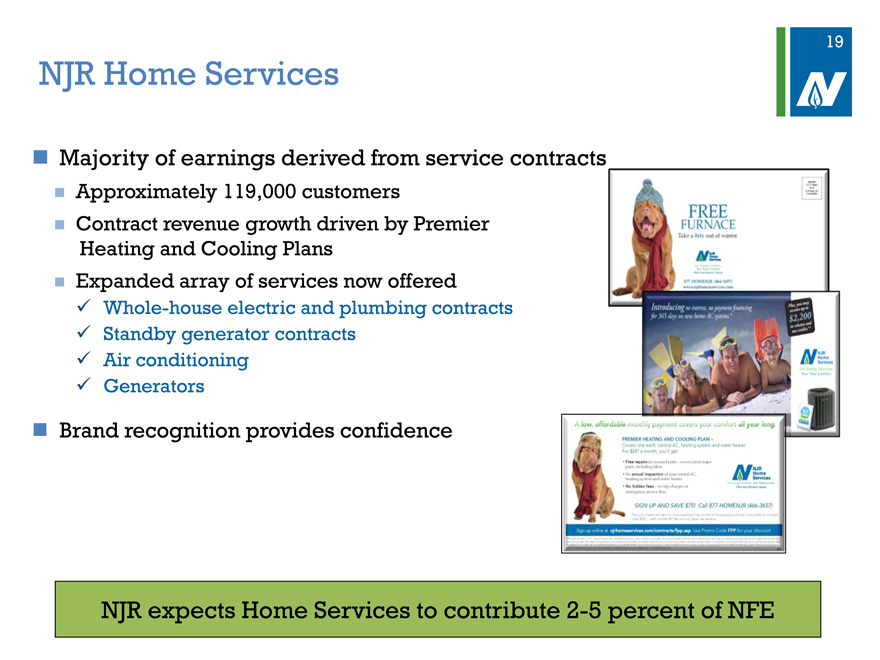
NJR Home Services
Majority of earnings derived from service contracts
Approximately 119,000 customers
Contract revenue growth driven by Premier Heating and Cooling Plans Expanded array of services now offered
Whole-house electric and plumbing contracts Standby generator contracts Air conditioning Generators
Brand recognition provides confidence
19
NJR expects Home Services to contribute 2-5 percent of NFE
|
|
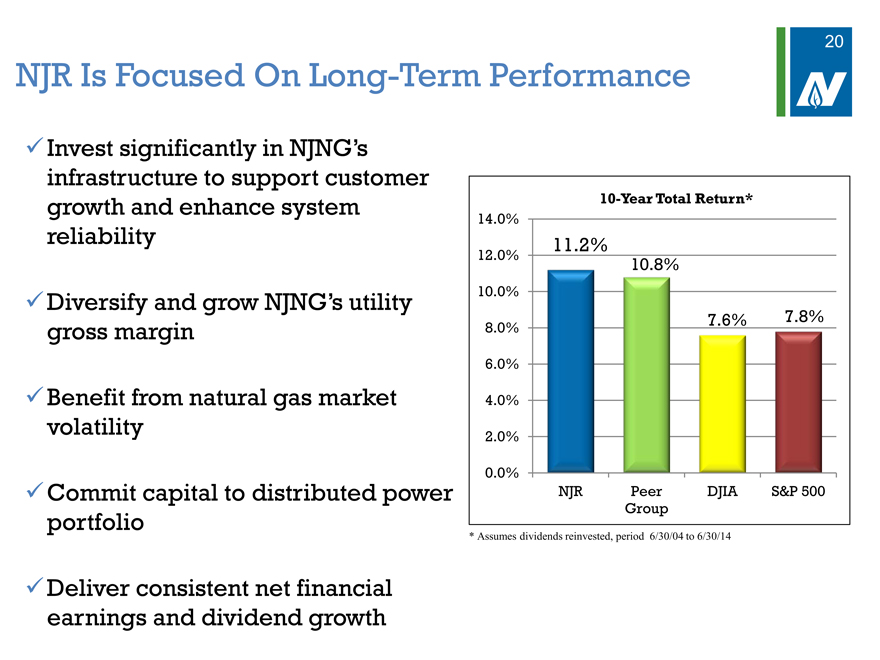
NJR Is Focused On Long-Term Performance
Invest significantly in NJNG’s infrastructure to support customer growth and enhance system reliability
Diversify and grow NJNG’s utility gross margin
Benefit from natural gas market volatility
Commit capital to distributed power portfolio
Deliver consistent net financial earnings and dividend growth
10-Year Total Return*
14.0%
11.2%
12.0% 10.8%
10.0%
80%. 7.6% 7.8%
6.0%
4.0%
2.0%
0.0%
NJR Peer DJIA S&P 500
Group
20
* Assumes dividends reinvested, period 6/30/04 to 6/30/14