Attached files
| file | filename |
|---|---|
| 8-K - 8-K - BROADWIND, INC. | a14-18111_18k.htm |
| EX-99.1 - EX-99.1 - BROADWIND, INC. | a14-18111_1ex99d1.htm |
Exhibit 99.2
|
|
Broadwind Energy, Inc. Q2 2014 Investor Call Presentation July 31, 2014 © 2014 Broadwind Energy, Inc. All Rights Reserved. |

|
|
Industry Disclaimer and Forward-Looking Statements Broadwind obtained the industry and market data used throughout this presentation from our own research, internal surveys and studies conducted by third parties, independent industry associations or general publications and other publicly available information. Independent industry publications and surveys generally state that they have obtained information from sources believed to be reliable, but do not guarantee the accuracy and completeness of such information. Forecasts are particularly likely to be inaccurate, especially over long periods of time. We are not aware of any misstatements in the industry data we have presented herein, but estimates involve risks and uncertainties and are subject to change based on various factors beyond our control. This presentation includes various forward-looking statements within the meaning of Section 27A of the Securities Act of 1933 and Section 21E of the Securities Exchange Act of 1934 that involve risks , uncertainties and assumption, such as statements regarding our future financial condition or results of operations or prospects and strategies for future growth. Statements in this presentation that are not historical are forward-looking statements. These statements are based on current expectations and we undertake no obligation to update these statements to reflect events or circumstances occurring after this presentation. Such statements are subject to various risks and uncertainties that could cause actual results to vary materially from those stated. Such risks and uncertainties include, but are not limited to: expectations regarding our business, end-markets, relationships with customers and our ability to diversify our customer base; the impact of competition and economic volatility on the industries in which we compete; our ability to realize revenue from customer orders and backlog; the impact of regulation on end-markets, including the wind energy industry in particular; the sufficiency of our liquidity and working capital; our restructuring plans and the associated cost savings; the ability to preserve and utilize our tax net operating loss carry-forwards; and other risks and uncertainties described in our filings with the Securities and Exchange Commission, including those contained in Part I, Item A “Risk Factors” of our Annual Reports on Form 10-K. This presentation contains non-GAAP financial information. We believe that certain non-GAAP financial measures may provide users of this financial information meaningful comparisons between current results and results in prior operating periods. We believe that these non-GAAP financial measures can provide additional meaningful reflection of underlying trends of the business because they provide a comparison of historical information that excludes certain infrequently occurring or non-operational items that impact the overall comparability. Non-GAAP financial measures should be viewed in addition to, and not as an alternative to, our reported results prepared in accordance with GAAP. Please see our earnings release dated July 31, 2014 for a reconciliation of certain non-GAAP measures presented in this presentation. 2 © 2014 Broadwind Energy, Inc. All rights reserved. 7/31/2014 |
|
|
Q2 2014 Overview End Market Environments Wind – continued consistent demand for wind towers in 2015-16 Oil & Gas – strong demand for gearing and fabrications Steel – strong demand for gearing Mining – demand remains flat for gearing and fabrications Q2 2014 Highlights Generated $.12 EPS Margins improved by +470 bp from Q2 2013 Inventory reduction of $3M from Q1- 2014 as expected Strong order intake in Gearing, +$18M Increased quoting activity and orders in Services 7/31/2014 © 2014 Broadwind Energy, Inc. All rights reserved. 3 |

|
|
Orders and Backlog 7/31/2014 © 2014 Broadwind Energy, Inc. All rights reserved. 4 Orders – $M $34M in tower orders announced after Q2 Gearing order rate highest in over 4 years; nice mix of wind and industrial Services orders up 69% over prior year and highest since Q4 2012; quoting activity up Order Backlog – $M Q2 2014 ending backlog of $222M Q2 2014 backlog up 56% from Q2 2013 93% of 2014 revenue shipped or in backlog at 6/30/14 Q2 2013 Q2 2014 Towers and Weldments $17.5 $0.9 Gearing 4.8 18.3 Services 2.6 4.4 Total $24.9 $23.6 |

|
|
Wind Market Large electricity users (Google, Microsoft) seeking wind power Yield Co’s coming to marketlower cost of capital EPA carbon regulations cleaner technologies become more valuable Below the 5 year average of natural gas inventories Turbine manufacturers continue to focus on lowering LCOE – Ohio passed 2 year freeze on RPS – Continued dysfunction in Washington 7/31/2014 © 2014 Broadwind Energy, Inc. All rights reserved. 5 |
|
|
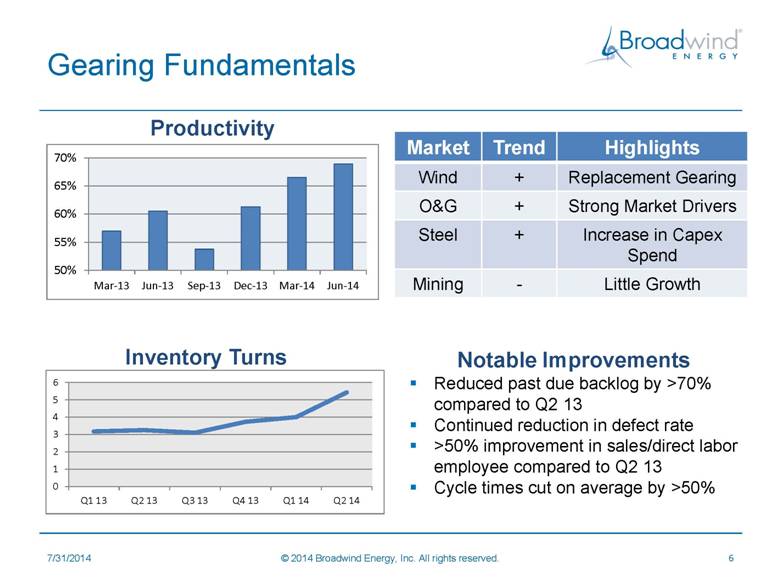
Gearing Fundamentals 7/31/2014 © 2014 Broadwind Energy, Inc. All rights reserved. 6 Market Trend Highlights Wind + Replacement Gearing O&G + Strong Market Drivers Steel + Increase in Capex Spend Mining - Little Growth Productivity Inventory Turns Notable Improvements Reduced past due backlog by >70% compared to Q2 13 Continued reduction in defect rate >50% improvement in sales/direct labor employee compared to Q2 13 Cycle times cut on average by >50% |
|
|
Consolidated Financial Results 7/31/2014 © 2014 Broadwind Energy, Inc. All rights reserved. 7 Q2 2014 Comments Sales up 29% from Q2 2013 – Towers and Weldments + 39%, Gearing +19% Gross margin (ex. restructuring) + 470 bp from Q2 2013 – higher volumes and improved productivity in Towers and Gearing Operating expense higher than Q2 2013 due to reserve for potential settlement of 2010 SEC investigation EPS $.12, significantly ahead of Q2 2013; achieved solid year-to-date profitability 2013 2014 2013 2014 Revenue-$M 52.9 $ 68.4 $ 98.5 $ 127.2 $ Gross Profit-$M 3.4 8.6 5.6 13.7 -% (ex. Restructuring) 8.7% 13.4% 7.3% 11.4% Operating Expense-$M 5.9 6.5 12.5 12.6 -% (ex. Restructuring) 10.9% 9.5% 12.0% 9.8% Operating Income/(Loss)-$M (2.5) 2.1 (7.0) 1.1 Net Income (Loss), Continuing-$M 0.4 1.9 (4.1) 0.8 Adj. EBITDA-$M 3.5 5.9 4.9 8.7 EPS (diluted), Continuing 0.03 0.12 (0.29) 0.05 Q2 YTD |

|
|
Towers and Weldments 7/31/2014 © 2014 Broadwind Energy, Inc. All rights reserved. 8 Second Quarter 2014 Highlights Tower volume increased 39% compared to Q2 2013 Short-term reduction in industrial weldment revenue from large mining customer Q2 2014 productivity increase from higher volume, process improvements and material sourcing savings Operating profit up 69% due to higher volumes, improved production flow, material sourcing savings and higher margin mix 2013 2014 2013 2014 Towers 85 119 158 227 Sections 282 380 566 732 Revenue-$M 39.1 $ 52.9 $ 69.0 $ 101.2 $ EBITDA-$M 6.3 9.6 9.8 16.2 Op. Income-$M 5.1 8.6 7.2 14.2 Op. Margin 13.0% 16.2% 10.5% 14.0% Q2 YTD June 30, |
|
|
Gearing 7/31/2014 © 2014 Broadwind Energy, Inc. All rights reserved. 9 Revenue up 19% due to improved plant throughput and reduction in past-due backlog EBITDA up due to improved throughput and the benefits of the plant consolidation Operating loss reduced by 55% due to increased volume, improved productivity and lower restructuring $18M in new orders; good mix of wind and industrial Second Quarter 2014 Highlights 2013 2014 2013 2014 Revenue-$M 10.4 $ 12.4 $ 21.2 $ 21.2 $ EBITDA-$M (0.1) 0.6 (0.1) (0.2) Op. Loss-$M (4.0) (1.8) (7.0) (4.8) Op. Margin -38.1% -14.5% -32.9% -22.5% Q2 YTD June 30, |
|
|
Services 7/31/2014 © 2014 Broadwind Energy, Inc. All rights reserved. 10 Second Quarter 2014 Highlights Industry recovering – quoting activity up; highest quarterly order rate since Q4 2012 Revenue down 14% from Q2 2013 – lower industrial drivetrain assembly work, partly offset by higher demand for blade repair work Operating loss flat due to lower restructuring and administrative expenses 2013 2014 2013 2014 Revenue-$M 4.1 $ 3.5 $ 11.5 $ 5.9 $ EBITDA-$M (0.6) (1.0) (0.6) (1.9) Op. Loss-$M (1.3) (1.3) (2.0) (2.7) Op. Margin -31.0% -37.9% -17.0% -44.9% Q2 YTD June 30, |
|
|
Operating Working Capital 7/31/2014 © 2014 Broadwind Energy, Inc. All rights reserved. 11 6/30/14 operating working capital increased $6.4M from 3/31/14 to $26.0M Operating working capital was 10% of annualized Q2 2014 sales Operating working capital expected to decline by year end as customer deposits increase *Operating Working Capital = Trade Receivables + Inventories – Trade Payables – Customer Deposits |
|
|
Debt and Liquidity 7/31/2014 © 2014 Broadwind Energy, Inc. All rights reserved. 12 Net debt negative Debt and capital leases less than $5M More than half of outstanding debt is low or 0% interest rates from New Markets Tax Credit and other grant financing $20M credit line remained undrawn at 6/30/14 6/30/2014 $M AloStar line of credit - Long-term debt - Capital leases 1.7 $ Subtotal: debt ex. grants 1.7 Grants/tax credits 2.7 Total Debt 4.4 Less: Cash and related assets 11.6 Net Debt (7.2) $ |

|
|
2014 Financial Outlook 7/31/2014 © 2014 Broadwind Energy, Inc. All rights reserved. 13 2014 EPS Walk Q1 and Q4 are typically the weakest quarters 2014 growth mainly from Towers revenue, but increasing contribution from Gearing Q3 results expected to be lower than Q2 due to tower model conversions Remain on track to achieve full-year guidance FY 2010 FY 2011 FY 2012 FY 2013 2014 E Q3 14 Q3 13 Revenue-$M 137.0 $ 186.0 $ 210.7 $ 215.7 $ $255-265 $65-68 60.9 $ Gross Profit-$M 1.9 7.2 6.8 12.3 4.6 -% (ex. Restructuring) 1.4% 3.9% 4.0% 8.0% 10-12% > 10% 9.4% Operating Expense-$M 30.4 27.6 24.1 25.6 6.9 -% (ex. Restructuring) 22.2% 14.6% 11.1% 11.3% 9-10% < 10% 11.2% Impairment Exp. -$M 40.8 0 Operating Profit (Loss)-$M (69.2) (20.4) (17.3) (13.2) positive .05-1.0 (2.3) Adj. EBITDA-$M (9.2) (2.1) 5.5 10.3 >16 4.5-5.0 2.7 EPS, Continuing - $ (6.56) (1.79) (1.27) (0.72) positive .02-.06 (0.18) |
|
|
Click to edit Master title style Click to edit Master text styles Second level Third level Fourth level Fifth level Broadwind Energy is committed to helping customers maximize performance of their energy and infrastructure investments— quicker, easier and smarter. 14 © 2014 Broadwind Energy, Inc. All rights reserved. |