Attached files
| file | filename |
|---|---|
| 8-K - 8-K - ADVENT SOFTWARE INC /DE/ | a14-17864_18k.htm |
| EX-99.1 - EX-99.1 - ADVENT SOFTWARE INC /DE/ | a14-17864_1ex99d1.htm |
|
|
Advent Software, Inc. Second Quarter 2014 Earnings Highlights July 28, 2014 Advent Investor Relations Contact: InvestorRelations@advent.com |
|
|
ADVS Forward-Looking Statements The financial projections under Financial Guidance and any other forward-looking statements included in this presentation reflect management's best judgment based on factors currently known and involve risks and uncertainties and our actual results may differ materially from those discussed here. These risks and uncertainties include: potential fluctuations in new contract bookings, renewal rates, operating results and future growth rates; continued market acceptance of our products; the successful development, release and market acceptance of new products and product enhancements; uncertainties and fluctuations in the financial markets; the Company’s ability to satisfy contractual performance requirements and other risks detailed from time to time in our SEC reports including, but not limited to, our quarterly reports on Form 10-Q and our 2013 Annual Report on Form 10-K. The Company disclaims any intention or obligation to publicly update or revise any forward-looking statements including any guidance, whether as a result of events or circumstances after the date hereof or to reflect the occurrence of unanticipated events. 2 |
|
|
ADVS Q2 14 Highlights Operating Metrics Annualized Recurring Run Rate was $366.1M at June 30, 2014, an increase of 3% over the prior year Q4 13 updated renewal rate of 99%, an increase of 4 points over the initially reported rate and an increase of 3 points over the prior year’s updated rate Q1 14 initially reported renewal rate of 94% Annual Contract Value (ACV) from term license, Advent OnDemand, and Black Diamond contracts was $7.7M, an increase of 15% over the prior year Financial Metrics Quarterly revenue of $100.4M, an increase of 4% over the prior year Non-GAAP Operating Income of $33.2M, or 33% of revenue, an increase of 7% compared to $31.0M, or 32% in the prior year. Non-GAAP Diluted EPS of $0.38, an increase of 4% over the prior year Operating cash flows of $22.4M, an increase of 3% over the prior year 3 |

|
|
ADVS Q2 14 Financial Highlights Metric Q213 Q214 $ +/- % +/- Annualized Recurring Run Rate at 6/30 ($M) $356.6 $366.1 $9.5 3% Revenue ($M) $96.1 $100.4 $4.2 4% Operating Cash Flow ($M) $21.9 $22.4 $0.6 3% GAAP Operating Margin -6.1% 21.7% 27.8pts 456% GAAP Diluted (Loss) Earnings per Share ($0.08) $0.24 $0.32 394% Non-GAAP Operating Margin1 32.3% 33.1% 0.9pts 3% Adjusted EBITDA ($M)1 $27.6 $34.7 $7.1 26% Non-GAAP Diluted EPS1 $0.37 $0.38 $0.01 4% 1 See reconciliation of GAAP to Non-GAAP measures on slide #10 * Totals, $+/- and % +/ - may not recalculate due to rounding 4 |

|
|
ADVS Operating Metrics ($ in millions) 5 Annual Contract Value Annualized Recurring Run Rate Renewals $31 324.0 322.2 The annual contribution to revenue once contracts are signed for Term License, Advent OnDemand, and Black Diamond. The annualized run rate of all of our contracted recurring revenue streams as of a point in time. The metric includes the combined effects of ACV, renewals and the existing run rate of recurring revenues into a single metric. Client contract renewals compared to the same quarter in the previous year based on cash collections and reported one quarter in arrears. 6/30/12 9/30/12 12/31/12 3/31/13 6/30/13 9/30/13 12/31/13 3/31/14 6/30/14 *Annualized Recurring Run Rate is not intended to be forward looking. |
|
|
ADVS Revenue ($ in millions) * Totals, $+/- and % +/ - may not recalculate due to rounding 6 |
|
|
ADVS Q2 14 Revenue Components ($ in millions) Q213 Q214 $ +/- % +/- Recurring $88.3 $92.5 $4.3 5% Term License Revenue $45.0 $49.3 $4.2 9% Perpetual Maintenance $16.3 $16.6 $0.2 1% Other Recurring 1 $26.9 $26.7 ($0.2) (1%) Non-Recurring $7.9 $7.8 ($0.0) (0%) Total Revenue $96.1 $100.4 $4.2 4% 1 Includes OnDemand, Data Services, Black Diamond, and asset based fees. * Totals, $+/- and % +/ - may not recalculate due to rounding 7 |
|
|
Deferred revenue represents invoiced bookings, not yet recognized as revenue Backlog represents contractual bookings, not yet invoiced (disclosed annually) 8 Deferred Revenue ADVS Deferred Revenue and Backlog ($ in millions) Deferred Revenue/Backlog |
|
|
ADVS 2014 Guidance *See reconciliation of GAAP to Non-GAAP guidance on slide #11 9 UPDATE Guidance Q3 14 FY14 Operating Measures: Total Revenue ($M) $99 - $102 $395 - $403 GAAP Operating Margin 20.0% - 20.5% Stock Compensation Expense (% of revenue) 8.5% Amortization (% of revenue) 2.0% Restructuring (% of revenue) 0.5% Non-GAAP Operating Margin * 31.0% - 31.5% Tax and Cash Measures: Effective Tax Rate (GAAP) 35% – 40% Effective Tax Rate (Non-GAAP) 35% Operating Cash Flow ($M) $105- $115 Capital Expenditures, incl. cap’d SW devel. ($M) $8- $11 |
|
|
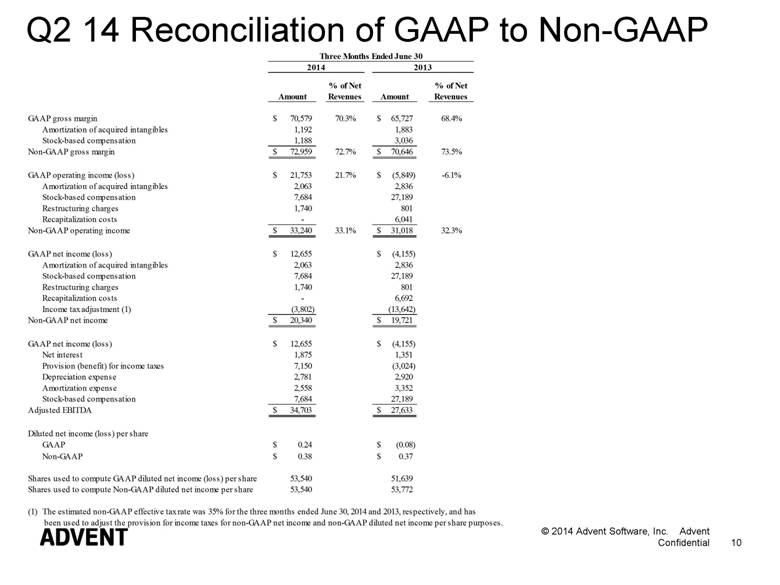
Q2 14 Reconciliation of GAAP to Non-GAAP 10 Amount % of Net Revenues Amount % of Net Revenues GAAP gross margin 70,579 $ 70.3% 65,727 $ 68.4% Amortization of acquired intangibles 1,192 1,883 Stock-based compensation 1,188 3,036 Non-GAAP gross margin 72,959 $ 72.7% 70,646 $ 73.5% GAAP operating income (loss) 21,753 $ 21.7% (5,849) $ -6.1% Amortization of acquired intangibles 2,063 2,836 Stock-based compensation 7,684 27,189 Restructuring charges 1,740 801 Recapitalization costs - 6,041 Non-GAAP operating income 33,240 $ 33.1% 31,018 $ 32.3% GAAP net income (loss) 12,655 $ (4,155) $ Amortization of acquired intangibles 2,063 2,836 Stock-based compensation 7,684 27,189 Restructuring charges 1,740 801 Recapitalization costs - 6,692 Income tax adjustment (1) (3,802) (13,642) Non-GAAP net income 20,340 $ 19,721 $ GAAP net income (loss) 12,655 $ (4,155) $ Net interest 1,875 1,351 Provision (benefit) for income taxes 7,150 (3,024) Depreciation expense 2,781 2,920 Amortization expense 2,558 3,352 Stock-based compensation 7,684 27,189 Adjusted EBITDA 34,703 $ 27,633 $ Diluted net income (loss) per share GAAP 0.24 $ (0.08) $ Non-GAAP 0.38 $ 0.37 $ Shares used to compute GAAP diluted net income (loss) per share 53,540 51,639 Shares used to compute Non-GAAP diluted net income per share 53,540 53,772 (1) The estimated non-GAAP effective tax rate was 35% for the three months ended June 30, 2014 and 2013, respectively, and has been used to adjust the provision for income taxes for non-GAAP net income and non-GAAP diluted net income per share purposes. 2014 2013 Three Months Ended June 30 |
|
|
Reconciliation of GAAP to Non-GAAP Guidance 11 |