Attached files
| file | filename |
|---|---|
| EX-99.1 - EXHIBIT 99.1 - USG CORP | a50910969ex99_1.htm |
| EX-99.3 - EXHIBIT 99.3 - USG CORP | a50910969ex99_3.htm |
| 8-K - USG CORPORATION 8-K - USG CORP | a50910969.htm |
Exhibit 99.2
USG Corporation Second Quarter 2014 Earnings Conference Call and Webcast July 24, 2014
CAUTIONARY STATEMENTS This presentation contains forward-looking statements within the meaning of the Private Securities Litigation Reform Act of 1995 related to management’s expectations about future conditions. Actual business, market or other conditions may differ materially from management’s expectations and, accordingly, may affect our sales and profitability or other results and liquidity. Actual results may differ materially due to various other factors, including: economic conditions, such as the levels of new home and other construction activity, employment levels, the availability of mortgage, construction and other financing, mortgage and other interest rates, housing affordability and supply, the levels of foreclosures and home resales, currency exchange rates and consumer confidence; capital markets conditions and the availability of borrowings under our credit agreement or other financings; our substantial indebtedness and our ability to incur substantial additional indebtedness; competitive conditions, such as price, service and product competition; shortages in raw materials; changes in raw material and energy costs; volatility in the assumptions used to determine the funded status of our pension plans; the loss of one or more major customers and our customers’ ability to meet their financial obligations to us; capacity utilization rates for us and the industry; our ability to expand into new geographic markets and the stability of such markets; our ability to successfully operate the joint venture with Boral Limited, including risks that our joint venture partner, Boral Limited, may not fulfill its obligations as an investor or may take actions that are inconsistent with our objectives; our ability to protect our intellectual property and other proprietary rights; changes in laws or regulations, including environmental and safety regulations; the satisfactory performance of certain business functions by third party service providers; our ability to achieve anticipated savings from cost reduction programs; the outcome in contested litigation matters; the effects of acts of terrorism or war upon domestic and international economies and financial markets; and acts of God. We assume no obligation to update any forward-looking information contained in this presentation. Additional information concerning these and other factors may be found in our filings with the Securities and Exchange Commission, including the “Risk Factors” in our most recent Annual Report on Form 10-K. 2
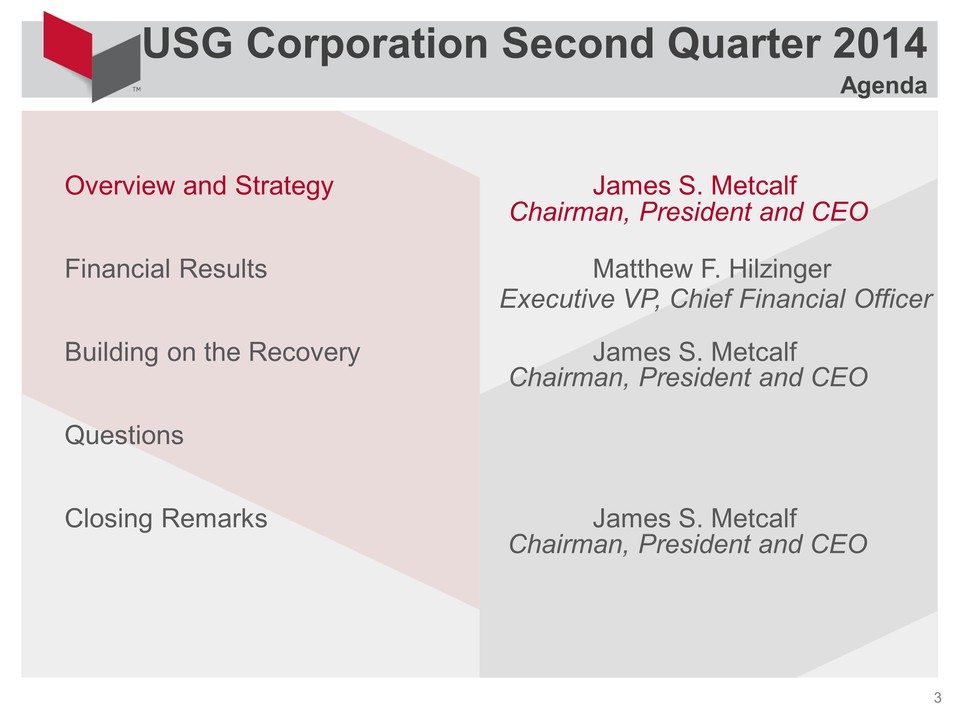
USG Corporation Second Quarter 2014 Agenda Overview and Strategy James S. Metcalf Chairman, President and CEO Financial Results Matthew F. Hilzinger Executive VP, Chief Financial Officer Building on the Recovery James S. Metcalf Chairman, President and CEO Questions Closing Remarks James S. Metcalf Chairman, President and CEO 3
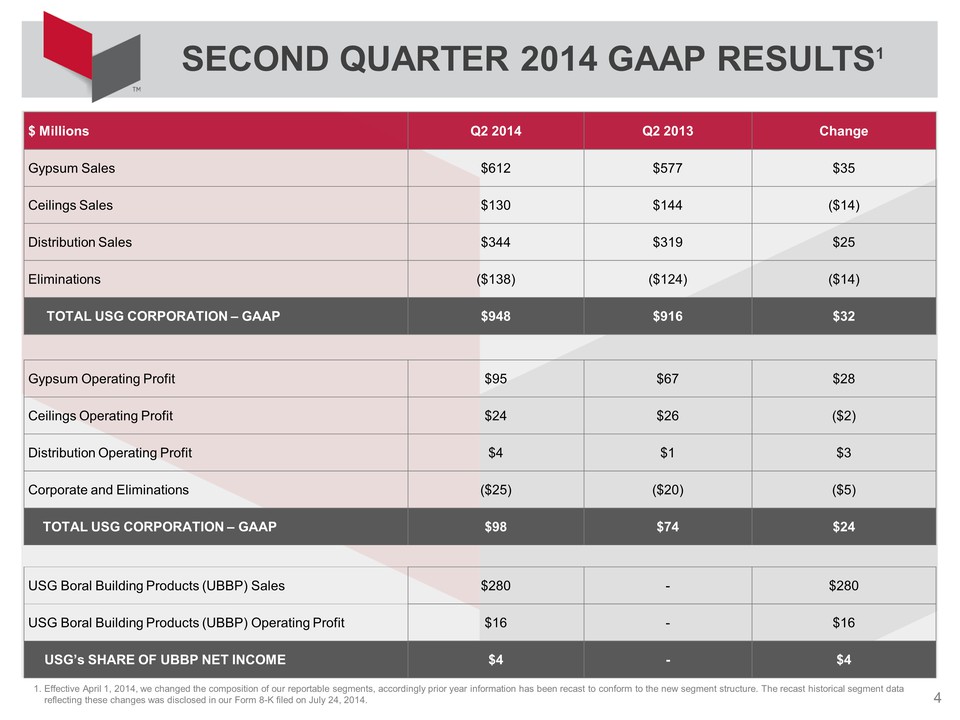
SECOND QUARTER 2014 GAAP RESULTS1 $ Millions Q2 2014 Q2 2013 Change Gypsum Sales $612 $577 $35 Ceilings Sales $130 $144 ($14) Distribution Sales $344 $319 $25 Eliminations ($138) ($124) ($14) TOTAL USG CORPORATION – GAAP $948 $916 $32 Gypsum Operating Profit $95 $67 $28 Ceilings Operating Profit $24 $26 ($2) Distribution Operating Profit $4 $1 $3 Corporate and Eliminations ($25) ($20) ($5) TOTAL USG CORPORATION – GAAP $98 $74 $24 USG Boral Building Products (UBBP) Sales $280 - $280 USG Boral Building Products (UBBP) Operating Profit $16 - $16 USG’s SHARE OF UBBP NET INCOME $4 - $4 1. Effective April 1, 2014, we changed the composition of our reportable segments, accordingly prior year information has been recast to conform to the new segment structure. The recast historical segment data reflecting these changes was disclosed in our Form 8-K filed on July 24, 2014. 4
PLAN TO WIN Strengthen the Core – North American Manufacturing and Distribution – De-lever our balance sheet Diversify the sources of our earnings – Strategic geographic extensions – USG Boral Building Products – Adjacent products/systems Differentiate through innovation – Differentiate USG in the market – Focus on high performance products and solutions that improve energy efficiency, sustainability, and speed of construction 5
USG Corporation Second Quarter 2014 Agenda Overview and Strategy James S. Metcalf Chairman, President and CEO Financial Results Matthew F. Hilzinger Executive VP, Chief Financial Officer Building on the Recovery James S. Metcalf Chairman, President and CEO Questions Closing Remarks James S. Metcalf Chairman, President and CEO 6
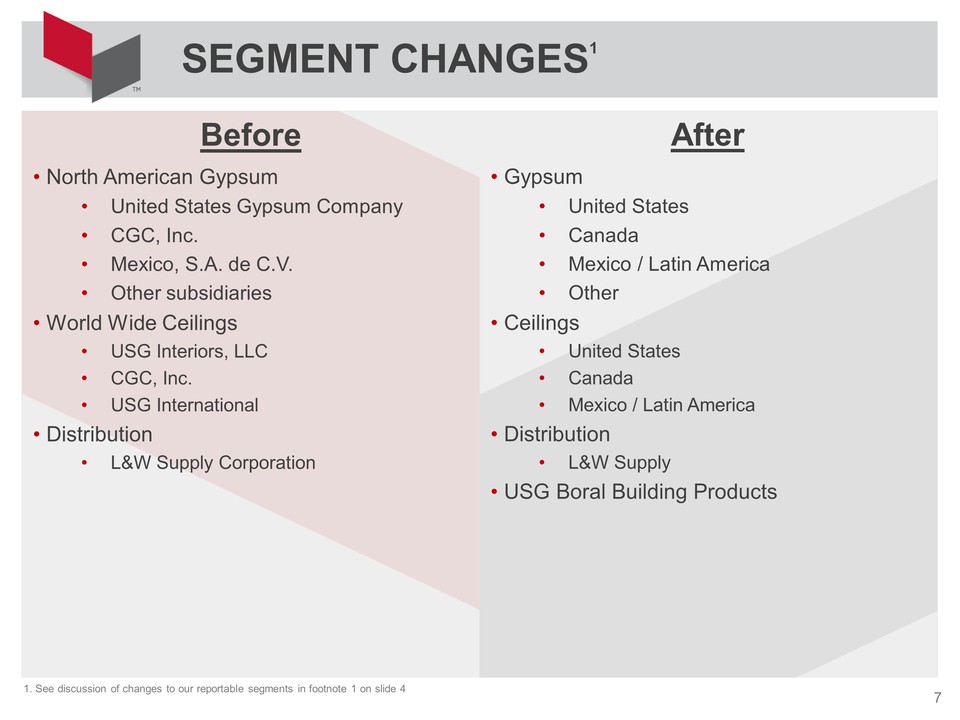
SEGMENT CHANGES1 Before After North American Gypsum United States Gypsum Company CGC, Inc. Mexico, S.A. de C.V. Other subsidiaries World Wide Ceilings USG Interiors, LLC CGC, Inc. USG International Distribution L&W Supply Corporation Gypsum United States Canada Mexico / Latin America Other Ceilings United States Canada Mexico / Latin America Distribution L&W Supply USG Boral Building Products 1. See discussion of changes to our reportable segments in footnote 1 on slide 4 7
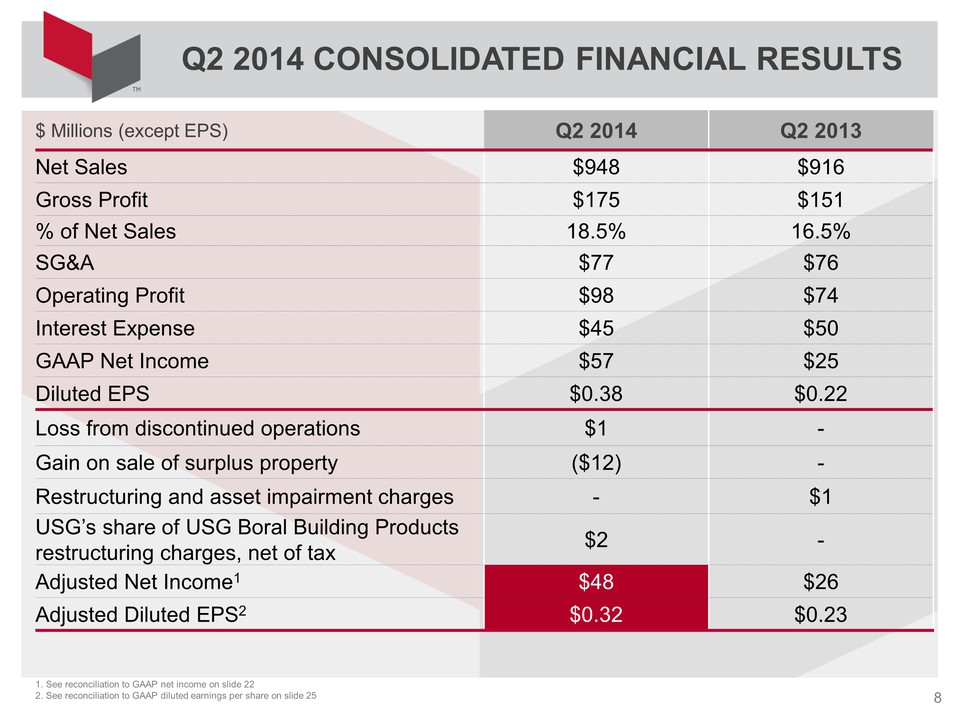
Q2 2014 CONSOLIDATED FINANCIAL RESULTS $ Millions (except EPS) Q2 2014 Q2 2013 Net Sales $948 $916 Gross Profit $175 $151 % of Net Sales 18.5% 16.5% SG&A $77 $76 Operating Profit $98 $74 Interest Expense $45 $50 GAAP Net Income $57 $25 Diluted EPS $0.38 $0.22 Loss from discontinued operations $1 - Gain on sale of surplus property ($12) - Restructuring and asset impairment charges - $1 USG’s share of USG Boral Building Products restructuring charges, net of tax $2 - Adjusted Net Income1 $48 $26 Adjusted Diluted EPS2 $0.32 $0.23 1. See reconciliation to GAAP net income on slide 22 2. See reconciliation to GAAP diluted earnings per share on slide 25 8
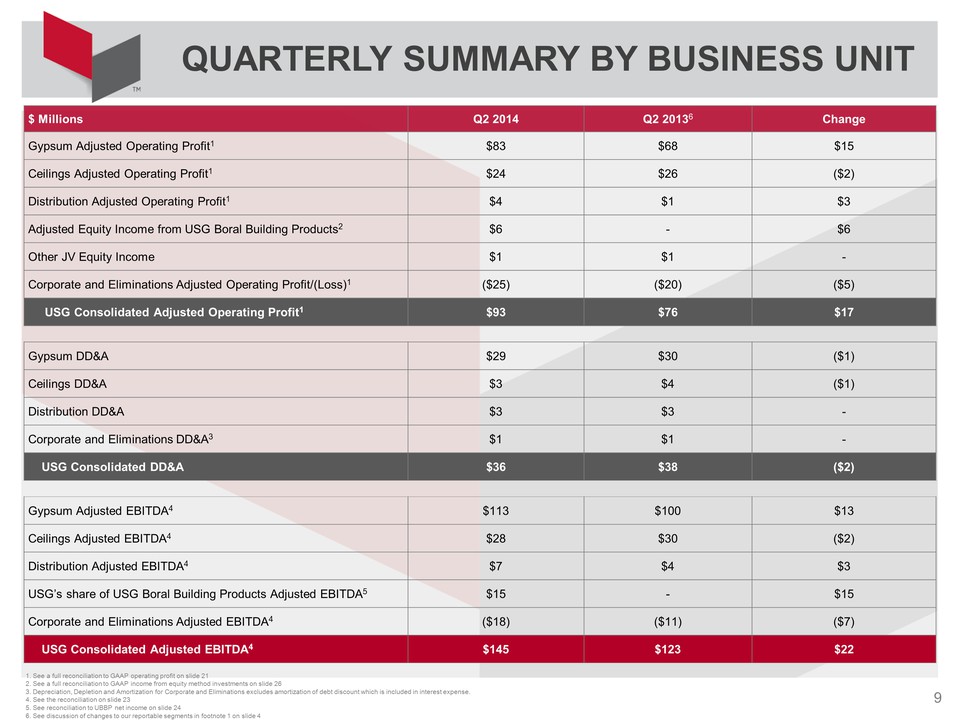
QUARTERLY SUMMARY BY BUSINESS UNIT $ Millions Q2 2014 Q2 20136 Change Gypsum Adjusted Operating Profit1 $83 $68 $15 Ceilings Adjusted Operating Profit1 $24 $26 ($2) Distribution Adjusted Operating Profit1 $4 $1 $3 Adjusted Equity Income from USG Boral Building Products2 $6 - $6 Other JV Equity Income $1 $1 - Corporate and Eliminations Adjusted Operating Profit/(Loss)1 ($25) ($20) ($5) USG Consolidated Adjusted Operating Profit1 $93 $76 $17 Gypsum DD&A $29 $30 ($1) Ceilings DD&A $3 $4 ($1) Distribution DD&A $3 $3 - Corporate and Eliminations DD&A3 $1 $1 - USG Consolidated DD&A $36 $38 ($2) Gypsum Adjusted EBITDA4 $113 $100 $13 Ceilings Adjusted EBITDA4 $28 $30 ($2) Distribution Adjusted EBITDA4 $7 $4 $3 USG’s share of USG Boral Building Products Adjusted EBITDA5 $15 - $15 Corporate and Eliminations Adjusted EBITDA4 ($18) ($11) ($7) USG Consolidated Adjusted EBITDA4 $145 $123 $22 1. See a full reconciliation to GAAP operating profit on slide 21 2. See a full reconciliation to GAAP income from equity method investments on slide 26 3. Depreciation, Depletion and Amortization for Corporate and Eliminations excludes amortization of debt discount which is included in interest expense. 4. See the reconciliation on slide 23 5. See reconciliation to UBBP net income on slide 24 6. See discussion of changes to our reportable segments in footnote 1 on slide 4 9
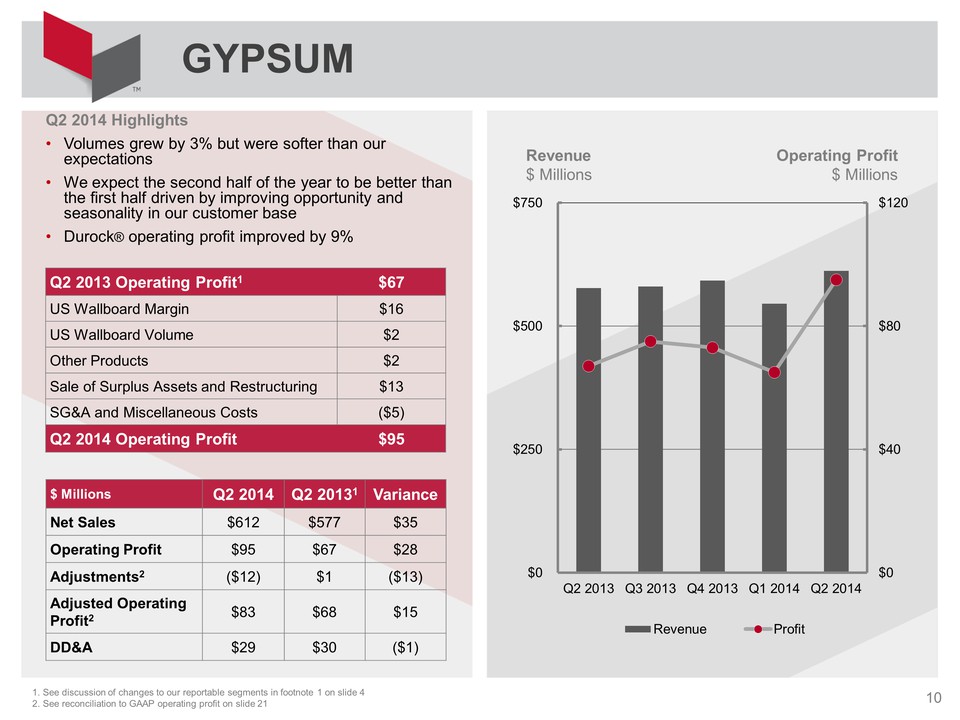
GYPSUM Q2 2014 Highlights Volumes grew by 3% but were softer than our expectations We expect the second half of the year to be better than the first half driven by improving opportunity and seasonality in our customer base Durock® operating profit improved by 9% Revenue $ Millions Operating Profit $ Millions $0 $40 $80 $120 $0 $250 $500 $750 Q2 2013 Q3 2013 Q4 2013 Q1 2014 Q2 2014 Revenue Profit Q2 2013 Operating Profit1 $67 US Wallboard Margin $16 US Wallboard Volume $2 Other Products $2 Sale of Surplus Assets and Restructuring $13 SG&A and Miscellaneous Costs ($5) Q2 2014 Operating Profit $95 $ Millions Q2 2014 Q2 20131 Variance Net Sales $612 $577 $35 Operating Profit $95 $67 $28 Adjustments2 ($12) $1 ($13) Adjusted Operating Profit2 $83 $68 $15 DD&A $29 $30 ($1) 1. See discussion of changes to our reportable segments in footnote 1 on slide 4 2. See reconciliation to GAAP operating profit on slide 21 10
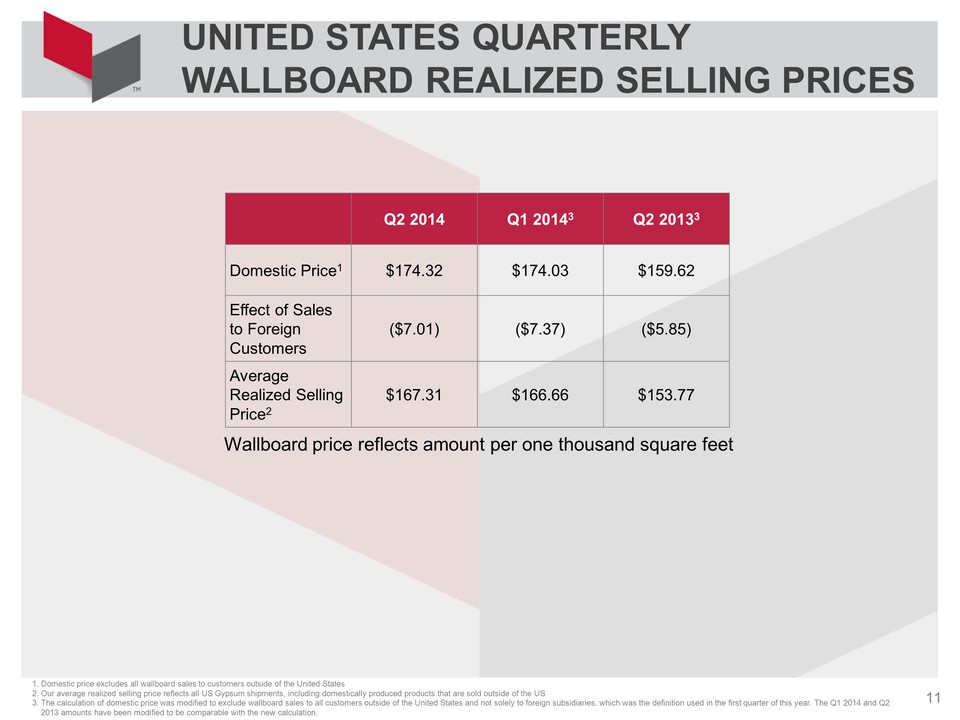
UNITED STATES QUARTERLY WALLBOARD REALIZED SELLING PRICES Q2 2014 Q1 20143 Q2 20133 Domestic Price1 $174.32 $174.03 $159.62 Effect of Sales to Foreign Customers ($7.01) ($7.37) ($5.85) Average Realized Selling Price2 $167.31 $166.66 $153.77 Wallboard price reflects amount per one thousand square feet 1. Domestic price excludes all wallboard sales to customers outside of the United States 2. Our average realized selling price reflects all US Gypsum shipments, including domestically produced products that are sold outside of the US 3. The calculation of domestic price was modified to exclude wallboard sales to all customers outside of the United States and not solely to foreign subsidiaries, which was the definition used in the first quarter of this year. The Q1 2014 and Q2 2013 amounts have been modified to be comparable with the new calculation. 11
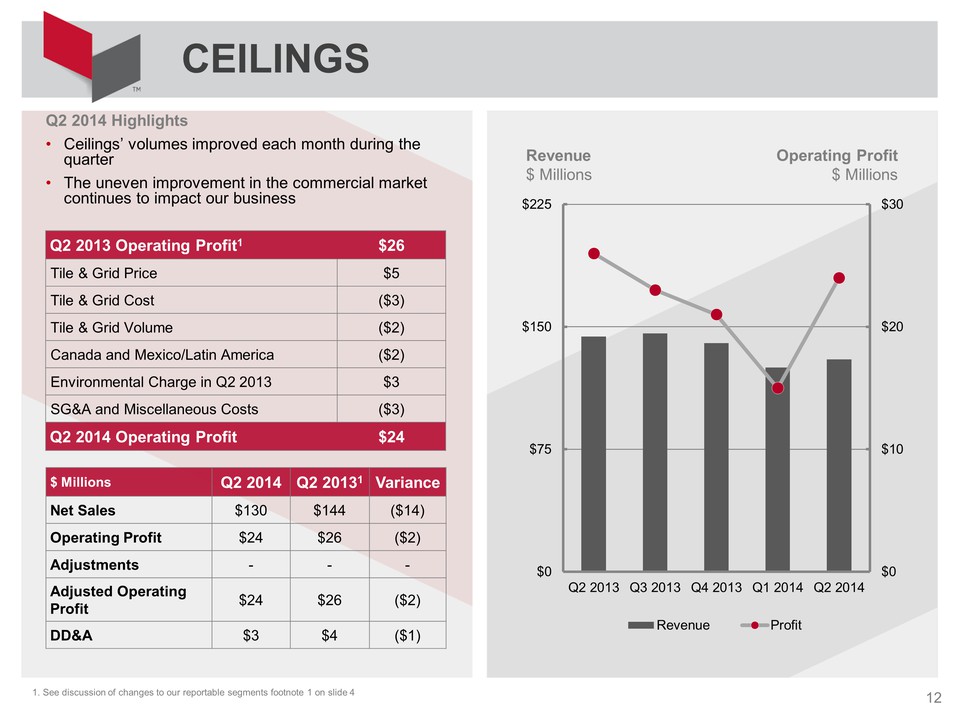
CEILINGS Q2 2014 Highlights Ceilings’ volumes improved each month during the quarter The uneven improvement in the commercial market continues to impact our business Revenue $ Millions Operating Profit $ Millions $0 $10 $20 $30 $0 $75 $150 $225 Q2 2013 Q3 2013 Q4 2013 Q1 2014 Q2 2014 Revenue Profit Q2 2013 Operating Profit1 $26 Tile & Grid Price $5 Tile & Grid Cost ($3) Tile & Grid Volume ($2) Canada and Mexico/Latin America ($2) Environmental Charge in Q2 2013 $3 SG&A and Miscellaneous Costs ($3) Q2 2014 Operating Profit $24 $ Millions Q2 2014 Q2 20131 Variance Net Sales $130 $144 ($14) Operating Profit $24 $26 ($2) Adjustments - - - Adjusted Operating Profit $24 $26 ($2) DD&A $3 $4 ($1) 1. See discussion of changes to our reportable segments footnote 1 on slide 4 12
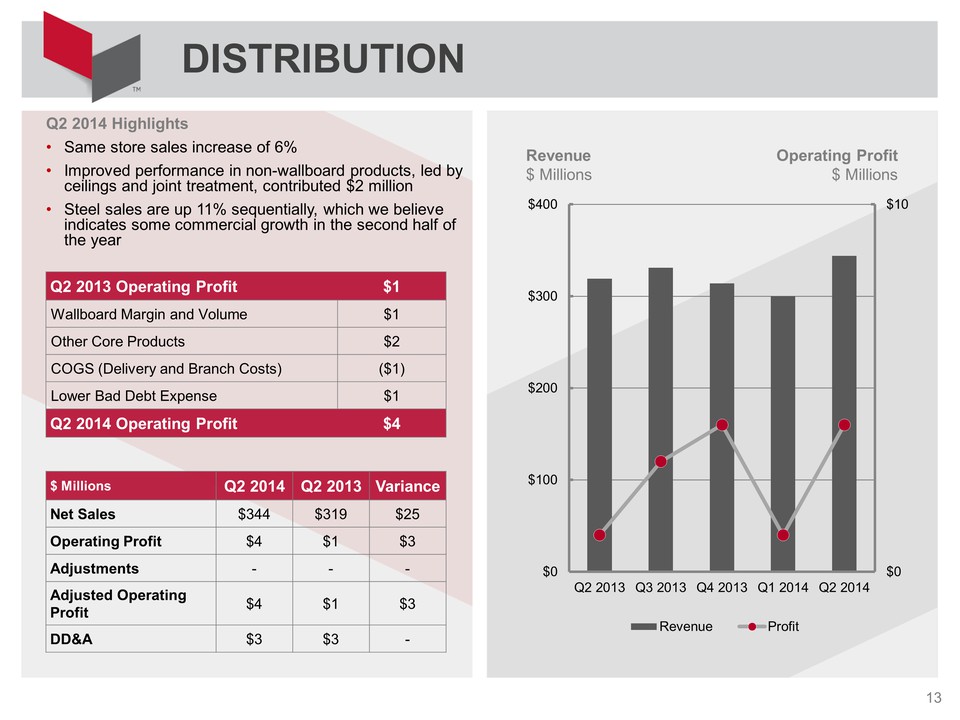
DISTRIBUTION Q2 2014 Highlights Same store sales increase of 6% Improved performance in non-wallboard products, led by ceilings and joint treatment, contributed $2 million Steel sales are up 11% sequentially, which we believe indicates some commercial growth in the second half of the year Revenue $ Millions Operating Profit $ Millions $0 $10 $0 $100 $200 $300 $400 Q2 2013 Q3 2013 Q4 2013 Q1 2014 Q2 2014 Revenue Profit Q2 2013 Operating Profit $1 Wallboard Margin and Volume $1 Other Core Products $2 COGS (Delivery and Branch Costs) ($1) Lower Bad Debt Expense $1 Q2 2014 Operating Profit $4 $ Millions Q2 2014 Q2 2013 Variance Net Sales $344 $319 $25 Operating Profit $4 $1 $3 Adjustments - - - Adjusted Operating Profit $4 $1 $3 DD&A $3 $3 - 13
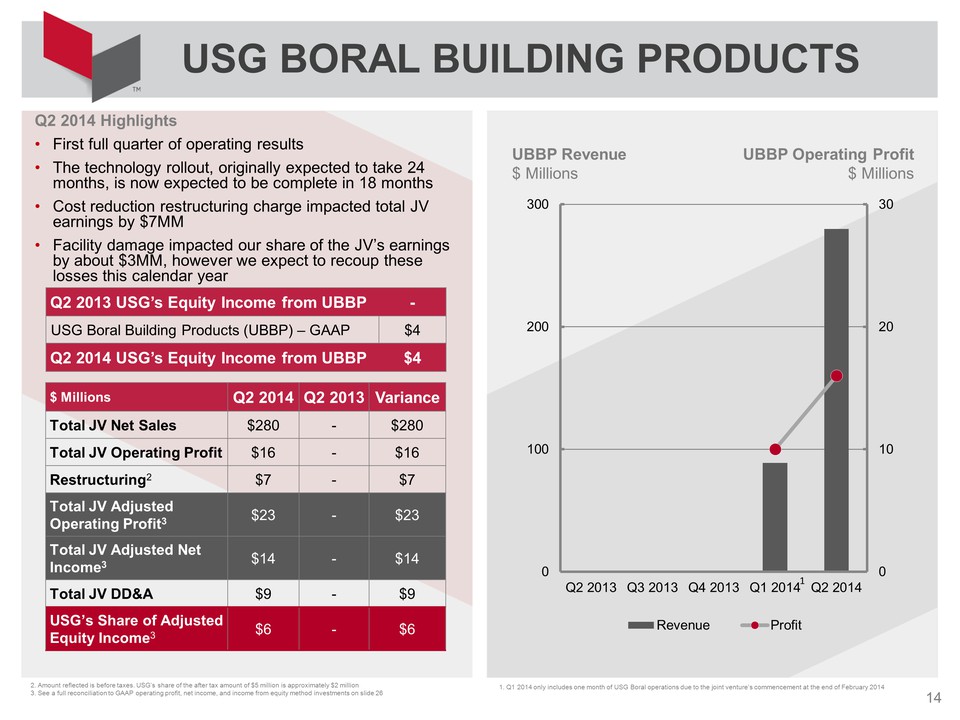
USG BORAL BUILDING PRODUCTS Q2 2014 Highlights First full quarter of operating results The technology rollout, originally expected to take 24 months, is now expected to be complete in 18 months Cost reduction restructuring charge impacted total JV earnings by $7MM Facility damage impacted our share of the JV’s earnings by about $3MM, however we expect to recoup these losses this calendar year UBBP Revenue $ Millions UBBP Operating Profit $ Millions 0 10 20 30 0 100 200 300 Q2 2013 Q3 2013 Q4 2013 Q1 2014 Q2 2014 Revenue Profit Q2 2013 USG’s Equity Income from UBBP - USG Boral Building Products (UBBP) – GAAP $4 Q2 2014 USG’s Equity Income from UBBP $4 $ Millions Q2 2014 Q2 2013 Variance Total JV Net Sales $280 - $280 Total JV Operating Profit $16 - $16 Restructuring2 $7 - $7 Total JV Adjusted Operating Profit3 $23 - $23 Total JV Adjusted Net Income3 $14 - $14 Total JV DD&A $9 - $9 USG’s Share of Adjusted Equity Income3 $6 - $6 1. Q1 2014 only includes one month of USG Boral operations due to the joint venture’s commencement at the end of February 2014 2. Amount reflected is before taxes. USG’s share of the after tax amount of $5 million is approximately $2 million 3. See a full reconciliation to GAAP operating profit, net income, and income from equity method investments on slide 26 14
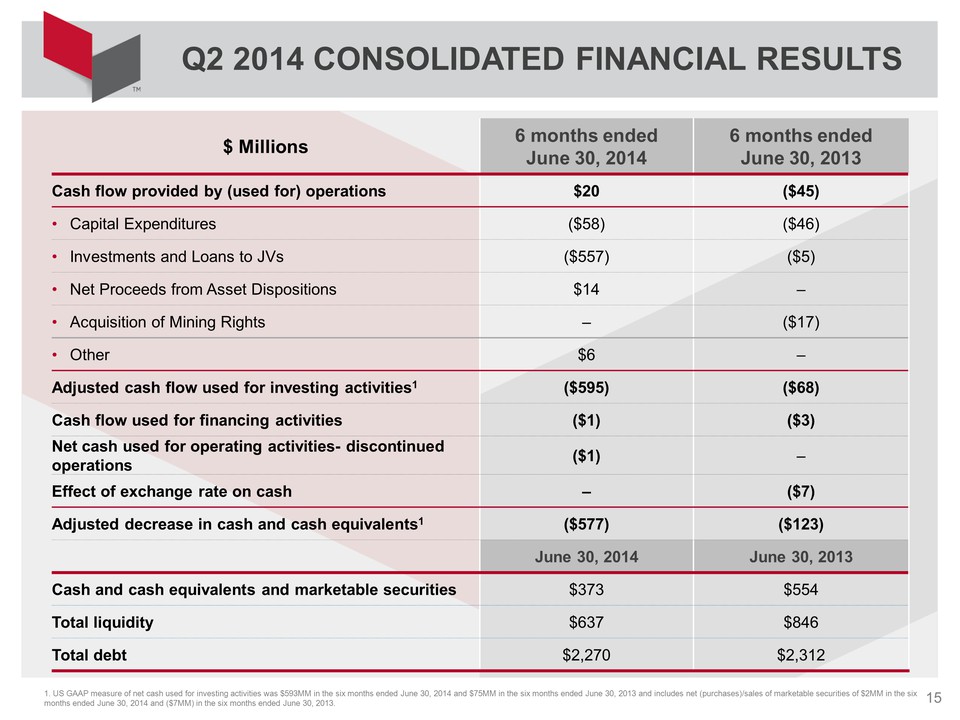
Q2 2014 CONSOLIDATED FINANCIAL RESULTS $ Millions 6 months ended June 30, 2014 6 months ended June 30, 2013 Cash flow provided by (used for) operations $20 ($45) Capital Expenditures ($58) ($46) Investments and Loans to JVs ($557) ($5) Net Proceeds from Asset Dispositions $14 – Acquisition of Mining Rights – ($17) Other $6 – Adjusted cash flow used for investing activities1 ($595) ($68) Cash flow used for financing activities ($1) ($3) Net cash used for operating activities- discontinued operations ($1) – Effect of exchange rate on cash – ($7) Adjusted decrease in cash and cash equivalents1 ($577) ($123) June 30, 2014 June 30, 2013 Cash and cash equivalents and marketable securities $373 $554 Total liquidity $637 $846 Total debt $2,270 $2,312 1. US GAAP measure of net cash used for investing activities was $593MM in the six months ended June 30, 2014 and $75MM in the six months ended June 30, 2013 and includes net (purchases)/sales of marketable securities of $2MM in the six months ended June 30, 2014 and ($7MM) in the six months ended June 30, 2013. 15
USG Corporation Second Quarter 2014 Agenda Overview and Strategy James S. Metcalf Chairman, President and CEO Financial Results Matthew F. Hilzinger Executive VP, Chief Financial Officer Building on the Recovery James S. Metcalf Chairman, President and CEO Questions Closing Remarks James S. Metcalf Chairman, President and CEO 16
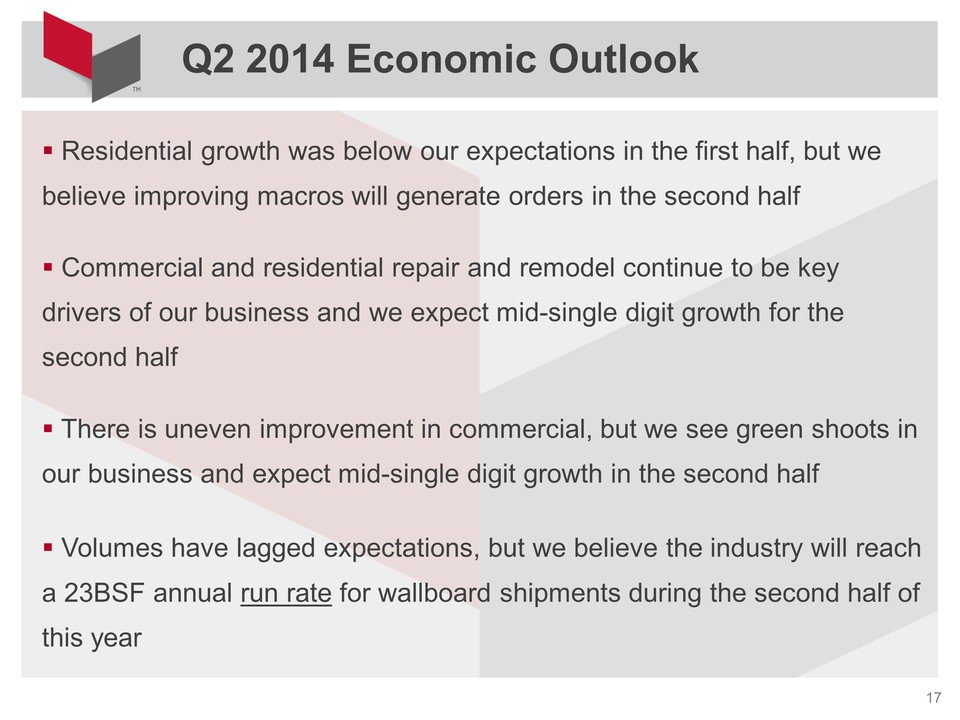
Q2 2014 Economic Outlook Residential growth was below our expectations in the first half, but we believe improving macros will generate orders in the second half Commercial and residential repair and remodel continue to be key drivers of our business and we expect mid-single digit growth for the second half There is uneven improvement in commercial, but we see green shoots in our business and expect mid-single digit growth in the second half Volumes have lagged expectations, but we believe the industry will reach a 23BSF annual run rate for wallboard shipments during the second half of this year 17
USG Corporation Second Quarter 2014 Agenda Overview and Strategy James S. Metcalf Chairman, President and CEO Financial Results Matthew F. Hilzinger Executive VP, Chief Financial Officer Building on the Recovery James S. Metcalf Chairman, President and CEO Questions Closing Remarks James S. Metcalf Chairman, President and CEO 18
USG Corporation Second Quarter 2014 Agenda Overview and Strategy James S. Metcalf Chairman, President and CEO Financial Results Matthew F. Hilzinger Executive VP, Chief Financial Officer Building on the Recovery James S. Metcalf Chairman, President and CEO Questions Closing Remarks James S. Metcalf Chairman, President and CEO 19
Non-GAAP Financial Measures In this presentation, the corporation’s financial results are provided both in accordance with accounting principles generally accepted in the United States of America (GAAP) and using certain non-GAAP financial measures. In particular, the corporation presents the non-GAAP financial measures adjusted EBITDA, adjusted operating profit, adjusted net income, adjusted equity income of USG Boral Building Products, or UBBP, and adjusted diluted earnings per share, which exclude certain items. In addition, adjusted operating profit on a consolidated basis includes the corporation’s equity method income from UBBP and USG’s other equity method investments, and adjusted EBITDA on a consolidated basis includes the corporation’s share of UBBP’s adjusted EBITDA. Further, management believes it is appropriate to exclude the indicated items from UBBP equity income because the resulting UBBP adjusted equity income can be used to evaluate the financial performance of UBBP. The non-GAAP financial measures are included as a complement to results provided in accordance with GAAP because management believes these non-GAAP financial measures help investors’ ability to analyze underlying trends in the corporation’s business, evaluate its performance relative to other companies in its industry and provide useful information to both management and investors by excluding certain items that may not be indicative of the corporation’s core operating results. Adjusted operating profit includes the adjusted equity method income from UBBP and USG’s income from other equity investments and adjusted EBITDA includes the corporation’s share of UBBP’s adjusted EBITDA because management views UBBP and its other equity investments as important businesses. In addition, the corporation uses adjusted operating profit and adjusted net income as components in the measurement of incentive compensation. The non- GAAP measures should not be considered a substitute for or superior to GAAP results and may vary from others in the industry. For further information related to the corporation’s use of non- GAAP financial measures, see the schedules attached hereto. 20
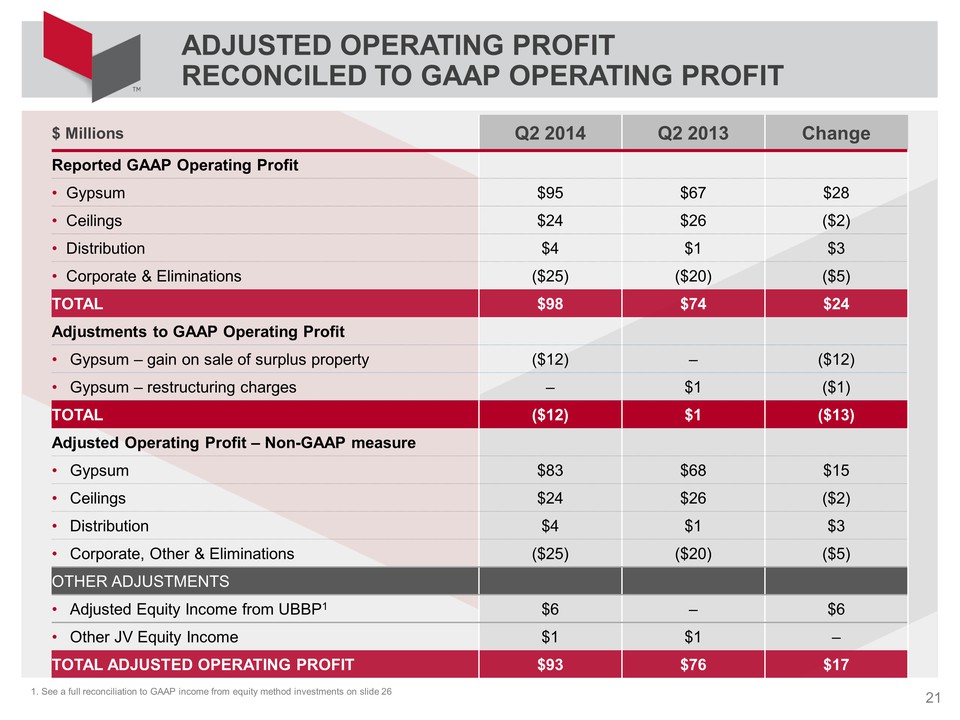
ADJUSTED OPERATING PROFIT RECONCILED TO GAAP OPERATING PROFIT $ Millions Q2 2014 Q2 2013 Change Reported GAAP Operating Profit Gypsum $95 $67 $28 Ceilings $24 $26 ($2) Distribution $4 $1 $3 Corporate & Eliminations ($25) ($20) ($5) TOTAL $98 $74 $24 Adjustments to GAAP Operating Profit Gypsum – gain on sale of surplus property ($12) – ($12) Gypsum – restructuring charges – $1 ($1) TOTAL ($12) $1 ($13) Adjusted Operating Profit – Non-GAAP measure Gypsum $83 $68 $15 Ceilings $24 $26 ($2) Distribution $4 $1 $3 Corporate, Other & Eliminations ($25) ($20) ($5) OTHER ADJUSTMENTS Adjusted Equity Income from UBBP1 $6 – $6 Other JV Equity Income $1 $1 – TOTAL ADJUSTED OPERATING PROFIT $93 $76 $17 1. See a full reconciliation to GAAP income from equity method investments on slide 26 21
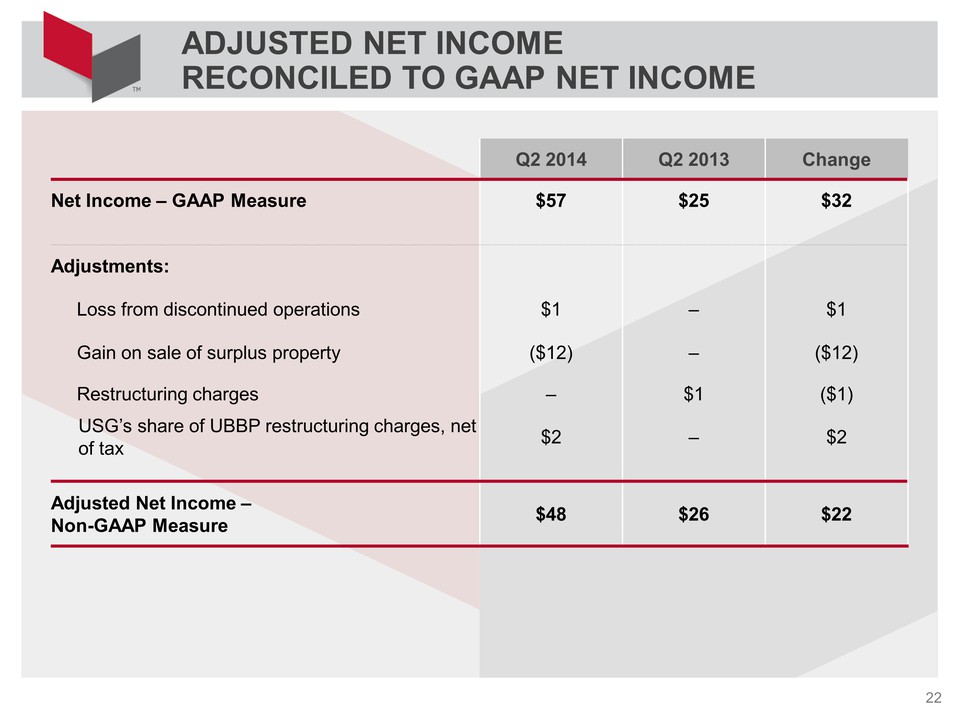
ADJUSTED NET INCOME RECONCILED TO GAAP NET INCOME Q2 2014 Q2 2013 Change Net Income – GAAP Measure $57 $25 $32 Adjustments: Loss from discontinued operations $1 – $1 Gain on sale of surplus property ($12) – ($12) Restructuring charges – $1 ($1) USG’s share of UBBP restructuring charges, net of tax $2 – $2 Adjusted Net Income – Non-GAAP Measure $48 $26 $22 22
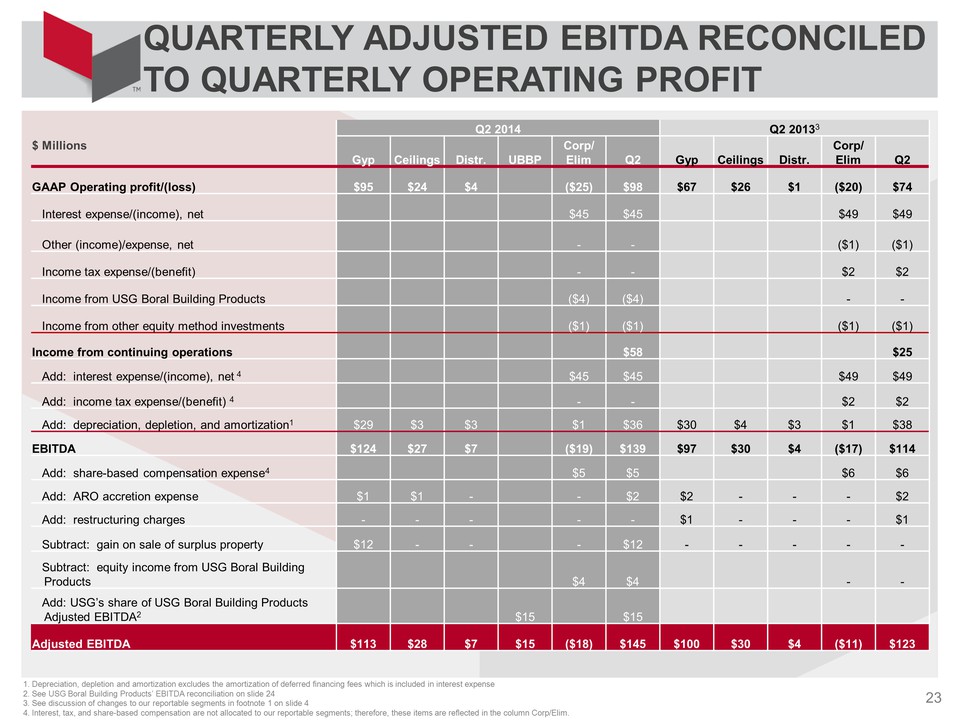
QUARTERLY ADJUSTED EBITDA RECONCILED TO QUARTERLY OPERATING PROFIT Q2 2014 Q2 20133 $ Millions Gyp Ceilings Distr. UBBP Corp/Elim Q2 Gyp Ceilings Distr. Corp/Elim Q2 GAAP Operating profit/(loss) $95 $24 $4 ($25) $98 $67 $26 $1 ($20) $74 Interest expense/(income), net $45 $45 $49 $49 Other (income)/expense, net - - ($1) ($1) Income tax expense/(benefit) - - $2 $2 Income from USG Boral Building Products ($4) ($4) - - Income from other equity method investments ($1) ($1) ($1) ($1) Income from continuing operations $58 $25 Add: interest expense/(income), net 4 $45 $45 $49 $49 Add: income tax expense/(benefit) 4 - - $2 $2 Add: depreciation, depletion, and amortization1 $29 $3 $3 $1 $36 $30 $4 $3 $1 $38 EBITDA $124 $27 $7 ($19) $139 $97 $30 $4 ($17) $114 Add: share-based compensation expense4 $5 $5 $6 $6 Add: ARO accretion expense $1 $1 - - $2 $2 - - - $2 Add: restructuring charges - - - - - $1 - - - $1 Subtract: gain on sale of surplus property $12 - - - $12 - - - - - Subtract: equity income from USG Boral Building Products $4 $4 - - Add: USG’s share of USG Boral Building Products Adjusted EBITDA2 $15 $15 Adjusted EBITDA $113 $28 $7 $15 ($18) $145 $100 $30 $4 ($11) $123 1. Depreciation, depletion and amortization excludes the amortization of deferred financing fees which is included in interest expense 2. See USG Boral Building Products’ EBITDA reconciliation on slide 24 3. See discussion of changes to our reportable segments in footnote 1 on slide 4 4. Interest, tax, and share-based compensation are not allocated to our reportable segments; therefore, these items are reflected in the column Corp/Elim. 23
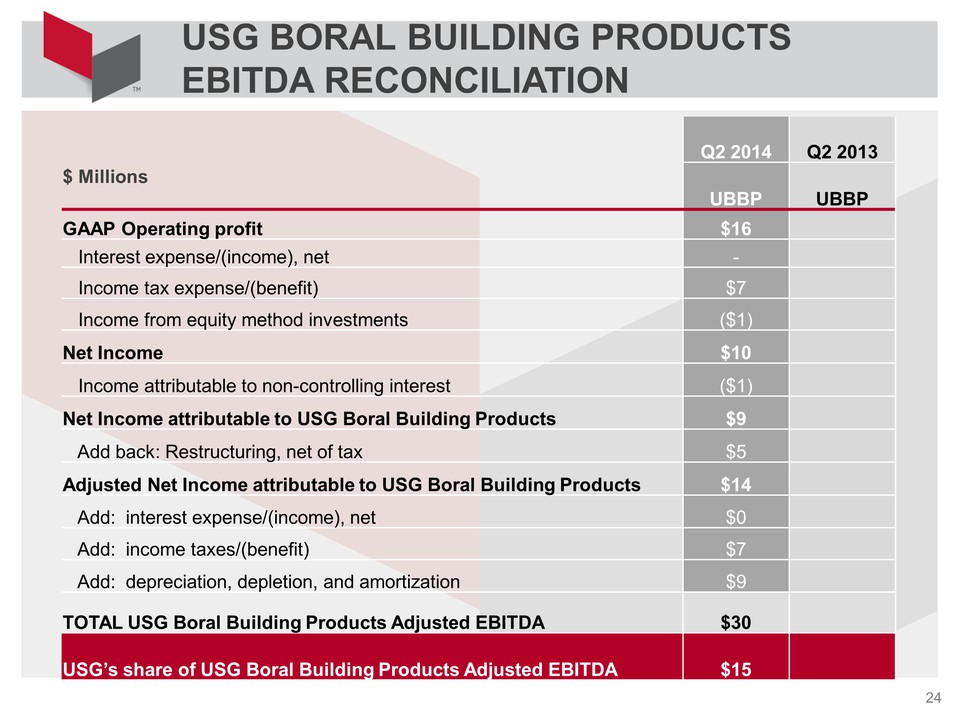
USG BORAL BUILDING PRODUCTS EBITDA RECONCILIATION Q2 2014 Q2 2013 $ Millions UBBP UBBP GAAP Operating profit $16 Interest expense/(income), net - Income tax expense/(benefit) $7 Income from equity method investments ($1) Net Income $10 Income attributable to non-controlling interest ($1) Net Income attributable to USG Boral Building Products $9 Add back: Restructuring, net of tax $5 Adjusted Net Income attributable to USG Boral Building Products $14 Add: interest expense/(income), net $0 Add: income taxes/(benefit) $7 Add: depreciation, depletion, and amortization $9 TOTAL USG Boral Building Products Adjusted EBITDA $30 USG’s share of USG Boral Building Products Adjusted EBITDA $15 24
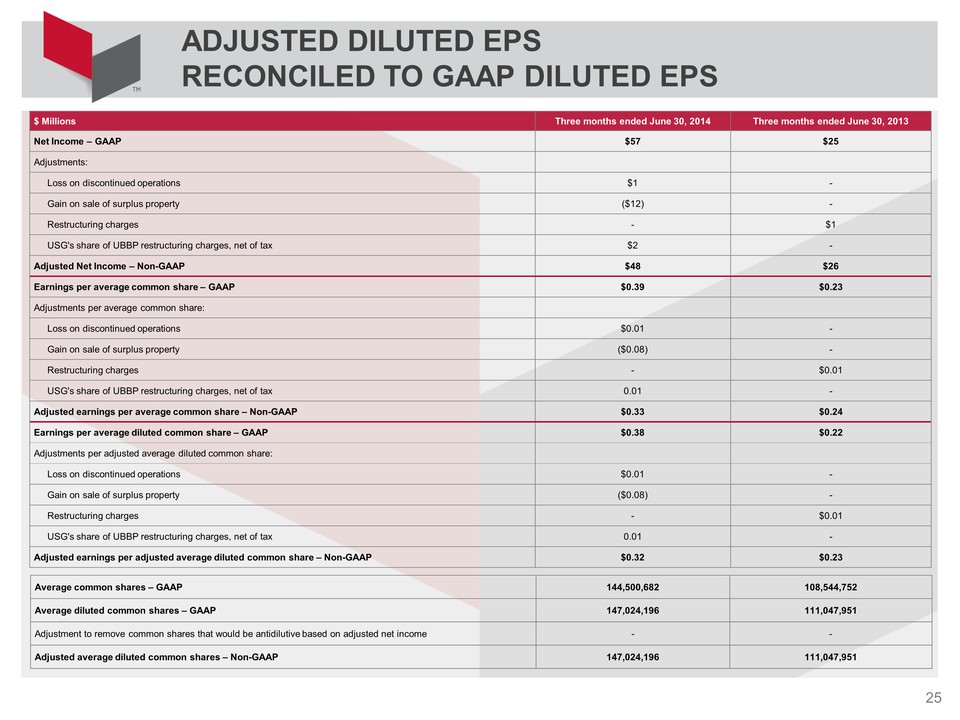
ADJUSTED DILUTED EPS RECONCILED TO GAAP DILUTED EPS $ Millions Three months ended June 30, 2014 Three months ended June 30, 2013 Net Income – GAAP $57 $25 Adjustments: Loss on discontinued operations $1 - Gain on sale of surplus property ($12) - Restructuring charges - $1 USG's share of UBBP restructuring charges, net of tax $2 - Adjusted Net Income – Non-GAAP $48 $26 Earnings per average common share – GAAP $0.39 $0.23 Adjustments per average common share: Loss on discontinued operations $0.01 - Gain on sale of surplus property ($0.08) - Restructuring charges - $0.01 USG's share of UBBP restructuring charges, net of tax 0.01 - Adjusted earnings per average common share – Non-GAAP $0.33 $0.24 Earnings per average diluted common share – GAAP $0.38 $0.22 Adjustments per adjusted average diluted common share: Loss on discontinued operations $0.01 - Gain on sale of surplus property ($0.08) - Restructuring charges - $0.01 USG's share of UBBP restructuring charges, net of tax 0.01 - Adjusted earnings per adjusted average diluted common share – Non-GAAP $0.32 $0.23 Average common shares – GAAP 144,500,682 108,544,752 Average diluted common shares – GAAP 147,024,196 111,047,951 Adjustment to remove common shares that would be antidilutive based on adjusted net income - - Adjusted average diluted common shares – Non-GAAP 147,024,196 111,047,951 25
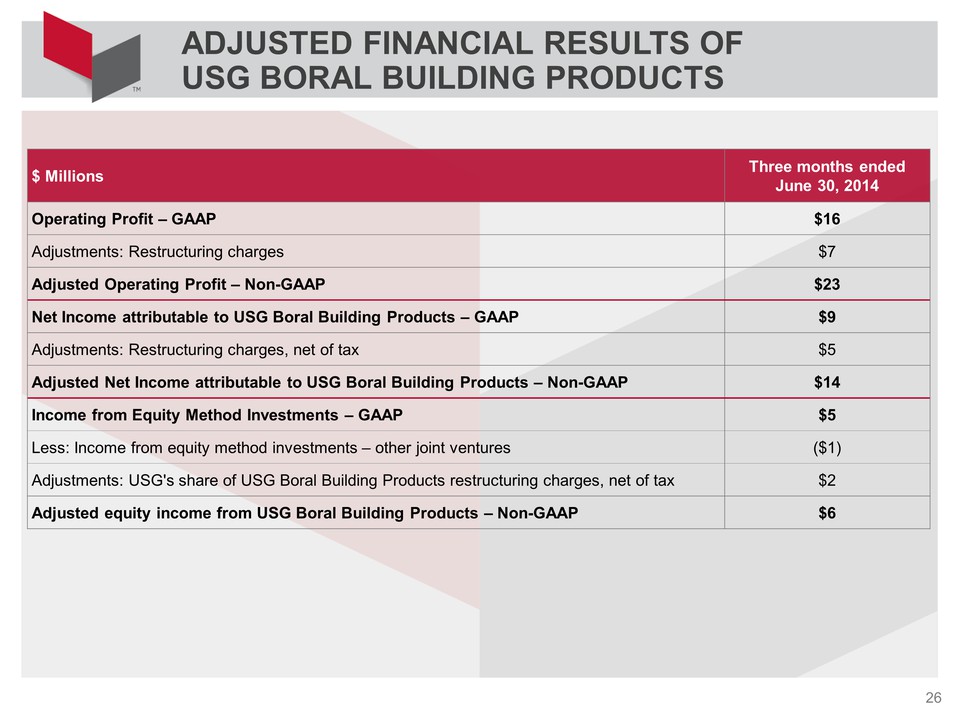
ADJUSTED FINANCIAL RESULTS OF USG BORAL BUILDING PRODUCTS $ Millions Three months ended June 30, 2014 Operating Profit – GAAP $16 Adjustments: Restructuring charges $7 Adjusted Operating Profit – Non-GAAP $23 Net Income attributable to USG Boral Building Products – GAAP $9 Adjustments: Restructuring charges, net of tax $5 Adjusted Net Income attributable to USG Boral Building Products – Non-GAAP $14 Income from Equity Method Investments – GAAP $5 Less: Income from equity method investments – other joint ventures ($1) Adjustments: USG's share of USG Boral Building Products restructuring charges, net of tax $2 Adjusted equity income from USG Boral Building Products – Non-GAAP $6 26