Attached files
| file | filename |
|---|---|
| 8-K - FORM 8-K - Blackstone Group Inc | d757301d8k.htm |
| EX-99.1 - EX-99.1 - Blackstone Group Inc | d757301dex991.htm |
 Blackstone’s Second Quarter 2014 Earnings
July 17, 2014
Exhibit 99.2 |
 Blackstone
1
“Blackstone’s singular focus on fund investment returns
ultimately drives outperformance for our unitholders.
Record results across the Blackstone platform continue
to demonstrate that.”
Stephen A. Schwarzman
Chairman and Founder |
 Blackstone
2
Blackstone’s Second Quarter 2014 Highlights
Blackstone had its best second quarter and first half of the year on strong
performance across all of its funds, driving record financial returns and
asset levels. Economic Net Income (“ENI”) was $1.3 billion
($1.15/unit) for the quarter, up 89% from last year, as Blackstone’s
funds created $9.3 billion of value in the second quarter alone. •
BCP V crossed the preferred return threshold and generated $509 million in
Performance Fees during the second
quarter
with
$5.8
billion
of
realizations
year-to-date.
Distributable Earnings (“DE”) more than doubled in the quarter
year-over-year on a record level of realizations, bringing the
year-to-date total to $1.3 billion ($1.06/unit). GAAP
Net
Income
was
$517
million
for
the
quarter,
net
of
certain
non-cash
IPO
and
transaction
related
expenses and exclusive of net income attributable to non-controlling
interests, primarily inside ownership. Total Assets Under Management
(“AUM”) reached a record $279 billion, up 21% year-over-year despite
returning $50.0 billion of capital to investors over the last twelve months
(“LTM”). •
Gross inflows were $14.5 billion for the quarter and $62.4 billion LTM on record
organic inflows. •
Blackstone’s unmatched portfolio of funds and assets created $37.0 billion
of value LTM. Across Blackstone’s diverse platform, $20.3 billion of
capital was invested LTM, up 31%; investments outside North
America reached 44%, reflecting unique access to global fund mandates and
platforms. |
 3
Blackstone’s Second Quarter 2014 Earnings
% Change
% Change
(Dollars in Thousands, Except per Unit Data)
2Q'13
2Q'14
vs. 2Q'13
YTD'13
YTD'14
vs. YTD'13
Fee Revenues
616,515
$
662,550
$
7%
1,137,398
$
1,275,888
$
12%
Performance Fees
719,219
1,398,438
94%
1,323,218
2,177,452
65%
Investment Income
97,119
175,971
81%
231,890
292,438
26%
Total Revenues
1,432,853
$
2,236,959
$
56%
2,692,506
$
3,745,778
$
39%
Total Expenses
713,461
885,964
24%
1,334,777
1,569,537
18%
Taxes
16,152
25,032
55%
26,183
36,344
39%
Economic Net Income (“ENI”)
703,240
$
1,325,963
$
89%
1,331,546
$
2,139,897
$
61%
ENI per Unit
0.62
$
1.15
$
85%
1.17
$
1.85
$
58%
GAAP Net Income
211,148
$
517,016
$
145%
378,783
$
782,633
$
107%
Fee Related Earnings (“FRE”)
168,434
$
201,108
$
19%
306,167
$
375,937
$
23%
Distributable Earnings (“DE”)
338,485
$
770,797
$
128%
729,397
$
1,255,909
$
72%
DE per Common Unit
0.28
$
0.65
$
132%
0.62
$
1.06
$
71%
Total Assets Under Management
229,571,741
278,917,713
21%
229,571,741
278,917,713
21%
Fee-Earning Assets Under Management
176,338,947
209,913,760
19%
176,338,947
209,913,760
19%
Blackstone |
 4
Walkdown of Financial Metrics
(Dollars in Thousands, Except per Unit Data)
2Q'14
YTD'14
Results
Per Unit
Results
Per Unit
Base Management Fees
496,570
$
973,448
$
Advisory Fees
114,914
184,877
Transaction and Other Fees, Net
49,196
109,106
Management Fee Offsets
(20,218)
(36,862)
Interest Income and Other Revenue
28,772
59,813
Compensation
(323,015)
(629,560)
Other Operating Expenses
(145,111)
(284,885)
Fee Related Earnings
201,108
$
0.18
$
375,937
$
0.33
$
Net Realized Incentive Fees
20,782
50,984
Net Realized Carried Interest
381,358
565,583
Net Realized Investment Income
201,140
311,713
Taxes and Related Payables
(44,841)
(75,895)
Equity-Based Compensation
11,250
27,587
Distributable Earnings
770,797
$
0.65
$
1,255,909
$
1.06
$
Net Unrealized Incentive Fees
32,084
69,819
Net Unrealized Carried Interest
546,376
835,974
Net Unrealized Investment Loss
(31,853)
(33,769)
Add Back: Related Payables
19,809
39,551
Less: Equity-Based Compensation
(11,250)
(27,587)
Economic Net Income
1,325,963
$
1.15
$
2,139,897
$
1.85
$
Blackstone
See page 30, Walkdown of Financial Metrics – Calculation of Certain Non-GAAP Financial
Metric Components for the calculation of the amounts presented herein that are not the respective
captions on page 19, Total Segments. 2Q’14 Fee Related Earnings per Unit is based on
1,141,345,729 DE Units Outstanding; DE per Unit is based on 603,270,771 Total Common Units Outstanding; and ENI
per Unit is based on 1,154,055,961 Weighted-Average ENI Adjusted Units (see page 31, Unit
Rollforward). |
 Blackstone
5
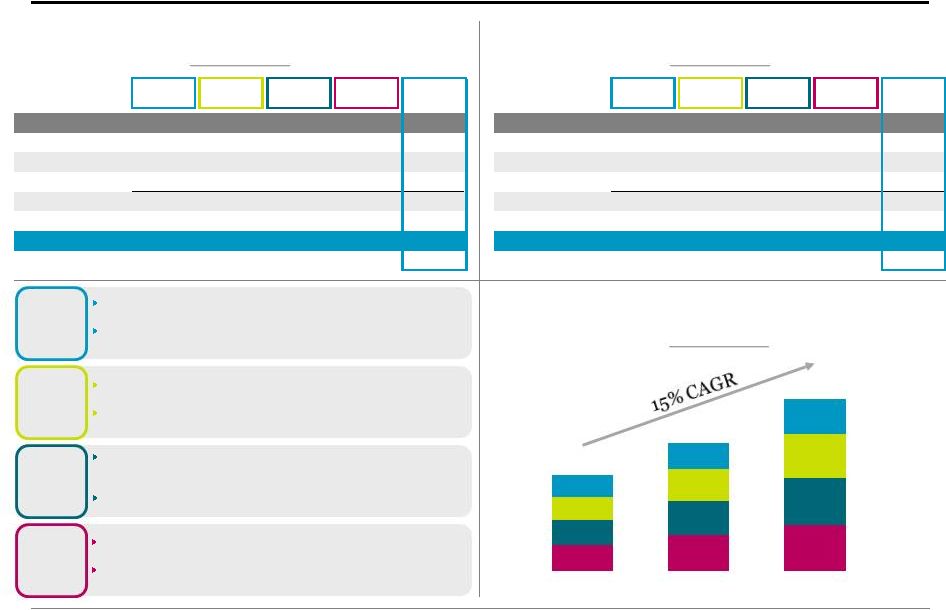
Private Equity
8.4%
2Q’14 increase in fund carrying value
$212 million
2Q’14 Realized Performance Fees
$1.12 per unit
2Q’14 Net Accrued Performance Fees
Blackstone’s portfolio company operating approach drove results to record
levels and segment appreciation outperformed
the
broader
equity
markets
with
8.4%
appreciation
during
the
quarter
and 28.3%
LTM.
Total Revenues up 164% to $939 million for the quarter and Economic Income up 278%
to $648 million. BCP V appreciated 10.5% during the quarter and crossed the
preferred return hurdle. •
Net Accrued Performance Fees for BCP V reached $558 million; up 296% from the
prior quarter. Realization activity remains robust with $4.2 billion of
proceeds on ten transactions during the quarter and $14.8
billion on 42 transactions LTM.
Continued
strong
investment
activity
with
$2.2
billion
of
total
capital
invested
during
the
quarter
and
$6.3
billion
LTM as Private Equity continues to utilize its global platform to find
value. Strategic Partners’
sixth secondary fund of funds has closed on $3.2 billion of total capital with a
$4.4 billion target as the business continues to leverage synergies across
the Blackstone platform in its first year. % Change
% Change
(Dollars in Thousands)
2Q'13
2Q'14
vs. 2Q'13
YTD'13
YTD'14
vs. YTD'13
Fee Revenues
126,636
$
131,804
$
4%
240,263
$
277,614
$
16%
Performance Fees
186,825
714,604
282%
242,763
1,001,474
313%
Investment Income
42,674
92,474
117%
98,547
143,976
46%
Total Revenues
356,135
938,882
164%
581,573
1,423,064
145%
Compensation
63,747
73,038
15%
123,950
146,345
18%
Performance Fee Compensation
88,988
178,914
101%
121,853
237,537
95%
Other Operating Expenses
32,178
39,193
22%
61,346
72,199
18%
Total Expenses
184,913
291,145
57%
307,149
456,081
48%
Economic Income
171,222
$
647,737
$
278%
274,424
$
966,983
$
252%
Total AUM
53,287,294
$
68,294,162
$
28%
53,287,294
$
68,294,162
$
28%
Fee-Earning AUM
36,635,224
$
42,888,756
$
17%
36,635,224
$
42,888,756
$
17% |
 Blackstone
6
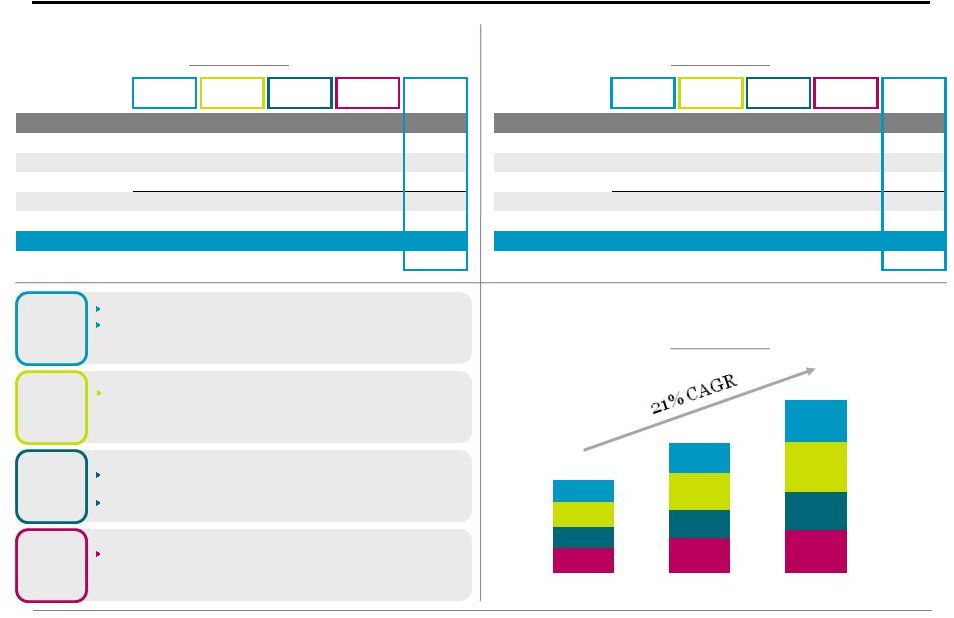
Real Estate
6.0%
2Q’14 increase in fund carrying value
$424 million
2Q’14 Realized Performance Fees
Economic Income rose 32% to $489 million in the second quarter, reflecting strong
global Real Estate fundamentals, including improving rents and occupancy
across Blackstone’s diversified real estate portfolio. Opportunistic
Real Estate funds’ carrying value appreciated 6.0% for the quarter and
28.3% LTM. Record realization quarter, with $6.7 billion of proceeds,
driven by partial realizations in Hilton and Brixmor. •
Net Accrued Performance Fees up 10% from prior quarter to $2.7 billion despite
significant realizations. •
70% of unrealized gains are in public equities and liquidating office
portfolios. Raised $2.0 billion of capital during the quarter, including
$1.0 billion for the Asia fund, $226 million for Core+ and $858 million in
debt strategies. Invested $3.1 billion of total capital during the quarter,
and $11.6 billion LTM. •
An
additional
$2.5
billion
was
committed
not
yet
deployed
at
the
end
of
the
quarter,
which
included
several
scale investments that Blackstone was uniquely positioned to execute.
Blackstone’s
commercial
mortgage
REIT,
BXMT,
finished
the
quarter
with
a $1.4
billion
market
capitalization,
up
from $80 million at the time of its May 2013 re-IPO.
$2.33 per unit
2Q’14 Net Accrued Performance Fees
% Change
% Change
(Dollars in Thousands)
2Q'13
2Q'14
vs. 2Q'13
YTD'13
YTD'14
vs. YTD'13
Fee Revenues
153,823
$
171,472
$
11%
298,188
$
341,575
$
15%
Performance Fees
402,276
539,874
34%
756,617
877,480
16%
Investment Income
49,213
72,227
47%
119,050
108,963
(8)%
Total Revenues
605,312
783,573
29%
1,173,855
1,328,018
13%
Compensation
73,792
85,582
16%
143,251
165,815
16%
Performance Fee Compensation
133,013
172,079
29%
250,691
282,263
13%
Other Operating Expenses
27,617
36,542
32%
56,079
69,649
24%
Total Expenses
234,422
294,203
26%
450,021
517,727
15%
Economic Income
370,890
$
489,370
$
32%
723,834
$
810,291
$
12%
Total AUM
63,919,906
$
80,410,988
$
26%
63,919,906
$
80,410,988
$
26%
Fee-Earning AUM
43,635,493
$
52,823,975
$
21%
43,635,493
$
52,823,975
$
21% |
 Blackstone
7
Hedge Fund Solutions
Total Revenues of $166 million for the quarter, up 20% year-over-year,
driven by an increase in Fee-Earning AUM on organic inflows and fund
appreciation. BAAM’s Principal Solutions Composite was up gross 2.0%
for the quarter and 10.6% LTM. Fee-Earning AUM grew by $10.5 billion,
or 22% year-over-year, to $58.1 billion; July 1 subscriptions of
$873
million are not yet included in Fee-Earning AUM.
•
BAAM held an additional closing for its first permanent capital vehicle acquiring
general partner interests in hedge funds, bringing total commitments to
$2.3 billion. •
BAAM launched its second alternative investment-focused 1940 Act mutual fund
for the retail market (Blackstone Alternative Multi-Strategy Fund) on
June 17, raising $300 million of capital in the second quarter. BAAM now
manages $1.5 billion of capital in its 1940 Act mutual funds. 2.0%
2Q’14 Gross Composite Return
$31.3 billion
Incentive Fee Eligible AUM at 2Q’14
$3.4 billion
2Q’14 Fee-Earning Gross Inflows
BAAM’s Principal Solutions Composite does not include BAAM’s long-only equity,
long-biased commodities, seed, strategic opportunities (external investments) and
advisory platforms. On a net of fees basis, the BAAM Principal Solutions Composite was up 1.8% for the quarter and 9.3% LTM.
% Change
% Change
(Dollars in Thousands)
2Q'13
2Q'14
vs. 2Q'13
YTD'13
YTD'14
vs. YTD'13
Fee Revenues
101,084
$
123,740
$
22%
194,856
$
238,545
$
22%
Performance Fees
34,834
38,529
11%
104,044
96,459
(7)%
Investment Income
1,614
3,451
114%
6,379
24,702
287%
Total Revenues
137,532
165,720
20%
305,279
359,706
18%
Compensation
36,844
43,341
18%
70,712
83,912
19%
Performance Fee Compensation
12,782
14,170
11%
37,640
34,202
(9)%
Other Operating Expenses
16,535
25,101
52%
31,694
44,581
41%
Total Expenses
66,161
82,612
25%
140,046
162,695
16%
Economic Income
71,371
$
83,108
$
16%
165,233
$
197,011
$
19%
Total AUM
50,128,028
$
60,672,759
$
21%
50,128,028
$
60,672,759
$
21%
Fee-Earning AUM
47,572,465
$
58,084,020
$
22%
47,572,465
$
58,084,020
$
22% |
 Blackstone
8
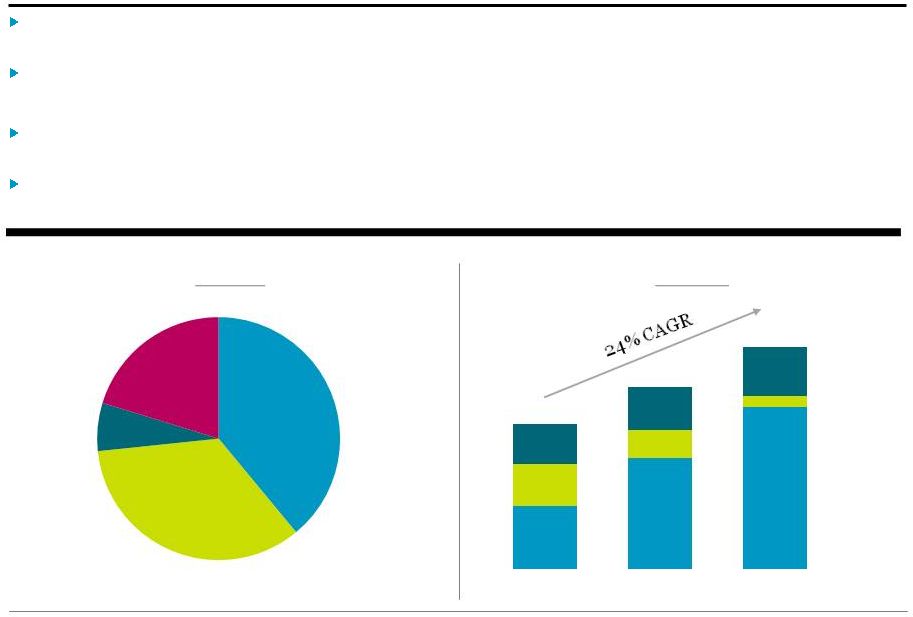
Credit
$69.5 billion
2Q’14 Total AUM
Investment Performance
Gross Returns
CLOs
Customized Credit
Strategies
Mezzanine
Funds
Rescue
Lending
Funds
Hedge Fund
Strategies
Strong performance across GSO’s diversified platform generated Economic
Income of $104
million in the quarter, up 27% year-over-year.
Fee-Earning AUM grew 16% LTM to $56.1 billion due to robust net inflows
across the platform and several new fund launches despite a heavy pace of
capital returned to investors in the drawdown funds and CLOs.
•
Launched three CLOs during the quarter (two U.S. and one European),
raising $1.9 billion in Fee-Earning AUM.
Invested $374 million of total capital during the quarter, bringing total
capital invested to $1.7 billion LTM, of which nearly half was invested in
Europe, where GSO is well positioned to capitalize on investment
opportunities.
% Change
% Change
(Dollars in Thousands)
2Q'13
2Q'14
vs. 2Q'13
YTD'13
YTD'14
vs. YTD'13
Fee Revenues
112,391
$
117,717
$
5%
212,932
$
227,985
$
7%
Performance Fees
95,284
105,431
11%
219,794
202,039
(8)%
Investment Income
5,282
6,744
28%
9,703
12,894
33%
Total Revenues
212,957
229,892
8%
442,429
442,918
0%
Compensation
55,941
51,310
(8)%
101,462
102,062
1%
Performance Fee Compensation
52,049
52,675
1%
116,543
101,090
(13)%
Other Operating Expenses
22,961
22,159
(3)%
43,923
54,998
25%
Total Expenses
130,951
126,144
(4)%
261,928
258,150
(1)%
Economic Income
82,006
$
103,748
$
27%
180,501
$
184,768
$
2%
Total AUM
62,236,513
$
69,539,804
$
12%
62,236,513
$
69,539,804
$
12%
Fee-Earning AUM
48,495,765
$
56,117,009
$
16%
48,495,765
$
56,117,009
$
16%
2Q'14
2Q'14 LTM
Hedge Fund
Strategies
2.1%
16.9%
Mezzanine
Funds
3.9%
16.3%
Rescue
Lending Funds
5.3%
31.3%
$7.7
$8.7
$9.3
$23.5
$20.4
Investment Performance represents weighted-average performance of the assets of the
respective flagship funds within each strategy as of June 30, 2014. Hedge Fund Strategies
net returns were 1.4% for 2Q’14 and 12.4% for 2Q’14 LTM, Mezzanine Funds net returns
were 2.8% for 2Q’14 and 11.0% for 2Q’14 LTM and Rescue Lending Funds net returns were
4.7% for 2Q’14 and 24.8% for 2Q’14 LTM. Customized Credit Strategies includes
business development companies (“BDCs”), closed-end funds, commingled funds, the exchange
traded fund and separately managed accounts. |
 Blackstone
9
Financial Advisory
Blackstone Advisory Partners year-to-date revenues increased 41% compared
to the prior year on increased merger and acquisition activity as a number
of deals closed in the second quarter throughout a diversified group of
industries (financial institutions, energy, industrials and technology) and
geographies. Blackstone Capital Markets was up substantially
year-over-year on increased underwritings and contributed
meaningfully to the growth in profitability of the Financial Advisory
segment. Restructuring revenues decreased compared to the prior year
quarter, which was the strongest quarter of 2013, reflecting fewer deal
closings, although the pipeline remains steady across a diverse group of industries.
Park Hill’s quarterly and year-to-date revenues were up
significantly and the pipeline remains strong due to demand for
alternative asset placement services. % Change
% Change
(Dollars in Thousands)
2Q'13
2Q'14
vs. 2Q'13
YTD'13
YTD'14
vs. YTD'13
Fee Revenues
122,581
117,817
(4)%
191,159
190,169
(1)%
Investment Income (Loss)
(1,664)
1,075
n/m
(1,789)
1,903
n/m
Total Revenues
120,917
118,892
(2)%
189,370
192,072
1%
Compensation
76,153
69,744
(8)%
134,079
131,426
(2)%
Other Operating Expenses
20,861
22,116
6%
41,554
43,458
5%
Total Expenses
97,014
91,860
(5)%
175,633
174,884
(0)%
Economic Income
23,903
$
27,032
$
13%
13,737
$
17,188
$
25% |
 Fee-Earning
Assets Under Management $176.3
$209.9
Private Equity
Real Estate
Hedge Fund
Solutions
Credit
$43.6
$47.6
$48.5
$157.6
$36.6
$38.5
$40.2
$41.8
$37.2
Blackstone
10
2Q'12
2Q'13
2Q'14
$56.1
$58.1
$52.8
$42.9
2Q’14 Fee-Earning AUM Rollforward (Dollars in
Millions) LTM Fee-Earning AUM Rollforward
(Dollars in Millions)
Fee-Earning AUM by Segment
(Dollars in Billions)
Inflows include contributions, capital raised, other increases in available
capital, purchases and acquisitions. Outflows represent redemptions, client withdrawals and
other decreases in available capital. Realizations represent realizations from the disposition
of assets. Market Activity represents gains (losses) on portfolio investments and
impact of foreign exchange rate fluctuations.
Private
Real
Hedge Fund
Equity
Estate
Solutions
1Q'14
41,151
$
53,491
$
55,571
$
53,387
$
203,600
$
Inflows
3,459
2,387
3,442
5,309
14,597
Outflows
(602)
(68)
(1,991)
(831)
(3,491)
Realizations
(1,384)
(2,971)
(9)
(2,086)
(6,449)
Net Inflows (Outflows)
1,474
(652)
1,443
2,391
4,656
Market Activity
264
(15)
1,070
339
1,658
2Q'14
42,889
$
52,824
$
58,084
$
56,117
$
209,914
$
QoQ Increase (Decrease)
4%
(1)%
5%
5%
3%
Credit
Total
Private
Real
Hedge Fund
Equity
Estate
Solutions
2Q'13
36,635
$
43,635
$
47,572
$
48,496
$
176,339
$
Inflows
12,451
15,962
10,986
15,983
55,382
Outflows
(1,337)
(1,376)
(4,842)
(2,933)
(10,489)
Realizations
(5,318)
(5,530)
(475)
(7,540)
(18,862)
Net Inflows
5,797
9,056
5,669
5,510
26,031
Market Activity
457
133
4,843
2,112
7,544
2Q'14
42,889
$
52,824
$
58,084
$
56,117
$
209,914
$
YoY Increase
17%
21%
22%
16%
19%
Credit
Total
Inflows:
Asia
fund
$1.0
billion;
Core+
$226
million;
BREDS
capital raised and/or invested $1.0 billion.
Realizations:
Primarily
from
the
partial
sale
of
public
market
holdings
(Hilton and Brixmor).
Inflows:
$1.3
billion
in
specialized
solutions;
$1.1
billion
in
customized solutions; $561 million in commingled products;
$464 million in individual investor solutions.
Outflows:
$2.0
billion
of
redemptions
reflecting
seasonally
higher
activity in the commingled funds.
Inflows:
$787
million
in
Hedge
Fund
Strategies;
$1.9
billion
in
three
new CLO launches; $1.4 billion in BDCs.
Realizations
/
Outflows:
$1.7
billion
returned
to
CLO
investors;
$340 million returned across Mezzanine and Rescue Lending funds.
Inflows:
Strategic
Partners
VI
investment
period
commencement
with $3.1 billion of third party capital.
Realizations:
Primarily
BCP
V,
including
two
strategic
sales and four
partial public market dispositions (Hilton, PBF, SeaWorld and Nielsen).
Private
Equity
Real
Estate
Hedge
Fund
Solutions
Credit |
 Blackstone
11
Total Assets Under Management
2Q’14 Total AUM Rollforward
(Dollars in Millions)
LTM Total AUM Rollforward
(Dollars in Millions)
Private Equity
Real Estate
Hedge Fund
Solutions
Credit
Total AUM by Segment
(Dollars in Billions)
Private
Real
Hedge Fund
Equity
Estate
Solutions
1Q'14
66,143
$
81,334
$
58,263
$
66,006
$
Inflows
2,737
2,478
3,308
6,016
Outflows
(344)
(97)
(1,999)
(887)
Realizations
(4,166)
(6,927)
(11)
(2,277)
Net Inflows (Outflows)
(1,774)
(4,547)
1,298
2,852
Market Activity
3,925
3,624
1,113
682
2Q'14
68,294
$
80,411
$
60,673
$
69,540
$
QoQ Increase (Decrease)
3%
(1)%
4%
5%
Credit
Total
271,746
$
14,538
(3,328)
(13,381)
(2,171)
9,343
278,918
$
3%
Inflows:
Additional
close
of
general
partner
interests
vehicle
with
$2.3
billion
in
total
commitments.
Market
Activity:
BAAM’s
Principal
Solutions
Composite
up 2.0%
gross.
Private
Equity
Real
Estate
Hedge
Fund
Solutions
Credit
$190.3
$50.2
$42.9
$50.5
$46.6
$229.6
$63.9
$50.1
$62.2
$53.3
$278.9
$68.3
$80.4
$60.7
$69.5
2Q'12
2Q'13
2Q'14
Private
Real
Hedge Fund
Equity
Estate
Solutions
2Q'13
53,287
$
63,920
$
50,128
$
62,237
$
229,572
$
Inflows
17,755
16,549
11,073
17,002
62,378
Outflows
(756)
(1,150)
(4,983)
(3,661)
(10,551)
Realizations
(14,823)
(14,006)
(644)
(9,990)
(39,463)
Net Inflows
2,175
1,393
5,446
3,350
12,364
Market Activity
12,831
15,098
5,099
3,953
36,982
2Q'14
68,294
$
80,411
$
60,673
$
69,540
$
278,918
$
YoY Increase
28%
26%
21%
12%
21%
Credit
Total
Inflows:
Strategic
Partners
additional
capital
raised
of
$1.7
billion.
Market
Activity:
Overall
increase
of
8.4%
in
carrying
value,
driven by
public portfolio appreciation of 7.5% and private portfolio appreciation of
10.4%.
Inflows include contributions, capital raised, other increases in available capital, purchases
and acquisitions. Outflows represent redemptions, client withdrawals and other decreases in
available capital. Realizations represent realizations from the disposition of assets. Market
Activity represents gains (losses) on portfolio investments and impact of foreign exchange
rate fluctuations.
Market
Activity:
Carrying
value
increase
of
6.0%
driven
by
improving
fundamentals
in
the
private
portfolio
by
6.7%
or
$1.9
billion,
and
public portfolio
appreciation
of
4.8%
or
$1.0
billion.
Market
Activity:
Appreciation
in
value
in
BDCs
of
$247
million;
Rescue
Lending
Funds
of
$170
million;
Hedge
Fund
Strategies
of $206
million. |
 Additional
Capital Detail Global fundraising sourced record levels of capital with
$62.4 billion of gross inflows over the last year, which largely offset the
$20.3 billion of investment activity across the firm. Committed undrawn
capital (“Total Dry Powder”) is $45.3 billion, up 18% from $38.5 billion a year ago.
•
Of the $45.3 billion, $18.6 billion
was eligible but not currently earning Management Fees.
Blackstone manages the public industry’s largest pool of Performance Fee
Eligible AUM across its integrated global platform, which reached $191.0
billion at the end of the quarter, up 22% year-over-year. Strong
investment performance drove a 46% increase in assets currently earning Performance Fees from last year
to $139.7
billion as all of Blackstone’s current and mature funds are generating
Realized Performance Fees. $45 billion 2Q’14 Total Dry Powder
$191 billion Performance Fee Eligible AUM
Uninvested
Not Earning
Fees
Currently
Earning Fees
Credit
Hedge
Fund
Solutions
Private
Equity
Real
Estate
$17.7
$15.6
$2.9
$9.2
$54.8
$95.7
$139.7
$36.1
$23.9
$9.0
$34.0
$37.2
$42.2
$124.8
$156.8
$191.0
2Q'12
2Q'13
2Q'14
Blackstone
12 |
 At June 30, 2014, Blackstone had $2.7 billion in total cash, corporate treasury
and liquid investments and $9.8
billion of total net value, or $8.60 per DE unit, up 36% from $6.31 a year
ago. Long-term
debt
of
$2.1
billion
at
quarter
end
resulted
in
a
Debt
to
Adjusted
EBITDA
ratio
of
0.79x
LTM.
On
April
7,
2014,
Blackstone
issued
senior
notes
of
$500
million
(5.00%
coupon)
maturing
on
June
15,
2044.
On May 29, 2014, the maturity date of the $1.1 billion credit revolver, which is
currently undrawn, was extended to May 29, 2019.
Balance Sheet Highlights
(Dollars in Millions)
2Q’14
Cash and Cash Equivalents
$
1,223
Treasury Cash
Management Strategies
1,286
Liquid Investments
141
Illiquid Investments
2,930
Net Accrued Performance
Fees
4,241
Total Net Value
$
9,821
Outstanding Bonds (at par)
$
2,135
A+/A+
rated by S&P and Fitch
$1.1 billion
undrawn credit revolver with
May 2019 maturity
$2.7 billion
total cash, corporate treasury
and liquid investments
Cash and Investments
Net
Performance
Fees
Total Cash
and Liquids
Illiquids
$8.60
$6.31
$4.61
$1.58
$2.24
$3.72
$1.81
$2.06
$1.22
$2.01
$2.32
2Q'12
2Q'13
2Q'14
$2.57
Blackstone
13
Balance Sheet Highlight results are preliminary, and exclude the consolidated Blackstone
funds. Liquid Investments are primarily Blackstone investments in Hedge Fund Solutions
and non-drawdown Credit. Illiquid Investments include Blackstone investments in Private Equity, Real Estate and Other, which were $1.0 billion, $1.5 billion and $412
million, respectively, as of June 30, 2014; $911 million, $1.2 billion and $193 million,
respectively, as of June 30, 2013; and $820 million, $945 million and $248 million,
respectively, as of June 30, 2012. 2Q’14 Cash and Investments are calculated using
1,141,345,729 DE Units Outstanding. |
 Net Accrued Performance Fees reached a record $4.2 billion, despite record LTM
Realized Performance Fees of $1.9
billion.
With BCP V fully crossing the preferred hurdle, 100% of Blackstone’s current
and mature funds are in a positive net carry position
inception-to-date. Net Accrued Performance Fees represent nearly
70% of Total Accrued Performance Fees at current values. This
percentage
includes
pre-IPO
investments
in
which
Blackstone
has
a
higher
percentage
than
the
post-IPO
investments’
targeted 45% compensation ratio. Percentages fluctuate from quarter to quarter
depending on specific deal performance.
Performance Fees
$1.9 billion Realized
Performance Fees
$1,119
$1,910
$159
68%
Net Accrued Performance Fees
Related to Public/Pending Exits
32%
Net
Accrued
Performance
Fees
Related to Private Investments
$1.9 billion
Record LTM Realized
Performance Fees
$4.2 billion Net Accrued
Performance Fees
$2,529
$4,241
$1,756
Private Equity
Real Estate
Credit
Hedge Fund Solutions
$221
$518
$407
$905
$107
$228
$385
$259
2Q'12 LTM
2Q'13 LTM
2Q'14 LTM
$533
$633
$1,275
$1,035
$1,635
$2,664
$176
$194
$245
2Q'12
2Q'13
2Q'14
Blackstone
14 |
 Blackstone
15
Unitholder Distribution
A
detailed
description
of
Blackstone’s
distribution
policy
and
the
definition
of
Distributable
Earnings
can
be
found
on
page
32,
Definitions
and
Distribution
Policy.
DE
before
Certain
Payables
represents
Distributable
Earnings
before
the
deduction
for
the
Payable
Under
Tax
Receivable
Agreement
and
tax
expense
(benefit)
of
wholly
owned
subsidiaries.
Per
Unit
calculations
are
based
on
Total
Common
Units
Outstanding
(page
31,
Unit
Rollforward);
actual
distributions
are
paid
to
applicable
unitholders
as
of
the
record
date.
For
the
periods
presented,
Net
Cash
Available
for
Distribution
per
Common
Unit
equals
the
Actual
Distribution
per
Common
Unit.
Retained
capital
is
withheld
pro-rata
from
common
and
Blackstone
Holdings
Partnership
unitholders.
Common
unitholders’
share
was
$61.2
million
for
2Q’14.
Generated
$0.65
of
Distributable
Earnings
per
common
unit
during
the
quarter,
up
132%
year-over-year.
•
Year-to-date Distributable Earnings per common unit of $1.06, up 71% from
the prior year period. Declared
a
quarterly
distribution
of
$0.55
per
common
unit
to
record
holders
as
of
July
28,
2014;
payable
on
August
4, 2014.
•
85%
payout
ratio
reflects
the
strength
of
the
balance
sheet
and
financial
momentum
of
the
firm.
•
Year-to-date distributions of $0.90, up 70% from the prior year
period. % Change
(Dollars in Thousands, Except per Unit Data)
2Q'13
3Q'13
4Q'13
1Q'14
2Q'14
vs. 2Q'13
Distributable Earnings (“DE”)
338,485
$
312,673
$
820,629
$
485,112
$
770,797
$
128%
Add: Other Payables Attributable to
Common Unitholders
28,498
17,694
58,103
19,856
29,884
5%
DE before Certain Payables
366,983
330,367
878,732
504,968
800,681
118%
Percent to Common Unitholders
51%
52%
52%
53%
53%
DE before Certain Payables Attributable to
Common Unitholders
187,652
170,216
455,291
265,378
423,209
126%
Less: Other Payables Attributable to
Common Unitholders
(28,498)
(17,694)
(58,103)
(19,856)
(29,884)
5%
DE Attributable to Common Unitholders
159,154
152,522
397,188
245,522
393,325
147%
DE per Common Unit
0.28
$
0.26
$
0.68
$
0.41
$
0.65
$
132%
Less: Retained Capital per Common Unit
(0.05)
$
(0.03)
$
(0.10)
$
(0.06)
$
(0.10)
$
100%
Actual Distribution per Common Unit
0.23
$
0.23
$
0.58
$
0.35
$
0.55
$
139%
Record Date
July 28, 2014
Payable Date
August 4, 2014 |
 Blackstone
16
Summary Walkdown of GAAP to Non-GAAP Financial Metrics
GAAP
Economic Income
“EI”
Fee Related Earnings
“FRE”
Distributable Earnings
“DE”
Income Before Provision for Taxes
+
IPO and Acquisition-Related Charges
–
Impact of Consolidated Funds
–
Net Performance Fees
–
Fund Investment Income
+
Net Realized Performance Fees
+
Realized Investment Income
–
Taxes and Related Payables
+ Equity-Based Compensation
=
Distributable Earnings
(Dollars in Millions)
See pages 28-29, Reconciliation of GAAP to Non-GAAP Measures for details.
2Q’14
$771
=
Economic Income
=
Fee Related Earnings
$201
$376
$1,256
$1,307
$2,016
$1,351
$2,176
YTD’14 |
 Blackstone
17
GAAP Statement of Operations
% Change
% Change
(Dollars in Thousands, Except per Unit Data) (Unaudited)
2Q'13
2Q'14
vs. 2Q'13
YTD'13
YTD'14
vs. YTD'13
Revenues
Management and Advisory Fees, Net
578,723
$
619,523
$
7%
1,060,856
$
1,192,683
$
12%
Performance Fees
Realized Carried Interest
183,288
641,659
250%
477,458
975,282
104%
Realized Incentive Fees
76,104
39,504
(48)%
99,845
83,298
(17)%
Unrealized Carried Interest
456,706
660,682
45%
634,053
991,076
56%
Unrealized Incentive Fees
938
54,639
n/m
106,736
118,872
11%
Total Performance Fees
717,036
1,396,484
95%
1,318,092
2,168,528
65%
Investment Income
Realized
75,490
215,710
186%
117,843
368,736
213%
Unrealized
56,570
10,809
(81)%
162,800
24,309
(85)%
Total Investment Income
132,060
226,519
72%
280,643
393,045
40%
Interest and Dividend Revenue
13,814
15,340
11%
26,371
29,409
12%
Other
(1,163)
(6)
99%
981
863
(12)%
Total Revenues
1,440,470
2,257,860
57%
2,686,943
3,784,528
41%
Expenses
Compensation and Benefits
Compensation
478,981
500,641
5%
930,411
985,992
6%
Performance Fee Compensation
Realized Carried Interest
75,910
260,301
243%
165,347
409,699
148%
Realized Incentive Fees
35,014
18,509
(47)%
45,522
42,144
(7)%
Unrealized Carried Interest
172,824
114,296
(34)%
268,296
155,026
(42)%
Unrealized Incentive Fees
3,084
24,692
701%
47,562
48,223
1%
Total Compensation and Benefits
765,813
918,439
20%
1,457,138
1,641,084
13%
General, Administrative and Other
117,365
136,492
16%
226,671
272,046
20%
Interest Expense
26,956
29,847
11%
54,018
54,514
1%
Fund Expenses
4,628
5,003
8%
12,036
9,988
(17)%
Total Expenses
914,762
1,089,781
19%
1,749,863
1,977,632
13%
Other Income
Net Gains from Fund Investment Activities
40,966
138,585
238%
108,176
208,740
93%
Income Before Provision for Taxes
566,674
$
1,306,664
$
131%
1,045,256
$
2,015,636
$
93%
Provision for Taxes
56,082
83,282
49%
107,075
137,379
28%
Net Income
510,592
$
1,223,382
$
140%
938,181
$
1,878,257
$
100%
Net Income Attributable to Redeemable Non-Controlling Interests in Consolidated
Entities 22,366
22,486
1%
84,682
68,278
(19)%
Net Income Attributable to Non-Controlling Interests in Consolidated Entities
27,944
140,061
401%
18,492
184,022
895%
Net Income Attributable to Non-Controlling Interests in Blackstone Holdings
249,134
543,819
118%
456,224
843,324
85%
Net Income Attributable to The Blackstone Group L.P. ("BX")
211,148
$
517,016
$
145%
378,783
$
782,633
$
107%
Net Income per Common Unit, Basic
0.36
$
0.85
$
136%
0.65
$
1.30
$
100%
Net Income per Common Unit, Diluted
0.36
$
0.85
$
136%
0.65
$
1.29
$
98% |
 Appendix |
 Blackstone
19
Total Segments
(Dollars in Thousands)
2Q'13
3Q'13
4Q'13
1Q'14
2Q'14
YTD'13
YTD'14
Revenues
Management and Advisory Fees, Net
Base Management Fees
425,674
$
437,294
$
469,092
$
476,878
$
496,570
$
834,421
$
973,448
$
Advisory Fees
120,734
83,602
139,158
69,963
114,914
187,754
184,877
Transaction and Other Fees, Net
66,464
42,806
59,733
59,910
49,196
104,438
109,106
Management Fee Offsets
(10,535)
(8,271)
(43,752)
(16,644)
(20,218)
(20,197)
(36,862)
Total Management and Advisory Fees, Net
602,337
555,431
624,231
590,107
640,462
1,106,416
1,230,569
Performance Fees
Realized Carried Interest
183,288
182,654
283,846
333,623
641,659
477,458
975,282
Realized Incentive Fees
74,867
31,238
343,501
53,837
39,291
99,594
93,128
Unrealized Carried Interest
456,706
290,052
1,233,905
330,288
660,712
634,053
991,000
Unrealized Incentive Fees
4,358
40,992
(173,033)
61,266
56,776
112,113
118,042
Total Performance Fees
719,219
544,936
1,688,219
779,014
1,398,438
1,323,218
2,177,452
Investment Income (Loss)
Realized
54,586
11,492
66,283
111,917
202,199
92,696
314,116
Unrealized
42,533
87,680
290,460
4,550
(26,228)
139,194
(21,678)
Total Investment Income
97,119
99,172
356,743
116,467
175,971
231,890
292,438
Interest Income and Dividend Revenue
15,342
21,539
19,394
22,362
22,094
30,003
44,456
Other
(1,164)
4,708
4,621
869
(6)
979
863
Total Revenues
1,432,853
1,225,786
2,693,208
1,508,819
2,236,959
2,692,506
3,745,778
Expenses
Compensation
306,477
279,498
262,688
306,545
323,015
573,454
629,560
Performance Fee Compensation
Realized Carried Interest
75,910
60,369
31,485
149,398
260,301
165,347
409,699
Realized Incentive Fees
35,014
14,599
140,794
23,635
18,509
45,522
42,144
Unrealized Carried Interest
172,824
82,341
616,080
40,690
114,336
268,296
155,026
Unrealized Incentive Fees
3,084
11,084
(70,297)
23,531
24,692
47,562
48,223
Total Compensation and Benefits
593,309
447,891
980,750
543,799
740,853
1,100,181
1,284,652
Other Operating Expenses
120,152
122,872
129,171
139,774
145,111
234,596
284,885
Total Expenses
713,461
570,763
1,109,921
683,573
885,964
1,334,777
1,569,537
Economic Income
719,392
$
655,023
$
1,583,287
$
825,246
$
1,350,995
$
1,357,729
$
2,176,241
$
Economic Net Income
703,240
$
640,231
$
1,542,098
$
813,934
$
1,325,963
$
1,331,546
$
2,139,897
$
Fee Related Earnings
168,434
$
178,596
$
260,706
$
174,829
$
201,108
$
306,167
$
375,937
$
Distributable Earnings
338,485
$
312,673
$
820,629
$
485,112
$
770,797
$
729,397
$
1,255,909
$
Total Assets Under Management
229,571,741
$
248,064,888
$
265,757,630
$
271,745,583
$
278,917,713
$
229,571,741
$
278,917,713
$
Fee-Earning Assets Under Management
176,338,947
$
188,649,817
$
197,981,739
$
203,599,604
$
209,913,760
$
176,338,947
$
209,913,760
$
Weighted Average Fee-Earning AUM
173,706,678
$
185,628,676
$
196,309,547
$
200,246,002
$
204,671,392
$
172,372,395
$
205,257,277
$
LP Capital Invested
3,634,404
$
3,378,067
$
5,382,770
$
4,468,527
$
5,426,511
$
5,418,867
$
9,895,038
$
Total Capital Invested
3,757,591
$
3,536,365
$
6,115,856
$
4,807,663
$
5,858,210
$
5,598,065
$
10,665,873
$ |
 Blackstone
20
Private Equity
(Dollars in Thousands)
2Q'13
3Q'13
4Q'13
1Q'14
2Q'14
YTD'13
YTD'14
Revenues
Management Fees, Net
Base Management Fees
86,621
$
95,281
$
99,998
$
98,584
$
103,204
$
172,867
$
201,788
$
Transaction and Other Fees, Net
38,348
16,052
18,135
42,847
27,616
62,801
70,463
Management Fee Offsets
(1,950)
(2,080)
(1,173)
(1,713)
(4,246)
(2,430)
(5,959)
Total Management Fees, Net
123,019
109,253
116,960
139,718
126,574
233,238
266,292
Performance Fees
Realized Carried Interest
3,899
85,121
101,081
119,805
212,394
143,791
332,199
Unrealized Carried Interest
182,926
(86,300)
385,560
167,065
502,210
98,972
669,275
Total Performance Fees
186,825
(1,179)
486,641
286,870
714,604
242,763
1,001,474
Investment Income (Loss)
Realized
21,586
11,495
30,783
60,535
74,812
45,748
135,347
Unrealized
21,088
23,621
85,329
(9,033)
17,662
52,799
8,629
Total Investment Income
42,674
35,116
116,112
51,502
92,474
98,547
143,976
Interest Income and Dividend Revenue
3,251
5,231
4,136
5,228
4,666
6,235
9,894
Other
366
1,521
1,948
864
564
790
1,428
Total Revenues
356,135
149,942
725,797
484,182
938,882
581,573
1,423,064
Expenses
Compensation
63,747
55,800
56,370
73,307
73,038
123,950
146,345
Performance Fee Compensation
Realized Carried Interest
877
19,824
2,006
85,771
112,720
17,123
198,491
Unrealized Carried Interest
88,111
(36,198)
274,201
(27,148)
66,194
104,730
39,046
Total Compensation and Benefits
152,735
39,426
332,577
131,930
251,952
245,803
383,882
Other Operating Expenses
32,178
30,024
32,767
33,006
39,193
61,346
72,199
Total Expenses
184,913
69,450
365,344
164,936
291,145
307,149
456,081
Economic Income
171,222
$
80,492
$
360,453
$
319,246
$
647,737
$
274,424
$
966,983
$
Total Assets Under Management
53,287,294
$
62,619,813
$
65,675,031
$
66,142,945
$
68,294,162
$
53,287,294
$
68,294,162
$
Fee-Earning Assets Under Management
36,635,224
$
43,645,106
$
42,600,515
$
41,150,728
$
42,888,756
$
36,635,224
$
42,888,756
$
Weighted Average Fee-Earning AUM
36,675,636
$
43,886,763
$
43,290,792
$
41,815,672
$
43,702,379
$
36,865,792
$
44,235,482
$
LP Capital Invested
749,290
$
524,320
$
1,017,985
$
2,029,019
$
1,857,330
$
1,026,277
$
3,886,349
$
Total Capital Invested
780,339
$
548,173
$
1,330,606
$
2,271,273
$
2,159,178
$
1,071,350
$
4,430,451
$ |
 Blackstone
21
Real Estate
(Dollars in Thousands)
2Q'13
3Q'13
4Q'13
1Q'14
2Q'14
YTD'13
YTD'14
Revenues
Management Fees, Net
Base Management Fees
137,000
$
136,721
$
153,115
$
159,336
$
157,869
$
275,346
$
317,205
$
Transaction and Other Fees, Net
19,013
19,205
32,317
13,564
13,514
28,153
27,078
Management Fee Offsets
(6,312)
(2,385)
(6,838)
(9,224)
(7,702)
(13,598)
(16,926)
Total Management Fees, Net
149,701
153,541
178,594
163,676
163,681
289,901
327,357
Performance Fees
Realized Carried Interest
143,481
93,878
180,641
194,658
417,826
212,254
612,484
Realized Incentive Fees
31,102
3,737
7,931
(26)
6,070
34,194
6,044
Unrealized Carried Interest
259,972
340,406
771,246
140,237
119,461
540,048
259,698
Unrealized Incentive Fees
(32,279)
2,481
(1,355)
2,737
(3,483)
(29,879)
(746)
Total Performance Fees
402,276
440,502
958,463
337,606
539,874
756,617
877,480
Investment Income (Loss)
Realized
18,577
928
23,320
31,357
122,664
28,111
154,021
Unrealized
30,636
57,656
201,606
5,379
(50,437)
90,939
(45,058)
Total Investment Income
49,213
58,584
224,926
36,736
72,227
119,050
108,963
Interest Income and Dividend Revenue
4,396
6,060
6,809
6,110
8,009
8,694
14,119
Other
(274)
2,113
1,678
317
(218)
(407)
99
Total Revenues
605,312
660,800
1,370,470
544,445
783,573
1,173,855
1,328,018
Expenses
Compensation
73,792
75,346
75,625
80,233
85,582
143,251
165,815
Performance Fee Compensation
Realized Carried Interest
55,005
38,942
29,027
51,833
143,442
80,868
195,275
Realized Incentive Fees
15,733
1,919
4,502
(16)
3,081
17,457
3,065
Unrealized Carried Interest
78,604
99,323
299,853
56,985
27,339
167,661
84,324
Unrealized Incentive Fees
(16,329)
615
(335)
1,382
(1,783)
(15,295)
(401)
Total Compensation and Benefits
206,805
216,145
408,672
190,417
257,661
393,942
448,078
Other Operating Expenses
27,617
30,614
29,698
33,107
36,542
56,079
69,649
Total Expenses
234,422
246,759
438,370
223,524
294,203
450,021
517,727
Economic Income
370,890
$
414,041
$
932,100
$
320,921
$
489,370
$
723,834
$
810,291
$
Total Assets Under Management
63,919,906
$
68,964,455
$
79,410,788
$
81,333,562
$
80,410,988
$
63,919,906
$
80,410,988
$
Fee-Earning Assets Under Management
43,635,493
$
44,715,985
$
50,792,803
$
53,490,834
$
52,823,975
$
43,635,493
$
52,823,975
$
Weighted Average Fee-Earning AUM
42,523,604
$
44,163,396
$
50,568,609
$
50,954,956
$
48,653,930
$
42,109,834
$
50,579,804
$
LP Capital Invested
2,213,668
$
2,365,224
$
3,986,610
$
1,692,232
$
3,017,193
$
3,389,443
$
4,709,425
$
Total Capital Invested
2,274,853
$
2,438,725
$
4,333,419
$
1,746,460
$
3,128,232
$
3,477,589
$
4,874,692
$ |
 Blackstone
22
Hedge Fund Solutions
(Dollars in Thousands)
2Q'13
3Q'13
4Q'13
1Q'14
2Q'14
YTD'13
YTD'14
Revenues
Management Fees, Net
Base Management Fees
100,113
$
103,392
$
113,025
$
113,384
$
123,008
$
192,904
$
236,392
$
Transaction and Other Fees, Net
61
295
263
93
126
65
219
Management Fee Offsets
(714)
(1,200)
(1,149)
(1,455)
(1,531)
(1,038)
(2,986)
Total Management Fees, Net
99,460
102,487
112,139
112,022
121,603
191,931
233,625
Performance Fees
Realized Incentive Fees
13,845
5,320
174,861
39,845
7,973
27,554
47,818
Unrealized Incentive Fees
20,989
29,208
(97,980)
18,085
30,556
76,490
48,641
Total Performance Fees
34,834
34,528
76,881
57,930
38,529
104,044
96,459
Investment Income (Loss)
Realized
13,668
(598)
13,691
16,820
2,394
14,520
19,214
Unrealized
(12,054)
6,439
(7,604)
4,431
1,057
(8,141)
5,488
Total Investment Income
1,614
5,841
6,087
21,251
3,451
6,379
24,702
Interest Income and Dividend Revenue
1,878
2,523
1,988
2,661
2,340
3,094
5,001
Other
(254)
595
262
122
(203)
(169)
(81)
Total Revenues
137,532
145,974
197,357
193,986
165,720
305,279
359,706
Expenses
Compensation
36,844
37,611
28,147
40,571
43,341
70,712
83,912
Performance Fee Compensation
Realized Incentive Fees
5,116
1,954
53,701
13,271
2,918
10,138
16,189
Unrealized Incentive Fees
7,666
10,177
(34,823)
6,761
11,252
27,502
18,013
Total Compensation and Benefits
49,626
49,742
47,025
60,603
57,511
108,352
118,114
Other Operating Expenses
16,535
19,575
15,697
19,480
25,101
31,694
44,581
Total Expenses
66,161
69,317
62,722
80,083
82,612
140,046
162,695
Economic Income
71,371
$
76,657
$
134,635
$
113,903
$
83,108
$
165,233
$
197,011
$
Total Assets Under Management
50,128,028
$
53,162,174
$
55,657,463
$
58,262,659
$
60,672,759
$
50,128,028
$
60,672,759
$
Fee-Earning Assets Under Management
47,572,465
$
50,829,734
$
52,865,837
$
55,571,357
$
58,084,020
$
47,572,465
$
58,084,020
$
Weighted Average Fee-Earning AUM
46,783,727
$
48,933,335
$
51,794,518
$
54,715,882
$
56,793,206
$
46,091,525
$
55,958,185
$
LP Capital Invested
118,323
$
248,422
$
8,681
$
167,170
$
188,236
$
174,172
$
355,406
$
Total Capital Invested
125,000
$
262,309
$
8,681
$
202,674
$
196,348
$
184,000
$
399,022
$ |
 Blackstone
23
Credit
(Dollars in Thousands)
2Q'13
3Q'13
4Q'13
1Q'14
2Q'14
YTD'13
YTD'14
Revenues
Management Fees, Net
Base Management Fees
101,940
$
101,900
$
102,954
$
105,574
$
112,489
$
193,304
$
218,063
$
Transaction and Other Fees, Net
9,002
7,058
8,152
3,344
7,064
13,376
10,408
Management Fee Offsets
(1,559)
(2,606)
(34,592)
(4,252)
(6,739)
(3,131)
(10,991)
Total Management Fees, Net
109,383
106,352
76,514
104,666
112,814
203,549
217,480
Performance Fees
Realized Carried Interest
35,908
3,655
2,124
19,160
11,439
121,413
30,599
Realized Incentive Fees
29,920
22,181
160,709
14,018
25,248
37,846
39,266
Unrealized Carried Interest
13,808
35,946
77,099
22,986
39,041
(4,967)
62,027
Unrealized Incentive Fees
15,648
9,303
(73,698)
40,444
29,703
65,502
70,147
Total Performance Fees
95,284
71,085
166,234
96,608
105,431
219,794
202,039
Investment Income (Loss)
Realized
901
496
(627)
3,071
2,223
4,229
5,294
Unrealized
4,381
(1,042)
9,519
3,079
4,521
5,474
7,600
Total Investment Income (Loss)
5,282
(546)
8,892
6,150
6,744
9,703
12,894
Interest Income and Dividend Revenue
4,071
5,288
4,240
5,861
4,892
8,618
10,753
Other
(1,063)
(357)
119
(259)
11
765
(248)
Total Revenues
212,957
181,822
255,999
213,026
229,892
442,429
442,918
Expenses
Compensation
55,941
53,250
31,802
50,752
51,310
101,462
102,062
Performance Fee Compensation
Realized Carried Interest
20,028
1,603
452
11,794
4,139
67,356
15,933
Realized Incentive Fees
14,165
10,726
82,591
10,380
12,510
17,927
22,890
Unrealized Carried Interest
6,109
19,216
42,026
10,853
20,803
(4,095)
31,656
Unrealized Incentive Fees
11,747
292
(35,139)
15,388
15,223
35,355
30,611
Total Compensation and Benefits
107,990
85,087
121,732
99,167
103,985
218,005
203,152
Other Operating Expenses
22,961
23,451
29,566
32,839
22,159
43,923
54,998
Total Expenses
130,951
108,538
151,298
132,006
126,144
261,928
258,150
Economic Income
82,006
$
73,284
$
104,701
$
81,020
$
103,748
$
180,501
$
184,768
$
Total Assets Under Management
62,236,513
$
63,318,446
$
65,014,348
$
66,006,417
$
69,539,804
$
62,236,513
$
69,539,804
$
Fee-Earning Assets Under Management
48,495,765
$
49,458,992
$
51,722,584
$
53,386,685
$
56,117,009
$
48,495,765
$
56,117,009
$
Weighted Average Fee-Earning AUM
47,723,711
$
48,645,182
$
50,655,628
$
52,759,492
$
55,521,877
$
47,305,244
$
54,483,806
$
LP Capital Invested
553,123
$
240,101
$
369,494
$
580,106
$
363,752
$
828,975
$
943,858
$
Total Capital Invested
577,399
$
287,158
$
443,150
$
587,256
$
374,452
$
865,126
$
961,708
$ |
 Blackstone
24
Financial Advisory
(Dollars in Thousands)
2Q'13
3Q'13
4Q'13
1Q'14
2Q'14
YTD'13
YTD'14
Revenues
Advisory Fees
120,734
$
83,602
$
139,158
$
69,963
$
114,914
$
187,754
$
184,877
$
Transaction and Other Fees, Net
40
196
866
62
876
43
938
Total Advisory and Transaction Fees
120,774
83,798
140,024
70,025
115,790
187,797
185,815
Investment Income (Loss)
Realized
(146)
(829)
(884)
134
106
88
240
Unrealized
(1,518)
1,006
1,610
694
969
(1,877)
1,663
Total Investment Income (Loss)
(1,664)
177
726
828
1,075
(1,789)
1,903
Interest Income and Dividend Revenue
1,746
2,437
2,221
2,502
2,187
3,362
4,689
Other
61
836
614
(175)
(160)
-
(335)
Total Revenues
120,917
87,248
143,585
73,180
118,892
189,370
192,072
Expenses
Compensation
76,153
57,491
70,744
61,682
69,744
134,079
131,426
Total Compensation and Benefits
76,153
57,491
70,744
61,682
69,744
134,079
131,426
Other Operating Expenses
20,861
19,208
21,443
21,342
22,116
41,554
43,458
Total Expenses
97,014
76,699
92,187
83,024
91,860
175,633
174,884
Economic Income (Loss)
23,903
$
10,549
$
51,398
$
(9,844)
$
27,032
$
13,737
$
17,188
$ |
 Blackstone
25
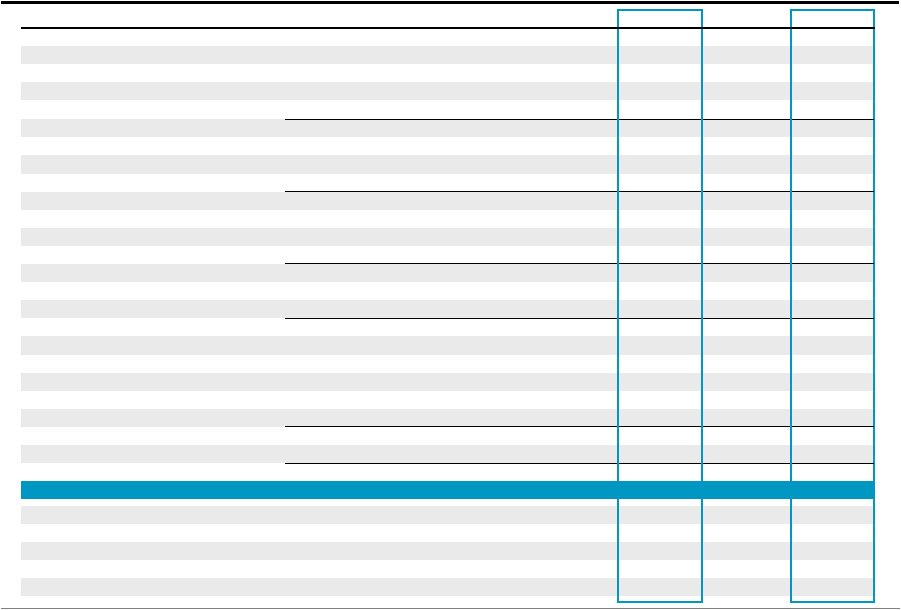
Net Accrued Performance Fees
Net Accrued Performance Fees are presented net of performance fee compensation and do not
include clawback amounts, if any, which are disclosed in the 10-K/Q. Net Realized Performance Fees are included in DE.
When these fees are received, the receivable is reduced without further impacting DE. Per Unit
calculations are based on 1,141,345,729 DE Units Outstanding (see page 31, Unit Rollforward).
Blackstone had $4.2 billion of accrued performance fees, net of performance fee
compensation and distributed Realized Performance Fees, at the end of the
second quarter. $4.2 billion
Net Accrued Performance Fees at 2Q’14
$3.72 per unit
Net Accrued Performance Fees at 2Q’14
68% increase
in Net Accrued Performance Fees since 2Q’13
Net Accrued Performance Fees
Change vs.
(Dollars in Millions, Except per Unit Data)
1Q'14
2Q'14
Per Unit
1Q'14
Private Equity
BCP IV Carried Interest
437
$
383
$
0.34
$
(54)
$
BCP V Carried Interest
141
558
0.49
417
BCP VI Carried Interest
173
233
0.20
60
BEP Carried Interest
58
81
0.07
23
Tactical Opportunities Carried Interest
10
19
0.02
9
SP V Carried Interest
1
1
0.00
-
Total Private Equity
820
1,275
1.12
455
Real Estate
BREP IV Carried Interest
2
2
0.00
-
BREP V Carried Interest
623
618
0.54
(5)
BREP VI Carried Interest
1,284
1,389
1.22
105
BREP VII Carried Interest
358
459
0.40
101
BREP Int'l I Carried Interest
2
2
0.00
-
BREP Europe III Carried Interest
117
144
0.13
27
BREP Europe IV Carried Interest
3
10
0.01
7
BREP Asia Carried Interest
8
9
0.01
1
Core+ Carried Interest
-
1
0.00
1
BREDS Carried Interest
15
18
0.02
3
BREDS Incentive Fees
3
3
0.00
-
Asia Platform Incentive Fees
9
9
0.01
-
Total Real Estate
2,424
2,664
2.33
240
Hedge Fund Solutions
Incentive Fees
56
57
0.05
1
Total Hedge Fund Solutions
56
57
0.05
1
Credit
Carried Interest
185
176
0.15
(9)
Incentive Fees
61
69
0.06
8
Total Credit
246
245
0.21
(1)
Total Blackstone
Carried Interest
3,417
4,103
3.59
686
Incentive Fees
129
138
0.12
9
Net Accrued Performance Fees
3,546
$
4,241
$
3.72
$
695
$
Memo: Net Realized Performance Fees
94
$
239
$
0.21
$
145
$
|
 Blackstone
26
Investment Records as of June 30, 2014
(a)
Notes on next page.
Committed
Available
Unrealized Investments
Realized Investments
Total Investments
Net IRRs (d)
(Dollars in Thousands, Except Where Noted)
Capital
Capital (b)
Value
MOIC (c)
% Public
Value
MOIC (c)
Value
MOIC (c)
Realized
Total
Private Equity
BCP I (Oct 1987 / Oct 1993)
859,081
$
-
$
-
$
n/a
-
1,741,738
$
2.6x
1,741,738
$
2.6x
19%
19%
BCP II (Oct 1993 / Aug 1997)
1,361,100
-
-
n/a
-
3,256,819
2.5x
3,256,819
2.5x
32%
32%
BCP III (Aug 1997 / Nov 2002)
3,967,422
-
-
n/a
-
9,184,688
2.3x
9,184,688
2.3x
14%
14%
BCOM (Jun 2000 / Jun 2006)
2,137,330
199,298
247,105
1.2x
-
2,619,040
1.4x
2,866,145
1.3x
7%
6%
BCP IV (Nov 2002 / Dec 2005)
6,773,138
228,665
3,876,222
2.0x
61%
17,565,752
3.1x
21,441,974
2.8x
45%
37%
BCP V (Dec 2005 / Jan 2011)
21,031,850
1,770,128
19,182,132
1.7x
49%
13,722,497
1.6x
32,904,629
1.6x
8%
8%
BCP VI (Jan 2011 / Jan 2017)
15,184,161
8,624,325
8,187,578
1.4x
19%
1,462,362
1.6x
9,649,940
1.5x
44%
19%
BEP (Aug 2011 / Aug 2017)
2,422,838
1,234,987
1,826,488
2.0x
37%
631,832
1.5x
2,458,320
1.8x
45%
52%
Total Corporate Private Equity
53,736,920
$
12,057,403
$
33,319,525
$
1.6x
42%
50,184,728
$
2.1x
83,504,253
$
1.9x
20%
16%
Tactical Opportunities
5,415,849
3,315,432
2,403,589
1.1x
5%
171,049
1.1x
2,574,638
1.1x
12%
16%
Strategic Partners
15,450,456
5,145,840
6,436,636
1.8x
n/a
10,305,204
1.3x
16,741,840
1.5x
n/a
14%
Other Funds and Co-Invest (e)
1,201,732
28,302
680,613
0.8x
56%
20,890
1.0x
701,503
0.8x
n/m
n/m
Total Private Equity
75,804,957
$
20,546,977
$
42,840,363
$
1.6x
34%
60,681,871
$
1.9x
103,522,234
$
1.8x
20%
16%
Real Estate
Dollar
Pre-BREP
140,714
$
-
$
-
$
n/a
-
345,190
$
2.5x
345,190
$
2.5x
33%
33%
BREP I (Sep 1994 / Oct 1996)
380,708
-
-
n/a
-
1,327,708
2.8x
1,327,708
2.8x
40%
40%
BREP II (Oct 1996 / Mar 1999)
1,198,339
-
-
n/a
-
2,531,613
2.1x
2,531,613
2.1x
19%
19%
BREP III (Apr 1999 / Apr 2003)
1,522,708
-
2,161
0.1x
-
3,325,133
2.4x
3,327,294
2.4x
22%
21%
BREP IV (Apr 2003 / Dec 2005)
2,198,694
-
1,440,888
1.0x
22%
3,092,653
2.4x
4,533,541
1.7x
66%
14%
BREP V (Dec 2005 / Feb 2007)
5,539,418
-
7,033,344
1.9x
17%
4,207,071
2.0x
11,240,415
1.9x
21%
10%
BREP VI (Feb 2007 / Aug 2011)
11,058,605
614,439
16,870,917
2.1x
54%
6,791,824
2.2x
23,662,741
2.2x
17%
14%
BREP VII (Aug 2011 / Feb 2017)
13,440,836
4,817,292
13,274,189
1.5x
3%
1,874,236
1.6x
15,148,425
1.5x
38%
28%
Total Global Real Estate Funds
35,480,022
$
5,431,731
$
38,621,499
$
1.8x
29%
23,495,428
$
2.2x
62,116,927
$
1.9x
26%
17%
Euro
BREP Int'l (Jan 2001 / Sep 2005)
824,172
€
-
€
120,660
€
1.5x
-
1,238,480
€
2.2x
1,359,140
€
2.1x
25%
23%
BREP Int'l II (Sep 2005 / Jun 2008)
1,629,748
50,821
1,400,316
1.2x
37%
392,885
1.6x
1,793,201
1.3x
10%
3%
BREP Europe III (Jun 2008 / Dec 2013)
3,204,714
496,937
3,681,634
1.5x
9%
905,868
2.5x
4,587,502
1.6x
32%
18%
BREP Europe IV (Sep 2013 / Mar 2019)
5,142,757
3,683,469
1,634,057
1.1x
-
115,159
1.2x
1,749,216
1.1x
104%
15%
Total Euro Real Estate Funds
10,801,391
€
4,231,227
€
6,836,667
€
1.3x
12%
2,652,392
€
2.1x
9,489,059
€
1.4x
24%
11%
BREP Co-Investment (f)
5,160,385
$
-
$
8,049,438
$
1.9x
70%
2,052,222
$
2.0x
10,101,660
$
2.0x
14%
17%
BREP Asia (Jun 2013 / Dec 2017)
4,456,988
3,682,829
972,723
1.2x
-
4,400
1.0x
977,123
1.2x
n/a
20%
Total Real Estate
59,231,111
$
14,872,413
$
56,839,535
$
1.7x
31%
29,057,652
$
2.2x
85,897,187
$
1.8x
25%
17%
Core+
1,407,622
$
233,500
$
1,207,991
$
1.0x
-
-
$
n/a
1,207,991
$
1.0x
n/a
n/a
BREDS (g)
6,760,361
$
2,492,341
$
3,148,411
$
1.2x
-
2,828,717
$
1.3x
5,977,128
$
1.2x
15%
12%
Credit (h)
Mezzanine I (Jul 2007 / Jul 2012)
2,000,000
$
139,685
$
1,155,248
$
1.5x
-
3,606,207
$
1.6x
4,761,455
$
1.6x
n/a
18%
Mezzanine II (Nov 2011 / Nov 2016)
4,120,000
2,566,976
1,960,785
1.2x
-
823,420
1.4x
2,784,205
1.3x
n/a
23%
Rescue Lending I (Sep 2009 / May 2013)
3,253,143
492,815
3,527,372
1.5x
-
2,417,157
1.4x
5,944,529
1.5x
n/a
17%
Rescue Lending II (Jun 2013 / Jun 2018)
5,125,000
4,372,715
832,983
1.1x
-
3,795
1.0x
836,778
1.1x
n/a
n/m
Total Credit
14,498,143
$
7,572,191
$
7,476,388
$
1.4x
-
6,850,579
$
1.5x
14,326,967
$
1.5x |
 Blackstone
27
Investment
Records
as
of
June
30,
2014
–
Notes
The returns presented herein represent those of the applicable Blackstone Funds and not those of
The Blackstone Group L.P. n/m
Not meaningful.
n/a
Not applicable.
(a)
Preliminary.
(b)
Available Capital represents total investable capital commitments, including
side-by-side, adjusted for certain expenses and expired or recallable capital,
less invested capital. This amount is not reduced by outstanding commitments to investments.
(c)
Multiple of Invested Capital (“MOIC”) represents carrying value, before management
fees, expenses and Carried Interest, divided by invested capital.
(d)
Net Internal Rate of Return (“IRR”) represents the annualized inception to June 30,
2014 IRR on total invested capital based on realized proceeds and unrealized value, as
applicable, after management fees, expenses and Carried Interest. Net IRRs for BREP
Europe IV, BREP Asia and BREDS II are calculated from commencement of their respective investment periods which,
being less than one year, are not annualized.
(e)
Returns for Other Funds and Co-Invest are not meaningful as these funds have no or little
realizations. (f)
BREP Co-Investment represents co-investment capital raised for various BREP
investments. The Net IRR reflected is calculated by aggregating each
co-investment’s realized proceeds and unrealized value, as applicable, after management fees, expenses
and Carried Interest.
(g)
Excludes Capital Trust drawdown funds.
(h)
The Total Investments MOIC for Mezzanine I, Mezzanine II, Rescue
Lending I and Rescue Lending II Funds, excluding recycled
capital during the investment period, was 2.0x, 1.6x, 1.7x and 1.1x, respectively. Funds
presented represent the flagship credit drawdown funds only.
|
 Blackstone
28
Reconciliation of GAAP to Non-GAAP Measures
Notes on next page.
(Dollars in Thousands)
2Q'13
3Q'13
4Q'13
2Q'14
YTD'13
YTD'14
Net Income Attributable to The Blackstone Group L.P.
211,148
$
171,164
$
621,255
$
265,617
$
517,016
$
378,783
$
782,633
$
249,134
208,332
675,289
299,505
543,819
456,224
843,324
27,944
30,231
149,834
43,961
140,061
18,492
184,022
22,366
51,188
47,445
45,792
22,486
84,682
68,278
Net
Income
510,592
$
460,915
$
1,493,823
$
654,875
$
1,223,382
$
938,181
$
1,878,257
$
56,082
57,477
91,090
54,097
83,282
107,075
137,379
Income Before Provision for Taxes
566,674
$
518,392
$
1,584,913
$
708,972
$
1,306,664
$
1,045,256
$
2,015,636
$
178,706
190,525
166,514
177,024
178,568
365,668
355,592
24,322
27,525
29,139
29,003
28,310
49,979
57,313
(50,310)
(81,419)
(197,279)
(89,753)
(162,547)
(103,174)
(252,300)
Economic
Income
719,392
$
655,023
$
1,583,287
$
825,246
$
1,350,995
$
1,357,729
$
2,176,241
$
Taxes
(d)
(16,152)
(14,792)
(41,189)
(11,312)
(25,032)
(26,183)
(36,344)
Economic Net Income
703,240
$
640,231
$
1,542,098
$
813,934
$
1,325,963
$
1,331,546
$
2,139,897
$
16,152
14,792
41,189
11,312
25,032
26,183
36,344
(719,219)
(544,936)
(1,688,219)
(779,014)
(1,398,438)
(1,323,218)
(2,177,452)
(97,119)
(99,172)
(356,743)
(116,467)
(175,971)
(231,890)
(292,438)
(21,452)
(712)
4,319
7,810
6,684
(23,181)
14,494
286,832
168,393
718,062
237,254
417,838
526,727
655,092
Fee
Related
Earnings
168,434
$
178,596
$
260,706
$
174,829
$
201,108
$
306,167
$
375,937
$
147,231
138,924
455,068
214,427
402,140
366,183
616,567
54,586
11,492
66,283
111,917
202,199
92,696
314,116
1,469
6,672
8,873
(1,344)
(1,059)
(2,351)
(2,403)
(44,220)
(31,756)
(68,610)
(31,054)
(44,841)
(56,368)
(75,895)
10,985
8,745
98,309
16,337
11,250
23,070
27,587
Distributable
Earnings
338,485
$
312,673
$
820,629
$
485,112
$
770,797
$
729,397
$
1,255,909
$
25,960
25,268
26,607
30,398
34,082
52,029
64,480
44,220
31,756
68,610
31,054
44,841
56,368
75,895
9,116
8,956
8,726
10,373
7,170
17,759
17,543
Adjusted
EBITDA
417,781
$
378,653
$
924,572
$
556,937
$
856,890
$
855,553
$
1,413,827
$
Taxes
(d)
Net Income Attributable to Non-Controlling Interests in Consolidated Entities
Net Income Attributable to Redeemable Non-Controlling
Provision for Taxes
Interests in Consolidated Entities
Net Income Attributable to Non-Controlling Interests in Blackstone Holdings
IPO and Acquisition-Related Charges
Amortization of Intangibles
Performance Fee Adjustment
Investment (Income) Adjustment
Performance Fee Compensation and Benefits Adjustment
Realized Performance Fees
Realized Investment Income
Adjustment Related to Realized Investment (Income) Loss -
Equity-Based Compensation
Interest Expense
Depreciation and Amortization
(a)
(b)
(c)
(f)
(e)
(g)
(h)
(i)
(j)
(k)
(m)
(l)
(l)
Investment
Income
(Loss)
-
Blackstone's Treasury Cash Management Strategies
Taxes and Related Payables Including Payable Under Tax Receivable Agreement
Taxes and Related Payables Including Payable Under Tax Receivable Agreement
(Income) Associated with Non-Controlling Interests of Consolidated Entities
Blackstone's Treasury Cash Management Strategies
1Q'14 |
 Blackstone
29
Reconciliation
of
GAAP
to
Non-GAAP
Measures
–
Notes
Note:
See page 32, Definitions and Distribution Policy.
(a)
This adjustment adds back to Income (Loss) Before Provision (Benefit) for Taxes amounts for
Transaction-Related Charges which include principally equity-based compensation
charges associated with Blackstone’s initial public offering and long-term retention
programs outside of annual deferred compensation and other corporate actions.
(b)
This adjustment adds back to Income (Loss) Before Provision (Benefit) for Taxes amounts for
the Amortization of Intangibles which are associated with Blackstone’s initial
public offering and other corporate actions. (c)
This adjustment adds back to Income (Loss) Before Provision (Benefit) for Taxes the amount of
(Income) Loss Associated with Non- Controlling Interests of Consolidated Entities
and includes the amount of Management Fee Revenues associated with Consolidated CLO
Entities. (d)
Taxes represent the current tax provision (benefit) calculated on Income (Loss) Before
Provision (Benefit) for Taxes. (e)
This adjustment removes from EI the total segment amount of Performance Fees.
(f)
This adjustment removes from EI the total segment amount of Investment Income (Loss).
(g)
This adjustment represents the realized and unrealized gain on Blackstone’s Treasury Cash
Management Strategies which are a component of Investment Income (Loss) but included in
Fee Related Earnings. (h)
This adjustment removes from expenses the compensation and benefit amounts related to
Blackstone’s profit sharing plans related to Performance Fees.
(i)
Represents the adjustment for realized Performance Fees net of corresponding actual amounts
due under Blackstone’s profit sharing plans related thereto.
(j)
Represents the adjustment for Blackstone’s Investment Income (Loss) -
Realized.
(k)
Represents the elimination of Realized Investment Income (Loss) attributable to
Blackstone’s Treasury Cash Management Strategies which is a component of both Fee
Related Earnings and Realized Investment Income (Loss).
(l)
Taxes and Related Payables Including Payable Under Tax Receivable Agreement represent the
current tax provision (benefit) calculated on Income (Loss) Before Provision (Benefit)
for Taxes and the Payable Under Tax Receivable Agreement.
(m)
Represents equity-based award expense included in EI. |
 Blackstone
30
Walkdown
of
Financial
Metrics
–
Calculation
of
Certain
Non-GAAP
Financial
Metric
Components
(Dollars in Thousands)
2Q'14
YTD'14
Interest Income and Dividend Revenue
22,094
$
44,456
$
Other Revenue
(6)
863
6,684
14,494
Interest Income and Other Revenue
28,772
$
59,813
$
Realized Incentive Fees
39,291
93,128
Less: Realized Incentive Fee Compensation
(18,509)
(42,144)
Net Realized Incentive Fees
20,782
$
50,984
$
Realized Carried Interest
641,659
975,282
Less: Realized Carried Interest Compensation
(260,301)
(409,699)
Net Realized Carried Interest
381,358
$
565,583
$
Realized Investment Income
202,199
314,116
(1,059)
(2,403)
Net Realized Investment Income
201,140
$
311,713
$
11,250
$
27,587
$
(44,841)
$
(75,895)
$
Unrealized Incentive Fees
56,776
118,042
Less: Unrealized Incentive Fee Compensation
(24,692)
(48,223)
Net Unrealized Incentive Fees
32,084
$
69,819
$
Unrealized Carried Interest
660,712
991,000
Less: Unrealized Carried Interest Compensation
(114,336)
(155,026)
Net Unrealized Carried Interest
546,376
$
835,974
$
Unrealized Investment Loss
(26,228)
(21,678)
(6,684)
(14,494)
1,059
2,403
Net Unrealized Investment Loss
(31,853)
$
(33,769)
$
19,809
$
39,551
$
See pages 28-29, Reconciliation of GAAP to Non-GAAP Measures for this
adjustment. Represents equity-based award expense included in Economic Income.
Represents tax-related payables including the Payable Under Tax Receivable
Agreement, which is a component of Taxes and Related Payables. Unless otherwise noted,
all amounts are the respective captions from the Total Segment information. (a)
(b)
(c)
Investment
Income
-
Blackstone's
Treasury
Cash
Management
Strategies
(a)
Adjustment
Related
to
Realized
Investment
(Income)
Loss
-
Blackstone's
Treasury
Cash
Management
Strategies
(a)
Less:
Investment
Income
-
Blackstone's
Treasury
Cash
Management
Strategies
(a)
Less:
Adjustment
Related
to
Realized
Investment
(Income)
Loss
-
Blackstone's
Treasury
Cash
Management
Strategies
(a)
Related Payables
(c)
Equity-Based Compensation
(b)
Taxes and Related Payable
(a) |
 Blackstone
31
Unit Rollforward
2Q'13
3Q'13
4Q'13
1Q'14
2Q'14
Total GAAP Weighted-Average Common Units Outstanding - Basic
583,843,094
589,643,844
592,129,570
601,527,299
606,690,740
Adjustments:
Weighted-Average Unvested Deferred Restricted Common Units
2,919,959
3,276,951
4,536,624
4,141,865
3,207,089
Total GAAP Weighted-Average Common Units Outstanding - Diluted
586,763,053
592,920,795
596,666,194
605,669,164
609,897,829
Adjustments:
Weighted-Average Blackstone Holdings Partnership Units
555,224,714
551,916,623
549,773,866
549,327,240
544,158,132
Weighted-Average Economic Net Income Adjusted Units
1,141,987,767
1,144,837,418
1,146,440,060
1,154,996,404
1,154,055,961
Economic Net Income Adjusted Units, End of Period
1,142,576,555
1,145,675,305
1,150,867,868
1,154,889,678
1,154,840,023
Total Common Units Outstanding
576,466,264
584,860,157
588,165,949
599,372,943
603,270,771
Adjustments:
Blackstone Holdings Partnership Units
550,902,208
550,274,903
547,021,277
541,129,472
538,074,958
Distributable Earnings Units Outstanding
1,127,368,472
1,135,135,060
1,135,187,226
1,140,502,415
1,141,345,729
Common Unitholders receive tax benefits from deductions taken by Blackstone’s corporate
tax paying subsidiaries and bear responsibility for the deduction from Distributable Earnings of
the Payable Under Tax Receivable Agreement and certain other tax-related payables.
Distributable Earnings Units Outstanding excludes units which are not entitled to distributions.
|
 Blackstone
32
Definitions and Distribution Policy
Blackstone discloses the following financial measures that are calculated and presented on the
basis of methodologies other than in accordance with generally accepted accounting
principles in the United States of America (“non-GAAP”) in this presentation:
•
Blackstone uses Economic Income, or “EI”, as a key measure of value creation, a
benchmark of its performance and in making resource deployment and compensation
decisions across its five segments. EI represents segment net income before taxes excluding transaction-related charges. Transaction-related charges
arise from Blackstone’s initial public offering (“IPO”) and long-term
retention programs outside of annual deferred compensation and other corporate actions,
including acquisitions. Transaction-related charges include equity-based compensation
charges, the amortization of intangible assets and contingent consideration associated
with acquisitions. EI presents revenues and expenses on a basis that deconsolidates the investment funds Blackstone manages.
•
Economic Net Income, or “ENI”, represents EI adjusted to include current period
taxes. Taxes represent the current tax provision (benefit) calculated on Income (Loss)
Before Provision for Taxes.
•
Blackstone uses Fee Related Earnings, or “FRE”, as a key measure to highlight
earnings from operations excluding: (a) the income related to performance fees and
related carry plan costs, (b) income earned from Blackstone’s investments in the
Blackstone Funds, and (c) realized and unrealized gains (losses) from other investments
except for such gains (losses) from Blackstone’s Treasury cash management strategies. Blackstone uses FRE as a measure to assess whether recurring
revenue from its businesses is sufficient to adequately cover all of its operating expenses
and generate profits. FRE equals contractual fee revenues, investment income from
Blackstone’s Treasury cash management strategies and interest income, less (a) compensation expenses (which includes amortization of non-IPO and
non-acquisition-related equity-based awards, but excludes amortization of IPO and
acquisition-related equity-based awards, carried interest and incentive fee
compensation), and (b) other operating expenses. •
Distributable Earnings, or “DE”, which is derived from Blackstone’s segment
reported results, is a supplemental measure to assess performance and amounts available
for distributions to Blackstone unitholders, including Blackstone personnel and others who are limited partners of the Blackstone Holdings partnerships.
DE is intended to show the amount of net realized earnings without the effects of the
consolidation of the Blackstone Funds. DE, which is a component of ENI, is the sum
across all segments of: (a) Total Management and Advisory Fees, (b) Interest and Dividend Revenue, (c) Other Revenue, (d) Realized Performance Fees, and
(e) Realized Investment Income (Loss); less (a) Compensation, excluding the expense of
equity-based awards, (b) Realized Performance Fee Compensation, (c) Other Operating
Expenses, and (d) Taxes and Related Payables Including the Payable Under Tax Receivable Agreement. DE is reconciled to Blackstone’s Consolidated
Statement of Operations.
•
Blackstone uses Adjusted Earnings Before Interest, Taxes and Depreciation and Amortization, or
“Adjusted EBITDA”, as a measure of segment performance and an indicator of
its ability to cover recurring operating expenses. Adjusted EBITDA equals DE before segment interest expense, segment depreciation and amortization,
and the taxes and related payables including the Payable Under Tax Receivable Agreement. •
Net Cash Available for Distribution to Common Unitholders is The Blackstone Group L.P.’s
share of Distributable Earnings, less realized investment gains and returns of capital
from investments and acquisitions, in excess of amounts determined by Blackstone’s general partner to be necessary or appropriate to provide for the
conduct of its business, to make appropriate investments in its business and funds, to comply
with applicable law, any of its debt instruments or other agreements, or to provide for
future cash requirements such as tax-related payments, clawback obligations and distributions to unitholders for any ensuing quarter. The amount
to be distributed could also be adjusted upward in any one quarter, taking into account both
the extent of realized investment gains and returns of capital from investments and
acquisitions, and the amounts determined by Blackstone’s general partner to be necessary or appropriate as described in the preceding sentence.
Distribution Policy. Blackstone’s intention is to distribute to common unitholders each
quarter substantially all of its Net Cash Available for Distribution to Common
Unitholders, subject to a minimum base quarterly distribution of $0.12 per unit. In
circumstances in which the Net Cash Available for Distribution to Common Unitholders
for a quarter falls short of the amount necessary to support such per unit distribution, Blackstone intends to correspondingly reduce subsequent quarterly
distributions below the amounts supported by the Net Cash Available for Distribution to Common
Unitholders by the amount of the shortfall, but not below $0.12 per unit. All of the
foregoing is subject to the qualification that the declaration and payment of any distributions are at the sole discretion of Blackstone’s general partner
and may change at any time, including, without limitation, to reduce the quarterly
distribution payable to common unitholders to less than $0.12 per unit or even to
eliminate such distributions entirely.
|
 Blackstone
33
Forward-Looking Statements
This presentation may contain forward-looking statements within the meaning of Section 27A
of the Securities Act of 1933 and Section 21E of the Securities Exchange Act of 1934
which reflect Blackstone’s current views with respect to, among other things,
Blackstone’s operations and financial performance. You can identify these
forward-looking statements by the use of words such as “outlook,”
“indicator,”
“believes,”
“expects,”
“potential,”
“continues,”
“may,”
“will,”
“should,”
“seeks,”
“approximately,”
“predicts,”
“intends,”
“plans,”
“estimates,”
“anticipates”
or the negative version of these words or other comparable words. Such forward-
looking statements are subject to various risks and uncertainties. Accordingly, there are or
will be important factors that could cause actual outcomes or results to differ
materially from those indicated in these statements. Blackstone believes these factors include but
are not limited to those described under the section entitled “Risk Factors”
in its Annual Report on Form 10-K for the fiscal year
ended December 31, 2013, as such factors may be updated from time to time in its periodic
filings with the Securities and Exchange Commission, which are accessible on the
SEC’s website at www.sec.gov. These factors should not be construed as exhaustive and
should be read in conjunction with the other cautionary statements that are included in this
presentation and in the filings. Blackstone undertakes no obligation to publicly update
or review any forward-looking statement, whether as a result of new
information, future developments or otherwise.
This presentation does not constitute an offer of any Blackstone
Fund. |