Attached files
| file | filename |
|---|---|
| 8-K - 8-K - NEW JERSEY RESOURCES CORP | d747670d8k.htm |
 New York Financial Community
NJR Chat
NJR Energy Services
June 25, 2014
Exhibit 99.1 |
 Regarding Forward-Looking Statements
1
Certain
statements
contained
in
this
presentation
are
forward-looking
statements
within
the
meaning
of
the
Private
Securities
Litigation
Reform
Act
of
1995.
Words
such
as
“anticipates,”
“estimates,”
“expects,”
“projects,”
“may,”
"will,"
“intends,”
“expects,”
"believes,"
or
“should”
and
similar
expressions
may
identify
forward-looking
information
and
such
forward-looking
statements
are
made
based
upon
management’s
current
expectations
and/or
beliefs
as
of
this
date
or
a
prior
date
concerning
future
developments and their potential effect upon New Jersey Resources (NJR or the
Company). There can be no assurance that future developments will be in accordance with
management’s expectations or that the effect of future developments on NJR
will be those anticipated by management. NJR cautions persons reading or hearing this
presentation that the assumptions that form the basis for forward-looking
statements including, but not limited to, certain statements regarding NJR's NFE for fiscal 2014,
forecasted contribution of business segments to fiscal 2014 NFE and to NFE
beyond fiscal 2014, NJR’s long-term NFE per share growth rate goal, and earnings guidance,
NJR’s future dividend growth rate and payout ratio, long-term benefits
of increased NFE, future NJNG capital expenditures, NJNG incremental utility gross margin, NJRES’
estimated margin for fiscal 2014, and NJR’s long-term NFE per share
growth rate include many factors that are beyond the Company’s ability to control or estimate
precisely,
such
as
estimates
of
future
market
conditions
and
the
behavior
of
other
market
participants.
The
factors
that
could
cause
actual
results
to
differ
materially
from
NJR’s
expectations
include,
but
are
not
limited
to,
weather
and
economic
conditions;
demographic
changes
in
the
NJNG
service
territory
and
their
effect
on
NJNG's
customer
growth;
volatility
of
natural
gas
and
other
commodity
prices
and
their
impact
on
NJNG
customer
usage, NJNG's Basic Gas Supply Service incentive programs, NJRES' operations and
on the Company's risk management efforts; changes in rating agency requirements
and/or credit ratings and their effect on availability and cost of capital to
the Company; the impact of volatility in the credit markets on our access to capital; the ability to
comply with debt covenants; the impact to the asset values and resulting higher
costs and funding obligations of NJR's pension and postemployment benefit plans as a result
of downturns in the financial markets, a lower discount rate, and impacts
associated with the Patient Protection and Affordable Care Act; accounting effects and other risks
associated with hedging activities and use of derivatives contracts; commercial
and wholesale credit risks, including the availability of creditworthy customers and
counterparties and liquidity in the wholesale energy trading market; the ability
to obtain governmental approvals and/or financing for the construction, development and
operation of certain non-regulated energy investments; risks associated with
the management of the Company's joint ventures and partnerships; risks associated with our
investments in renewable energy projects and our investment in an on-shore
wind developer, including the availability of regulatory and tax incentives, logistical risks and
potential
delays
related
to
construction,
permitting,
regulatory
approvals
and
electric
grid
interconnection,
the
availability
of
viable
projects
and
NJR's
eligibility
for
federal
investment tax credits (ITC), and production tax credits (PTC), the future
market for SRECs and operational risks related to projects in service; timing of qualifying for ITCs
due to delays or failures to complete planned solar energy projects and the
resulting effect on our effective tax rate and earnings; regulatory approval of NJNG’s planned
infrastructure programs; the level and rate at which NJNG's costs and expenses
(including those related to restoration efforts resulting from Superstorm Sandy) are incurred
and the extent to which they are allowed to be recovered from customers through
the regulatory process; access to adequate supplies of natural gas and dependence on
third-party storage and transportation facilities for natural gas supply;
operating risks incidental to handling, storing, transporting and providing customers with natural gas;
risks related to our employee workforce, including a work stoppage; the
regulatory and pricing policies of federal and state regulatory agencies; the possible expiration of
the NJNG Conservation Incentive Program (CIP); the costs of compliance with
present and future environmental laws, including potential climate change-related legislation;
risks related to changes in accounting standards; the disallowance of recovery
of environmental-related expenditures and other regulatory changes; environmental-related
and other litigation and other uncertainties; risks related to cyber-attack
or failure of information technology systems; and the impact of natural disasters, terrorist activities,
and other extreme events on our operations and customers, including any impacts
to utility gross margin and restoration costs. The aforementioned factors are detailed in
the “Risk Factors”
sections of our Annual Report on Form 10-K
filed on November 26, 2013, as filed with the Securities and Exchange
Commission (SEC) which is available on the SEC’s website at
sec.gov. Information included in this presentation is representative as
of today only and while NJR periodically reassesses material trends and
uncertainties affecting NJR's results of operations and financial condition in
connection with its preparation of management's discussion and analysis of results of operations
and financial condition contained in its Quarterly and Annual Reports filed with
the SEC, NJR does not, by including this statement, assume any obligation to review or revise
any particular forward-looking statement referenced herein in light of
future events. 1 |
 Disclaimer Regarding Non-GAAP Financial
Measures
2
2
This presentation includes the non-GAAP measures net financial
earnings (NFE), financial margin and utility gross margin. As an indicator of the
Company’s operating performance, these measures should not be
considered an alternative to, or more meaningful than, GAAP measures, such as cash
flow, net income, operating income or earnings per share. Net financial earnings (losses) and financial
margin exclude unrealized gains or losses on derivative instruments related to the Company’s unregulated
subsidiaries and certain realized gains and losses on derivative
instruments related to natural gas that has been placed into storage at NJRES. Volatility
associated with the change in value of these financial and physical
commodity contracts is reported in the income statement in the current period. In order
to manage its business, NJR views its results without the impacts of the
unrealized gains and losses, and certain realized gains and losses, caused by
changes in value of these financial instruments and physical commodity
contracts prior to the completion of the planned transaction because it shows
changes in value currently as opposed to when the planned transaction
ultimately is settled. NJNG’s utility gross margin represents the results of revenues
less natural gas costs, sales and other taxes and regulatory rider
expenses, which are key components of the Company’s operations that move in relation
to each other.
Management uses NFE, financial margin and utility gross margin as supplemental
measures to other GAAP results to provide a more complete understanding of
the Company’s performance. Management believes these non-GAAP
measures are more reflective of the Company’s business model, provide transparency to investors
and enable period-to-period comparability of financial performance. For a
full discussion of our non-GAAP financial measures, please see
NJR’s most recent Form 10-K, Item 7 and most recent Form 10-Q, Item 2. This
information has been provided pursuant to the requirements of SEC Regulation
G. |
 Current Long-Term NFEPS Guidance
3
New
projected
growth
rate
Prior
projected
growth
rate
$1.00
$1.50
$2.00
$2.50
$3.00
$3.50
$4.00
$4.50
2009A
2010A
2011A
2012A
2013A
2014E
2015E
2016E
2017E
$2.40
$2.46
$2.58
$2.71
$2.73
$3.90 -$4.10
$3.28-$3.71
Previous
New
NJR expects an average long-term growth rate of 5 to 9 percent
annually |
 Fiscal 2015-2017 Earnings Guidance
4
NJR expects regulated businesses to contribute
65-80 percent of total NFE
New Jersey Natural Gas
NJR
Clean
Energy
Ventures
NJR Energy Services
NJR Midstream
NJR Home Services
35-40%
5-15%
45-50%
3-10%
2-5%
Most Recent
Fiscal 2014
Guidance
Fiscal 2015
through
Fiscal 2017
60-70%
10-20%
5-15%
5-10%
2-5% |
 Capital of Over $1 Billion Drives Long-Term
Growth
5
Over
50
percent
of
capital
expenditures
are
earning
an
immediate
return
*As proposed
($mm)
2013A
2014E
2015E
2016E
2017E
Total
Customer Growth
$79.4
$24.5
$24.7
$25.6
$25.5
$25.5
$205.2
Yes
Maintenance/Other
177.4
42.5
64.2
55.7
48.1
40.6
$428.5
AIP/SAFE
136.7
45.3
31.6
33.7
39.1
-
286.4
Yes
Superstorm Sandy
-
26.1
5.3
5.2
-
-
36.6
NGV Advantage
-
1.0
9.0
-
-
-
10.0
Yes
NJ RISE
-
-
4.6
13.0
12.0
12.0
41.6
Yes*
Liquefaction/LNG
-
-
16.0
16.3
3.4
-
35.7
Southern Reliability
-
-
2.3
12.3
80.6
34.8
130.0
SAVEGREEN
36.5
24.0
42.5
42.5
-
-
145.5
Yes
Total
$430.0
$163.4
$200.2
$204.3
$208.7
$112.9
$1,319.5
2009-
2012
Actual
Immediate
Return
NJNG Capital Investment Estimates |
 Diversified and Growing Utility Gross Margin
NJR expects incremental utility gross margin to more than double
by Fiscal 2017
6
$0.0
$5.0
$10.0
$20.0
$25.0
$30.0
$35.0
$40.0
$45.0
FY13A
FY14E
FY15E
FY16E
FY17E
Customer Growth
SAVEGREEN
NGV
BGSS Incentives
$20.3
$29.3
$36.0
$41.3
$15.6
$15.0 |
 NJRES: What We Do
Manage physical natural gas assets
Storage
Transportation
Supply Contracts
Services include:
Transport natural gas to customers
Storage gas used to serve customers when demand is high
Manage other companies’
assets
Producer Services
Fee-based service
Revenue dependent on volume sales, not volatility
Customer relationships
Utilities, power generators, storage operators, pipelines and industrial
customers across North America including Marcellus Shale
7 |
 NJRES: Our Track Record
In business since 1995; consistently profitable*
Average tenure of employees is 10+ years
Specializes in managing physical natural gas assets
* On an annual NFE basis
$0.0
$20.0
$40.0
$60.0
$80.0
$100.0
$120.0
$140.0
$160.0
$180.0
2004
2005
2006
2007
2008
2009
2010
2011
2012
2013
FYTD 14
Margin
NFE
8 |
 9
NJRES: Our Asset Base
Firm Storage
Firm Transportation
Producer Service Area
Typical annual portfolio:
Storage capacity –
Approximately 40 Bcf in the United States and Canada
Pipeline transportation capacity –
Approximately 1.5 Bcf/day |
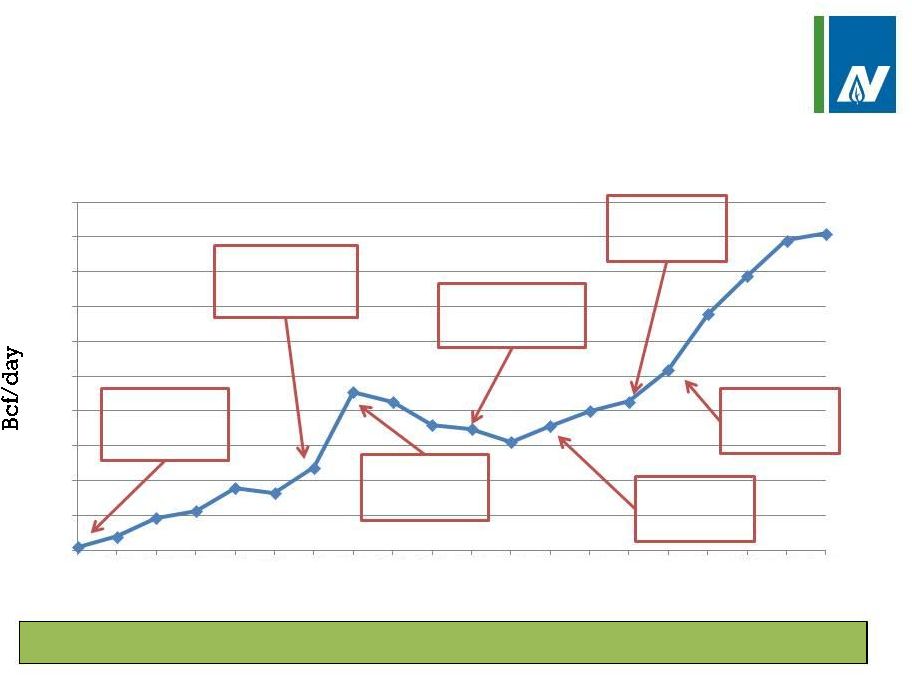 NJRES: How has the Business Changed?
10
Our business has evolved with new products and services
Volumes Sold
Pipeline Asset
Management
(TGPL Block sale)
First LDC
Outsourcing Deal
(NIMO)
Marcellus
Producer
Services
Service
Contract with
Electric Utility
Storage
Management
(Stagecoach)
Barnett
Producer
Services
Geographic
Expansion
(Westbook)
0.00
0.20
0.40
0.60
0.80
1.00
1.20
1.40
1.60
1.80
2.00
1995
1996
1997
1998
1999
2000
2001
2002
2003
2004
2005
2006
2007
2008
2009
2010
2011
2012
2013
FTYD
2014 |
 NJRES: How Do We Make Money?
Our portfolio consists of two types of physical assets
Storage capacity -
40 Bcf in the US and Canada
Transportation capacity –
1.5 Bcf/day
We optimize transportation and storage capacity
Pipeline transportation allows for natural gas to be purchased in one
location and sold in another; leased for various periods of time
Pipeline transportation provides opportunity to capture locational spreads
Storage transactions allow for the injection of gas which is hedged for future
sale
Storage capacity is leased for various periods and provides opportunity to
realize time spreads
Depending on volatility and market conditions, storage and transportation
hedges can be re-positioned to capture incremental value at any time until
physical delivery
11 |
 NJRES: How Do We Make Money? (cont’d)
We manage other companies’
assets
Sharing or fee based
We are focused on long-option strategy and disciplined risk
management
Limits downside
Transactions have upside potential
Profits tend to be higher in the first two fiscal quarters
As assets are added to portfolio, demand charges are incurred
Expenses can outpace revenue for a month or quarter
Recovery of annual demand fees often occurs over three to six month
periods
12 |
 NJRES: How We Manage Risk?
Hedge price risk of gas in storage
Disciplined risk management guidelines
Limited open positions
Strict internal controls and credit procedures
Daily compliance monitoring by financial department
IT systems customized to manage physical natural gas assets
Long option strategy
Commodity pricing is hedged
Creates upside when market conditions are volatile
13 |
 NJRES: How Do We Maintain a Hedged
Position with Upside Potential?
14
No Market Volatility
Market Volatility
January 2013
July 2014
January 2013
July 2014
NJRES buys 10,000 dth
@ $4.00 and injects
into storage
NJRES sells 10,000 dth
@ $4.50 to meet
physical sale
NJRES buys 10,000
dth @ $4.00 and
injects into storage
NJRES sells 10,000
dth (from storage)
into spot market @
$30/dth and makes
a physical sale
NJRES sells 1 Futures
contract (10,000 dth)
for July 2014 @ $4.50
Futures contract
expires
NJRES sells 1 Futures
contract (10,000 dth)
for July 2014 @ $4.50
NJRES buys 1
Futures contract
(10,000 dth), July
2014 @ $4.70
NJRES earns $.50 on
physical sale and
delivery to customer
NJRES earns $25.80,
composed of $26
gain on sale, less
$.20 loss on futures
expiration
P
H
Y
S
I
C
A
L
F
I
N
A
N
C
I
A
L
R
E
S
U
L
T |
 NJRES: What Happened This Winter?
Weather is always the unknown variable
Increased supply created growing physical natural gas market
Created need for physical natural gas services
Market players thinned by:
Regulation -
e.g. Dodd-Frank eliminated financial players
Low volatility and illiquidity –
reduced number of market makers
NJRES remained committed to this business
Increased the geographic size of our book of assets
Added producer services to contribute nonvolatile income
As a result:
Asset prices were cheap
NJRES was able to assemble and retain a greater number of long options
heading into last winter
Executing this strategy created the opportunity for the considerable upside
experienced in Q2 Fiscal 2014
15 |
 16
NJRES: Things to Watch –
Causes of Summer
Volatility
Weather is always the unknown variable
Sector demands
Electric generation, industrials, storage refill
Gas storage levels
Historically low end-of-season levels; ~1 Tcf below average
Refill challenges
Lower Canadian imports
Higher exports to Mexico
Cross-commodity pricing
Oil
Coal
Renewables
Natural gas production changes
Shifts in production basins
Daily production of 67-68 Bcf
Natural gas rig count near historical low
New carbon rules |