Attached files
| file | filename |
|---|---|
| 8-K - FORM 8-K - CHICAGO BRIDGE & IRON CO N V | v380685_8k.htm |

A World of Solutions The Most Complete Energy Infrastructure Focused Company in the World CB&I Investor Presentation Credit Suisse Conference June 5, 2014
A World of Solutions This presentation contains forward - looking statements regarding CB&I and represents our expectations and beliefs concerning future events . These forward - looking statements are intended to be covered by the safe harbor for forward - looking statements provided by the Private Securities Litigation Reform Act of 1995 . Forward - looking statements involve known and unknown risks and uncertainties . When considering any statements that are predictive in nature, depend upon or refer to future events or conditions, or use or contain words, terms, phrases, or expressions such as “achieve”, “forecast”, “plan”, “propose”, “strategy”, “envision”, “hope”, “will”, “continue”, “potential”, “expect”, “believe”, “anticipate”, “project”, “estimate”, “predict”, “intend”, “should”, “could”, “may”, “might”, or similar forward - looking statements, we refer you to the cautionary statements concerning risk factors and “Forward - Looking Statements” described under “Risk Factors” in Item 1 A of our Annual Report filed on Form 10 - K filed with the SEC for the year ended December 31 , 2013 , and any updates to those risk factors or “Forward - Looking Statements” included in our subsequent Quarterly Reports on Form 10 - Q filed with the SEC, which cautionary statements are incorporated herein by reference . . Safe Harbor Statement 2

A World of Solutions 3 Overview ▪ Market Cap $~ 8.8 Billion (June 2014 ) ▪ $30.7 Billion Backlog (March 31, 2014 ) ▪ Over 55,000 employees worldwide ▪ 125 years of experience and expertise in reliable solutions ▪ Relentless focus on safety: 0.03 LTIR in Q1 2014
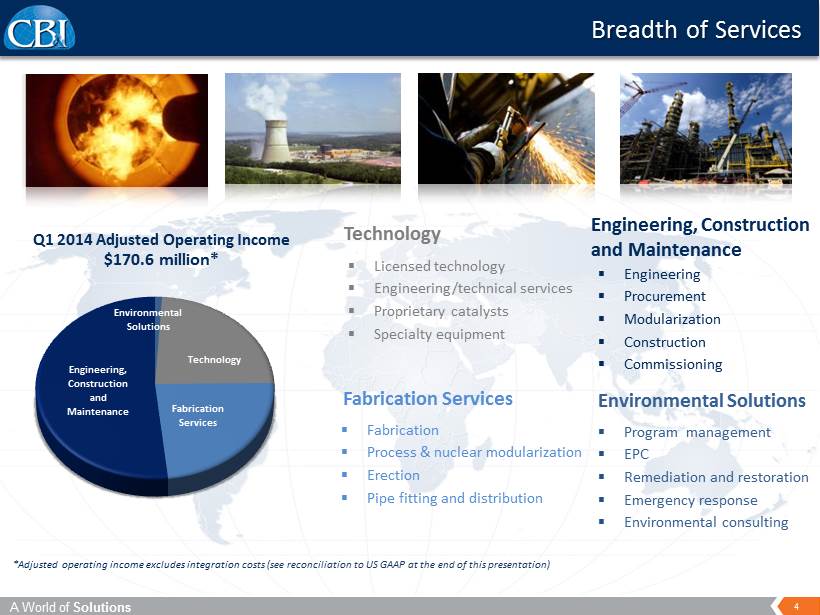
A World of Solutions 4 Breadth of Services Technology Technology Fabrication Services ▪ Fabrication ▪ Process & nuclear m odularization ▪ Erection ▪ Pipe fitting and distribution ▪ Engineering ▪ Procurement ▪ Modularization ▪ Construction ▪ Commissioning Engineering, Construction and Maintenance Technology ▪ Licensed technology ▪ Engineering/technical services ▪ Proprietary catalysts ▪ Specialty equipment Environmental Solutions ▪ Program management ▪ EPC ▪ Remediation and restoration ▪ Emergency response ▪ Environmental consulting *Adjusted operating income excludes integration costs (see reconciliation to US GAAP at the end of this presentation) Q1 2014 Adjusted Operating Income $170.6 million* Environmental Solutions Technology Fabrication Services Engineering, Construction and Maintenance

A World of Solutions 5 More Complete Supply Chain Solution Engineering Procurement Construction Operations & Maintenance Close - out Fabrication Permitting Traditional EPC solutions Specialized project lifecycle offerings FEED Technology ▪ Add value t hroughout the project l ifecycle ▪ Operational consistency through standardization Vertically Integrated Project Lifecycle

A World of Solutions 6 Experience and Global Reach Experience and Global Reach 50+ years 75+ years 125 years 70+ years 100+ years 75+ years 70+ years

A World of Solutions 7 DIVERSIFICATION IN END MARKETS Diversification Across Energy Infrastructure

A World of Solutions 8 Technology Overview Differentiation ▪ Most complete portfolio of olefins technologies ▪ World leader in heavy oil upgrading technologies ▪ Breadth of technologies provides complete solutions Strategic Benefit ▪ Recurring earnings streams ▪ Operating income driver ▪ Early visibility to customers Capabilities ▪ P etrochemical, gas processing and refining technologies ▪ Proprietary equipment and engineered products ▪ Specialty catalysts ▪ Consulting and technical services

A World of Solutions 9 Differentiation ▪ Market position ▪ Contracting flexibility ▪ Global footprint ▪ Self - perform capabilities Strategic Benefit ▪ Critical mass ▪ Revenue driver ▪ Nuclear uprate opportunities Engineering, Construction and Maintenance Overview Capabilities ▪ E ngineering, procurement, and construction (EPC) ▪ Oil and G as ▪ Power ▪ Plant services, including maintenance, upgrades and uprates, modifications and refueling ▪ Increasing use of modularization

A World of Solutions 10 Fabrication Services Overview Differentiation ▪ B rand leadership; mega project capability in plate structures, pipe fabrication, modules ▪ L arge - scale fabrication facilities and yards throughout the world ▪ Induction bending technology drives quality and savings Strategic Benefit ▪ Stable business underpinning ▪ Client access Capabilities ▪ Engineering, procurement, fabrication, and erection of bulk liquid and gas storage, nuclear containment and other specialty structures ▪ Pipe and structural fabrication; process & nuclear modules; pipe & fitting distribution ▪ Self - perform fabrication and erection capabilities worldwide

A World of Solutions 11 Differentiation ▪ Most comprehensive provider of products and services ▪ Proprietary programs and products for waste clean - up ▪ Rapid mobilization of qualified early responders Environmental Solutions Overview Strategic Benefit ▪ Diversification reduces impact of market cyclicality ▪ Stable business underpinning ▪ Broadens offering to existing CB&I clients (synergy) ▪ Worldwide governmental relationships Capabilities ▪ Environmental Remediation & Restoration ▪ Program management (e.g., M&O of military installations, energy efficiency) ▪ EPC of infrastructure for government related projects ▪ Environmental consulting and engineering ▪ Support for emergency response and disaster recovery ▪ Mission - Critical Support Operations

A World of Solutions 12 ▪ Established processes, procedures and systems for large - scale, mass recruitment ▪ Established recruiting hubs within areas of projected growth ▪ Available resources to recruit qualified craft labor (e.g., databases, agencies) ▪ Company of choice ▪ Career path plans ▪ Future employment opportunities ▪ Mentorship ▪ Continuous Safety training ▪ Craft labor training ▪ Supervisor’s training ▪ Project managers academy Attract & Recruit Retain Train Direct Hire Advantage

A World of Solutions 13 Revenue/Backlog • 2014 revenues illustrate 2014 guidance range of $12.6b to $13.2b ** Backlog as of March 31, 2014 $- $5,000 $10,000 $15,000 $20,000 $25,000 $30,000 2000 2001 2002 2003 2004 2005 2006 2007 2008 2009 2010 2011 2012 2013 2014 $ Millions BACKLOG Guidance
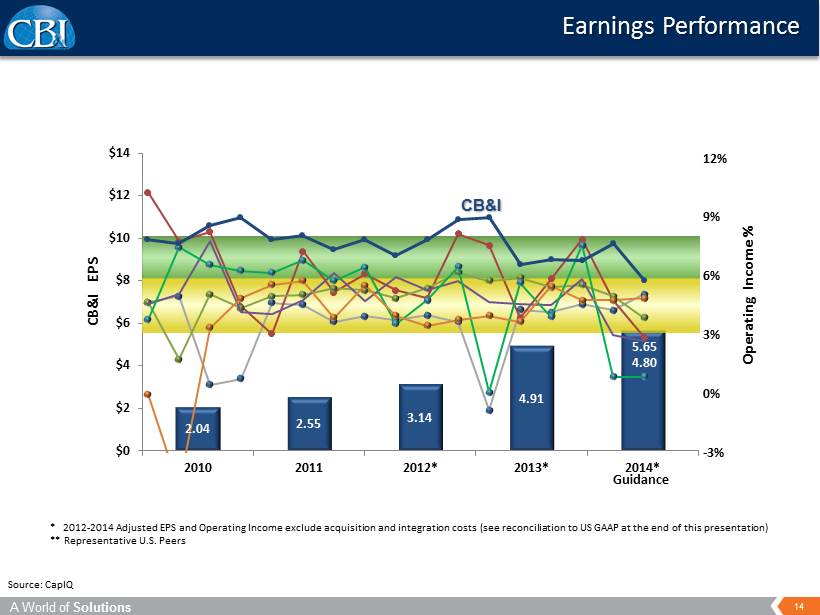
A World of Solutions 14 2.55 3.14 4.91 $0 $2 $4 $6 $8 $10 $12 $14 2010 2011 2012* 2013* 2014* CB&I EPS -3% 0% 3% 6% 9% 12% Earnings Performance * 2012 - 2014 Adjusted EPS and Operating Income exclude acquisition and integration costs (see reconciliation to US GAAP at the end of this presentation) ** Representative U.S. Peers Operating Income % 5.65 4.80 CB&I Guidance 2.04 Source: CapIQ
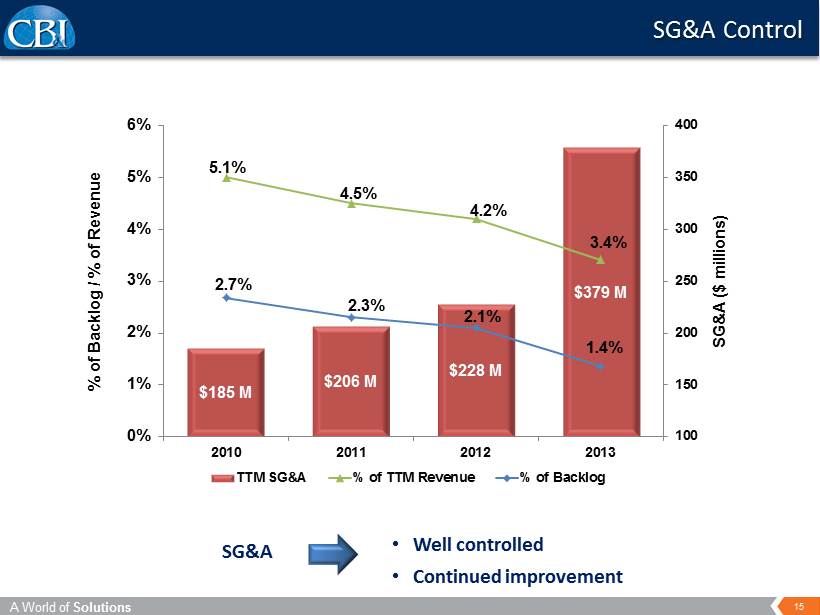
A World of Solutions 15 SG&A • Well controlled • Continued improvement SG&A Control $185 M $206 M $228 M $379 M 5.1% 4.5% 4.2% 3.4% 2.7% 2.3% 2.1% 1.4% 100 150 200 250 300 350 400 0% 1% 2% 3% 4% 5% 6% 2010 2011 2012 2013 SG&A ($ millions) % of Backlog / % of Revenue TTM SG&A % of TTM Revenue % of Backlog

A World of Solutions 16 Continued Capital Strategy Maintain a conservative and flexible capital structure ▪ Adequate bank facility capacity ▪ Manageable debt service, with flexibility to substantially reduce debt ▪ Minimal interest rate risk Support strategic growth opportunities Deliver value to shareholders ▪ Significant flexibility and availability for share repurchase activity ▪ Continue quarterly cash dividends

A World of Solutions 17

18 A World of Solutions Supplemental Information Chicago Bridge & Iron Company N.V. Reconciliation of Non-GAAP Supplemental Information (in thousands, except per share data) 2014 2013 Adjusted income from operations Income from operations 162,483$ 86,514$ Acquisition and integration related costs 8,067 61,256 Adjusted income from operations 170,550$ 147,770$ Adjusted % of Revenue 5.8% 6.6% Adjusted net income attributable to CB&I Net income attributable to CB&I 88,951$ 33,608$ Acquisition and integration related costs, net of tax (1) 5,486 51,248 Adjusted net income attributable to CB&I 94,437$ 84,856$ Adjusted net income attributable to CB&I per share Net income attributable to CB&I 0.82$ 0.32$ Acquisition and integration related costs, net of tax (1) 0.05 0.50 Adjusted net income attributable to CB&I 0.87$ 0.82$ (1) ThethreemonthperiodendedMarch31,2013,includes$61,256ofacquisitionandintegration related costs and $10,517 of acquisition related pre-closing financing costs and one-time financialcommitments(bothincludedininterestexpense).Thesecoststotal$71,773lessthe taximpactof$20,525.Thepershareamountforthethreemonthperiodisbasedupondiluted weighted average shares of 103,507. ThethreemonthperiodendedMarch31,2014,includes$8,067ofintegrationrelatedcosts, lessthetaximpactof$2,581.Thepershareamountforthethreemonthperiodisbasedupon diluted weighted average shares of 109,113. Three Months Ended March 31,

19 A World of Solutions Supplemental Information Chicago Bridge & Iron Company N.V. Reconciliation of Non-GAAP Supplemental Information (in thousands, except per share data) 2013 2012 Adjusted income from operations Income from operations 684,508$ 455,643$ Acquisition and integration related costs 95,737 11,000 Adjusted income from operations 780,245$ 466,643$ Adjusted % of Revenue 7.0% 8.5% Adjusted net income attributable to CB&I Net income attributable to CB&I 454,120$ 301,655$ Acquisition and integration related costs, net of tax (1) 73,316 7,143 Adjusted net income attributable to CB&I 527,436$ 308,798$ Adjusted net income attributable to CB&I per share Net income attributable to CB&I 4.23$ 3.07$ Acquisition and integration related costs, net of tax (1) 0.68 0.07 Adjusted net income attributable to CB&I 4.91$ 3.14$ (1) Note: 2014 adjusted earnings per share guidance excludes anticipated integration costs of $20,000 with a tax benefit of $7,000 or $0.12 per share. GAAP earnings per share are estimated to be $4.68 to $5.53. Twelve Months Ended December 31, ThetwelvemonthperiodendedDecember31,2012includes$11,000ofacquisitionand integrationrelatedcosts,lessthetaximpact of$3,857. Theper shareamount forthe twelve month period is based upon diluted weighted average shares of 98,231. ThetwelvemonthperiodendedDecember31,2013includes$95,737ofacquisitionand integrationrelatedcostsand$10,517ofacquisitionrelatedpre-closingfinancingcostsand one-timefinancialcommitments(bothincludedininterestexpenseandrecordedinQ1). Thesecoststotal$106,254,lessthetaximpactof$32,938.Thepershareamountforthe twelve month period is based upon diluted weighted average shares of 107,452.