Attached files
| file | filename |
|---|---|
| 8-K - 8-K - STONEGATE MORTGAGE CORP | fdinvestorpresentationform.htm |
Keefe, Bruyette & Woods 2014 Mortgage Finance Conference June 3, 2014
Color Scheme 223 100 31 0 200 195 106 175 232 136 182 74 255 204 0 0 131 203 Forward Looking Statements FORWARD-LOOKING STATEMENTS: Our presentation contains certain forward-looking statements. These forward-looking statements may be identified by a reference to a future period or by the use of forward-looking terminology. They involve risks and uncertainties that could cause the company’s actual results to differ materially from the results discussed in the forward-looking statements. Important factors that could cause actual results to differ include, but are not limited to, our future production, revenues, income, capital spending, related general economic and market conditions, delinquency rates, trends for home prices, uncertainties related to acquisitions, including our ability to integrate the systems, procedures and personnel from other companies, as well as other risks discussed in the “Risk Factors” section within our Annual Report on Form 10-K, which was filed with the U.S. Securities and Exchange Commission on March 14, 2014. These forward-looking statements speak only as of the date they are made and except for our ongoing obligations under the U.S. federal securities laws, we undertake no obligation to update or revise forward-looking statements whether as a result of new information, future events or otherwise. 2
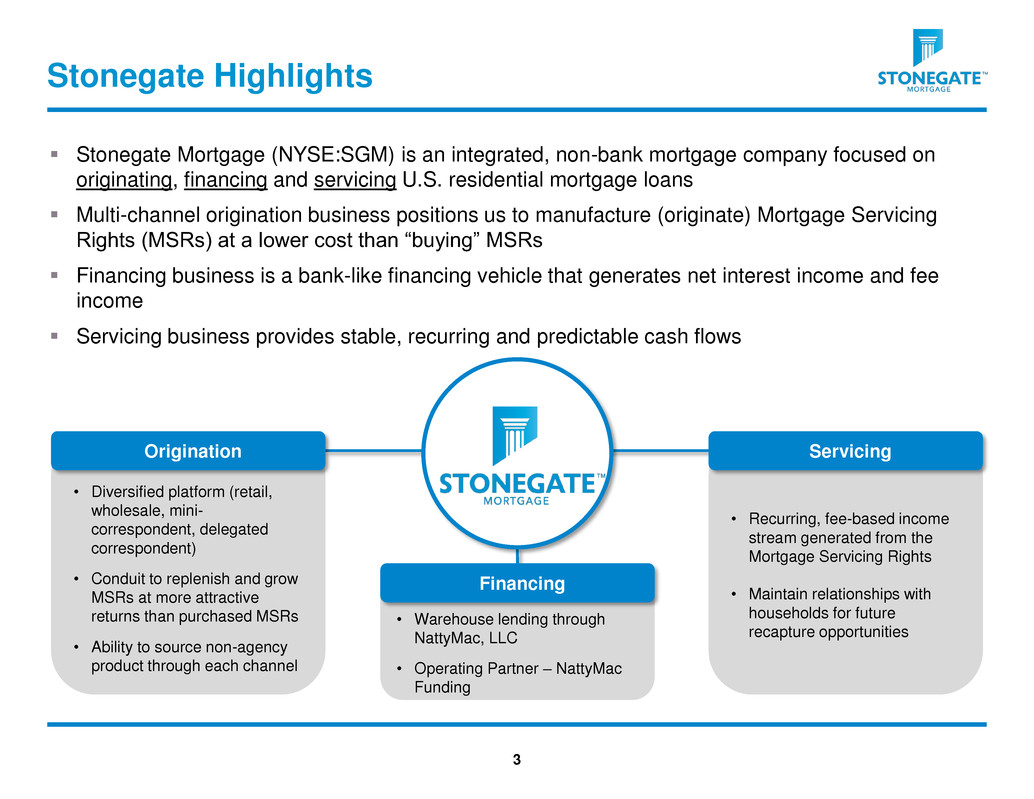
Color Scheme 223 100 31 0 200 195 106 175 232 136 182 74 255 204 0 0 131 203 • Recurring, fee-based income stream generated from the Mortgage Servicing Rights • Maintain relationships with households for future recapture opportunities • Warehouse lending through NattyMac, LLC • Operating Partner – NattyMac Funding Stonegate Highlights Stonegate Mortgage (NYSE:SGM) is an integrated, non-bank mortgage company focused on originating, financing and servicing U.S. residential mortgage loans Multi-channel origination business positions us to manufacture (originate) Mortgage Servicing Rights (MSRs) at a lower cost than “buying” MSRs Financing business is a bank-like financing vehicle that generates net interest income and fee income Servicing business provides stable, recurring and predictable cash flows • Diversified platform (retail, wholesale, mini- correspondent, delegated correspondent) • Conduit to replenish and grow MSRs at more attractive returns than purchased MSRs • Ability to source non-agency product through each channel Origination Financing Servicing 3
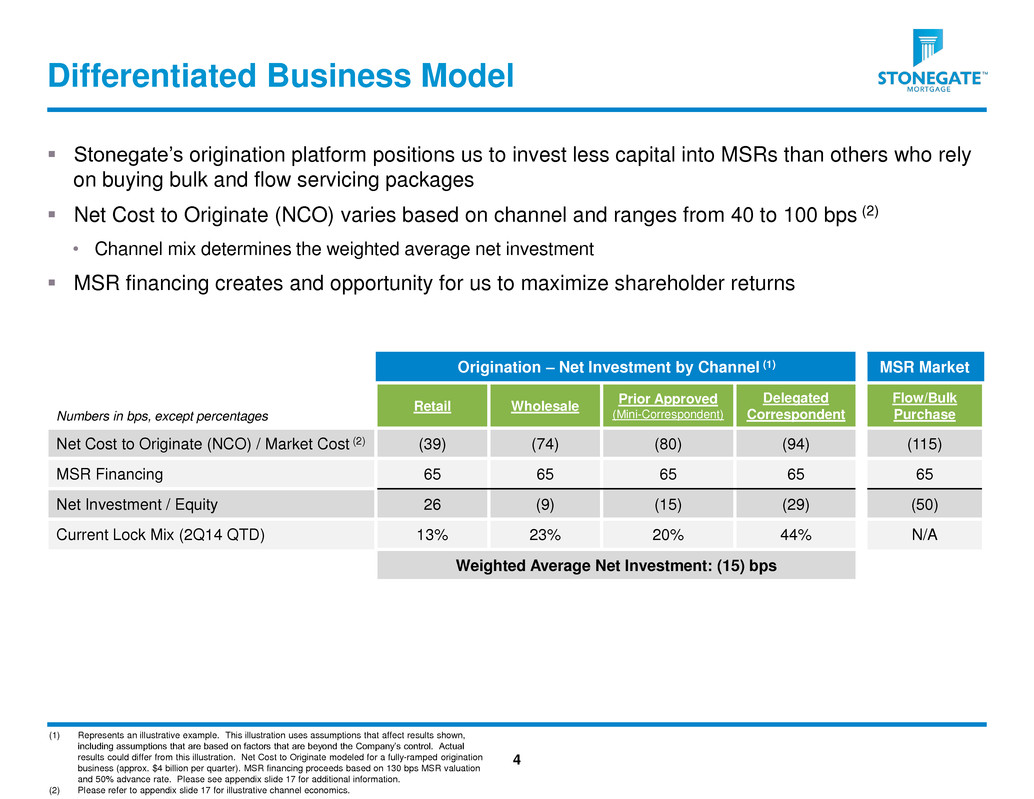
Color Scheme 223 100 31 0 200 195 106 175 232 136 182 74 255 204 0 0 131 203 Differentiated Business Model 4 Origination – Net Investment by Channel (1) MSR Market Numbers in bps, except percentages Retail Wholesale Prior Approved (Mini-Correspondent) Delegated Correspondent Flow/Bulk Purchase Net Cost to Originate (NCO) / Market Cost (2) (39) (74) (80) (94) (115) MSR Financing 65 65 65 65 65 Net Investment / Equity 26 (9) (15) (29) (50) Current Lock Mix (2Q14 QTD) 13% 23% 20% 44% N/A Weighted Average Net Investment: (15) bps Stonegate’s origination platform positions us to invest less capital into MSRs than others who rely on buying bulk and flow servicing packages Net Cost to Originate (NCO) varies based on channel and ranges from 40 to 100 bps (2) • Channel mix determines the weighted average net investment MSR financing creates and opportunity for us to maximize shareholder returns (1) Represents an illustrative example. This illustration uses assumptions that affect results shown, including assumptions that are based on factors that are beyond the Company’s control. Actual results could differ from this illustration. Net Cost to Originate modeled for a fully-ramped origination business (approx. $4 billion per quarter). MSR financing proceeds based on 130 bps MSR valuation and 50% advance rate. Please see appendix slide 17 for additional information. (2) Please refer to appendix slide 17 for illustrative channel economics.
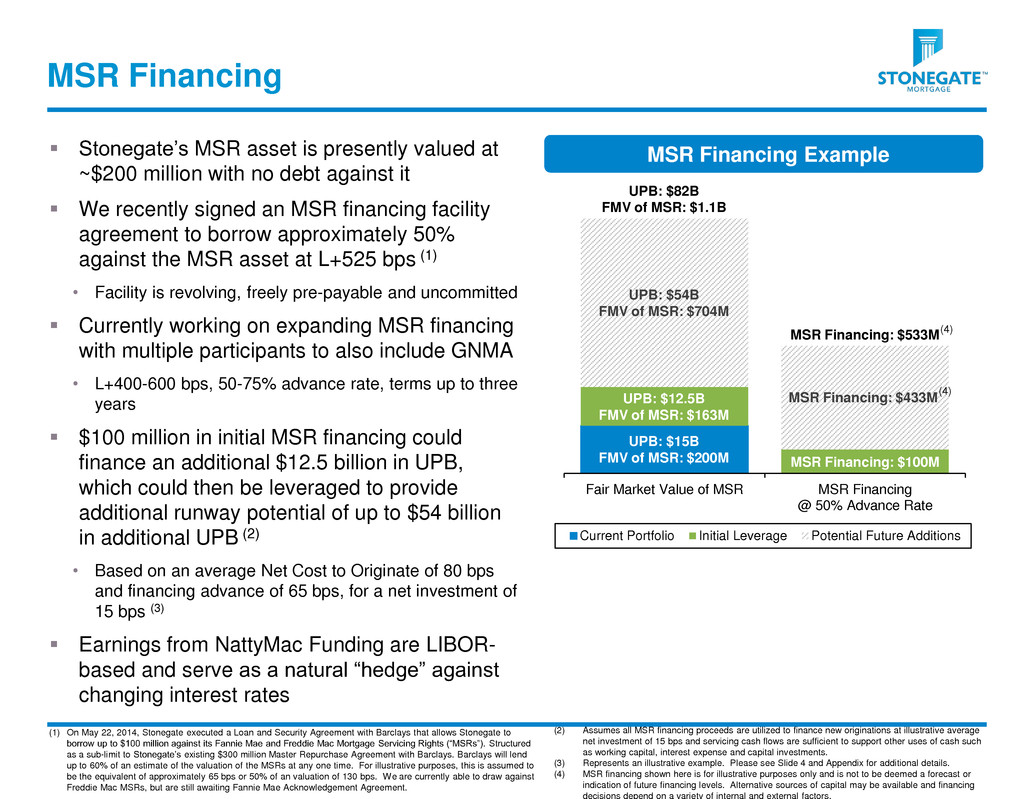
Color Scheme 223 100 31 0 200 195 106 175 232 136 182 74 255 204 0 0 131 203 MSR Financing Stonegate’s MSR asset is presently valued at ~$200 million with no debt against it We recently signed an MSR financing facility agreement to borrow approximately 50% against the MSR asset at L+525 bps (1) • Facility is revolving, freely pre-payable and uncommitted Currently working on expanding MSR financing with multiple participants to also include GNMA • L+400-600 bps, 50-75% advance rate, terms up to three years $100 million in initial MSR financing could finance an additional $12.5 billion in UPB, which could then be leveraged to provide additional runway potential of up to $54 billion in additional UPB (2) • Based on an average Net Cost to Originate of 80 bps and financing advance of 65 bps, for a net investment of 15 bps (3) Earnings from NattyMac Funding are LIBOR- based and serve as a natural “hedge” against changing interest rates (1) On May 22, 2014, Stonegate executed a Loan and Security Agreement with Barclays that allows Stonegate to borrow up to $100 million against its Fannie Mae and Freddie Mac Mortgage Servicing Rights (“MSRs”). Structured as a sub-limit to Stonegate’s existing $300 million Master Repurchase Agreement with Barclays. Barclays will lend up to 60% of an estimate of the valuation of the MSRs at any one time. For illustrative purposes, this is assumed to be the equivalent of approximately 65 bps or 50% of an valuation of 130 bps. We are currently able to draw against Freddie Mac MSRs, but are still awaiting Fannie Mae Acknowledgement Agreement. MSR Financing Example Fair Market Value of MSR MSR Financing @ 50% Advance Rate Current Portfolio Initial Leverage Potential Future Additions UPB: $15B FMV of MSR: $200M UPB: $82B FMV of MSR: $1.1B MSR Financing: $533M MSR Financing: $100M UPB: $12.5B FMV of MSR: $163M UPB: $54B FMV of MSR: $704M MSR Financing: $433M (2) Assumes all MSR financing proceeds are utilized to finance new originations at illustrative average net investment of 15 bps and servicing cash flows are sufficient to support other uses of cash such as working capital, interest expense and capital investments. (3) Represents an illustrative example. Please see Slide 4 and Appendix for additional details. (4) MSR financing shown here is for illustrative purposes only and is not to be deemed a forecast or indication of future financing levels. Alternative sources of capital may be available and financing decisions depend on a variety of internal and external factors. (4) (4)
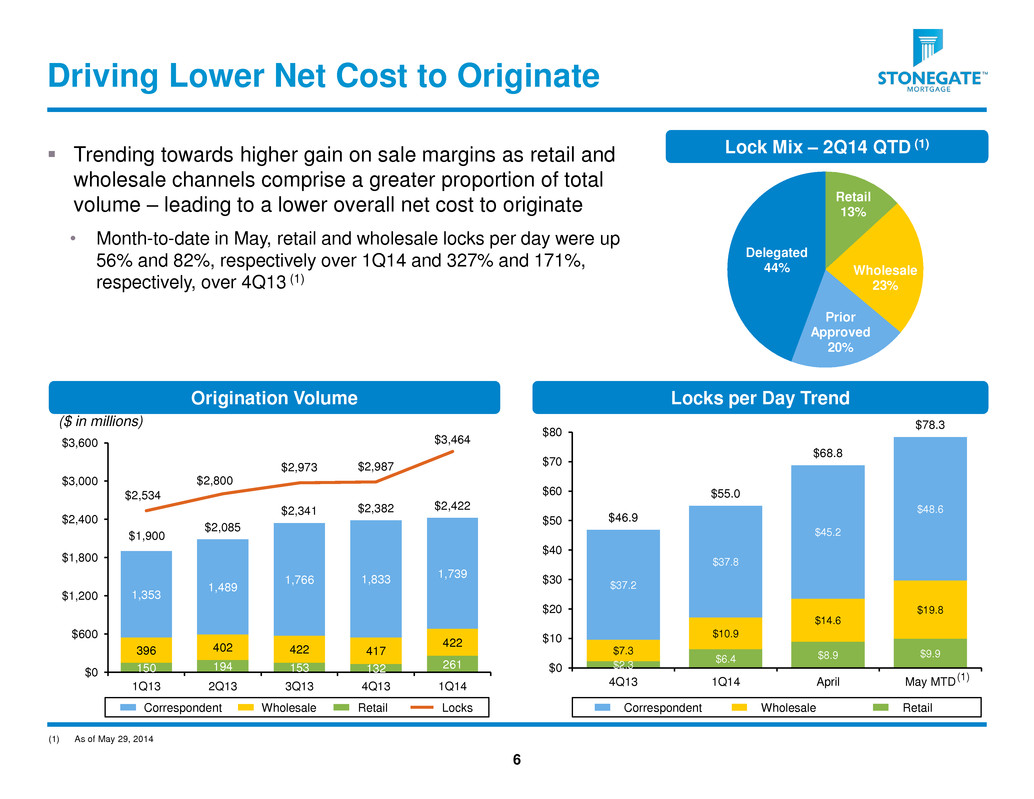
Color Scheme 223 100 31 0 200 195 106 175 232 136 182 74 255 204 0 0 131 203 $2.3 $6.4 $8.9 $9.9 $7.3 $10.9 $14.6 $19.8 $37.2 $37.8 $45.2 $48.6 $46.9 $55.0 $68.8 $78.3 $0 $10 $20 $30 $40 $50 $60 $70 $80 4Q13 1Q14 April May MTD 150 194 153 132 261 396 402 422 417 422 1,353 1,489 1,766 1,833 1,739 $1,900 $2,085 $2,341 $2,382 $2,422 $2,534 $2,800 $2,973 $2,987 $3,464 $0 $600 $1,200 $1,800 $2,400 $3,000 $3,600 1Q13 2Q13 3Q13 4Q13 1Q14 Driving Lower Net Cost to Originate 6 Lock Mix – 2Q14 QTD (1) Retail 13% Wholesale 23% Prior Approved 20% Delegated 44% Correspondent Wholesale Retail Locks per Day Trend ($ in millions) Origination Volume Correspondent Wholesale Locks Retail Trending towards higher gain on sale margins as retail and wholesale channels comprise a greater proportion of total volume – leading to a lower overall net cost to originate • Month-to-date in May, retail and wholesale locks per day were up 56% and 82%, respectively over 1Q14 and 327% and 171%, respectively, over 4Q13 (1) (1) As of May 29, 2014 (1)
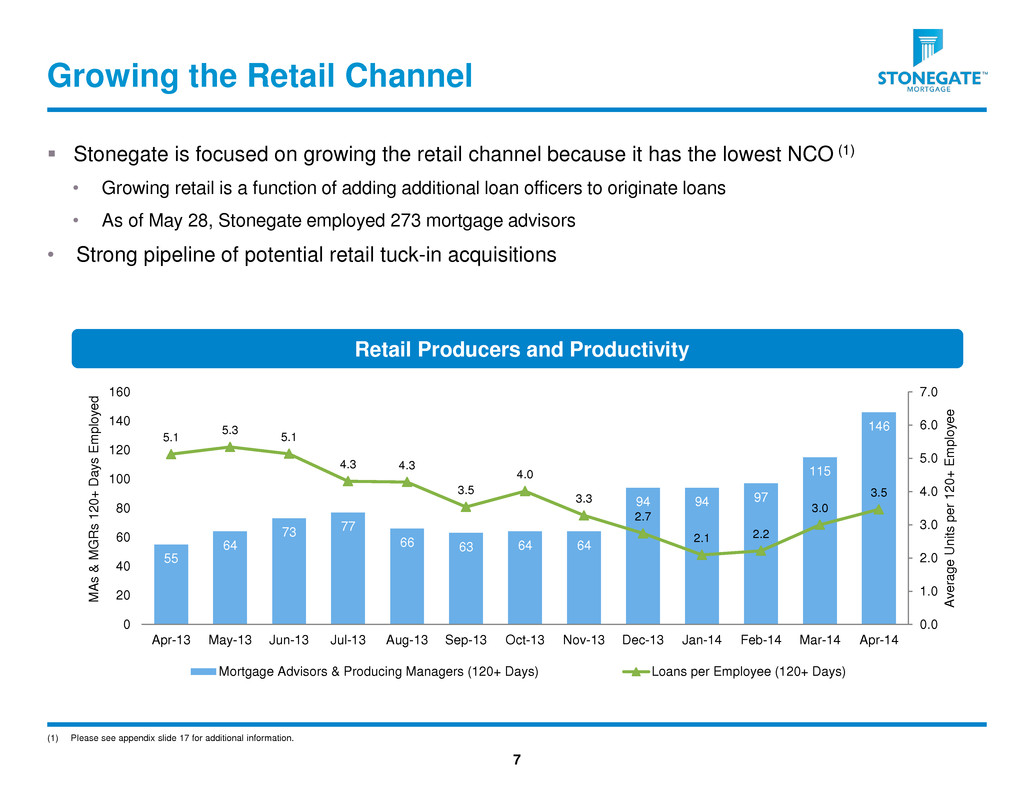
Color Scheme 223 100 31 0 200 195 106 175 232 136 182 74 255 204 0 0 131 203 Stonegate is focused on growing the retail channel because it has the lowest NCO (1) • Growing retail is a function of adding additional loan officers to originate loans • As of May 28, Stonegate employed 273 mortgage advisors • Strong pipeline of potential retail tuck-in acquisitions Growing the Retail Channel 7 Retail Producers and Productivity 55 64 73 77 66 63 64 64 94 94 97 115 146 5.1 5.3 5.1 4.3 4.3 3.5 4.0 3.3 2.7 2.1 2.2 3.0 3.5 0.0 1.0 2.0 3.0 4.0 5.0 6.0 7.0 0 20 40 60 80 100 120 140 160 Apr-13 May-13 Jun-13 Jul-13 Aug-13 Sep-13 Oct-13 Nov-13 Dec-13 Jan-14 Feb-14 Mar-14 Apr-14 A v erage Un it s p e r 1 2 0 + E m p lo ye e M A s & M G R s 1 2 0 + Da ys E m p lo ye d Mortgage Advisors & Producing Managers (120+ Days) Loans per Employee (120+ Days) (1) Please see appendix slide 17 for additional information.
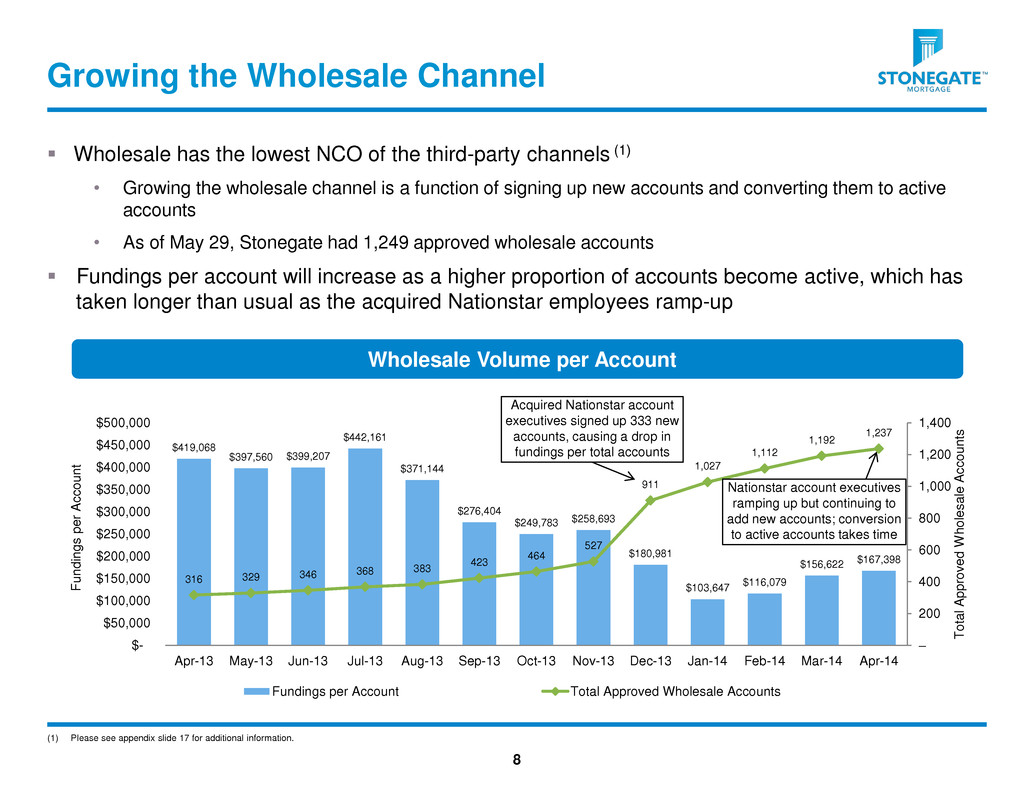
Color Scheme 223 100 31 0 200 195 106 175 232 136 182 74 255 204 0 0 131 203 Wholesale has the lowest NCO of the third-party channels (1) • Growing the wholesale channel is a function of signing up new accounts and converting them to active accounts • As of May 29, Stonegate had 1,249 approved wholesale accounts Fundings per account will increase as a higher proportion of accounts become active, which has taken longer than usual as the acquired Nationstar employees ramp-up Growing the Wholesale Channel 8 Wholesale Volume per Account $419,068 $397,560 $399,207 $442,161 $371,144 $276,404 $249,783 $258,693 $180,981 $103,647 $116,079 $156,622 $167,398 316 329 346 368 383 423 464 527 911 1,027 1,112 1,192 1,237 – 200 400 600 800 1,000 1,200 1,400 $- $50,000 $100,000 $150,000 $200,000 $250,000 $300,000 $350,000 $400,000 $450,000 $500,000 Apr-13 May-13 Jun-13 Jul-13 Aug-13 Sep-13 Oct-13 Nov-13 Dec-13 Jan-14 Feb-14 Mar-14 Apr-14 T ot a l A p p ro v e d W h o le s a le A c c o u nt s F u n d in g s p e r A c c o u n t Fundings per Account Total Approved Wholesale Accounts Acquired Nationstar account executives signed up 333 new accounts, causing a drop in fundings per total accounts Nationstar account executives ramping up but continuing to add new accounts; conversion to active accounts takes time (1) Please see appendix slide 17 for additional information.
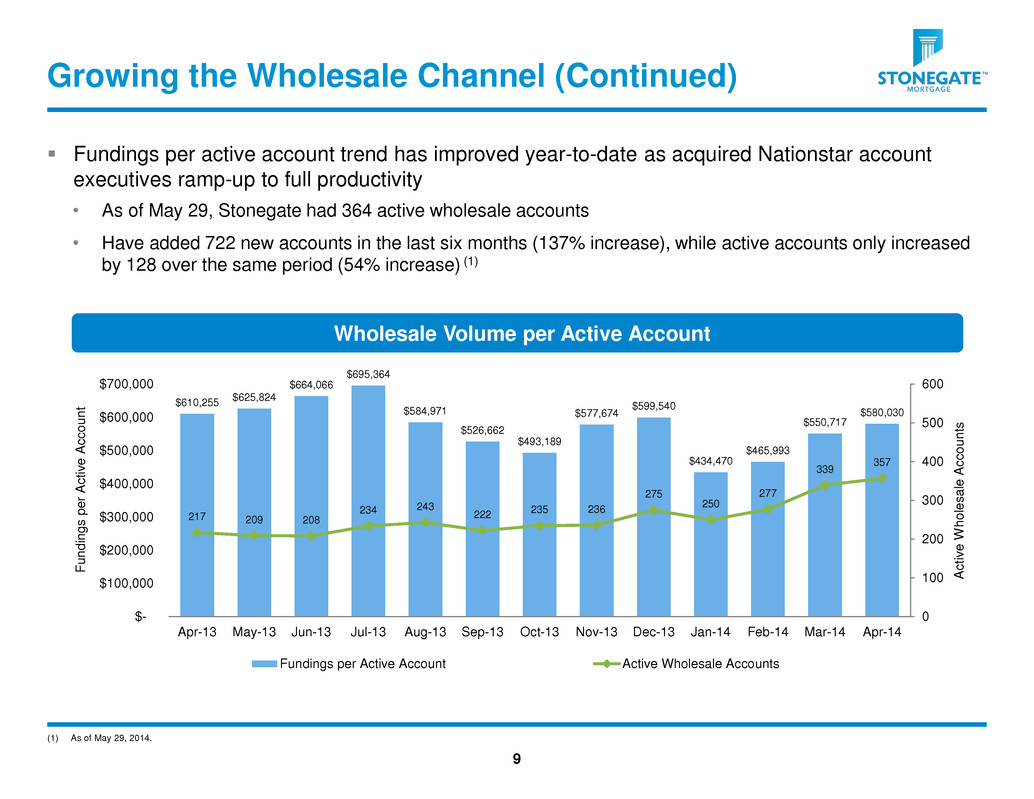
Color Scheme 223 100 31 0 200 195 106 175 232 136 182 74 255 204 0 0 131 203 Fundings per active account trend has improved year-to-date as acquired Nationstar account executives ramp-up to full productivity • As of May 29, Stonegate had 364 active wholesale accounts • Have added 722 new accounts in the last six months (137% increase), while active accounts only increased by 128 over the same period (54% increase) (1) Growing the Wholesale Channel (Continued) 9 Wholesale Volume per Active Account $610,255 $625,824 $664,066 $695,364 $584,971 $526,662 $493,189 $577,674 $599,540 $434,470 $465,993 $550,717 $580,030 217 209 208 234 243 222 235 236 275 250 277 339 357 0 100 200 300 400 500 600 $- $100,000 $200,000 $300,000 $400,000 $500,000 $600,000 $700,000 Apr-13 May-13 Jun-13 Jul-13 Aug-13 Sep-13 Oct-13 Nov-13 Dec-13 Jan-14 Feb-14 Mar-14 Apr-14 A c ti v e W h o le s a le A c c o u nt s F u n d in g s p e r A c ti v e A c c o u n t Fundings per Active Account Active Wholesale Accounts (1) As of May 29, 2014.
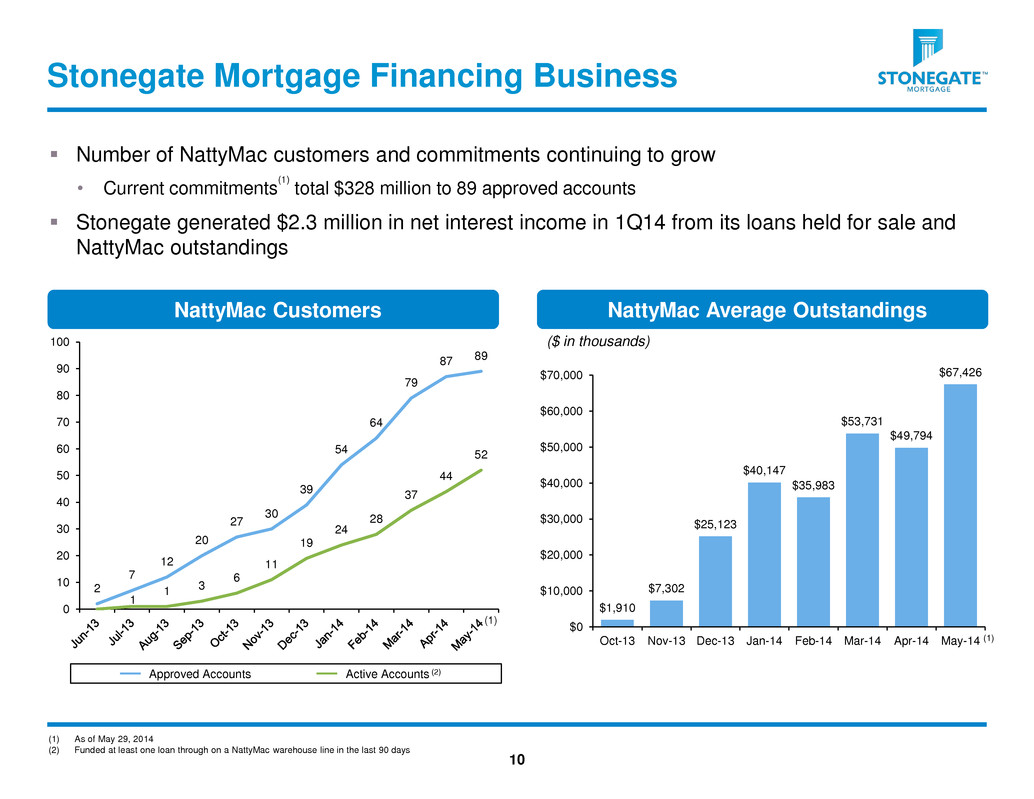
Color Scheme 223 100 31 0 200 195 106 175 232 136 182 74 255 204 0 0 131 203 2 7 12 20 27 30 39 54 64 79 87 89 1 1 3 6 11 19 24 28 37 44 52 0 10 20 30 40 50 60 70 80 90 100 Number of NattyMac customers and commitments continuing to grow • Current commitments (1) total $328 million to 89 approved accounts Stonegate generated $2.3 million in net interest income in 1Q14 from its loans held for sale and NattyMac outstandings Stonegate Mortgage Financing Business NattyMac Customers 10 NattyMac Average Outstandings ($ in thousands) (1) As of May 29, 2014 (2) Funded at least one loan through on a NattyMac warehouse line in the last 90 days Approved Accounts Active Accounts (2) $1,910 $7,302 $25,123 $40,147 $35,983 $53,731 $49,794 $67,426 $0 $10,000 $20,000 $30,000 $40,000 $50,000 $60,000 $70,000 Oct-13 Nov-13 Dec-13 Jan-14 Feb-14 Mar-14 Apr-14 May-14 (1) (1)
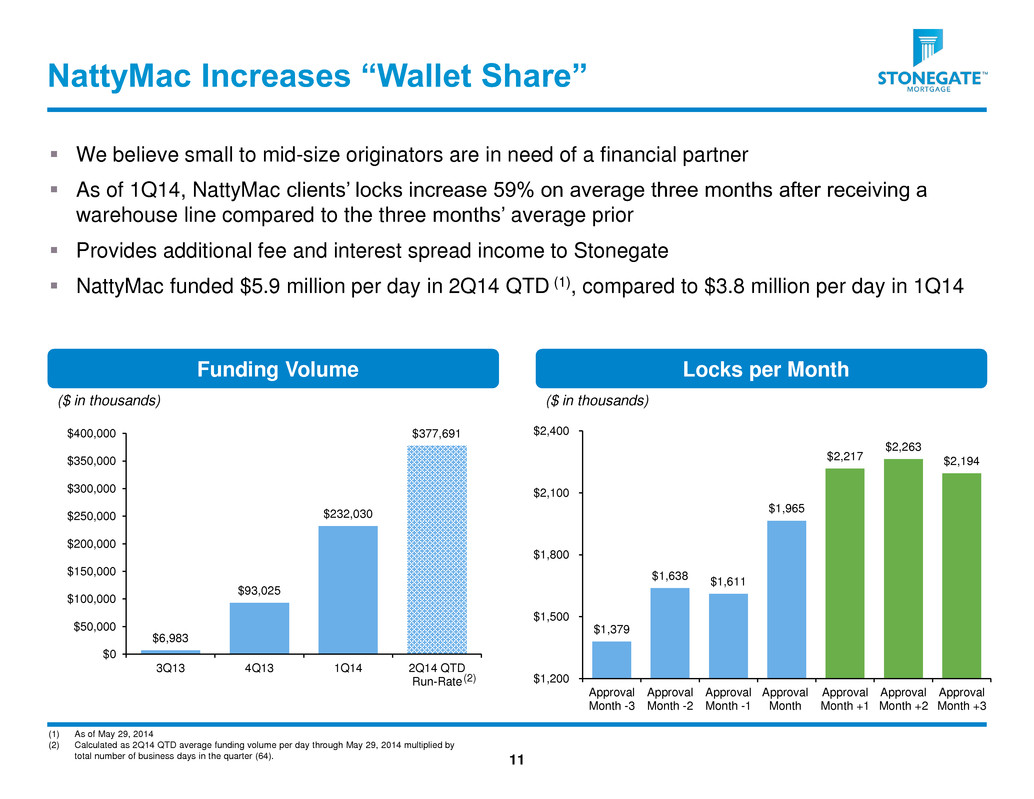
Color Scheme 223 100 31 0 200 195 106 175 232 136 182 74 255 204 0 0 131 203 $6,983 $93,025 $232,030 $377,691 $0 $50,000 $100,000 $150,000 $200,000 $250,000 $300,000 $350,000 $400,000 3Q13 4Q13 1Q14 2Q14 QTD Run-Rate $1,379 $1,638 $1,611 $1,965 $2,217 $2,263 $2,194 $1,200 $1,500 $1,800 $2,100 $2,400 Approval Month -3 Approval Month -2 Approval Month -1 Approval Month Approval Month +1 Approval Month +2 Approval Month +3 We believe small to mid-size originators are in need of a financial partner As of 1Q14, NattyMac clients’ locks increase 59% on average three months after receiving a warehouse line compared to the three months’ average prior Provides additional fee and interest spread income to Stonegate NattyMac funded $5.9 million per day in 2Q14 QTD (1), compared to $3.8 million per day in 1Q14 NattyMac Increases “Wallet Share” 11 Locks per Month Funding Volume ($ in thousands) ($ in thousands) (1) As of May 29, 2014 (2) Calculated as 2Q14 QTD average funding volume per day through May 29, 2014 multiplied by total number of business days in the quarter (64). (2)
Color Scheme 223 100 31 0 200 195 106 175 232 136 182 74 255 204 0 0 131 203 Creates bank-like funding vehicle and liquidity for Stonegate Provides indirect access to Federal Home Loan Bank (FHLB) Stonegate’s investment earns 49% of the profits from NattyMac Funding (NMF) Earnings include net interest income that is LIBOR-based, which we believe creates a natural “hedge” against rising LIBOR rates associated with MSR financing • MSR financing: LIBOR + 525 bps • Net Interest Income: LIBOR + approximately 225 bps (50% of 30-year fixed average note rate) NattyMac Funding (1) 12 (1) Wholly-owned subsidiary of Merchants Bank of Indiana. Please see the Company’s Form 10-Q for the quarterly period ended March 31, 2014 for more information.
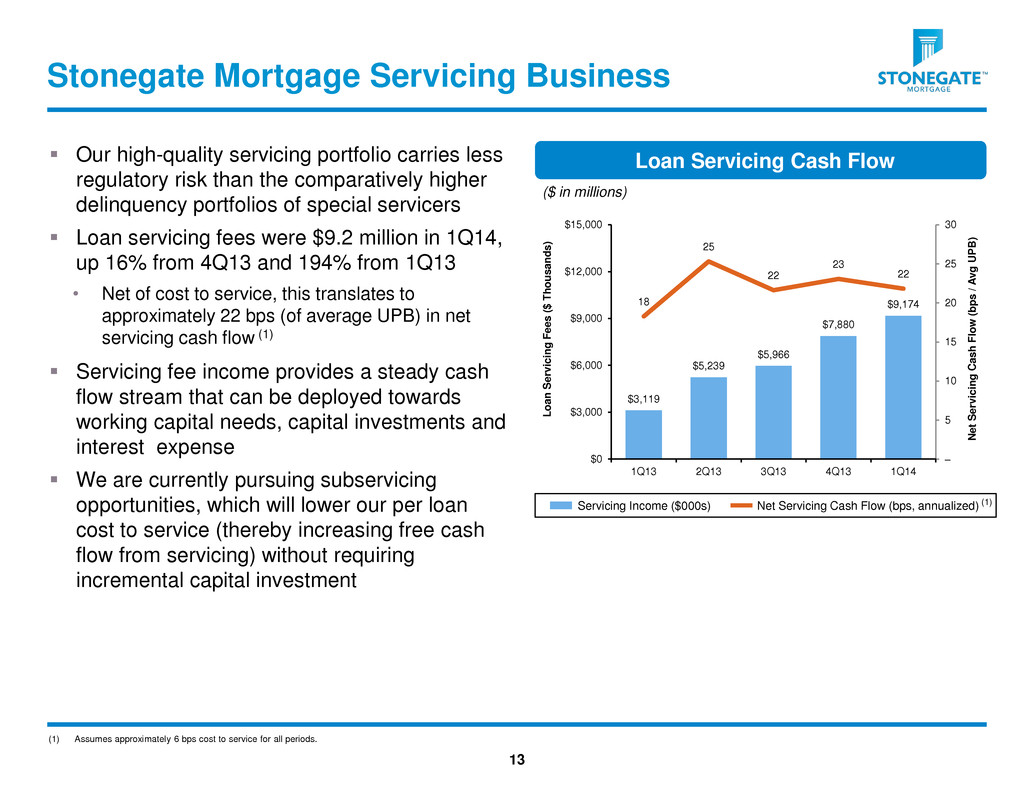
Color Scheme 223 100 31 0 200 195 106 175 232 136 182 74 255 204 0 0 131 203 Our high-quality servicing portfolio carries less regulatory risk than the comparatively higher delinquency portfolios of special servicers Loan servicing fees were $9.2 million in 1Q14, up 16% from 4Q13 and 194% from 1Q13 • Net of cost to service, this translates to approximately 22 bps (of average UPB) in net servicing cash flow (1) Servicing fee income provides a steady cash flow stream that can be deployed towards working capital needs, capital investments and interest expense We are currently pursuing subservicing opportunities, which will lower our per loan cost to service (thereby increasing free cash flow from servicing) without requiring incremental capital investment Stonegate Mortgage Servicing Business Servicing Income ($000s) Net Servicing Cash Flow (bps, annualized) Loan Servicing Cash Flow ($ in millions) 13 $3,119 $5,239 $5,966 $7,880 $9,174 18 25 22 23 22 – 5 10 15 20 25 30 $0 $3,000 $6,000 $9,000 $12,000 $15,000 1Q13 2Q13 3Q13 4Q13 1Q14 N e t S e rv ic ing C a s h F lo w ( bps / A v g U P B ) Loan S e rv ic ing Fe e s ( $ T hous a nds ) (1) (1) Assumes approximately 6 bps cost to service for all periods.
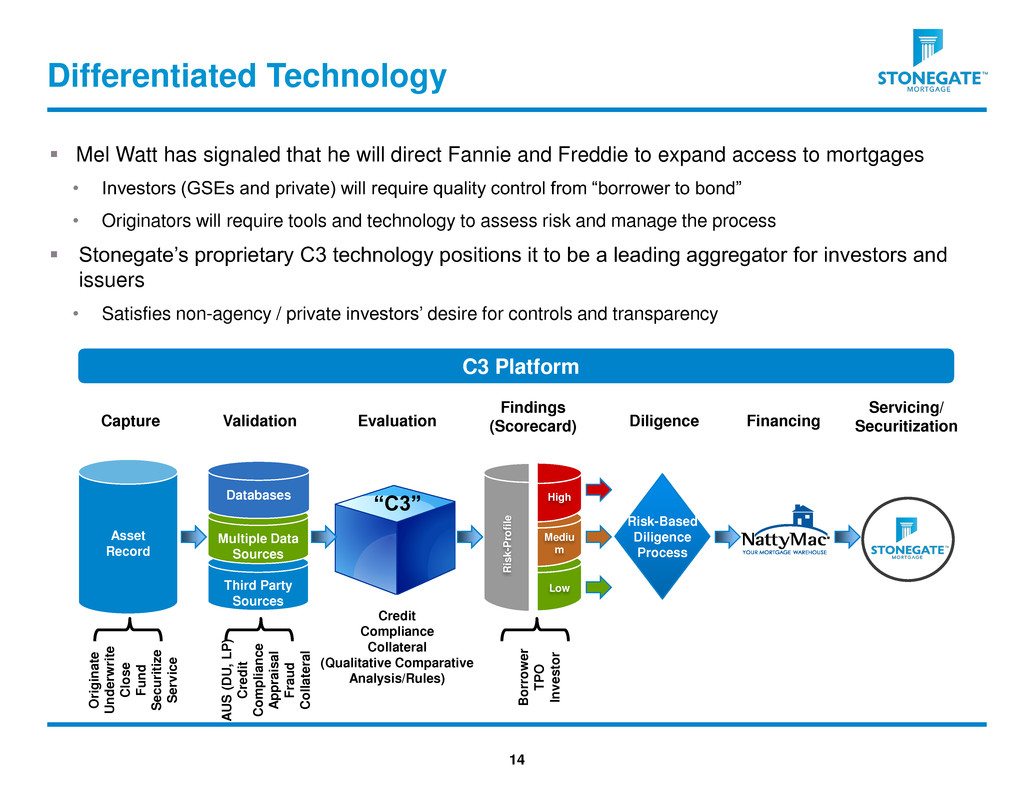
Color Scheme 223 100 31 0 200 195 106 175 232 136 182 74 255 204 0 0 131 203 Differentiated Technology Mel Watt has signaled that he will direct Fannie and Freddie to expand access to mortgages • Investors (GSEs and private) will require quality control from “borrower to bond” • Originators will require tools and technology to assess risk and manage the process Stonegate’s proprietary C3 technology positions it to be a leading aggregator for investors and issuers • Satisfies non-agency / private investors’ desire for controls and transparency 14 C3 Platform Third Party Sources Capture Validation Evaluation Findings (Scorecard) Diligence Financing Servicing/ Securitization Multiple Data Sources Asset Record Databases “C3” O rigi n at e U n d e rw ri te Cl o s e F u n d S e c u ri ti z e S e rv ic e Credit Compliance Collateral (Qualitative Comparative Analysis/Rules) A U S ( DU, L P ) Cr e d it C o m p li a n c e A p p rai s a l F rau d C o ll a te ra l B o rr o w e r T P O In v e s to r High Mediu m Low R is k -P ro fi le Risk-Based Diligence Process Asset Record
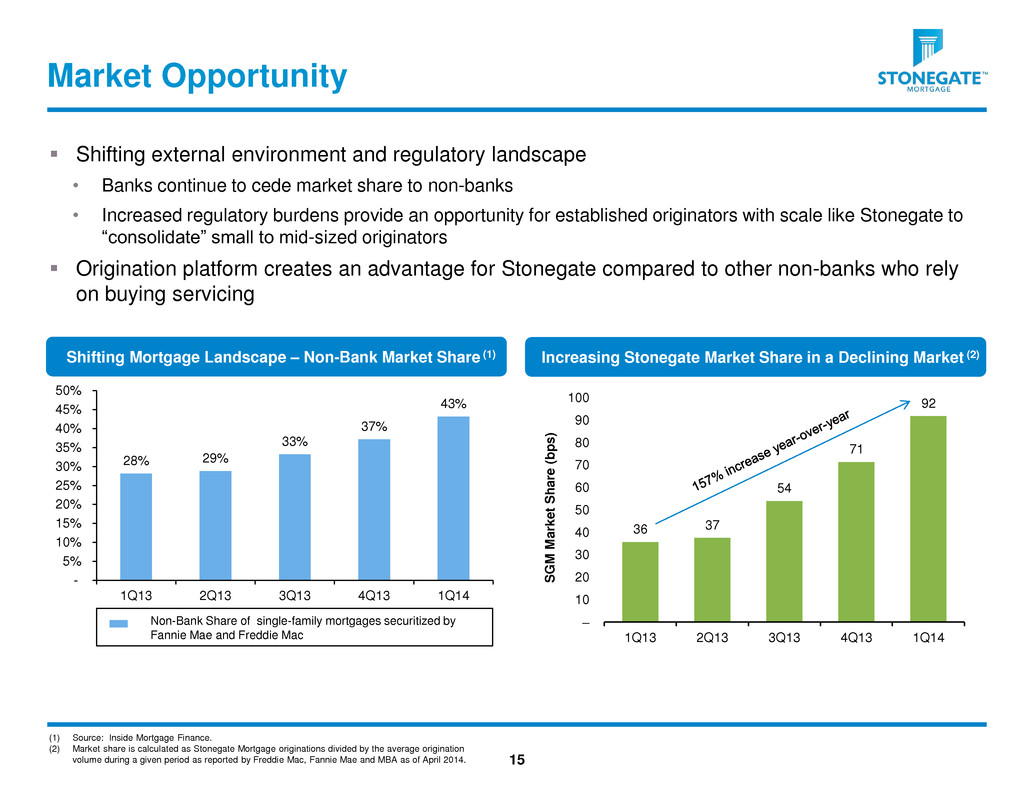
Color Scheme 223 100 31 0 200 195 106 175 232 136 182 74 255 204 0 0 131 203 Market Opportunity Shifting external environment and regulatory landscape • Banks continue to cede market share to non-banks • Increased regulatory burdens provide an opportunity for established originators with scale like Stonegate to “consolidate” small to mid-sized originators Origination platform creates an advantage for Stonegate compared to other non-banks who rely on buying servicing 15 Shifting Mortgage Landscape – Non-Bank Market Share (1) Increasing Stonegate Market Share in a Declining Market (2) (1) Source: Inside Mortgage Finance. (2) Market share is calculated as Stonegate Mortgage originations divided by the average origination volume during a given period as reported by Freddie Mac, Fannie Mae and MBA as of April 2014. 36 37 54 71 92 – 10 20 30 40 50 60 70 80 90 100 1Q13 2Q13 3Q13 4Q13 1Q14 S G M M a rk e t S h a re ( b p s ) Non-Bank Share of single-family mortgages securitized by Fannie Mae and Freddie Mac 28% 29% 33% 37% 43% - 5% 10% 15% 20% 25% 30% 35% 40% 45% 50% 1Q13 2Q13 3Q13 4Q13 1Q14
Color Scheme 223 100 31 0 200 195 106 175 232 136 182 74 255 204 0 0 131 203 Appendix 16
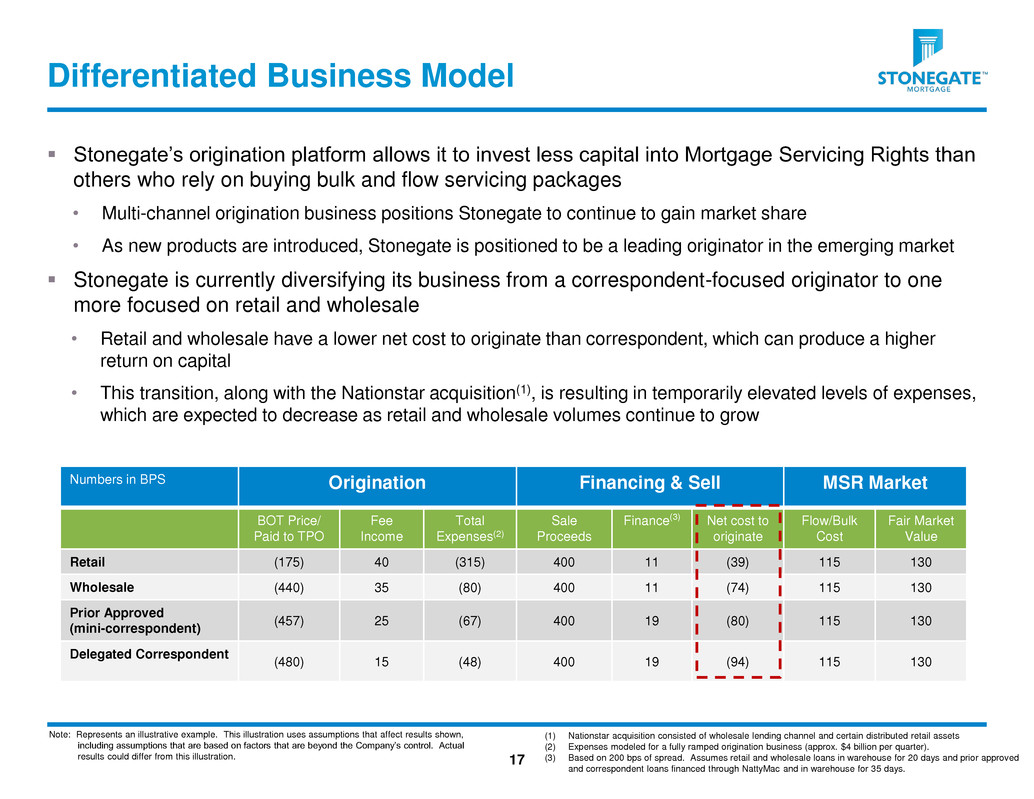
Color Scheme 223 100 31 0 200 195 106 175 232 136 182 74 255 204 0 0 131 203 Differentiated Business Model Numbers in BPS Origination Financing & Sell MSR Market BOT Price/ Paid to TPO Fee Income Total Expenses(2) Sale Proceeds Finance(3) Net cost to originate Flow/Bulk Cost Fair Market Value Retail (175) 40 (315) 400 11 (39) 115 130 Wholesale (440) 35 (80) 400 11 (74) 115 130 Prior Approved (mini-correspondent) (457) 25 (67) 400 19 (80) 115 130 Delegated Correspondent (480) 15 (48) 400 19 (94) 115 130 17 Stonegate’s origination platform allows it to invest less capital into Mortgage Servicing Rights than others who rely on buying bulk and flow servicing packages • Multi-channel origination business positions Stonegate to continue to gain market share • As new products are introduced, Stonegate is positioned to be a leading originator in the emerging market Stonegate is currently diversifying its business from a correspondent-focused originator to one more focused on retail and wholesale • Retail and wholesale have a lower net cost to originate than correspondent, which can produce a higher return on capital • This transition, along with the Nationstar acquisition(1), is resulting in temporarily elevated levels of expenses, which are expected to decrease as retail and wholesale volumes continue to grow Note: Represents an illustrative example. This illustration uses assumptions that affect results shown, including assumptions that are based on factors that are beyond the Company’s control. Actual results could differ from this illustration. (1) Nationstar acquisition consisted of wholesale lending channel and certain distributed retail assets (2) Expenses modeled for a fully ramped origination business (approx. $4 billion per quarter). (3) Based on 200 bps of spread. Assumes retail and wholesale loans in warehouse for 20 days and prior approved and correspondent loans financed through NattyMac and in warehouse for 35 days.
Color Scheme 223 100 31 0 200 195 106 175 232 136 182 74 255 204 0 0 131 203 Contact Information Investor Relations Contact Michael McFadden Stonegate Mortgage P: (317) 663-5904 michael.mcfadden@stonegatemtg.com Media Contact Whit Clay Sloane & Company P: (212) 446-1864 wclay@sloanepr.com 18
