Attached files
| file | filename |
|---|---|
| 8-K - 8-K - SmartStop Self Storage, Inc. | d733775d8k.htm |
 2013 and First
Quarter 2014 Update 2013 and First Quarter 2014 Update
Strategic Storage Trust, Inc.
Exhibit 99.1 |
 Disclaimer and
Risk Factors 2
Disclaimers
CAUTIONARY NOTE REGARDING FORWARD-LOOKING STATEMENTS Certain
statements contained in this material, other than historical facts, may be considered forward-looking statements within the
meaning of Section 27A of the Securities Act of 1933, as amended (the “Securities
Act”) and Section 21E of the Securities Exchange Act of 1934, as amended (the
“Exchange Act”). We intend for all such forward looking statements to be covered by the applicable
safe harbor provisions for forward-looking statements contained in Section 27A of the
Securities Act and Section 21E of the Exchange Act, as applicable. Such statements
include, in particular, statements about our plans, strategies, and prospects and are subject to
certain risks and uncertainties, including known and unknown risks, which could cause actual
results to differ materially from those projected or anticipated. Therefore, such
statements are not intended to be a guarantee of our performance in future periods. Such
forward-looking statements can generally be identified by our use of forward-looking
terminology such as “may,” “will,” “expect,”
“intend,” “anticipate,” “estimate,” “believe,”
“continue,” or other similar words. Readers are cautioned not to place undue reliance on
these forward-looking statements, which speak only as of the date this report is filed
with the Securities and Exchange Commission. We cannot guarantee the accuracy of any
such forward looking statements contained in this material, and we do not intend to
publicly update or revise any forward-looking statements, whether as a result of new
information, future events, or otherwise.
Any such forward-looking statements are subject to risks, uncertainties, and other factors
and are based on a number of assumptions involving judgments with respect to, among
other things, future economic, competitive, and market conditions, all of which are
difficult or impossible to predict accurately. To the extent that our assumptions differ from
actual results, our ability to meet such forward-looking statements, including our
ability to generate positive cash flow from operations and provide distributions to
stockholders, and our ability to find suitable investment properties, may be significantly
hindered. All forward-looking statements should be read in light of the risks
identified in our 2013 Annual Report on Form 10-K.
|
 Disclaimer and
Risk Factors 3
Risk Factors
See our Form 10-K, and recent Form 10-Q for specific risks associated with an
investment in Strategic Storage Trust, Inc. As of March 31, 2014, our accumulated
deficit was approximately $70 million and we may have a net loss in 2014. No public
market currently exists for shares of our common stock. It may be difficult to sell your shares. If you sell your shares,
it will likely be at a substantial discount.
We have paid distributions from sources other than our cash flows from operations. We are not
prohibited from undertaking such activities by our charter, bylaws or investment
policies, and we may use an unlimited amount from any source to pay our distributions.
We also may be required to sell assets or issue new securities for cash in order to pay distributions. Any such
actions could reduce the amount of capital we ultimately invest in assets and negatively
impact the amount of income available for future distributions.
We have no employees and must depend on our advisor to select investments and conduct our
operations, and there is no guarantee that our advisor will devote adequate time or
resources to us. Our board of directors may change any of our investment objectives,
including our focus on self storage facilities. We
will
pay
substantial
fees
and
expenses
to
our
advisor
and
its
affiliates
which
will
reduce
cash
available
for
investment
and
distribution.
There are substantial conflicts of interest among us and our sponsor, advisor and property
manager. We
may
fail
to
remain
qualified
as
a
REIT,
which
could
adversely
affect
our
operations
and
our
ability
to
make
distributions.
We may incur substantial debt, which could hinder our ability to
pay distributions to our stockholders or could decrease the
value of your investment.
Future distribution declarations are at the sole discretion of our board of directors and are
not guaranteed. Since our inception, our cumulative distributions have exceeded
cumulative GAAP earnings. We cannot assure you that we will achieve any of our
investment objectives.
We encourage you to review our SEC filings at www.sec.gov.
|
 Agenda
4
•
Overview
•
Performance Highlights
•
Acquisitions
•
Development/Lease-up Performance
•
Toronto, Canada Solar Installations
•
Self Storage Industry Update |
 Overview
•
First publicly registered non-traded REIT
focused on self storage
•
Sponsor was ranked 7th in Mini-Storage
Messenger’s Top Operators List in 2013
•
As of 3/31/14, SSTI owned 125 properties in
17 states and Ontario, Canada with
approximately 80,000 units and 10.4 million
rentable square feet
5 |
 Overview
6
*As of April 5, 2014
Owned Properties by Quarter |
 Overview
7
Square Footage by State (as of 3/31/2014)
•
125 properties
•
17 states, 1 province
•
80,000 units
•
10.4 million SF
8.9%
2.8%
6.2%
13.8%
2.1%
2.1%
3.8%
4.0%
4.0%
16.4%
9.6%
2.0%
4.0%
2.8%
0.8%
4.0%
8.4%
4.3% |
 Self Storage
Footprint 8
Population
26,059,203
Population
75,232,171
Population
6,054,191
Population
47,353,616
This map depicts the locations of our primary target markets, although we may acquire
properties elsewhere. Population
39,135,452 |
 Agenda
•
Overview
•
Performance Highlights
•
Acquisitions
•
Development/Lease-up Performance
•
Toronto, Canada Solar Installations
•
Self Storage Industry Update
9 |
 Performance
Highlights – Fourth Quarter 2013
10
Cash Flow from Operations
•
$3.1 Million for Three Months Ended 12/31/2012
•
$5.2 Million for Three Months Ended 12/31/2013
67%
•
$9.6 Million for Twelve Months Ended 12/31/2012
•
$19.3 Million for Twelve Months Ended 12/31/2013
102%
IPA Modified Funds from Operations
•
$4.2 Million
for Three Months Ended 12/31/2012
•
$5.6 Million for Three Months Ended 12/31/2013
33%
•
$9.0 Million for Twelve Months Ended 12/31/2012
•
$20.6 Million for Twelve Months Ended 12/31/2013
129% |
 Performance
Highlights – Fourth Quarter 2013
11
Fourth Quarter 2013 vs. 2012
•
Revenues
8.6%
•
Net Operating Income
13.9%
2013
2012
•
Property Operating Expenses as a Percentage of
Revenue
37.9%
40.8%
•
Number of Facilities
101
101
Same Store Performance |
 Performance
Highlights 12
Prior Year Occ Sq Ft (%)
76.4%
76.1%
78.3%
78.4%
77.4%
73.3%
79.0%
80.4%
79.3%
80.6%
Current Year Occ Sq Ft (%)
77.2%
77.1%
82.6%
82.3%
82.0%
81.6%
84.6%
84.5%
83.0%
84.5%
No. of Properties
41
45
60
71
76
89
89
90
100
108
Q4-11
Q1-12
Q2-12
Q3-12
Q4-12
Q1-13
Q2-13
Q3-13
Q4-13
Q1-14
70.0%
72.0%
74.0%
76.0%
78.0%
80.0%
82.0%
84.0%
86.0%
88.0%
(1,200)
800
2,800
4,800
6,800
8,800
Same Store Occupancy
Q4-2011 to Q1-2014
Move Ins
Move Outs
Net
Current Year Occ Sq Ft (%)
* Does not include Canadian properties, but does include consolidated joint venture, SF
property. |
 Performance
Highlights
–
First
Quarter
2014
13
Cash Flow from Operations
•
$4.0 Million for Three Months Ended 3/31/2013
•
$6.3 Million for Three Months Ended 3/31/2014
57%
IPA Modified Funds from Operations
•
$4.6 Million
for Three Months Ended 3/31/2013
•
$6.3 Million for Three Months Ended 3/31/2014
35% |
 Performance
Highlights
–
First
Quarter
2014
14
First Quarter 2014 vs. 2013
•
Revenues
7.6%
•
Net Operating Income
8.1%
2014
2013
•
Property Operating Expenses as a Percentage of
Revenue
39.4%
39.7%
•
Number of Facilities
109
109
Same Store Performance |
 NOI and MFFO
Definition 15
Net
Operating
Income
(“NOI”)
•
Funds
from
Operations
(“FFO”)
and
Modified
Funds
from
Operations
(“MFFO”)
•
•
NOI is a non-GAAP measure that we define as net income (loss), computed in accordance
with GAAP, generated from properties before corporate general and administrative
expenses, asset management fees, interest expense, depreciation, amortization,
acquisition expenses and other non-property related expenses. We believe that net
operating income is useful for investors as it provides a measure of the operating
performance of our operating assets because net operating income excludes certain items
that are not associated with the operation of the properties. Additionally, we believe
that NOI is a widely accepted measure of comparative operating performance in the real
estate community. However, our use of the term NOI may not be comparable to that of
other real estate companies as they may have different methodologies for computing this amount.
Due to certain unique operating characteristics of real estate companies, the National
Association of Real Estate Investment Trusts, or NAREIT, an industry trade group, has
promulgated a measure known as funds from operations, or FFO, which we believe to be
an appropriate supplemental measure to reflect the operating performance of a REIT. The
use of FFO is recommended by the REIT industry as a supplemental performance measure.
FFO is not equivalent to our net income (loss) as determined under GAAP.
We define FFO, a non-GAAP measure, consistent with the standards established by the White
Paper on FFO approved by the Board of Governors of NAREIT, as revised in
February 2004, or the White Paper. The White Paper defines FFO as net income
(loss) computed in accordance with GAAP, excluding gains or losses from sales of property and
asset impairment writedowns, plus depreciation and amortization, and after adjustments
for unconsolidated partnerships and joint ventures. Adjustments for unconsolidated
partnerships and joint ventures are calculated to reflect FFO on the same basis. Our
FFO calculation complies with NAREIT’s policy described above.
|
 NOI and MFFO
Definition – Con’t
16
•
The historical accounting convention used for real estate assets requires straight-line
depreciation of buildings and improvements, which implies that the value of real estate
assets diminishes predictably over time. Diminution in value may occur if such assets
are not adequately maintained or repaired and renovated as required by relevant circumstances or other
measures necessary to maintain the assets are not undertaken. However, we believe that, since
real estate values historically rise and fall with market conditions, including
inflation, interest rates, the business cycle, unemployment and consumer spending,
presentations of operating results for a REIT using historical accounting for depreciation may be less informative. In
addition, in the determination of FFO, we believe it is appropriate to disregard impairment
charges, as this is a fair value adjustment that is largely based on market
fluctuations and assessments regarding general market conditions which can change over
time. An asset will only be evaluated for impairment if certain impairment indications exist and if the carrying
value, or book value, exceeds the total estimated undiscounted future cash flows (including
net rental revenues, net proceeds on the sale of the property, and any other ancillary
cash flows at a property or group level under GAAP) from such asset. Testing for
impairment is a continuous process and is analyzed on a quarterly basis. Investors should note, however, that
determinations of whether impairment charges have been incurred are based partly on
anticipated operating performance, because estimated undiscounted future cash flows
from a property, including estimated future net rental revenues, net proceeds on the
sale of the property, and certain other ancillary cash flows, are taken into account in determining whether an
impairment charge has been incurred. While impairment charges are excluded from the
calculation of FFO as described above, investors are cautioned that due to the fact
that impairments are based on estimated future undiscounted cash flows and that we
intend to have a relatively limited term of our operations, it could be difficult to recover any impairment charges
through the eventual sale of the property. To date, we have not recognized any impairments. •
Historical accounting for real estate involves the use of GAAP. Any other method of accounting
for real estate such as the fair value method cannot be construed to be any more
accurate or relevant than the comparable methodologies of real estate valuation found
in GAAP. Nevertheless, we believe that the use of FFO, which excludes the impact of real estate related
depreciation and amortization and impairments, assists in providing a more complete
understanding of our performance to investors and to our management, and when compared
year over year, reflects the impact on our operations from trends in occupancy rates,
rental rates, operating costs, general and administrative expenses, and interest costs, which may not be
immediately apparent from net income (loss). |
 NOI and MFFO
Definition – Con’t
17
•
However, FFO or Modified FFO (“MFFO”), discussed below, should not be construed to
be more relevant or accurate than
the current GAAP methodology in calculating net income (loss) or
in its applicability in evaluating our operating
performance. The method utilized to evaluate the value and performance of real estate under
GAAP should be considered a more relevant measure of operational performance and is,
therefore, given more prominence than the non-GAAP FFO and MFFO measures and the
adjustments to GAAP in calculating FFO and MFFO.
•
Changes in the accounting and reporting rules under GAAP that were put into effect and other
changes to GAAP accounting for real estate subsequent to the establishment of
NAREIT’s definition of FFO have prompted an increase in cash-settled
expenses, specifically acquisition fees and expenses, as items that are expensed as operating
expenses under GAAP. We believe these fees and expenses do not affect our overall
long-term operating performance. Publicly registered, non-traded REITs
typically have a significant amount of acquisition activity and are substantially more dynamic during their initial years
of investment and operation. The purchase of properties, and the
corresponding expenses associated with that process, is a
key feature of our business plan in order to generate operational income and cash flow in
order to make distributions to investors. While other start-up entities may also
experience significant acquisition activity during their initial years, we
believe that publicly registered, non-traded REITs are unique in that they typically have
a limited life with targeted exit strategies within a relatively limited time frame
after the acquisition activity ceases. Our board of directors is in the process of
determining which liquidity event, if any, is in the best interests of us and our stockholders (i.e., listing of our shares of
common stock on a national securities exchange, a merger or sale, the sale of all or
substantially all of our assets, or another similar transaction). We expect to achieve
a liquidity event within three years, which is generally comparable to other publicly
registered, non-traded REITs. Thus, we do not intend to continuously purchase assets and intend to have a limited
life. The decision whether to engage in any liquidity event is in the sole discretion of our
board of directors. Due to the above factors and other unique features of publicly
registered, non-traded REITs, the Investment Program Association, or the IPA, an
industry trade group, has standardized a measure known as modified funds from operations, or MFFO, which
the IPA has recommended as a supplemental measure for publicly registered, non-traded
REITs and which we believe to be another appropriate supplemental measure to reflect
the operating performance of a publicly registered, non-traded REIT |
 NOI and MFFO
Definition – Con’t
18
having the characteristics described above. MFFO is not equivalent to our net income (loss) as
determined under GAAP, and MFFO may not be a useful measure of the impact of
long-term operating performance on value if we do not ultimately engage in a
liquidity event. We believe that, because MFFO excludes acquisition fees and expenses that affect our operations only in
periods in which properties are acquired and that we consider more reflective of investing
activities, as well as other non- operating items included in FFO, MFFO can provide,
on a going-forward basis, an indication of the sustainability (that is, the capacity
to continue to be maintained) of our operating performance after the period in which we are acquiring our properties
and once our portfolio is in place. By providing MFFO, we believe we are presenting useful
information that assists investors and analysts to better assess the sustainability of
our operating performance now that our offering has been completed. We also believe
that MFFO is a recognized measure of sustainable operating performance by the publicly registered, non-traded
REIT industry. Further, we believe MFFO is useful in comparing the sustainability of our
operating performance now that our offering has been completed and we expect our
acquisition activity over the near term to be less vigorous, with the
sustainability
of
the
operating
performance
of
other
real
estate
companies
that
are
not
as
involved
in
acquisition
activities.
Investors are cautioned that MFFO should only be used to assess the sustainability of our
operating performance now that our offering has been completed and we expect our
acquisition activity over the near term to be less vigorous, as it excludes acquisition
fees and expenses that have a negative effect on our operating performance during the
periods in which properties are acquired.
•
We define MFFO, a non-GAAP measure, consistent with the IPA’s Guideline 2010-01,
Supplemental Performance Measure for Publicly Registered, Non-Listed REITs:
Modified Funds from Operations (the “Practice Guideline”) issued by the IPA in
November 2010. The Practice Guideline defines MFFO as FFO further adjusted for the following
items included in the determination of GAAP net income (loss): acquisition fees and
expenses; amounts relating to straight line rents and amortization of above or below
intangible lease assets and liabilities; accretion of discounts and amortization of premiums on
debt investments; non-recurring impairments of real estate related investments;
mark-to-market adjustments included in net income; non-recurring gains or
losses included in net income from the extinguishment or sale of debt, hedges |
 NOI and MFFO
Definition – Con’t
19
foreign exchange, derivatives or securities holdings where trading of such holdings is not a
fundamental attribute of the business plan, unrealized gains or losses resulting from
consolidation from, or deconsolidation to, equity accounting, and after adjustments for
consolidated and unconsolidated partnerships and joint ventures, with such adjustments
calculated to reflect MFFO on the same basis. The accretion of discounts and
amortization of premiums on debt investments, unrealized gains and losses on hedges,
foreign exchange, derivatives or securities holdings, unrealized gains and losses resulting from
consolidations, as well as other listed cash flow adjustments are adjustments made to net
income (loss) in calculating cash flows from operations and, in some cases, reflect
gains or losses which are unrealized and may not ultimately be realized. Our MFFO
calculation complies with the IPA’s Practice Guideline described above. In calculating MFFO, we exclude acquisition
related expenses, the amortization of fair value adjustments related to debt, realized and
unrealized gains and losses on foreign exchange holdings and the adjustments of such
items related to noncontrolling interests. The other adjustments included in the
IPA’s Practice Guideline are not applicable to us for the periods presented. Acquisition
fees and expenses are paid in cash by us, and we have not set aside or put into escrow
any specific amount of proceeds from our offering to be used to fund acquisition
fees and expenses. Acquisition fees and expenses include payments to our Advisor and third
parties. Acquisition related expenses under GAAP are considered operating expenses and
as expenses included in the determination of net income (loss) and income (loss) from
continuing operations, both of which are performance measures under GAAP. All paid and accrued
acquisition fees and expenses will have negative effects on returns to investors, the
potential for future distributions, and cash flows generated by us, unless earnings
from operations or net sales proceeds from the disposition of other properties are
generated to cover the purchase price of the property, these fees and expenses and other costs
related to such property. In the future, if we are not able to raise additional
proceeds from our distribution reinvestment plan offering or other potential
offerings, this could result in us paying acquisition fees or reimbursing acquisition expenses
due to our Advisor, or a portion thereof, with net proceeds from borrowed funds,
operational earnings or cash flows, net proceeds from the sale of properties, or
ancillary cash flows. As a result, the amount of proceeds available for investment and operations would be reduced, or we
may incur additional interest expense as a result of borrowed funds
|
 NOI and MFFO
Definition – Con’t
20
•
Further, under GAAP, certain contemplated non-cash fair value and other non-cash
adjustments are considered operating non-cash adjustments to net income (loss) in
determining cash flows from operations. In addition, we view fair value adjustments of
derivatives and the amortization of fair value adjustments related to debt as items which are unrealized
and may not ultimately be realized or as items which are not reflective of on-going
operations and are therefore typically adjusted for when assessing operating
performance. We use MFFO and the adjustments used to calculate it in order to evaluate our performance
against other publicly registered, non-traded REITs which intend to have limited
lives with short and defined acquisition periods and targeted exit strategies shortly
thereafter. As noted above, MFFO may not be a useful measure of the impact of long-term operating
performance if we do not continue to operate in this manner. We believe that our use of MFFO
and the adjustments used to calculate it allow us to present our performance in a
manner that reflects certain characteristics that are unique to publicly registered,
non-traded REITs, such as their limited life, limited and defined acquisition period and targeted exit
strategy, and hence that the use of such measures may be useful to investors. For example,
acquisition fees and expenses were intended to be funded from the proceeds of our
offering and other financing sources and not from operations. By excluding expensed
acquisition fees and expenses, the use of MFFO provides information consistent with management’s
analysis of the operating performance of the properties. Additionally, fair value
adjustments, which are based on the impact of current market fluctuations and
underlying assessments of general market conditions, but can also result from
operational factors such as rental and occupancy rates, may not be directly related or
attributable to our current operating performance. By excluding such charges that may
reflect anticipated and unrealized gains or losses, we believe MFFO provides useful
supplemental information.
• |
 NOI and MFFO
Definition – Con’t
21
•
Presentation of this information is intended to provide useful information to investors as
they compare the operating performance of different REITs, although it should be noted
that not all REITs calculate FFO and MFFO the same way, so comparisons with other REITs
may not be meaningful. Furthermore, FFO and MFFO are not necessarily indicative of cash
flow available to fund cash needs and should not be considered as an alternative to net income
(loss) or income (loss) from continuing operations as an indication of our performance,
as an alternative to cash flows from operations, which is an indication of our
liquidity, or indicative of funds available to fund our cash needs including our ability to make
distributions to our stockholders. FFO and MFFO should be reviewed in conjunction with other
measurements as an indication of our performance. MFFO may be useful in assisting
management and investors in assessing the sustainability of operating performance in
future operating periods, and in particular, after the offering and acquisition stages are
complete and net asset value is disclosed. FFO and MFFO are not useful measures in evaluating
net asset value because impairments are taken into account in determining net asset
value but not in determining FFO and MFFO.
|
 Agenda
22
•
Overview
•
Performance Highlights
•
Acquisitions
•
Development/Lease-up Performance
•
Toronto, Canada Solar Installations
•
Self Storage Industry Update |
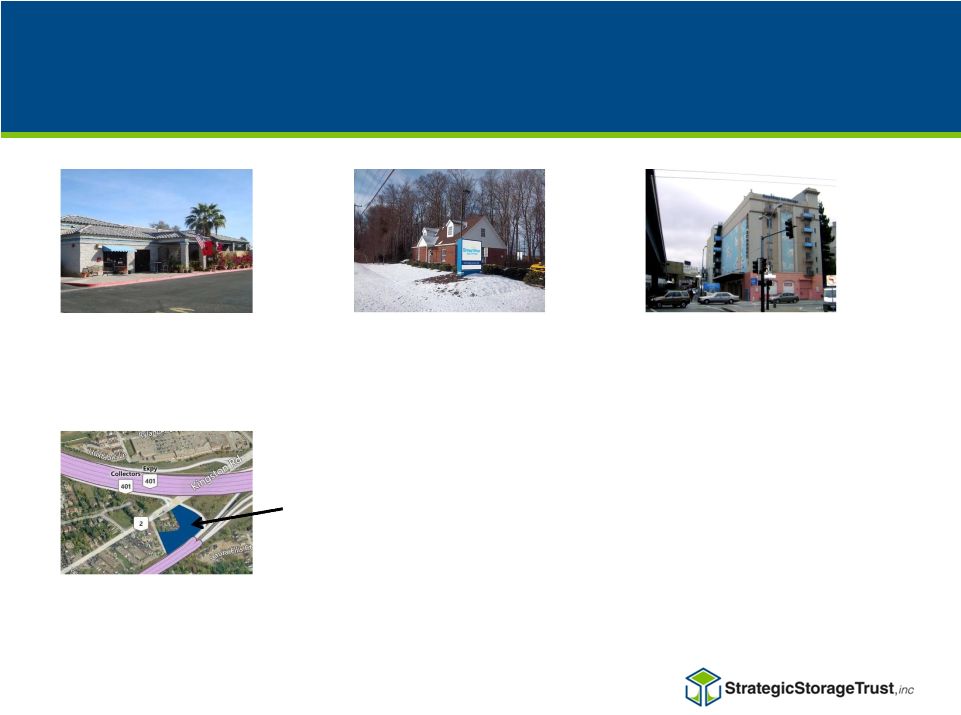 Acquisitions
– First Quarter 2014
23
Chandler, Arizona
•
•
•
San Francisco, California*
•
•
•
Hampton, Virginia
•
•
•
*SSTI owns 98% of the San Francisco property
Centennial, Toronto (Development)
•
•
•
Land Parcel
480 units
51,000 NRSF
93.6% Occupancy
1,100 units
76,200 NRSF
86.4% Occupancy
500 units
71,500 NRSF
90.4% Occupancy
2.5 Acres
870 units (est. upon completion)
78,000 NRSF (est. upon completion) |
 Agenda
24
•
Strategic Storage Trust, Inc. Overview
•
Performance Highlights
•
Acquisitions
•
Development/Lease-up Performance
•
Toronto, Canada Solar Installations
•
Self Storage Industry Update |
 Development/Lease-up
25
Located at 600 Granite Ct,
Pickering,
Ontario, Canada
Phase 1 and phase 2 will have
approximately
890
units
and
approximately
91,000 net
rentable Sq. Ft.
All units will be 100% climate controlled
Phase 1 estimated completion in First
quarter 2015 (60,000 Sq. Ft)
Phase 2 estimated completion
early
Fourth
quarter 2015 (31,000 Sq. Ft.)
Phase 1 construction is expected to start in
Third quarter 2014
Granite Development |
 Development/Lease-up
26
Occ
SqFt (%)
51.00%
61.00%
67.10%
69.00%
74.60%
80.70%
83.50%
80.80%
82.10% |
 Development/Lease-up
27
No. of Properties
8
16
16
16
16
16
16
Occ Sq Ft (%)
63.00%
73.80%
77.40%
83.50%
84.30%
82.09%
83.90%
Q3-2012
Q4-2012
Q1-2013
Q2-2013
Q3-2013
Q4-2013
Q1-2014
55.00%
60.00%
65.00%
70.00%
75.00%
80.00%
85.00%
90.00%
(250)
250
750
1,250
1,750
2,250
Former Stockade Portfolio Occupancy %
Q3-2012 to Q1-2014
Move Ins
Move Outs
Net
Occ Sq Ft (%)
Note:
At
acquisition,
occupancy
for
this
portfolio
was:
71.3%
for
combined
16
stores |
 Development/Lease-up
28
Occ Sq Ft (%)
10.90%
46.40%
48.20%
34.10%
41.30%
51.90%
58.20%
63.80%
75.10%
Q1-2012
Q2-2012
Q3-2012
Q4-2012
Q1-2013
Q2-2013
Q3-2013
Q4-2013
Q1-2014
0.00%
10.00%
20.00%
30.00%
40.00%
50.00%
60.00%
70.00%
80.00%
$-
$50,000
$100,000
$150,000
$200,000
$250,000
Mavis Rental Income & Occupancy
Q1-2012 to Q1-2014
Note: Rental Income is rounded to the nearest thousand. Mavis Occ Sq Ft (%) includes
developmental stages of construction; building conversion was completed in Dec-11 and phases of
new construction began in Mar-12 and were completed in Dec-12. Sep-12 included the
addition of 123 new units or 16,329 net rentable sq. ft. Final additions were made in Dec-12 with
another 262 new units or 35,297 net rentable sq. ft. added.
|
 Development/Lease-up
29
Occ Sq Ft (%)
4.7%
13.2%
17.7%
22.2%
24.4%
28.1%
33.8%
37.9%
43.6%
Brampton Rental Income & Occupancy
August 2013 to
April 2014
$-
$5,000
$10,000
$15,000
$20,000
$25,000
$30,000
0.0%
5.0%
10.0%
15.0%
20.0%
25.0%
30.0%
35.0%
40.0%
45.0%
50.0%
Aug-13
Sep-13
Oct-13
Nov-13
Dec-13
Jan-14
Feb-14
Mar-14
Apr-14
Rental Income
Occ Sq Ft % |
 SmartStop.com
– Enhanced Technology Based Marketing
30 |
 Agenda
31
•
Overview
•
Performance Highlights
•
Acquisitions
•
Development/Lease-up Performance
•
Toronto, Canada Solar Installations
•
Self Storage Industry Update |
 Toronto Solar
Installations 32
Site Name
Solar system
size in AC KW
Estimated final
cost of system
Estimated date of
power production
Mavis
250
$1.0 Million
July 2014
Brampton
250
$1.1 Million
July 2014
Dufferin
250
$1.1 Million
August 2014
Mavis
Brampton
Dufferin |
 33
Self Storage Industry Update |
 Self Storage
Industry Update 34
•
The Fastest Growing Segment of the
Commercial Real Estate Industry Over
the Last 35 Years
(1)
•
Unique in its Ability to Add Value as an
Operating Business
•
Low Capital Expenditure Requirements
•
No Tenant Improvements or No Leasing
Commissions
(2)
Total Self Storage Rentable Space in the US is now 2.3 Billion Square Feet
(1)
Self Storage Association “Industry Fact Sheet”
(11/13)
(2)
We do not pay commissions in connection with the leasing of our self storage units; however,
we pay certain fees associated with the day-to-day management and operations of
our self storage facilities. Percentage of Self Storage Facilities
(1)
Largest Self
Storage Company
Top 50
Companies
4.4%
15%
Single Facility
Owners
60%
85%
Smaller
Owners |
 Self Storage
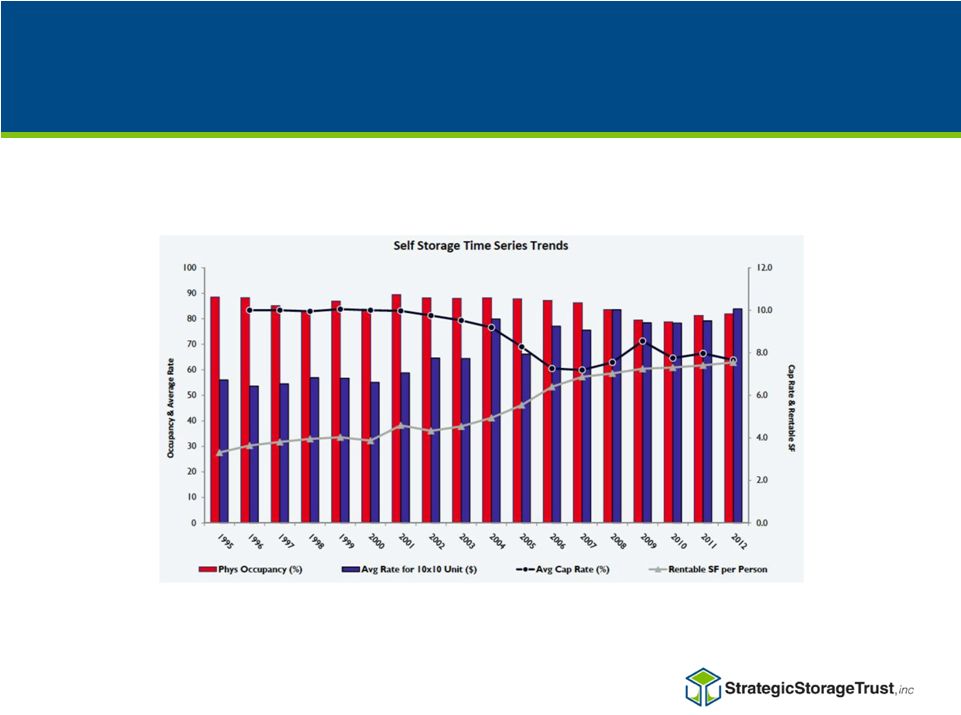
Industry Update 35
Source: Cushman & Wakefield Presentation –
Self Storage: the State of the Industry –
May 2013
Market Trends |
 Self Storage
Industry Update 36
Source:
Wells
Fargo
Securities,
LLC,
and
Intex
Solutions,
Inc. -
2013
Mortgage Default History |
 |