Attached files
Table of Contents
UNITED STATES
SECURITIES AND EXCHANGE COMMISSION
WASHINGTON, D.C. 20549
FORM 10-Q
| x | QUARTERLY REPORT PURSUANT TO SECTION 13 OR 15(d) OF THE SECURITIES EXCHANGE ACT OF 1934 |
For the quarterly period ended September 30, 2010
| ¨ | TRANSITION REPORT PURSUANT TO SECTION 13 OR 15(d) OF THE SECURITIES EXCHANGE ACT OF 1934 |
For the transition period from to
Commission File Number: 000-53644
Strategic Storage Trust, Inc.
(Exact name of Registrant as specified in its charter)
| Maryland | 32-0211624 | |
| (State or other jurisdiction of incorporation or organization) |
(IRS Employer Identification No.) |
111 Corporate Drive, Suite 120, Ladera Ranch, California 92694
(Address of principal executive offices)
(877) 327-3485
(Registrant’s telephone number)
N/A
(Former name, former address and former fiscal year, if changed since last report)
Indicate by check mark whether the registrant (1) has filed all reports required to be filed by Section 13 or 15(d) of the Securities Exchange Act of 1934 during the preceding 12 months (or for such shorter period that the registrant was required to file such reports) and (2) has been subject to such filing requirements for the past 90 days. Yes x No ¨
Indicate by check mark whether the registrant has submitted electronically and posted on its corporate Web site, if any, every Interactive Data File required to be submitted and posted pursuant to Rule 405 of Regulation S-T (§232.405 of this chapter) during the preceding 12 months (or for such shorter period that the registrant was required to submit and post such files). Yes ¨ No ¨
Indicate by check mark whether the registrant is a large accelerated filer, an accelerated filer, a non-accelerated filer, or a smaller reporting company. See definitions of “large accelerated filer,” “accelerated filer” and “smaller reporting company” in Rule 12b-2 of the Exchange Act. (Check one)
| Large accelerated filer | ¨ | Accelerated filer | ¨ | |||
| Non-accelerated filer | x (do not check if a smaller reporting company) | Smaller reporting company | ¨ | |||
Indicate by check mark whether the registrant is a shell company (as defined in Rule 12b-2 of the Exchange Act). Yes ¨ No x
Indicate the number of shares outstanding of each of the issuer’s classes of common stock, as of November 9, 2010: 25,104,657 $0.001 par value per share.
Table of Contents
STRATEGIC STORAGE TRUST, INC.
TABLE OF CONTENTS
| Page No. |
||||||
| PART I. | FINANCIAL INFORMATION | |||||
| Cautionary Note Regarding Forward-Looking Statements | 3 | |||||
| Item 1. | Financial Statements: | 4 | ||||
| Consolidated Balance Sheets as of September 30, 2010 (unaudited) and December 31, 2009 (unaudited) |
5 | |||||
| 6 | ||||||
| 7 | ||||||
| 8 | ||||||
| Notes to Consolidated Financial Statements (unaudited) | 9 | |||||
| Item 2. | Management’s Discussion and Analysis of Financial Condition and Results of Operations | 30 | ||||
| Item 3. | Quantitative and Qualitative Disclosures About Market Risk | 45 | ||||
| Item 4. | Controls and Procedures | 45 | ||||
| PART II. | OTHER INFORMATION | |||||
| Item 1. | Legal Proceedings | 46 | ||||
| Item 1A. | Risk Factors | 46 | ||||
| Item 2. | Unregistered Sales of Equity Securities and Use of Proceeds | 46 | ||||
| Item 3. | Defaults Upon Senior Securities | 47 | ||||
| Item 4. | (Removed and Reserved) | 47 | ||||
| Item 5. | Other Information | 47 | ||||
| Item 6. | Exhibits | 47 | ||||
2
Table of Contents
PART I. FINANCIAL INFORMATION
CAUTIONARY NOTE REGARDING FORWARD-LOOKING STATEMENTS
Certain statements contained in this Form 10-Q of Strategic Storage Trust, Inc., other than historical facts, may be considered forward-looking statements within the meaning of Section 27A of the Securities Act of 1933, as amended (the “Securities Act”) and Section 21E of the Securities Exchange Act of 1934, as amended (the “Exchange Act”). We intend for all such forward-looking statements to be covered by the applicable safe harbor provisions for forward-looking statements contained in Section 27A of the Securities Act and Section 21E of the Exchange Act, as applicable. Such statements include, in particular, statements about our plans, strategies, and prospects and are subject to certain risks and uncertainties, including known and unknown risks, which could cause actual results to differ materially from those projected or anticipated. Therefore, such statements are not intended to be a guarantee of our performance in future periods. Such forward-looking statements can generally be identified by our use of forward-looking terminology such as “may,” “will,” “expect,” “intend,” “anticipate,” “estimate,” “believe,” “continue,” or other similar words. Readers are cautioned not to place undue reliance on these forward-looking statements, which speak only as of the date this report is filed with the Securities and Exchange Commission. We cannot guarantee the accuracy of any such forward-looking statements contained in this Form 10-Q, and we do not intend to publicly update or revise any forward-looking statements, whether as a result of new information, future events, or otherwise.
Any such forward-looking statements are subject to risks, uncertainties, and other factors and are based on a number of assumptions involving judgments with respect to, among other things, future economic, competitive, and market conditions, all of which are difficult or impossible to predict accurately. To the extent that our assumptions differ from actual results, our ability to meet such forward-looking statements, including our ability to generate positive cash flow from operations and provide distributions to stockholders, and our ability to find suitable investment properties, may be significantly hindered. See the risk factors identified in the “Risk Factors” section of our 2009 Annual Report on Form 10-K, as filed with the Securities and Exchange Commission, and Part II, Item 1A in this Form 10-Q for a discussion of some, although not all, of the risks and uncertainties that could cause actual results to differ materially from those presented in our forward-looking statements.
3
Table of Contents
| ITEM 1. | CONSOLIDATED FINANCIAL STATEMENTS |
The information furnished in the accompanying consolidated balance sheets and related consolidated statements of operations, stockholders’ equity, and cash flows reflects all adjustments that are, in management’s opinion, necessary for a fair and consistent presentation of the aforementioned financial statements.
The accompanying financial statements should be read in conjunction with the notes to our financial statements and Management’s Discussion and Analysis of Financial Condition and Results of Operations included in this report on Form 10-Q. The accompanying financial statements should also be read in conjunction with our financial statements and notes thereto and Management’s Discussion and Analysis of Financial Condition and Results of Operations included in our Form 10-K for the year ended December 31, 2009. Our results of operations for the three and nine months ended September 30, 2010 are not necessarily indicative of the operating results expected for the full year.
4
Table of Contents
STRATEGIC STORAGE TRUST, INC. AND SUBSIDIARIES
CONSOLIDATED BALANCE SHEETS
(Unaudited)
| September 30, 2010 |
December 31, 2009 |
|||||||
| ASSETS |
||||||||
| Cash and cash equivalents |
$ | 56,877,587 | $ | 23,778,458 | ||||
| Real estate facilities: |
||||||||
| Land |
65,896,165 | 53,116,165 | ||||||
| Buildings |
126,873,051 | 89,798,903 | ||||||
| Site Improvements |
14,986,419 | 12,143,292 | ||||||
| 207,755,635 | 155,058,360 | |||||||
| Accumulated depreciation |
(5,227,718 | ) | (1,733,158 | ) | ||||
| 202,527,917 | 153,325,202 | |||||||
| Construction in process |
526,953 | — | ||||||
| Real estate facilities, net ($17,246,373 and $17,419,600 related to VIEs) |
203,054,870 | 153,325,202 | ||||||
| Escrow receivable |
506,400 | 300,504 | ||||||
| Deferred financing costs, net of accumulated amortization |
1,927,803 | 991,916 | ||||||
| Intangible assets, net of accumulated amortization |
13,710,384 | 13,717,520 | ||||||
| Restricted cash |
1,939,418 | 1,847,847 | ||||||
| Investments in unconsolidated joint ventures |
9,271,900 | 8,896,642 | ||||||
| Other assets |
1,663,132 | 843,214 | ||||||
| Total assets |
$ | 288,951,494 | $ | 203,701,303 | ||||
| LIABILITIES AND STOCKHOLDERS’ EQUITY |
||||||||
| Secured promissory notes ($10,149,826 and $10,115,853 related to VIEs) |
$ | 115,057,136 | $ | 78,256,583 | ||||
| Accounts payable and accrued liabilities |
5,416,456 | 3,155,174 | ||||||
| Due to affiliates |
407,332 | 610,110 | ||||||
| Distributions payable |
1,367,679 | 975,516 | ||||||
| Total liabilities |
122,248,603 | 82,997,383 | ||||||
| Commitments and contingencies (Note 7) |
||||||||
| Redeemable common stock |
2,507,071 | 1,635,054 | ||||||
| Stockholders’ equity: |
||||||||
| Strategic Storage Trust, Inc. stockholders’ equity: |
||||||||
| Common stock, $0.001 par value; 700,000,000 shares authorized; 24,177,656 and 16,638,556 shares issued and outstanding at September 30, 2010 and December 31, 2009, respectively |
24,178 | 16,639 | ||||||
| Additional paid-in capital |
190,215,480 | 125,714,066 | ||||||
| Distributions |
(16,258,194 | ) | (5,540,748 | ) | ||||
| Accumulated deficit |
(16,706,352 | ) | (8,807,189 | ) | ||||
| Total Strategic Storage Trust, Inc. stockholders’ equity |
157,275,112 | 111,382,768 | ||||||
| Noncontrolling interest in operating partnership |
50,862 | 63,533 | ||||||
| Other noncontrolling interests |
6,869,846 | 7,622,565 | ||||||
| Total noncontrolling interests |
6,920,708 | 7,686,098 | ||||||
| Total stockholders’ equity |
164,195,820 | 119,068,866 | ||||||
| Total liabilities and stockholders’ equity |
$ | 288,951,494 | $ | 203,701,303 | ||||
See notes to consolidated financial statements.
5
Table of Contents
STRATEGIC STORAGE TRUST, INC. AND SUBSIDIARIES
CONSOLIDATED STATEMENTS OF OPERATIONS
(Unaudited)
| Three Months Ended September 30, |
Nine Months Ended September 30, |
|||||||||||||||
| 2010 | 2009 | 2010 | 2009 | |||||||||||||
| Revenues: |
||||||||||||||||
| Self storage rental income |
$ | 6,765,489 | $ | 1,715,064 | $ | 17,977,862 | $ | 3,097,070 | ||||||||
| Ancillary operating income |
172,386 | 40,536 | 423,178 | 63,486 | ||||||||||||
| Total revenues |
6,937,875 | 1,755,600 | 18,401,040 | 3,160,556 | ||||||||||||
| Operating expenses: |
||||||||||||||||
| Property operating expenses |
2,781,471 | 714,150 | 7,300,155 | 1,318,834 | ||||||||||||
| Property operating expenses - affiliates |
692,396 | 249,735 | 1,815,939 | 482,978 | ||||||||||||
| General and administrative |
508,456 | 391,520 | 2,072,830 | 1,292,826 | ||||||||||||
| Depreciation |
1,297,340 | 387,543 | 3,537,402 | 757,339 | ||||||||||||
| Intangible amortization expense |
2,074,463 | 562,687 | 5,752,432 | 1,033,526 | ||||||||||||
| Total operating expenses |
7,354,126 | 2,305,635 | 20,478,758 | 4,885,503 | ||||||||||||
| Operating loss |
(416,251 | ) | (550,035 | ) | (2,077,718 | ) | (1,724,947 | ) | ||||||||
| Other income (expense): |
||||||||||||||||
| Interest expense |
(1,530,899 | ) | (261,150 | ) | (4,141,879 | ) | (571,629 | ) | ||||||||
| Deferred financing amortization expense |
(70,339 | ) | (24,219 | ) | (176,505 | ) | (122,885 | ) | ||||||||
| Property acquisition expenses - affiliates |
(148,349 | ) | (917,466 | ) | (1,472,591 | ) | (1,412,748 | ) | ||||||||
| Other property acquisition expenses |
(311,293 | ) | (257,915 | ) | (927,475 | ) | (1,308,014 | ) | ||||||||
| Equity in earnings of real estate ventures |
210,839 | 14,447 | 657,627 | 14,447 | ||||||||||||
| Interest income |
8,165 | 813 | 9,229 | 4,570 | ||||||||||||
| Other |
(11,716 | ) | (2,198 | ) | (107,545 | ) | (6,833 | ) | ||||||||
| Net loss |
(2,269,843 | ) | (1,997,723 | ) | (8,236,857 | ) | (5,128,039 | ) | ||||||||
| Less: Net loss attributable to the noncontrolling interest in our operating partnership |
500 | 4,985 | 2,200 | 21,878 | ||||||||||||
| Net loss attributable to other noncontrolling interests |
110,842 | (1,013 | ) | 335,494 | (1,013 | ) | ||||||||||
| Net loss attributable to Strategic Storage Trust, Inc. |
$ | (2,158,501 | ) | $ | (1,993,751 | ) | $ | (7,899,163 | ) | $ | (5,107,174 | ) | ||||
| Net loss per share - basic |
$ | (0.09 | ) | $ | (0.29 | ) | $ | (0.39 | ) | $ | (1.12 | ) | ||||
| Net loss per share - diluted |
$ | (0.09 | ) | $ | (0.29 | ) | $ | (0.39 | ) | $ | (1.12 | ) | ||||
| Weighted average shares outstanding - basic |
23,004,745 | 6,915,565 | 20,468,318 | 4,580,410 | ||||||||||||
| Weighted average shares outstanding - diluted |
23,004,745 | 6,915,565 | 20,468,318 | 4,580,410 | ||||||||||||
See notes to consolidated financial statements.
6
Table of Contents
STRATEGIC STORAGE TRUST, INC. AND SUBSIDIARIES
CONSOLIDATED STATEMENT OF STOCKHOLDERS’ EQUITY
(Unaudited)
| Number of Shares |
Common Stock Par Value |
Additional Paid-in Capital |
Distributions | Accumulated Deficit |
Non- controlling Interests |
Total | ||||||||||||||||||||||
| Balance as of December 31, 2009 |
16,638,556 | $ | 16,639 | $ | 125,714,066 | $ | (5,540,748 | ) | $ | (8,807,189 | ) | $ | 7,686,098 | $ | 119,068,866 | |||||||||||||
| Gross proceeds from issuance of common stock |
7,332,084 | 7,332 | 73,118,910 | — | — | — | 73,126,242 | |||||||||||||||||||||
| Offering costs |
— | — | (8,633,435 | ) | — | — | — | (8,633,435 | ) | |||||||||||||||||||
| Additions to redeemable common stock |
— | — | (1,938,777 | ) | — | — | — | (1,938,777 | ) | |||||||||||||||||||
| Redemptions of common stock |
(253,712 | ) | (254 | ) | (2,420,073 | ) | — | — | — | (2,420,327 | ) | |||||||||||||||||
| Issuance of restricted stock |
1,875 | 2 | — | — | — | — | 2 | |||||||||||||||||||||
| Distributions ($0.525 per share) |
— | — | — | (10,717,446 | ) | — | — | (10,717,446 | ) | |||||||||||||||||||
| Distributions for noncontrolling interests |
— | — | — | — | — | (243,445 | ) | (243,445 | ) | |||||||||||||||||||
| Issuance of shares for distribution reinvestment plan |
458,853 | 459 | 4,358,645 | — | — | — | 4,359,104 | |||||||||||||||||||||
| Purchase of noncontrolling interest |
— | — | — | — | — | (184,251 | ) | (184,251 | ) | |||||||||||||||||||
| Stock based compensation expense |
— | — | 16,144 | — | — | — | 16,144 | |||||||||||||||||||||
| Net loss |
— | — | — | — | (7,899,163 | ) | (337,694 | ) | (8,236,857 | ) | ||||||||||||||||||
| Balance as of September 30, 2010 |
24,177,656 | $ | 24,178 | $ | 190,215,480 | $ | (16,258,194 | ) | $ | (16,706,352 | ) | $ | 6,920,708 | $ | 164,195,820 | |||||||||||||
See notes to consolidated financial statements.
7
Table of Contents
STRATEGIC STORAGE TRUST, INC. AND SUBSIDIARIES
CONSOLIDATED STATEMENTS OF CASH FLOWS
(Unaudited)
| Nine Months Ended September 30, 2010 |
Nine Months Ended September 30, 2009 |
|||||||
| Cash flows from operating activities: |
||||||||
| Net loss |
$ | (8,236,857 | ) | $ | (5,128,039 | ) | ||
| Adjustments to reconcile net loss to cash provided by (used in) operating activities: |
||||||||
| Depreciation and amortization expense |
9,466,339 | 1,913,750 | ||||||
| Noncash interest expense |
196,046 | 45,382 | ||||||
| Expense related to issuance of restricted stock |
16,146 | 19,792 | ||||||
| Equity in loss (income) of unconsolidated joint ventures |
(558,893 | ) | — | |||||
| Distributions from unconsolidated joint ventures |
448,635 | — | ||||||
| Increase (decrease) in cash from changes in assets and liabilities: |
||||||||
| Restricted cash |
(91,571 | ) | (547,379 | ) | ||||
| Other assets |
(143,556 | ) | 147,804 | |||||
| Accounts payable and other accrued liabilities |
1,194,522 | 1,663,520 | ||||||
| Due to affiliates |
(82,858 | ) | 75,954 | |||||
| Net cash flows provided by (used in) operating activities |
2,207,953 | (1,809,216 | ) | |||||
| Cash flows from investing activities: |
||||||||
| Purchases of real estate |
(49,645,304 | ) | (39,138,345 | ) | ||||
| Additional investment in unconsolidated joint venture |
(265,000 | ) | — | |||||
| Additional investment in noncontrolling interest |
(184,251 | ) | — | |||||
| Additions to real estate facilities |
(1,157,418 | ) | (22,801 | ) | ||||
| Construction in process |
(526,953 | ) | — | |||||
| Cash acquired in mergers with private REITs |
— | 712,692 | ||||||
| Deposits on acquisitions of real estate facilities |
(700,000 | ) | — | |||||
| Net cash flows used in investing activities |
(52,478,926 | ) | (38,448,454 | ) | ||||
| Cash flows from financing activities: |
||||||||
| Payments on secured promissory notes |
(3,639,546 | ) | (5,104,829 | ) | ||||
| Proceeds from issuance of secured promissory notes |
32,585,000 | 4,975,000 | ||||||
| Deferred financing costs |
(1,112,392 | ) | (1,059,640 | ) | ||||
| Gross proceeds from issuance of common stock |
73,126,242 | 54,271,686 | ||||||
| Redemptions of common stock |
(2,420,327 | ) | (12,950 | ) | ||||
| Offering costs |
(8,633,435 | ) | (6,429,107 | ) | ||||
| Escrow receivable |
(205,896 | ) | (6,102 | ) | ||||
| Due to affiliates |
(119,920 | ) | (258,194 | ) | ||||
| Distributions paid |
(5,966,179 | ) | (1,153,784 | ) | ||||
| Distributions paid to noncontrolling interests |
(243,445 | ) | (26,092 | ) | ||||
| Net cash flows provided by financing activities |
83,370,102 | 45,195,988 | ||||||
| Increase in cash and cash equivalents |
33,099,129 | 4,938,318 | ||||||
| Cash and cash equivalents, beginning of period |
23,778,458 | 2,614,632 | ||||||
| Cash and cash equivalents, end of period |
$ | 56,877,587 | $ | 7,552,950 | ||||
| Supplemental disclosures of non-cash transactions: |
||||||||
| Cash paid for interest |
$ | 3,796,611 | $ | 416,666 | ||||
| Distributions payable |
$ | 1,367,679 | $ | 678,680 | ||||
| Issuance of shares pursuant to distribution reinvestment plan |
$ | 4,359,104 | $ | 870,625 | ||||
| Seller notes payable issued in connection with purchase of real estate facilities |
$ | 4,800,000 | $ | 4,500,000 | ||||
| Assumption of notes payable issued in connection with purchase of real estate facilities |
$ | 3,199,696 | $ | 2,986,555 | ||||
See notes to consolidated financial statements.
8
Table of Contents
STRATEGIC STORAGE TRUST, INC. AND SUBSIDIARIES
NOTES TO CONSOLIDATED FINANCIAL STATEMENTS
September 30, 2010
Note 1. Organization
Strategic Storage Trust, Inc., a Maryland corporation (the “Company”), was formed on August 14, 2007 under the Maryland General Corporation Law for the purpose of engaging in the business of investing in self storage facilities. The Company’s year end is December 31. As used in this report, “we” “us” and “our” refer to Strategic Storage Trust, Inc.
Strategic Capital Holdings, LLC, a Virginia limited liability company (our “Sponsor”), is the sponsor of our initial public offering. Our Sponsor was formed on July 21, 2004 to engage in private structured offerings of limited partnerships and other entities with respect to the acquisition, management and disposition of commercial real estate assets. Our Sponsor owns a majority of Strategic Storage Holdings, LLC, which is the sole member of our advisor and our property manager.
Our advisor is Strategic Storage Advisor, LLC, a Delaware limited liability company (our “Advisor”) which was formed on August 13, 2007. Our Advisor is responsible for managing our affairs on a day-to-day basis and identifying and making acquisitions and investments on our behalf under the terms of an advisory agreement we have with our Advisor (our “Advisory Agreement”). Some of the officers of our Advisor are also officers of our Sponsor and of us.
On August 24, 2007, our Advisor purchased 100 shares of our common stock for $1,000 and became our initial stockholder. Our Articles of Amendment and Restatement authorize 700,000,000 shares of common stock with a par value of $0.001 and 200,000,000 shares of preferred stock with a par value of $0.001. We are currently offering a maximum of 110,000,000 shares of common stock, consisting of 100,000,000 shares for sale to the public (the “Primary Offering”) and 10,000,000 shares for sale pursuant to our distribution reinvestment plan (collectively, the “Offering”).
On March 17, 2008, the Securities and Exchange Commission (“SEC”) declared our registration statement effective. Shares will be offered until March 17, 2011 under the Offering. On May 22, 2008, we satisfied the minimum offering requirements of the Primary Offering and commenced formal operations. As of September 30, 2010, in connection with our Offering, we had issued approximately 18.2 million shares of our common stock for gross proceeds of approximately $181.8 million. In addition to the Offering, in September 2009 we also issued approximately 6.2 million shares in connection with two mergers with private real estate investment trusts sponsored by our Sponsor (See Note 3).
On August 17, 2010, we filed a registration statement with the SEC to register 110 million shares of common stock, of which 100 million shares are to be offered in a primary offering for $10 per share and 10 million shares of common stock are to be offered under our distribution reinvestment plan for $9.50 per share. We have not issued any shares under this registration statement as it has not been declared effective by the SEC. We do not expect to commence an offering under this registration statement until the earlier of the date that we sell all the shares available for sale in our current offering or March 17, 2011.
Our dealer manager, U.S. Select Securities LLC, a Virginia limited liability company (our “Dealer Manager”) is an affiliate of our Sponsor. Our Dealer Manager is responsible for marketing our shares being offered pursuant to the Offering. We intend to invest the net proceeds from the Offering primarily in self storage facilities and related self storage real estate investments.
Our operating partnership, Strategic Storage Operating Partnership, L.P., a Delaware limited partnership (our “Operating Partnership”), was formed on August 14, 2007. On August 24, 2007, our
9
Table of Contents
STRATEGIC STORAGE TRUST, INC. AND SUBSIDIARIES
NOTES TO CONSOLIDATED FINANCIAL STATEMENTS
September 30, 2010
Advisor purchased a limited partnership interest in our Operating Partnership for $200,000 and on August 24, 2007, we contributed the initial $1,000 capital contribution we received to our Operating Partnership in exchange for the general partner interest. Our Operating Partnership owns, directly or indirectly through one or more special purpose entities, all of the self storage properties that we acquired, other than the properties acquired in the two mergers with private real estate investment trusts described in Note 3. We will conduct certain activities (such as selling packing supplies and locks and renting trucks or other moving equipment) through our taxable REIT subsidiaries (the “TRSs”), which are our wholly-owned subsidiaries.
Our property manager is Strategic Storage Property Management, LLC, a Delaware limited liability company (our “Property Manager”), which was formed in August 2007 to manage our properties. Our Property Manager derives substantially all of its income from the property management services it performs for us.
As we accept subscriptions for shares of our common stock, we transfer substantially all of the net proceeds of the Offering to our Operating Partnership as capital contributions in exchange for additional units of interest in our Operating Partnership. However, we are deemed to have made capital contributions in the amount of the gross offering proceeds received from investors and the Operating Partnership is deemed to have simultaneously paid the sales commissions and other costs associated with the Offering. In addition, our Operating Partnership is structured to make distributions with respect to limited partnership units that will be equivalent to the distributions made to holders of our common stock. Finally, a limited partner in our Operating Partnership may later exchange his or her limited partnership units in our Operating Partnership for shares of our common stock at any time after one year following the date of issuance of their limited partnership units, subject to certain restrictions as outlined in the limited partnership agreement. We are the sole general partner of our Operating Partnership, and our Advisor is currently the only limited partner of our Operating Partnership. Our Advisor is prohibited from exchanging or otherwise transferring its limited partnership units so long as it is acting as our Advisor pursuant to our Advisory Agreement.
On September 25, 2008, we acquired our first two self storage facilities and as of September 30, 2009 we owned 24 self storage facilities. On September 24, 2009, through mergers with two private real estate investment trusts sponsored by our Sponsor, we acquired 11 of our wholly-owned facilities and certain preferred equity and/or minority interests described below. As of September 30, 2010, we wholly-owned 35 self storage facilities located in 14 states (Alabama, Arizona, California, Florida, Georgia, Kentucky, Mississippi, Nevada, New Jersey, Pennsylvania, South Carolina, Tennessee, Texas and Virginia) comprising approximately 24,525 units and approximately 3.0 million rentable square feet. We also had interests in 19 additional self storage facilities through preferred equity and/or minority interests. Of those interests, one has been deemed to be a controlling interest and is therefore consolidated in our consolidated financial statements as discussed in Note 2. Additionally, we have an interest in a net leased industrial property in California with 356,000 rentable square feet leased to a single tenant.
Note 2. Summary of Significant Accounting Policies
Basis of Presentation
The accompanying interim financial statements have been prepared by our management in accordance with accounting principles generally accepted in the United States of America (“GAAP”) and in conjunction with the rules and regulations of the SEC. Certain information and footnote disclosures required for annual financial statements have been condensed or excluded pursuant to SEC rules and regulations. Accordingly, the interim financial statements do not include all of the information and
10
Table of Contents
STRATEGIC STORAGE TRUST, INC. AND SUBSIDIARIES
NOTES TO CONSOLIDATED FINANCIAL STATEMENTS
September 30, 2010
footnotes required by GAAP for complete financial statements. The accompanying financial statements reflect all adjustments which are, in the opinion of our management, of a normal recurring nature and necessary for a fair presentation of our financial position, results of operations and cash flows for the interim period. Operating results for the three and nine months ended September 30, 2010, are not necessarily indicative of the results that may be expected for the year ending December 31, 2010.
Reclassifications
Certain amounts previously reported in our 2009 financial statements have been reclassified to conform to the fiscal 2010 presentation.
Principles of Consolidation
Our financial statements, the financial statements of our Operating Partnership, including its wholly-owned subsidiaries, the financial statements of Self Storage REIT, Inc. (“REIT I”) and Self Storage REIT II, Inc. (“REIT II”), and the accounts of variable interest entities (VIEs) for which we are the primary beneficiary are consolidated in the accompanying consolidated financial statements. The portion of these entities not wholly-owned by us is presented as noncontrolling interests both as of and during the periods presented. All significant intercompany accounts and transactions have been eliminated in consolidation.
Consolidation Considerations for Our Investments in Joint Ventures
Recently amended accounting guidance provides a framework for identifying VIEs and determining when a company should include the assets, liabilities, noncontrolling interests, and results of activities of the VIE in its consolidated financial statements. In general, a VIE is an entity or other legal structure used to conduct activities or hold assets that either (1) has an insufficient amount of equity to carry out its principal activities without additional subordinated financial support, (2) has a group of equity owners that are unable to make significant decisions about its activities, or (3) has a group of equity owners that do not have the obligation to absorb losses or the right to receive returns generated by its operations. Generally, a VIE should be consolidated if a party with an ownership, contractual, or other financial interest in the VIE (a variable interest holder) has the power to direct the VIE’s most significant activities and the obligation to absorb losses or right to receive benefits of the VIE that could be significant to the VIE. A variable interest holder that consolidates the VIE is called the primary beneficiary. Upon consolidation, the primary beneficiary generally must initially record all of the VIE’s assets, liabilities, and noncontrolling interest at fair value and subsequently account for the VIE as if it were consolidated based on majority voting interest. As of September 30, 2010 and December 31, 2009, we had entered into contracts/interests that are deemed to be variable interests in VIEs, those variable interests include both lease agreements and equity investments. We have evaluated those variable interests against the criteria for consolidation and determined that we are not the primary beneficiary of certain investments discussed further in the “Equity Investments” section of this note.
As of September 30, 2010 and December 31, 2009, we had an equity interest in a self storage property located in San Francisco, California (“SF property”) which was deemed to be a VIE of which we are the primary beneficiary. As such, the SF property has been consolidated in our consolidated financial statements since we acquired our interest in the property through the REIT I merger. In January 2010, we acquired an approximately 2% additional interest in the SF property, bringing our total interest to approximately 12%. The SF property is owned by a Delaware Statutory Trust (DST), and by virtue of the trust agreement the investors in the trust have no direct or indirect ability through voting rights to make decisions about the DST’s significant activities. The REIT I operating partnership (the “REIT I Operating
11
Table of Contents
STRATEGIC STORAGE TRUST, INC. AND SUBSIDIARIES
NOTES TO CONSOLIDATED FINANCIAL STATEMENTS
September 30, 2010
Partnership”) has also entered into a lease agreement for the SF property, in which the REIT I Operating Partnership is the tenant, which exposes it to losses of the VIE that could be significant to the VIE and also allows it to direct activities of the VIE that determine its economic performance by means of its operation of the leased facility. The lease has an initial term of ten years beginning on December 19, 2006. The initial term of the lease may be extended at the option of the REIT I Operating Partnership for up to four successive five year terms. As of September 30, 2010, the consolidated joint venture had net real estate assets of approximately $17.2 million and net intangible assets of approximately $0.6 million. Such assets are only available to satisfy the obligations of the SF property. We have also consolidated approximately $10.1 million of secured promissory notes and approximately $6.9 million of noncontrolling interest related to this entity. The lenders of the secured promissory notes have no recourse to other Company assets. Our Sponsor has entered into an agreement to indemnify us for any losses as a result of potential shortfalls in the lease payments required to be made by the REIT I Operating Partnership. Despite such indemnification, we continue to be deemed the primary beneficiary as our Sponsor is not deemed to have a variable interest in the SF property.
Use of Estimates
The preparation of the consolidated financial statements in conformity with accounting principles generally accepted in the United States requires management to make estimates and assumptions that affect the amounts reported in the consolidated financial statements and accompanying notes. The current economic environment has increased the degree of uncertainty inherent in these estimates and assumptions. Management adjusts such estimates when facts and circumstances dictate. The most significant estimates made include the allocation of property purchase price to tangible and intangible assets acquired and liabilities assumed at fair value, the determination if certain entities should be consolidated, the evaluation of potential impairment of long-lived assets and of assets held by equity method investees, and the useful lives of real estate assets and intangibles. Actual results could materially differ from those estimates.
Cash and Cash Equivalents
We consider all short-term, highly liquid investments that are readily convertible to cash with a maturity of three months or less at the time of purchase to be cash equivalents.
We may maintain cash equivalents in financial institutions in excess of insured limits, but believe this risk is mitigated by only investing in or through major financial institutions.
Restricted Cash
Restricted cash consists of impound reserve accounts for property taxes, insurance and capital improvements in connection with the requirements of certain of our loan agreements.
Real Estate Purchase Price Allocation
As of January 1, 2009, we account for acquisitions in accordance with amended accounting guidance which requires that we allocate the purchase price of the property to the tangible and intangible assets acquired and the liabilities assumed based on estimated fair values. This guidance requires us to make significant estimates and assumptions, including fair value estimates, as of the acquisition date and to adjust those estimates as necessary during the measurement period (defined as the period, not to exceed one year, in which we may adjust the provisional amounts recognized for an acquisition). Acquisitions of portfolios of facilities are allocated to the individual facilities based upon an income approach or a cash flow analysis using appropriate risk adjusted capitalization rates which take into account the relative size,
12
Table of Contents
STRATEGIC STORAGE TRUST, INC. AND SUBSIDIARIES
NOTES TO CONSOLIDATED FINANCIAL STATEMENTS
September 30, 2010
age, and location of the individual facility along with current and projected occupancy and rental rate levels or appraised values, if available. Allocations to the individual assets and liabilities are based upon comparable market sales information for land and estimates of depreciated replacement cost of equipment, building and site improvements. In allocating the purchase price, we determine whether the acquisition includes intangible assets or liabilities. Substantially all of the leases in place at acquired properties are at market rates, as the majority of the leases are month-to-month contracts. Accordingly, to date we have not allocated any portion of the purchase price to above or below market leases. We also consider whether in-place, market leases represent an intangible asset. We recorded approximately $14.7 million and $0.9 million in intangible assets to recognize the value of in-place leases related to our acquisitions in 2009 and 2008, respectively. Through our preliminary purchase price allocations, we have recorded an additional approximately $5.8 million related to our 2010 acquisitions. Additionally, we do not expect, nor to date have we recorded, intangible assets for the value of tenant relationships because we will not have concentrations of significant tenants and the average tenant turnover is fairly frequent. Our acquisition-related transaction costs are required to be expensed as incurred. During the three and nine months ended September 30, 2010 we expensed approximately $0.5 million and $2.4 million, respectively, of acquisition related transaction costs and during the three and nine months ended September 30, 2009 we expensed approximately $1.2 million and $2.7 million, respectively, of acquisition related transaction costs.
Should the initial accounting for an acquisition be incomplete by the end of a reporting period that falls within the measurement period, we report provisional amounts in our financial statements. During the measurement period, we adjust the provisional amounts recognized at the acquisition date to reflect new information obtained about facts and circumstances that existed as of the acquisition date that, if known, would have affected the measurement of the amounts recognized as of that date and we record those adjustments to our financial statements. We apply those measurement period adjustments that we determine to be significant retrospectively to comparative information in our financial statements, potentially including adjustments to interest, depreciation and amortization expense.
Evaluation of Possible Impairment of Long-Lived Assets
Management will continually monitor events and changes in circumstances that could indicate that the carrying amounts of our long-lived assets, including those held through joint ventures, may not be recoverable. When indicators of potential impairment are present that indicate that the carrying amounts of the assets may not be recoverable, we will assess the recoverability of the assets by determining whether the carrying value of the long-lived assets will be recovered through the undiscounted future operating cash flows expected from the use of the asset and its eventual disposition. In the event that such expected undiscounted future cash flows do not exceed the carrying value, we will adjust the value of the long-lived assets to the fair value and recognize an impairment loss. As of September 30, 2010 and December 31, 2009, no impairment losses have been recognized.
Equity Investments
Our investments in unconsolidated real estate joint ventures and VIEs in which we are not the primary beneficiary, where we have significant influence, but not control, are recorded under the equity method of accounting in the accompanying consolidated financial statements. Under the equity method, our investments in real estate ventures are stated at cost and adjusted for our share of net earnings or losses and reduced by distributions. Equity in earnings of real estate ventures is generally recognized based on the allocation of cash distributions upon liquidation of the investment in accordance with the joint venture agreements.
13
Table of Contents
STRATEGIC STORAGE TRUST, INC. AND SUBSIDIARIES
NOTES TO CONSOLIDATED FINANCIAL STATEMENTS
September 30, 2010
Investments representing passive preferred equity and/or minority interests (less than 20%) are accounted for under the cost method. Under the cost method, our investments in real estate ventures are carried at cost and adjusted for other-than-temporary declines in fair value, distributions representing a return of capital and additional investments.
Through the mergers with REIT I and REIT II, we acquired five preferred equity and/or minority interests in unconsolidated joint ventures, all of which were deemed to be VIEs. We have evaluated each variable interest against the amended criteria for consolidation and determined that we are not the primary beneficiary, generally due to our inability to direct significant activities that determine the economic performance of the VIE. Four of those investments were passive or limited partner interests in self storage facilities and are accounted for under the cost method; our aggregate investment therein is approximately $1.4 million. Individually our ownership interest in those investments ranges from .28% to 11.5%; the carrying value of the investments ranged from approximately $27,000 to $680,000 and our risk of loss is limited to our individual investment therein.
The remaining interest is in a net leased industrial property (“Hawthorne property”) in California with 356,000 rentable square feet leased to a single tenant. This investment is accounted for under the equity method of accounting and our risk of loss is limited to our investment, including our maximum exposure under the terms of a debt guarantee. We own a 12% interest in Westport LAX LLC, the joint venture that acquired the Hawthorne property. Hawthorne LLC, an affiliate of our Sponsor, owns 78% of Westport LAX LLC, and we have a preferred equity interest in Hawthorne LLC which entitles us to distributions equal to 10% per annum on our investment of approximately $6.1 million. The preferred equity interest has a redemption date in November 2011, subject to extension at our sole discretion. The preferred equity interest may be called at any time in whole or part by Hawthorne LLC or redeemed at any time by us. The remaining 10% interest in Westport LAX LLC is owned by a third party, who is also the co-manager, along with our Sponsor, of the Hawthorne property. Such third party is the acting property manager and directs the operating activities of the property that determine its economic performance. We, along with other non-affiliated parties, are guarantors on the approximately $20.0 million loan used to secure the Hawthorne property; the loan has a maturity date of August 1, 2020. As of September 30, 2010, our maximum exposure to loss as a result of our involvement with this VIE, consisting of our investment balance and our guarantee of the secured debt, totaled approximately $26.1 million.
Revenue Recognition
Management believes that all of our leases are operating leases. Rental income is recognized in accordance with the terms of the leases, which generally are month-to-month. Revenues from any long-term operating leases will be recognized on a straight-line basis over the term of the lease. The excess of rents received over amounts contractually due pursuant to the underlying leases is included in accounts payable and accrued liabilities in our consolidated balance sheets and contractually due but unpaid rent is included in other assets.
Allowance for Doubtful Accounts
Tenant accounts receivable are reported net of an allowance for doubtful accounts. Management’s estimate of the allowance is based upon a review of the current status of tenant accounts receivable. It is reasonably possible that management’s estimate of the allowance will change in the future.
14
Table of Contents
STRATEGIC STORAGE TRUST, INC. AND SUBSIDIARIES
NOTES TO CONSOLIDATED FINANCIAL STATEMENTS
September 30, 2010
Depreciation of Real Property Assets
Our management is required to make subjective assessments as to the useful lives of our depreciable assets. We consider the period of future benefit of the asset to determine the appropriate useful lives.
Depreciation of our real property assets is charged to expense on a straight-line basis over the estimated useful lives as follows:
| Description |
Standard Depreciable Life | |
| Land | Not Depreciated | |
| Buildings | 30 to 40 years | |
| Site Improvements | 7 to 15 years |
Depreciation of Personal Property Assets
Personal property assets, consisting primarily of furniture, fixtures and equipment are depreciated on a straight-line basis over the estimated useful lives ranging from 3 to 5 years, and are included in other assets on our consolidated balance sheets.
Intangible Assets
We have allocated a portion of our real estate purchase price to in-place leases. We are amortizing in-place leases on a straight-line basis over the estimated future benefit period. As of September 30, 2010 and December 31, 2009 accumulated amortization of in-place lease intangibles totaled approximately $8.3 million and $2.8 million, respectively.
Amortization of Deferred Financing Costs
Costs incurred in connection with obtaining financing are deferred and amortized on a straight-line basis over the term of the related loan, which is not materially different than the effective interest method. As of September 30, 2010 and December 31, 2009, accumulated amortization of deferred financing costs totaled approximately $271,000 and $88,000, respectively.
Organizational and Offering Costs
Our Advisor may fund organization and offering costs on our behalf. We are required to reimburse our Advisor for such organization and offering costs; provided, however, our Advisor must reimburse us within 60 days after the end of the month in which the Offering terminates to the extent we paid or reimbursed organization and offering costs (excluding sales commissions and dealer manager fees) in excess of 3.5% of the gross offering proceeds from the Primary Offering. Such costs will be recognized as a liability when we have a present responsibility to reimburse our Advisor, which is defined in our Advisory Agreement as the date we satisfied the minimum offering requirements of the Primary Offering (which occurred on May 22, 2008). If at any point in time we determine that the total organization and offering costs are expected to exceed 3.5% of the gross proceeds anticipated to be received from the Primary Offering, we will recognize such excess as a capital contribution from our Advisor. As of September 30, 2010, we do not believe total organization and offering costs will exceed 3.5% of the gross proceeds anticipated to be received from the Primary Offering. Offering costs are recorded as an offset to additional paid-in capital, and organization costs are recorded as an expense.
15
Table of Contents
STRATEGIC STORAGE TRUST, INC. AND SUBSIDIARIES
NOTES TO CONSOLIDATED FINANCIAL STATEMENTS
September 30, 2010
Redeemable Common Stock
We have adopted a share redemption program that may enable stockholders to sell their shares to us in limited circumstances.
There are several limitations on our ability to redeem shares under the share redemption program including, but not limited to:
| • | Unless the shares are being redeemed in connection with a stockholder’s death, “qualifying disability” (as defined under the share redemption program) or bankruptcy, we may not redeem shares until the stockholder has held his or her shares for one year. |
| • | During any calendar year, we will not redeem in excess of 5% of the weighted-average number of shares outstanding during the prior calendar year. |
| • | The cash available for redemption is limited to the proceeds from the sale of shares pursuant to our distribution reinvestment plan. |
| • | We have no obligation to redeem shares if the redemption would violate the restrictions on distributions under Maryland law, which prohibits distributions that would cause a corporation to fail to meet statutory tests of solvency. |
See Note 7 for further discussion of our share redemption program.
Our board of directors may amend, suspend or terminate the share redemption program with 30 days’ notice to our stockholders. We may provide this notice by including such information in a Current Report on Form 8-K or in our annual or quarterly reports, all publicly filed with the SEC, or by a separate mailing to our stockholders.
We record amounts that are redeemable under the share redemption program as redeemable common stock in the accompanying consolidated balance sheets since the shares are mandatorily redeemable at the option of the holder and therefore their redemption is outside our control. The maximum amount redeemable under our share redemption program is limited to the number of shares we could repurchase with the amount of the net proceeds from the sale of shares under the distribution reinvestment plan. However, accounting guidance states that determinable amounts that can become redeemable but that are contingent on an event that is likely to occur (e.g., the passage of time) should be presented as redeemable when such amount is known. Therefore, the net proceeds from the distribution reinvestment plan are considered to be temporary equity and are presented as redeemable common stock in the accompanying consolidated balance sheets.
In addition, current accounting guidance requires, among other things, that financial instruments that represent a mandatory obligation of us to repurchase shares be classified as liabilities and reported at settlement value. Our redeemable common shares are contingently redeemable at the option of the holder. When we determine we have a mandatory obligation to repurchase shares under the share redemption program, we will reclassify such obligations from temporary equity to a liability based upon their respective settlement values.
During the nine months ended September 30, 2010 we redeemed 253,712 shares for approximately $2.4 million. As of September 30, 2010, there were approximately 128,000 shares related to redemption requests to be processed subsequent to September 30, 2010. The redemption of these shares will total approximately $1.2 million and was reclassified from redeemable common stock to accounts payable and accrued liabilities in the consolidated balance sheets as of September 30, 2010. There was an additional approximately 127,000 shares that were requested to be redeemed but could not be as we had
16
Table of Contents
STRATEGIC STORAGE TRUST, INC. AND SUBSIDIARIES
NOTES TO CONSOLIDATED FINANCIAL STATEMENTS
September 30, 2010
reached our annual maximum redemption amount under our share redemption program. Pursuant to the share redemption program, when qualifying requests exceed the then remaining amount available to be redeemed all such pending requests are redeemed on a pro rata basis. The aforementioned shares not redeemed, as well any additional qualifying requests received in 2010, will be treated as requests for redemption in the first quarter of 2011.
Accounting for Equity Awards
The cost of restricted stock is required to be measured based on the grant-date fair value and the cost to be recognized over the relevant service period.
Fair Value Measurements
The accounting standard for fair value measurements and disclosures defines fair value, establishes a framework for measuring fair value, and provides for expanded disclosure about fair value measurements. Fair value is defined by the accounting standard for fair value measurements and disclosures as the exchange price that would be received for an asset or paid to transfer a liability (an exit price) in the principal or most advantageous market for the asset or liability in an orderly transaction between market participants on the measurement date. It also establishes a fair value hierarchy that prioritizes observable and unobservable inputs used to measure fair value into three levels. The following summarizes the three levels of inputs and hierarchy of fair value we use when measuring fair value:
| • | Level 1 inputs utilize quoted prices (unadjusted) in active markets for identical assets or liabilities that we have the ability to access; |
| • | Level 2 inputs may include quoted prices for similar assets and liabilities in active markets, as well as interest rates and yield curves that are observable at commonly quoted intervals; and |
| • | Level 3 inputs are unobservable inputs for the assets or liabilities that are typically based on an entity’s own assumptions as there is little, if any, related market activity. |
In instances where the determination of the fair value measurement is based on inputs from different levels of the fair value hierarchy, the fair value measurement will fall within the lowest level that is significant to the fair value measurement in its entirety.
The accounting guidance for fair value measurements and disclosures provides a framework for measuring fair value and establishes a fair value hierarchy which requires an entity to maximize the use of observable inputs and minimize the use of unobservable inputs when measuring fair value. In determining fair value, we utilize valuation techniques that maximize the use of observable inputs and minimize the use of unobservable inputs to the extent possible as well as consider counterparty credit risk in our assessment of fair value. Considerable judgment is necessary to interpret Level 2 and 3 inputs in determining fair value of our financial and non-financial assets and liabilities. Accordingly, there can be no assurance that the fair values we present herein are indicative of amounts that may ultimately be realized upon sale or other disposition of these assets.
Financial and non-financial assets and liabilities measured at fair value on a non-recurring basis in our consolidated financial statements consist of real estate and related assets and investments in unconsolidated joint ventures and related liabilities assumed and common stock issued related to acquisitions we made during 2009 and 2010. The fair values of these assets, liabilities and common stock were determined as of the acquisition dates using widely accepted valuation techniques, including (i) discounted cash flow analysis, which considers, among other things, leasing assumptions, growth rates, discount rates and terminal capitalization rates, (ii) income capitalization approach, which considers
17
Table of Contents
STRATEGIC STORAGE TRUST, INC. AND SUBSIDIARIES
NOTES TO CONSOLIDATED FINANCIAL STATEMENTS
September 30, 2010
prevailing market capitalization rates, and (iii) comparable sales activity. In general, we consider multiple valuation techniques when measuring fair values. However, in certain circumstances, a single valuation technique may be appropriate. All of the fair values of the assets, liabilities and common stock as of the acquisition dates were derived using Level 3 inputs.
The carrying amounts of cash and cash equivalents, tenant accounts receivable, other assets, accounts payable and accrued liabilities, distributions payable and amounts due to affiliates approximate fair value because of the relatively short-term nature of these instruments.
The table below summarizes our fixed rate notes payable at September 30, 2010. The estimated fair value of financial instruments is subjective in nature and is dependent on a number of important assumptions, including discount rates and relevant comparable market information associated with each financial instrument. The fair value of the fixed rate notes payable was estimated by discounting the future cash flows using the current rates at which similar loans would be made to borrowers with similar credit ratings and for the same remaining maturities. The use of different market assumptions and estimation methodologies may have a material effect on the reported estimated fair value amounts. Accordingly, the estimates presented below are not necessarily indicative of the amounts we would realize in a current market exchange.
| September 30, 2010 | ||||||||
| Fair Value | Carrying Value | |||||||
| Fixed Rate Secured Promissory Notes |
$ | 111,955,448 | $ | 110,103,656 | ||||
Noncontrolling Interest in Consolidated Entities
We account for the noncontrolling interest in our Operating Partnership in accordance with amended accounting guidance. Due to our control through our general partnership interest in our Operating Partnership and the limited rights of the limited partner, our Operating Partnership, including its wholly-owned subsidiaries, is consolidated with the Company and the limited partner interest is reflected as a noncontrolling interest in the accompanying consolidated balance sheets. The noncontrolling interest was initially reported as the $200,000 capital investment from the Advisor and was subsequently adjusted for the limited partner’s share of losses and distributions. In addition, we account for the noncontrolling interest in the SF property in accordance with the amended accounting guidance. The noncontrolling interests shall continue to be attributed their share of income and losses, even if that attribution results in a deficit noncontrolling interest balance.
Income Taxes
We made an election to be taxed as a Real Estate Investment Trust (“REIT”), under Sections 856 through 860 of the Internal Revenue Code of 1986, as amended (the “Code”), commencing with our taxable year ended December 31, 2008. To qualify as a REIT, we must meet certain organizational and operational requirements, including a requirement to currently distribute at least 90% of the REIT’s ordinary taxable income to stockholders. As a REIT, we generally will not be subject to federal income tax on taxable income that we distribute to our stockholders. If we fail to qualify as a REIT in any taxable year, we will then be subject to federal income taxes on our taxable income at regular corporate rates and will not be permitted to qualify for treatment as a REIT for federal income tax purposes for four years following the year during which qualification is lost unless the IRS grants us relief under certain statutory provisions. Such an event could materially adversely affect our net income and net cash available for distribution to stockholders. However, we believe that we will be organized and operate in such a manner
18
Table of Contents
STRATEGIC STORAGE TRUST, INC. AND SUBSIDIARIES
NOTES TO CONSOLIDATED FINANCIAL STATEMENTS
September 30, 2010
as to qualify for treatment as a REIT and intend to operate in the foreseeable future in such a manner that we will remain qualified as a REIT for federal income tax purposes.
Even if we qualify for taxation as a REIT, we may be subject to certain state and local taxes on our income and property, and federal income and excise taxes on our undistributed income.
We have filed an election to treat the TRSs as taxable REIT subsidiaries. In general, the TRSs may perform additional services for our tenants and generally may engage in any real estate or non-real estate related business. The TRSs are subject to corporate federal and state income tax. The TRSs follow accounting guidance which requires the use of the asset and liability method. Deferred income taxes will represent the tax effect of future differences between the book and tax bases of assets and liabilities.
Per Share Data
Basic earnings per share attributable for all periods presented are computed by dividing net income (loss) by the weighted average number of shares outstanding during the period. Diluted earnings per share are computed by dividing net income (loss) by the weighted average number of shares outstanding, including all restricted stock grants as though fully vested. For the three and nine months ended September 30, 2010 and 2009, 6,875 and 6,250 shares, respectively, of unvested restricted stock were not included in the diluted weighted average shares as such shares were antidilutive.
Recently Issued Accounting Guidance
In June 2009, the Financial Accounting Standards Board (“FASB”) issued guidance related to the consolidation of VIEs. This amended guidance requires an enterprise to evaluate former qualified special purpose entities for consolidation, changes the approach to determining a VIE’s primary beneficiary from a quantitative assessment to a qualitative assessment designed to identify a controlling financial interest, and increases the frequency of required reassessments to determine whether a company is the primary beneficiary of a VIE. It also clarifies, but does not significantly change, the characteristics that identify a VIE. The guidance is effective for periods beginning after November 15, 2009. The adoption of this standard effective January 1, 2010 did not have a material impact on our financial position, results of operations, or cash flows.
In June 2009, the FASB issued amended guidance related to accounting for transfers of financial assets, which requires entities to provide more information regarding sales of securitized financial assets and similar transactions, particularly if the entity has continuing exposure to the risks related to transferred financial assets. The amended guidance eliminates the concept of a “qualifying special-purpose entity,” changes the requirements for derecognizing financial assets and requires additional disclosures. This guidance is effective for fiscal years beginning after November 15, 2009. The adoption of this standard effective January 1, 2010 did not have a material impact on our financial position, results of operations, or cash flows.
In January 2010, the FASB issued guidance related to accounting for distributions with components of both stock and cash. This amended guidance clarifies that the stock portion of a distribution to shareholders that allows them to elect to receive cash or stock with a potential limit on the total amount of cash that all shareholders can elect to receive in the aggregate is considered a share issuance that is reflected in EPS prospectively. This guidance is effective for fiscal years beginning after December 15, 2009. The adoption of this standard effective January 1, 2010 did not have a material impact on our financial position, results of operations, or cash flows.
19
Table of Contents
STRATEGIC STORAGE TRUST, INC. AND SUBSIDIARIES
NOTES TO CONSOLIDATED FINANCIAL STATEMENTS
September 30, 2010
Note 3. Merger with Private REITs
On September 24, 2009, we closed on two mergers with REIT I and REIT II, two private real estate investment trusts sponsored by our Sponsor (“Merger Transactions”). The Merger Transactions contained a closing condition requiring REIT I and REIT II, the acquired entities, to obtain any and all consents required by loan documents relating to properties owned by them. Without acknowledging whether consent was required, REIT I and REIT II attempted to notify or obtain consent from the various loan servicers for each property. In light of the structure of the Merger Transactions whereby the legal structure of REIT I and REIT II and each special purpose entity borrower remained unchanged and the length of time it was taking the loan servicers to take definitive action, our board of directors and the boards of directors of REIT I and REIT II decided to waive this last remaining closing condition and proceed to close the Merger Transactions. All but one of the loan consents have been obtained and we are uncertain as to when the remaining consent will be received, if at all.
We exchanged 1.05 and 1.0 shares of our common stock for each 1.0 share of REIT I and REIT II common stock, respectively, as consideration for the Merger Transactions.
Through the Merger Transactions we acquired 11 wholly-owned self storage facilities in Alabama, California, Florida, Nevada, South Carolina, Tennessee and Texas, comprising approximately 8,395 units and approximately 1.2 million rentable square feet, including drive-up, climate-controlled, RV, store-front and office units. We also acquired preferred equity and/or minority interests in 19 self storage facilities located in Alabama, California, Georgia, North Carolina, Maryland and Texas, comprising approximately 11,550 units and approximately 1.4 million rentable square feet, and an interest in a net leased industrial property in California with 356,000 rentable square feet leased to a single tenant.
Note 4. Real Estate Facilities
The following summarizes our activity in real estate facilities during the nine months ended September 30, 2010:
| Cost: |
||||
| Beginning balance |
$ | 155,058,360 | ||
| Facility acquisitions |
51,539,857 | |||
| Improvements and equipment additions |
1,157,418 | |||
| Ending balance |
$ | 207,755,635 | ||
| Accumulated Depreciation: |
||||
| Beginning balance |
$ | 1,733,158 | ||
| Depreciation expense |
3,494,560 | |||
| Ending balance |
$ | 5,227,718 | ||
20
Table of Contents
STRATEGIC STORAGE TRUST, INC. AND SUBSIDIARIES
NOTES TO CONSOLIDATED FINANCIAL STATEMENTS
September 30, 2010
The following table summarizes the preliminary acquisition date fair market values for our acquisitions for the nine months ended September 30, 2010:
| Property |
Acquisition Date |
Real Estate Assets |
Intangibles | Total | Debt Assumed or Issued (1) |
2010 Revenue (2) |
2010 Operating Income (2) (3) |
|||||||||||||||||||||
| Fort Lee – Fort Lee, NJ |
2/24/2010 | $ | 15,075,000 | $ | 1,675,000 | $ | 16,750,000 | $ | — | $ | 1,254,951 | $ | 819,489 | |||||||||||||||
| Weston – Weston, FL |
2/24/2010 | 5,670,000 | 630,000 | 6,300,000 | — | 542,553 | 300,409 | |||||||||||||||||||||
| Gulf Breeze II – Gulf Breeze, FL |
3/10/2010 | 1,102,500 | 122,500 | 1,225,000 | — | 97,149 | 22,998 | |||||||||||||||||||||
| Mesa – Mesa, AZ |
4/9/2010 | 3,307,500 | 367,500 | 3,675,000 | 3,199,696 | 253,052 | 122,297 | |||||||||||||||||||||
| Oakland Park – Oakland Park, FL |
4/16/2010 | 12,915,000 | 1,435,000 | 14,350,000 | — | 837,284 | 517,604 | |||||||||||||||||||||
| Tempe – Tempe, AZ |
5/6/2010 | 1,620,000 | 180,000 | 1,800,000 | — | 138,808 | 67,184 | |||||||||||||||||||||
| Phoenix II – Phoenix, AZ |
5/6/2010 | 1,530,000 | 170,000 | 1,700,000 | — | 142,243 | 81,770 | |||||||||||||||||||||
| Riverdale – Riverdale, NJ |
5/14/2010 | 5,396,857 | 637,500 | 6,034,357 | 4,459,357 | 246,603 | 91,622 | |||||||||||||||||||||
| Davie – Davie, FL |
7/14/2010 | 4,923,000 | 547,000 | 5,470,000 | — | 242,803 | 128,106 | |||||||||||||||||||||
| Total |
$ | 51,539,857 | $ | 5,764,500 | $ | 57,304,357 | $ | 7,659,053 | $ | 3,755,446 | $ | 2,151,479 | ||||||||||||||||
| (1) | See Note 5 for specific terms of our debt. |
| (2) | The operating results of the facilities acquired above have been included in our statement of operations since their respective acquisition date. |
| (3) | Operating income excludes asset management fees, interest expense, depreciation and amortization. |
The purchase price allocations included above are preliminary and therefore, subject to change, upon the completion of our analysis of appraisals and other information related to the acquisitions. We anticipate finalizing the purchase price allocations by December 31, 2010 along with supplementary pro forma information.
All of the above transactions were acquired from unaffiliated third parties. Acquisition fees paid to our Advisor for the 2010 acquisitions totaled $1,441,125.
In 2009, excluding the Merger Transactions, we acquired 12 wholly-owned self storage facilities in Alabama, Arizona, Georgia, Kentucky, New Jersey and Pennsylvania comprising approximately 7,470 units and 909,550 rentable square feet, including drive-up, climate-controlled, RV, store-front and office units for total consideration of approximately $52.1 million.
21
Table of Contents
STRATEGIC STORAGE TRUST, INC. AND SUBSIDIARIES
NOTES TO CONSOLIDATED FINANCIAL STATEMENTS
September 30, 2010
Note 5. Secured Promissory Notes
Our secured promissory notes are summarized as follows:
| Carrying value as of: | ||||||||||||||||
| Encumbered Property |
September 30, 2010 |
December 31, 2009 |
Stated Interest Rate |
Maturity Date |
||||||||||||
| Crescent Springs |
$ | 800,000 | $ | 800,000 | 5.00 | % | 2/11/2014 | |||||||||
| Florence, Walton |
3,700,000 | 3,700,000 | 5.00 | % | 2/11/2014 | |||||||||||
| Biloxi, Gulf Breeze |
4,953,480 | 4,975,000 | 6.50 | %(1) | 4/1/2012 | |||||||||||
| Montgomery |
2,921,019 | 2,967,038 | 6.42 | % | 7/1/2016 | |||||||||||
| Seabrook |
4,664,196 | 4,709,307 | 5.73 | % | 1/1/2016 | |||||||||||
| Greenville |
2,337,286 | 2,359,937 | 5.65 | % | 3/1/2016 | |||||||||||
| Kemah |
9,113,738 | 9,191,016 | 6.20 | % | 6/1/2016 | |||||||||||
| Memphis |
2,580,338 | 2,604,000 | 5.67 | % | 12/1/2016 | |||||||||||
| Tallahassee |
7,650,000 | 7,650,000 | 6.16 | % | 8/1/2016 | |||||||||||
| Houston |
2,095,773 | 2,119,313 | 5.67 | % | 2/1/2017 | |||||||||||
| San Francisco (consolidated VIE) |
10,500,000 | 10,500,000 | 5.84 | % | 12/1/2016 | |||||||||||
| Lake Forest |
18,000,000 | 18,000,000 | 6.47 | % | 10/1/2017 | |||||||||||
| Las Vegas I |
1,540,000 | 1,540,000 | 5.72 | % | 6/1/2017 | |||||||||||
| Pearland |
3,500,000 | 3,500,000 | 5.93 | % | 7/1/2017 | |||||||||||
| Daphne |
1,879,778 | 1,982,622 | 5.47 | % | 8/1/2020 | |||||||||||
| Mesa |
3,175,987 | — | 5.38 | % | 4/1/2015 | |||||||||||
| Riverdale |
4,800,000 | — | 4.00 | % | 5/14/2014 | |||||||||||
| Prudential Portfolio Loan(2) |
32,585,000 | — | 5.42 | %(3) | 9/5/2019 | |||||||||||
| Loans maturing after 12/31/09 |
— | 3,255,000 | ||||||||||||||
| Net fair value adjustment |
(1,739,459 | ) | (1,596,650 | ) | ||||||||||||
| Total mortgage loans and notes payable |
$ | 115,057,136 | $ | 78,256,583 | ||||||||||||
| (1) | The interest rate on this debt resets monthly, based on three-month LIBOR plus 450 basis points (4.5%) and has a floor of 6.50%. The rate in effect as of September 30, 2010 was 6.50%. |
| (2) | This portfolio loan is comprised of 11 discrete mortgage loans on 11 respective properties (Manassas, Marietta, Erlanger, Pittsburgh, Weston, Fort Lee, Oakland Park, Tempe, Phoenix II, Davie, Las Vegas II). Each of the individual loans is cross-collateralized by the other ten. |
| (3) | Ten of the loans in this portfolio loan bear an interest rate of 5.43% and the remaining loan bears an interest rate of 5.31%. The weighted average interest rate of this portfolio is 5.42%. |
On August 25, 2010, through certain property-owning special purpose entities, we entered into a loan agreement and various promissory notes in connection with eleven individual loans obtained from The Prudential Insurance Company of America (collectively, the “Prudential Portfolio Loan”) for a total principal amount of approximately $32.6 million. The proceeds from the Prudential Portfolio Loan will be used to make future acquisitions of self storage facilities. Each of the individual loans comprising the Prudential Portfolio Loan has a term of nine years and matures on September 5, 2019. Ten of the loans
22
Table of Contents
STRATEGIC STORAGE TRUST, INC. AND SUBSIDIARIES
NOTES TO CONSOLIDATED FINANCIAL STATEMENTS
September 30, 2010
bear a fixed interest rate of 5.43% per annum, and the remaining loan bears a fixed interest rate of 5.31% per annum, all on a 30-year amortization schedule. Payments of principal and interest are due on a monthly basis, and we may prepay all or any portion of the Prudential Portfolio Loan upon 30 days’ written notice, subject to a prepayment premium.
Each of the loans is secured by a first priority mortgage or deed of trust on one of the encumbered properties and carries with it a Promissory Note, Assignment of Leases and Rents, Supplemental Guaranty and Recourse Liabilities Guaranty. The terms of these five agreements are identical other than information that specifically relates to the properties individually. The Prudential Portfolio Loan contains a number of other customary terms and covenants.
The following table presents the future principal payment requirements on outstanding secured promissory notes at September 30, 2010:
| 2010 |
$ | 256,365 | ||
| 2011 |
1,084,314 | |||
| 2012 |
8,679,970 | |||
| 2013 |
1,404,411 | |||
| 2014 |
8,287,214 | |||
| 2015 and thereafter |
97,084,321 | |||
| Total payments |
116,796,595 | |||
| Unamortized fair value adjustment |
(1,739,459 | ) | ||
| Total |
$ | 115,057,136 | ||
We record the amortization of debt discounts related to fair value adjustments to interest expense. The weighted average interest rate of our fixed rate debt as of September 30, 2010 was approximately 5.74%.
Note 6. Related Party Transactions
Fees to Affiliates
Our Advisory Agreement with our Advisor and dealer manager agreement (“Dealer Manager Agreement”) with our Dealer Manager entitle our Advisor and our Dealer Manager to specified fees upon the provision of certain services with regard to the Offering and investment of funds in real estate properties, among other services, as well as reimbursement for organizational and offering costs incurred by our Advisor on our behalf and reimbursement of certain costs and expenses incurred by our Advisor in providing services to us.
23
Table of Contents
STRATEGIC STORAGE TRUST, INC. AND SUBSIDIARIES
NOTES TO CONSOLIDATED FINANCIAL STATEMENTS
September 30, 2010
Pursuant to the terms of the agreements described above, the following summarizes the related party costs incurred for the three and nine months ended September 30, 2010 and 2009:
| Three Months Ended September 30, 2010 Incurred |
Three Months Ended September 30, 2009 Incurred |
Nine Months Ended September 30, 2010 Incurred |
Nine Months Ended September 30, 2009 Incurred |
|||||||||||||
| Expensed |
||||||||||||||||
| Reimbursement of operating expenses (including organizational costs) |
$ | 225,406 | $ | 221,529 | $ | 614,255 | $ | 578,487 | ||||||||
| Asset management fees |
372,168 | 133,618 | 955,910 | 262,602 | ||||||||||||
| Property management fees |
320,228 | 116,117 | 860,029 | 220,376 | ||||||||||||
| Acquisition expenses |
148,349 | 917,466 | 1,472,591 | 1,412,748 | ||||||||||||
| Additional Paid-in Capital |
||||||||||||||||
| Selling commissions |
1,526,350 | 1,549,189 | 5,027,512 | 3,757,988 | ||||||||||||
| Dealer management fee |
654,150 | 663,938 | 2,154,648 | 1,610,566 | ||||||||||||
| Reimbursement of offering costs |
132,703 | 55,396 | 328,537 | 243,728 | ||||||||||||
| Total |
$ | 3,379,354 | $ | 3,657,253 | $ | 11,413,482 | $ | 8,086,495 | ||||||||
As of September 30, 2010 and December 31, 2009, we had amounts due to affiliates totaling $407,332 and $610,110, respectively.
Organizational and Offering Costs
Organizational and offering costs of the Offering may be paid by our Advisor on our behalf and will be reimbursed to our Advisor from the proceeds of the Offering. Organizational and offering costs consist of all expenses (other than sales commissions and the dealer manager fee) to be paid by us in connection with the Offering, including our legal, accounting, printing, mailing and filing fees, charges of our escrow holder and other accountable offering expenses, including, but not limited to, (i) amounts to reimburse our Advisor for all marketing related costs and expenses such as salaries and direct expenses of employees of our Advisor and its affiliates in connection with registering and marketing our shares; (ii) technology costs associated with the Offering; (iii) our costs of conducting our training and education meetings; (iv) our costs of attending retail seminars conducted by participating broker-dealers; and (v) payment or reimbursement of bona fide due diligence expenses. Our Advisor must reimburse us within 60 days after the end of the month which the Offering terminates to the extent we paid or reimbursed organization and offering costs (excluding sales commissions and dealer manager fees) in excess of 3.5% of the gross offering proceeds from the Primary Offering.
Advisory Agreement
We do not expect to have any employees. Our Advisor is primarily responsible for managing our business affairs and carrying out the directives of our board of directors. Our Advisor receives various fees and expenses under the terms of our Advisory Agreement. As discussed above, we are required under our Advisory Agreement to reimburse our Advisor for organization and offering costs; provided, however, our Advisor must reimburse us within 60 days after the end of the month in which the Offering terminates to the extent we paid or reimbursed organization and offering costs (excluding sales commissions and dealer manager fees) in excess of 3.5% of the gross offering proceeds from the Primary Offering. Our Advisory Agreement also requires our Advisor to reimburse us to the extent that offering expenses including sales commissions, dealer manager fees and organization and offering expenses are in excess of 15% of gross proceeds from the Offering. Our Advisor receives acquisition fees equal to 2.5% of the contract purchase price of each property we acquire plus reimbursement of any acquisition
24
Table of Contents
STRATEGIC STORAGE TRUST, INC. AND SUBSIDIARIES
NOTES TO CONSOLIDATED FINANCIAL STATEMENTS
September 30, 2010
expenses the Advisor incurs. Our Advisor also receives a monthly asset management fee for managing our assets equal to 0.0833% of the aggregate asset value, as defined, of our assets. The monthly asset management fees for our properties acquired through our September 24, 2009 mergers are equal to 2.0% of the gross revenues from the properties and are paid to affiliates of our Sponsor. Under our Advisory Agreement, our Advisor receives fees in an amount equal to up to one-half of the total real estate commission paid but in no event to exceed an amount equal to 3.0% of the contract sale price for each property we sell as long as our Advisor provides substantial assistance in connection with the sale. The total disposition fees paid (including fees paid to third parties) may not exceed the lesser of a competitive real estate commission or an amount equal to 6.0% of the contract sale price of the property. Our Advisor may also be entitled to various subordinated fees if we (1) list our shares of common stock on a national exchange, (2) terminate our Advisory Agreement, or (3) liquidate our portfolio. The advisors of REIT I and REIT II are entitled to various fees related to their properties if we (1) dispose of a property, (2) liquidate our portfolio, or (3) terminate their advisory agreement.
Our Advisory Agreement provides for reimbursement of our Advisor’s direct and indirect costs of providing administrative and management services to us. Commencing four fiscal quarters after the acquisition of our first real estate asset, our Advisor must pay or reimburse us the amount by which our aggregate annual operating expenses, as defined, exceed the greater of 2% of our average invested assets or 25% of our net income, as defined, unless a majority of our independent directors determine that such excess expenses were justified based on unusual and non-recurring factors. For any fiscal quarter for which total operating expenses for the 12 months then ended exceed the limitation, we will disclose this fact in our next quarterly report or within 60 days of the end of that quarter and send a written disclosure of this fact to our stockholders. In each case the disclosure will include an explanation of the factors that the independent directors considered in arriving at the conclusion that the excess expenses were justified. For the 12 months ended September 30, 2010, our aggregate annual operating expenses, as defined, did not exceed the thresholds described above.
Dealer Manager Agreement
Our Dealer Manager receives a sales commission of up to 7.0% of gross proceeds from sales in the Primary Offering and a dealer manager fee equal to up to 3.0% of gross proceeds from sales in the Primary Offering under the terms of our Dealer Manager Agreement. Our Dealer Manager has entered into participating dealer agreements with certain other broker-dealers which authorizes them to sell our shares. Upon sale of our shares by such broker-dealers, our Dealer Manager will re-allow all of the sales commissions paid in connection with sales made by these broker-dealers. Our Dealer Manager may also re-allow to these broker-dealers a portion of the 3.0% dealer manager fee as marketing fees, reimbursement of certain costs and expenses of attending training and education meetings sponsored by our Dealer Manager, payment of attendance fees required for employees of our Dealer Manager or other affiliates to attend retail seminars and public seminars sponsored by these broker-dealers, or to defray other distribution-related expenses. Our Dealer Manager also receives reimbursement of bona fide due diligence expenses up to 0.5% of the gross proceeds from sales in the Primary Offering.
Property Management Agreement
Our Property Manager receives a fee for its services in managing our properties, except for those properties acquired in the REIT I merger transaction, generally equal to 6.0% of the gross revenues from the properties plus reimbursement of the direct costs of managing the properties under our property management agreement. The properties acquired in the REIT I merger transaction were managed by an affiliate of our Sponsor and a portion of those property management fees were paid to a third party property manager. As a condition of the REIT II merger transaction, the monthly property management fees for properties acquired through the REIT II merger transaction have been waived until the FFO, as
25
Table of Contents
STRATEGIC STORAGE TRUST, INC. AND SUBSIDIARIES
NOTES TO CONSOLIDATED FINANCIAL STATEMENTS
September 30, 2010
defined in the merger agreement relating to the REIT II merger transaction, reaches $0.70 per share. In the event that our Property Manager assists with the development or redevelopment of a property, we may pay a separate market-based fee for such services.
Note 7. Commitments and Contingencies
Distribution Reinvestment Plan
We have adopted a distribution reinvestment plan that allows our stockholders to have distributions otherwise distributable to them invested in additional shares of our common stock. We have registered 10,000,000 shares of common stock for sale pursuant to the distribution reinvestment plan. The plan became effective on the effective date of our initial public offering. The purchase price per share is to be the higher of $9.50 per share or 95% of the fair market value of a share of our common stock. No sales commission or dealer manager fee will be paid on shares sold through the distribution reinvestment plan. We may amend or terminate the distribution reinvestment plan for any reason at any time upon 10 days’ prior written notice to stockholders. As of September 30, 2010, we have sold 660,721 shares through our distribution reinvestment plan.
Share Redemption Program
We have adopted a share redemption program that enables our stockholders to sell their stock to us in limited circumstances. As long as our common stock is not listed on a national securities exchange or over-the-counter market, our stockholders who have held their stock for at least one year may be able to have all or any portion of their shares of stock redeemed by us. We may redeem the shares of stock presented for redemption for cash to the extent that we have sufficient funds available to fund such redemption. The amount that we may pay to redeem stock is expected to be the redemption price set forth in the following table which is based upon the number of years the stock is held:
| Number Years Held |
Redemption Price | |
| Less than 1 | No Redemption Allowed | |
| 1 or more but less than 2 | 92.5% of purchase price | |
| 2 or more but less than 3 | 95.0% of purchase price | |
| 3 or more but less than 4 | 97.5% of purchase price | |
| 4 or more | 100.0% of purchase price |
The purchase price shall equal the amount paid for the shares until the price in the Primary Offering changes or a net asset value is calculated. The redemption price is subject to adjustment as determined from time to time by our board of directors. At no time will the redemption price exceed the price at which we are offering our common stock for sale.
See Note 2 for further discussion of redeemable common stock and our share redemption program.
Operating Partnership Redemption Rights
The limited partners of our Operating Partnership will have the right to cause our Operating Partnership to redeem their limited partnership units for cash equal to the value of an equivalent number of our shares, or, at our option, we may purchase their limited partnership units by issuing one share of our common stock for each limited partnership unit redeemed. These rights may not be exercised under certain circumstances which could cause us to lose our REIT election. Furthermore, limited partners may exercise their redemption rights only after their limited partnership units have been outstanding for one
26
Table of Contents
STRATEGIC STORAGE TRUST, INC. AND SUBSIDIARIES
NOTES TO CONSOLIDATED FINANCIAL STATEMENTS
September 30, 2010
year. Our Advisor is prohibited from exchanging or otherwise transferring its limited partnership units so long as it is acting as our Advisor pursuant to our Advisory Agreement.
Note 8. Declaration of Distributions
On September 17, 2010, our board of directors declared a distribution rate for the fourth quarter of 2010 of $0.00191781 per day per share on the outstanding shares of common stock (equivalent to an annual distribution rate of 7% assuming the share was purchased for $10) payable to stockholders of record of such shares as shown on our books at the close of business on each day during the period, commencing on October 1, 2010 and continuing on each day thereafter through and including December 31, 2010.
Note 9. Selected Quarterly Data
The following is a summary of quarterly financial information for the nine months ended September 30, 2010 and the years ended December, 31, 2009 and 2008, respectively:
| Three months ended | ||||||||||||
| March 31, 2010 | June 30, 2010 | September 30, 2010 | ||||||||||
| Total revenues |
$ | 5,150,232 | $ | 6,312,933 | $ | 6,937,875 | ||||||
| Total operating expenses |
$ | 6,154,441 | $ | 6,970,191 | $ | 7,354,126 | ||||||
| Net loss |
$ | (3,162,934 | ) | $ | (2,577,728 | ) | $ | (2,158,501 | ) | |||
| Net loss per share-basic and diluted |
$ | (0.18 | ) | $ | (0.13 | ) | $ | (0.09 | ) | |||
| Three months ended | ||||||||||||||||
| March 31, 2009(1) | June 30, 2009(1) | September 30, 2009(1) | December 31, 2009(1) | |||||||||||||
| Total revenues |
$ | 582,436 | $ | 822,520 | $ | 1,755,600 | $ | 4,714,587 | ||||||||
| Total operating expenses |
$ | 1,117,333 | $ | 1,462,534 | $ | 2,305,635 | $ | 5,269,041 | ||||||||
| Net loss |
$ | (1,271,480 | ) | $ | (1,841,945 | ) | $ | (1,993,751 | ) | $ | (2,297,343 | ) | ||||
| Net loss per share-basic and diluted |
$ | (0.49 | ) | $ | (0.43 | ) | $ | (0.29 | ) | $ | (0.14 | ) | ||||
| (1) | As discussed in Notes 3 and 4 in our Form 10-K for the year ended December 31, 2009, we completed our purchase price accounting for our 2009 acquisitions in the fourth quarter of 2009. Accounting guidance requires us to revise previously reported financial information as if the purchase accounting had been completed as of the acquisition date. Such revisions to operating expenses, related to increased depreciation and amortization expense, resulted in additional expenses of $45,004, $111,583 and $76,908 for the quarters ended March 31, June 30, and September 30, 2009, respectively. Net income was further revised, as interest expense was increased by $9,415, $14,316 and $21,651 for the quarters ended March 31, June 30, and September 30, 2009, respectively. |
27
Table of Contents
STRATEGIC STORAGE TRUST, INC. AND SUBSIDIARIES
NOTES TO CONSOLIDATED FINANCIAL STATEMENTS
September 30, 2010
| Three months ended | ||||||||||||||||
| March 31, 2008 | June 30, 2008 | September 30, 2008 | December 31, 2008 | |||||||||||||
| Total revenues |
$ | — | $ | — | $ | 22,075 | $ | 343,576 | ||||||||
| Total operating expenses |
$ | — | $ | 517,713 | $ | 325,844 | $ | 838,113 | ||||||||
| Net income (loss) |
$ | 32 | $ | (439,206 | ) | $ | (349,243 | ) | $ | (715,876 | ) | |||||
| Net income (loss) per share-basic and diluted |
$ | 0.32 | $ | (5.47 | ) | $ | (0.51 | ) | $ | (0.45 | ) | |||||
Note 10. Subsequent Events
Acquisitions
On October 22, 2010, we acquired a self storage facility located in Chicago, Illinois (95th Street), from an unaffiliated third party for a total purchase price of $6.3 million, plus closing costs and acquisition fees. We paid cash for the entire purchase price and paid our Advisor an acquisition fee of $157,500 in connection with this acquisition.
On October 22, 2010, we acquired a self storage facility located in Chicago, Illinois (Western Ave), from an unaffiliated third party for a total purchase price of $1.4 million, plus closing costs and acquisition fees. We paid cash for the entire purchase price and paid our Advisor an acquisition fee of $35,000 in connection with this acquisition.
On October 26, 2010, we acquired a self storage facility located in Chicago, Illinois (Ogden Ave), from an unaffiliated third party for a total purchase price of $4.0 million, plus closing costs and acquisition fees. We paid cash for the entire purchase price and paid our Advisor an acquisition fee of $100,000 in connection with this acquisition.
On October 29, 2010, we acquired a self storage facility located in Las Vegas, Nevada (Ann Rd.), from an unaffiliated third party for a total purchase price of $4.3 million, plus closing costs and acquisition fees. We paid cash for the entire purchase price and paid our Advisor an acquisition fee of $106,875 in connection with this acquisition.
On November 8, 2010, we increased our ownership percentage in one of our minority interest investments from 5.05% to 8.21% through a cash purchase from unaffiliated third parties for a total purchase price of $0.4 million. We paid our Advisor an acquisition fee of approximately $15,000 in connection with this acquisition.
Potential Acquisitions
We have entered into purchase and sale agreements for nine additional self storage facilities in three states and Canada. We expect to close each of these acquisitions in the fourth quarter of 2010 or the first quarter of 2011. We expect to fund such acquisitions with a combination of net proceeds from our initial public offering, debt proceeds from a group of loans previously obtained from The Prudential Insurance Company of America that are secured by a first priority mortgage or deed of trust on eleven of the properties in our existing portfolio and the assumption of existing loans on certain properties we expect to acquire. If we complete all of these acquisitions, we will wholly-own 48 self storage facilities located in 15 states (Alabama, Arizona, California, Florida, Georgia, Illinois, Kentucky, Mississippi, Nevada, New Jersey, Pennsylvania, South Carolina, Tennessee, Texas and Virginia) and Canada, comprising approximately 33,210 units and approximately 4,072,200 million rentable square feet.
28
Table of Contents
STRATEGIC STORAGE TRUST, INC. AND SUBSIDIARIES
NOTES TO CONSOLIDATED FINANCIAL STATEMENTS
September 30, 2010
The table below is an updated summary of our nine potential acquisitions:
| Property |
Date of Purchase and Sale Agreement |
Acquisition Price | Year Built/ Converted |
Approx. Units |
Approx. Rentable Sq. Ft. (net) |
|||||||||||||||
| El Paso – TX |
9/13/10 | $ | 1,250,000 | 2010 | 260 | (1) | 40,500 | (1) | ||||||||||||
| SF Bay Area – Morgan Hill – CA |
9/14/10 | 6,290,000 | 1997 | 490 | 61,000 | |||||||||||||||
| SF Bay Area – Vallejo – CA |
9/14/10 | 7,800,000 | 2001 | 860 | 75,000 | |||||||||||||||
| SF Bay Area – San Lorenzo – CA |
9/14/10 | 2,850,000 | 2000 | 640 | 62,000 | |||||||||||||||
| SF Bay Area – Gilroy – CA |
9/14/10 | 6,560,000 | 1999 | 600 | 63,500 | |||||||||||||||
| Chicago – Roosevelt Rd. – IL |
9/17/10 | 1,800,000 | 2004 | 445 | 41,000 | |||||||||||||||
| Toronto – Ontario – Canada |
10/8/10 | 14,150,000 | 1965/2008 | 1,060 | 110,000 | |||||||||||||||
| Hawthorne II – Hawthorne – CA |
11/8/2010 | 13,100,000 | 2004 | 770 | 87,000 | |||||||||||||||
| Long Beach – Long Beach – CA |
11/8/2010 | 12,900,000 | 1999 | 830 | 87,000 | |||||||||||||||
| Total |
$ | 66,700,000 | 5,955 | 627,000 | ||||||||||||||||
| (1) | Amount of units and square footage when construction is completed in December 2010. |
Offering Status
As of November 9, 2010, in connection with our Offering we have issued approximately 19.2 million shares of our common stock for gross proceeds of approximately $191.0 million.
29
Table of Contents
| ITEM 2. | MANAGEMENT’S DISCUSSION AND ANALYSIS OF FINANCIAL CONDITION AND RESULTS OF OPERATIONS |
The following Management’s Discussion and Analysis of Financial Condition and Result of Operations should be read in conjunction with our financial statements and notes thereto contained elsewhere in this report. The following Management’s Discussion and Analysis of Financial Condition and Result of Operations should also be read in conjunction with our financial statements and notes thereto and Management’s Discussion and Analysis of Financial Condition and Results of Operations included in our Form 10-K for the year ended December 31, 2009. See also “Cautionary Note Regarding Forward Looking Statements.”
Overview
We were formed on August 14, 2007 under the Maryland General Corporation Law for the purpose of engaging in the business of investing in self storage facilities and related self storage real estate investments. Our year end is December 31. As used in this report, “we,” “us” and “our” refer to Strategic Storage Trust, Inc.
We are currently offering a maximum of 110,000,000 shares of common stock to the public, consisting of 100,000,000 shares for sale to the public (our “Primary Offering”) and 10,000,000 shares for sale pursuant to our distribution reinvestment plan (collectively, our “Offering”). On May 22, 2008, we satisfied the minimum offering requirements of our Primary Offering and commenced formal operations. As of September 30, 2010, in connection with our Offering, we had issued approximately 18.2 million shares of our common stock for gross proceeds of approximately $181.8 million. In addition to the Offering, in September 2009 we also issued approximately 6.2 million shares in connection with the merger transaction with Self Storage REIT, Inc. (the “REIT I Merger Transaction”) and the merger transaction with Self Storage REIT II, Inc. (the “REIT II Merger Transaction”).
We have no paid employees and are externally advised and managed by Strategic Storage Advisor, LLC (our “Advisor”), an affiliate of ours. Strategic Capital Holdings, LLC is the sponsor of our Offering (our “Sponsor”). In addition to sponsoring our Offering, our Sponsor owns a majority of Strategic Storage Holdings, LLC, which is the sole member of our Advisor and Strategic Storage Property Management, LLC, our property manager (our “Property Manager”). Our operating partnership is Strategic Storage Operating Partnership, L.P. We own all of our self storage properties through our operating partnership or similar entities. We also conduct certain activities through our taxable REIT subsidiaries, which we wholly own.
As of September 30, 2009, we wholly-owned 24 self storage facilities located in 13 states (Alabama, Arizona, California, Florida, Georgia, Kentucky, Mississippi, Nevada, New Jersey, South Carolina, Tennessee, Texas and Virginia). As of September 30, 2010, we wholly-owned 35 self storage facilities, located in 14 states (Alabama, Arizona, California, Florida, Georgia, Kentucky, Mississippi, Nevada, New Jersey, Pennsylvania, South Carolina, Tennessee, Texas and Virginia), comprising approximately 24,525 units and approximately 3.0 million rentable square feet. These facilities had an average physical occupancy rate of 78.6% and contained an average of 37.1% climate controlled units as of September 30, 2010. We acquired nine of our wholly-owned facilities comprising approximately 6,860 units and approximately 681,950 rentable square feet in the nine months ended September 30, 2010.
30
Table of Contents
As of September 30, 2010, our self storage portfolio was comprised as follows:
| State |
No. of Properties |
Units | Sq. Ft. (net) |
|||||||||
| Alabama(1) |
2 | 1,075 | 144,500 | |||||||||
| Arizona |
4 | 1,970 | 242,850 | |||||||||
| California(1) |
1 | 1,300 | 251,700 | |||||||||
| Florida |
6 | 5,850 | 602,150 | |||||||||
| Georgia(1) |
2 | 1,170 | 128,500 | |||||||||
| Kentucky |
5 | 2,800 | 401,000 | |||||||||
| Mississippi |
1 | 600 | 66,600 | |||||||||
| Nevada |
2 | 710 | 87,100 | |||||||||
| New Jersey |
3 | 2,900 | 250,900 | |||||||||
| Pennsylvania |
2 | 1,290 | 155,200 | |||||||||
| South Carolina |
1 | 460 | 65,200 | |||||||||
| Tennessee |
1 | 800 | 100,400 | |||||||||
| Texas(1) |
4 | 3,100 | 479,500 | |||||||||
| Virginia |
1 | 500 | 49,900 | |||||||||
| Total |
35 | 24,525 | 3,025,500 | |||||||||
| (1) | Does not include any property where we own a minority interest, including the interests owned in the Montgomery County Self Storage, DST properties, the San Francisco Self Storage DST property, the Hawthorne property, the Self Storage I DST properties, the WP Baltimore Self Storage property and the Southwest Colonial, DST properties. |
| Property |
Acquisition Date |
Year Built | Approx. Units |
Approx. Sq. Ft. (net) |
Physical Occupancy (%)(1) |
% Climate Controlled(2) |
||||||||||||||||
| Biloxi – MS |
9/25/2008 | 1980/1984/1992 | 600 | 66,600 | 64.0 | % | 12.2 | % | ||||||||||||||
| Gulf Breeze – FL |
9/25/2008 | 1978/1982/2004 | 700 | 80,000 | 86.3 | % | 61.0 | % | ||||||||||||||
| Manassas – VA |
12/19/2008 | 1996/2000 | 500 | 49,900 | 86.5 | % | 51.0 | % | ||||||||||||||
| Walton – KY |
2/12/2009 | 1991 | 430 | 72,000 | 88.3 | % | 0.5 | % | ||||||||||||||
| Crescent Springs – KY |
2/12/2009 | 1999/2003 | 350 | 57,200 | 85.3 | % | 0.6 | % | ||||||||||||||
| Florence – KY |
2/12/2009 | 1996 | 520 | 81,800 | 94.3 | % | 6.8 | % | ||||||||||||||
| Alpharetta – GA |
6/1/2009 | 2003 | 670 | 76,500 | 75.0 | % | 59.0 | % | ||||||||||||||
| Marietta – GA |
6/1/2009 | 2006 | 500 | 52,000 | 81.1 | % | 100.0 | % | ||||||||||||||
| Erlanger – KY |
7/17/2009 | 1987 | 610 | 63,700 | 83.1 | % | 2.3 | % | ||||||||||||||
| Florence II – KY |
7/17/2009 | 1982/1995 | 890 | 126,300 | 77.0 | % | 0.3 | % | ||||||||||||||
| Jersey City – NJ |
8/21/2009 | 1985 | 1,090 | 91,500 | 68.5 | % | 0.0 | % | ||||||||||||||
| Montgomery – AL |
9/3/2009 | 1995/2004 | 600 | 94,600 | 76.2 | % | 22.2 | % | ||||||||||||||
| Phoenix – AZ |
9/4/2009 | 1974 | 520 | 38,750 | 53.5 | % | 83.2 | % | ||||||||||||||
| Seabrook – TX |
9/24/2009 | 2001-2003 | 680 | 78,000 | 85.9 | % | 51.6 | % | ||||||||||||||
| Greenville – SC |
9/24/2009 | 1948/1995 | 460 | 65,200 | 91.3 | % | 66.0 | % | ||||||||||||||
| Kemah – TX |
9/24/2009 | 1985/2005/1999/2002 | 1,300 | 239,000 | 87.2 | % | 19.4 | % | ||||||||||||||
| Tallahassee – FL |
9/24/2009 | 1979-1987 | 1,550 | 203,700 | 72.5 | % | 2.9 | % | ||||||||||||||
| Memphis – TN |
9/24/2009 | 1987/1994 | 800 | 100,400 | 82.9 | % | 0.0 | % | ||||||||||||||
| Houston – TX |
9/24/2009 | 1984/2005 | 480 | 73,300 | 75.4 | % | 38.6 | % | ||||||||||||||
31
Table of Contents
| Property |
Acquisition Date |
Year Built | Approx. Units |
Approx. Sq. Ft. (net) |
Physical Occupancy (%)(1) |
% Climate Controlled(2) |
||||||||||||||||
| Las Vegas – NV |
9/24/2009 | 2006 | 520 | 66,000 | 68.8 | % | 78.5 | % | ||||||||||||||
| Las Vegas II – NV |
9/24/2009 | 1998 | 190 | 21,100 | 69.9 | % | 33.2 | % | ||||||||||||||
| Pearland – TX |
9/24/2009 | 2004/2005 | 640 | 89,200 | 88.9 | % | 60.6 | % | ||||||||||||||
| Daphne – AL |
9/24/2009 | 2000 | 475 | 49,900 | 57.6 | % | 100.0 | % | ||||||||||||||
| Lake Forest – CA |
9/24/2009 | 2003 | 1,300 | 251,700 | 86.2 | % | 0.0 | % | ||||||||||||||
| Pittsburgh – PA |
12/11/2009 | 1990 | 470 | 55,200 | 74.0 | % | 15.2 | % | ||||||||||||||
| West Mifflin – PA |
12/11/2009 | 1983 | 820 | 100,000 | 68.5 | % | 20.2 | % | ||||||||||||||
| Fort Lee – NJ |
2/24/2010 | 2000 | 990 | 98,000 | 87.4 | % | 100.0 | % | ||||||||||||||
| Weston – FL |
2/24/2010 | 2005 | 650 | 52,000 | 93.9 | % | 100.0 | % | ||||||||||||||
| Gulf Breeze II – FL |
3/10/2010 | 2004/2005 | 290 | 39,750 | 73.6 | % | 72.9 | % | ||||||||||||||
| Mesa – AZ |
4/9/2010 | 2002 | 570 | 75,600 | 73.6 | % | 27.4 | % | ||||||||||||||
| Oakland Park – FL |
4/16/2010 | 1987 | 1,620 | 104,000 | 85.2 | % | 100.0 | % | ||||||||||||||
| Phoenix II – AZ |
5/6/2010 | 1974 | 440 | 73,000 | 69.6 | % | 0.0 | % | ||||||||||||||
| Tempe – AZ |
5/6/2010 | 1973 | 440 | 55,500 | 77.4 | % | 0.0 | % | ||||||||||||||
| Riverdale – NJ |
5/14/2010 | 2007 | 820 | 61,400 | 50.5 | % | 100.0 | % | ||||||||||||||
| Davie – FL |
7/14/2010 | 1988 | 1,040 | 122,700 | 72.1 | % | 100.0 | % | ||||||||||||||
| Total |
24,525 | 3,025,500 | 78.6 | % | 37.1 | % | ||||||||||||||||
| (1) | Represents occupied square feet divided by total rentable square feet as of September 30, 2010. |
| (2) | Represents the percentage of rental square feet in climate-controlled units as of September 30, 2010. |
The above physical occupancy includes acquisitions of lease-up properties, defined as properties that as of the acquisition date had physical occupancy of less than 60%; excluding those properties, the physical occupancy for the portfolio was 80.3% as of September 30, 2010.
The map below shows the geographic location of our self storage portfolio as of September 30, 2010.
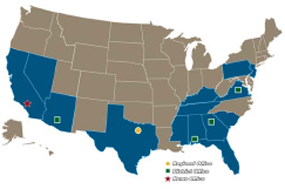
For the nine months ended September 30, 2010, the average monthly rent per occupied square foot for the 35 self storage facilities we owned on September 30, 2010 was $0.82. The weighted average capitalization rate at acquisition for the 35 self storage facilities we owned as of September 30, 2010 was approximately 7.96%. The weighted average capitalization rate is calculated as the estimated first year
32
Table of Contents
annual net operating income at the respective property divided by the property purchase price, exclusive of offering costs, closing costs and fees paid to the advisor. This calculation includes several properties in their lease-up period. Upon stabilization of these properties, we expect the weighted average capitalization rate to increase.
Also, as of September 30, 2010, through preferred equity and/or minority interests, we had interests in 19 additional self storage facilities, located in six states (Alabama, California, Georgia, Maryland, North Carolina and Texas), comprising approximately 11,550 units and approximately 1.4 million rentable square feet. These facilities had an average physical occupancy rate of 88.1% and contained an average of 18.9% climate controlled units as of September 30, 2010. Additionally, we have an interest in a net leased industrial property in California with 356,000 rentable square feet that is 100% physically occupied by a single tenant.
We derive revenues principally from rents received from our customers who rent units at our self storage facilities under month-to-month leases. Therefore, our operating results depend significantly on our ability to retain our existing customers and lease our available self storage units to new customers, while maintaining and, where possible, increasing the prices for our self storage units. Additionally, our operating results depend on our customers making their required rental payments to us. We believe that our Property Manager’s approach to the management and operation of our facilities, which emphasizes local market oversight and control, results in quick and effective response to changes in local market conditions, including increasing rents and/or increasing occupancy levels where appropriate.
Competition in the market areas in which we operate is significant and affects the occupancy levels, rental rates, rental revenues and operating expenses of our facilities. Development of any new self storage facilities would intensify competition of self storage operators in markets in which we operate.
We believe that we will experience minor seasonal fluctuations in the occupancy levels of our facilities, which we believe will be slightly higher over the summer months due to increased moving activity.
Critical Accounting Policies and Estimates
We have established accounting policies which conform to generally accepted accounting principles (“GAAP”). Preparing financial statements in conformity with GAAP requires management to use judgment in the application of accounting policies, including making estimates and assumptions. Following is a discussion of the estimates and assumptions used in setting accounting policies that we consider critical in the presentation of our financial statements. Many estimates and assumptions involved in the application of GAAP may have a material impact on our financial condition or operating performance, or on the comparability of such information to amounts reported for other periods, because of the subjectivity and judgment required to account for highly uncertain items or the susceptibility of such items to change. These estimates and assumptions affect our reported amounts of assets and liabilities, our disclosure of contingent assets and liabilities at the dates of the financial statements and our reported amounts of revenue and expenses during the period covered by this report. If management’s judgment or interpretation of the facts and circumstances relating to various transactions had been different, it is possible that different accounting policies would have been applied, or different amounts of assets, liabilities, revenues and expenses would have been recorded, thus resulting in a materially different presentation of the financial statements or materially different amounts being reported in the financial statements. Additionally, other companies may use different estimates and assumptions that may impact the comparability of our financial condition and results of operations to those companies. We believe that our critical accounting policies include the following: real estate purchase price allocations; the evaluation of whether any of our long-lived assets have been impaired; the determination of the useful
33
Table of Contents
lives of our long-lived assets; and the evaluation of the consolidation of our interests in joint ventures. The following discussion of these policies supplements, but does not supplant the description of our significant accounting policies, as contained in Note 2 of the Notes to the Consolidated Financial Statements included in this report, and is intended to present our analysis of the uncertainties involved in arriving upon and applying each policy.
Real Estate Purchase Price Allocation
We allocate the purchase prices of acquired properties based on a number of estimates and assumptions. We allocate the purchase prices to the tangible and intangible assets acquired and the liabilities assumed based on estimated fair values. These estimated fair values are based upon comparable market sales information for land and estimates of depreciated replacement cost of equipment, building and site improvements. Acquisitions of portfolios of properties are allocated to the individual properties based upon an income approach or a cash flow analysis using appropriate risk adjusted capitalization rates which we estimate based upon the relative size, age, and location of the individual property along with actual historical and estimated occupancy and rental rate levels, and other relevant factors. If available, and determined by management to be appropriate, appraised values are used, rather than these estimated values. Because we believe that substantially all of the leases in place at properties we will acquire will be at market rates, as the majority of the leases are month-to-month contracts, we do not expect to allocate any portion of the purchase prices to above or below market leases. The determination of market rates is also subject to a number of estimates and assumptions. Our allocations of purchase prices could result in a materially different presentation of the financial statements or materially different amounts being reported in the financial statements, as such allocations may vary dramatically based on the estimates and assumptions we use.
Impairment of Long-Lived Assets
The majority of our assets consist of long-lived real estate assets as well as intangible assets related to our acquisitions. We will continually evaluate such assets for impairment based on events and changes in circumstances that may arise in the future and that may impact the carrying amounts of our long-lived assets. When indicators of potential impairment are present, we will assess the recoverability of the particular asset by determining whether the carrying value of the asset will be recovered, through an evaluation of the undiscounted future operating cash flows expected from the use of the asset and its eventual disposition. This evaluation is based on a number of estimates and assumptions. Based on this evaluation, if the expected undiscounted future cash flows do not exceed the carrying value, we will adjust the value of the long-lived asset and recognize an impairment loss. Our evaluation of the impairment of long-lived assets could result in a materially different presentation of the financial statements or materially different amounts being reported in the financial statements, as the amount of impairment loss, if any, recognized may vary based on the estimates and assumptions we use.
Estimated Useful Lives of Long-Lived Assets
We assess the useful lives of the assets underlying our properties based upon a subjective determination of the period of future benefit for each asset. We will record depreciation expense with respect to these assets based upon the estimated useful lives we determine. Our determinations of the useful lives of the assets could result in a materially different presentation of the financial statements or materially different amounts being reported in the financial statements, as such determinations, and the corresponding amount of depreciation and amortization expense, may vary dramatically based on the estimates and assumptions we use.
34
Table of Contents
Consolidation of Investments in Joint Ventures
We evaluate the consolidation of our investments in joint ventures in accordance with relevant accounting guidance. This evaluation requires us to determine whether we have a controlling interest in a joint venture through a means other than voting rights, and, if so, such joint venture may be required to be consolidated in our financial statements. Our evaluation of our joint ventures under such accounting guidance could result in a materially different presentation of the financial statements or materially different amounts being reported in the financial statements, as the entities included in our financial statements may vary based on the estimates and assumptions we use.
REIT Qualification
We made an election under Section 856(c) of the Internal Revenue Code of 1986, as amended (the “Code”) to be taxed as a REIT commencing with the taxable year ended December 31, 2008. By qualifying as a REIT for federal income tax purposes, we generally will not be subject to federal income tax on income that we distribute to our stockholders. If we fail to qualify as a REIT in any taxable year, we will be subject to federal income tax on our taxable income at regular corporate rates and will not be permitted to qualify for treatment as a REIT for federal income tax purposes for four years following the year in which our qualification is denied. Such an event could materially and adversely affect our net income and could have a material adverse impact on our financial condition and results of operations. However, we believe that we are organized and will operate in a manner that will enable us to qualify for treatment as a REIT for federal income tax purposes commencing with the year ended December 31, 2008, and we intend to continue to operate as to remain qualified as a REIT for federal income tax purposes.
Results of Operations
Overview
As of September 30, 2009, we wholly-owned 24 self storage facilities located in 13 states (Alabama, Arizona, California, Florida, Georgia, Kentucky, Mississippi, Nevada, New Jersey, South Carolina, Tennessee, Texas and Virginia). As of September 30, 2010, we wholly-owned 35 self storage facilities, located in 14 states (Alabama, Arizona, California, Florida, Georgia, Kentucky, Mississippi, Nevada, New Jersey, Pennsylvania, South Carolina, Tennessee, Texas and Virginia), comprising approximately 24,525 units and approximately 3.0 million rentable square feet. As of September 30, 2010, through preferred equity and/or minority interests, we also had interests in 19 additional self storage facilities, located in six states (Alabama, California, Georgia, Maryland, North Carolina and Texas), comprising approximately 11,550 units and approximately 1.4 million rentable square feet. Additionally, we have an interest in a net leased industrial property in California with 356,000 rentable square feet that is leased to a single tenant. We acquired nine of our wholly-owned facilities comprising approximately 6,860 units and approximately 681,950 rentable square feet in the nine months ended September 30, 2010.
Our operating results for the three months ended September 30, 2009 include results for three months of operations for the eight self storage facilities that we owned as of July 1, 2009 and approximately one and a half months of operations for five facilities acquired during the three months ended September 30, 2009 as well as seven days for the eleven properties acquired through the Merger Transactions during the three months ended September 30, 2009. Our operating results for the three months ended September 30, 2010 include three months of operations for 34 self storage facilities that we owned as of July 1, 2010 and approximately two and a half months of operations for one facility acquired
35
Table of Contents
during the three months ended September 30, 2010; therefore, we believe there is little basis for comparison between the three months ended September 30, 2010 and 2009.
Our operating results for the nine months ended September 30, 2009 include results for the three self storage facilities that we owned as of January 1, 2009 and an additional 21 facilities that we owned for some portion thereof. Our operating results for the nine months ended September 30, 2010 include a full nine months of activity for 26 self storage facilities that we owned as of January 1, 2010 and an additional nine facilities that we owned for some portion thereof; therefore, we believe there is little basis for comparison between the nine months ended September 30, 2010 and 2009.
Below is a table intended to illustrate the growth in our facilities owned to provide additional context to the changes in revenues and expenses discussed below:
| 2009 | 2010 | Change | ||||||||||
| January 1, |
3 | 26 | 23 | |||||||||
| March 31, |
6 | 30 | 24 | |||||||||
| June 30, |
8 | 34 | 26 | |||||||||
| September 30, |
24 | 35 | 11 | (1) | ||||||||
| (1) | The growth in the three months ended September 30, 2009 compared to the three months ended September 30, 2010 is more significant than as indicated by the above table as eleven of the 24 properties in the September 30, 2009 amount were owned only for seven days in the 2009 period. |
Comparison of Operating Results for the Three Months Ended September 30, 2010 and 2009
Self Storage Rental Income
Rental income for the three months ended September 30, 2010, was approximately $6.8 million, as compared to rental income for the three months ended September 30, 2009 of approximately $1.7 million. The increase in rental income arises primarily from the increase in the number of properties owned. We expect rental income to increase in future periods as we derive rental income for an entire year for properties acquired during 2010 and as we acquire additional operating facilities.
Property Operating Expenses
Property operating expenses for the three months ended September 30, 2010 were approximately $3.5 million, as compared to property operating expenses for the three months ended September 30, 2009 of approximately $1.0 million. Property operating expenses include the costs to operate our facilities including payroll, utilities, insurance, real estate taxes, marketing, property management fees and asset management fees. The increase in property operating expenses arises primarily from the increase in the number of properties owned. For the three months ended September 30, 2010 and 2009, of total property operating expenses approximately $0.7 million and $0.2 million, respectively, were paid to affiliates. We expect property operating expenses to increase in future periods as we acquire additional operating facilities.
General and Administrative Expenses
General and administrative expenses for the three months ended September 30, 2010 were approximately $0.5 million, compared to approximately $0.4 million for the three months ended September 30, 2009. Such expenses consist primarily of legal expenses, accounting fees, directors’ and officers’ insurance expense, an allocation of a portion of our Advisor’s payroll related costs and board of
36
Table of Contents
directors’ related costs. The increase in general and administrative expenses relates to increases in certain of the previously mentioned costs which have increased commensurate with our growth. We expect general and administrative costs to increase in future periods as we make additional investments, but expect such expenses to decrease as a percentage of total revenues.
Depreciation and Amortization Expenses
Depreciation and amortization expenses for the three months ended September 30, 2010 were approximately $3.4 million compared to approximately $1.0 million for the three months ended September 30, 2009. Depreciation expense consists primarily of deprecation on the buildings and site improvements at our properties. Amortization expense consists of the amortization of intangible assets resulting from our acquisitions. The increase in depreciation and amortization arises primarily from the increase in the number of properties owned. We expect depreciation and amortization expenses to increase in future periods as we acquire additional operating facilities.
Interest Expense
Interest expense for the three months ended September 30, 2010 was approximately $1.5 million compared to approximately $0.3 million for the three months ended September 30, 2009 and relates to interest incurred on the promissory notes we have entered into and on the promissory notes related to the properties acquired in the Merger Transactions. Interest expense also includes the amortization of debt discounts. The increase therein between 2009 and 2010 is due to increased debt levels, primarily resulting from the REIT I Merger Transaction and REIT II Merger Transaction and as a result of entering into the Prudential Portfolio loan on August 25, 2010. We expect interest expense to increase in future periods if we acquire additional operating facilities through the issuance or assumption of promissory notes.
Property Acquisition Expenses
Property acquisition expenses for the three months ended September 30, 2010 were approximately $0.5 million compared to approximately $1.2 million for the three months ended September 30, 2009. The decrease between 2009 and 2010 is due to the number of acquisitions and mergers completed. In the three months ended September 30, 2009 we completed five acquisitions and the Merger Transactions, whereas in the three months ended September 30, 2010 we completed one acquisition. We expect that such costs will increase in future periods as we increase our acquisition activity.
Equity in Earnings of Real Estate Ventures
Equity in earnings of real estate ventures for the three months ended September 30, 2010 was approximately $0.2 million compared to approximately $14,000 for the three months ended September 30, 2009. The increase between 2009 and 2010 is due to investments acquired in the Merger Transactions and subsequent additional investments thereto.
Comparison of Operating Results for the Nine Months Ended September 30, 2010 and 2009
Self Storage Rental Income
Rental income for the nine months ended September 30, 2010, was approximately $18.0 million, as compared to rental income for the nine months ended September 30, 2009 of approximately $3.1 million. The increase in rental income arises primarily from the increase in the number of properties
37
Table of Contents
owned. We expect rental income to increase in future periods as we derive rental income for the entire year for properties acquired in 2010 and as we acquire additional operating facilities.
Property Operating Expenses
Property operating expenses for the nine months ended September 30, 2010 were approximately $9.1 million, as compared to property operating expenses for the nine months ended September 30, 2009 of approximately $1.8 million. Property operating expenses include the costs to operate our facilities including payroll, utilities, insurance, real estate taxes, marketing, property management fees and asset management fees. The increase in property operating expenses arises primarily from the increase in the number of properties owned. For the nine months ended September 30, 2010 and 2009, of total operating expenses approximately $1.8 million and $0.5 million, respectively, were paid to affiliates. We expect property operating expenses to increase in future periods as we acquire additional operating facilities.
General and Administrative Expenses
General and administrative expenses for the nine months ended September 30, 2010 were approximately $2.1 million, compared to approximately $1.3 million for the nine months ended September 30, 2009. Such expenses consist primarily of legal expenses, accounting fees, directors’ and officers’ insurance expense, an allocation of a portion of our Advisor’s payroll related costs and board of directors’ related costs. The increase in general and administrative expenses relates to approximately $0.2 million of legal expenses incurred over a dispute with a third party property manager, approximately $0.1 million of transition costs incurred to change transfer agents, approximately $0.1 million of increased proxy solicitation costs and the balance relates to increases in certain of the previously mentioned costs which have increased commensurate with our growth. We expect general and administrative costs to increase in future periods as we make additional investments, but expect such expenses to decrease as a percentage of total revenues.
Depreciation and Amortization Expenses
Depreciation and amortization expenses for the nine months ended September 30, 2010 were approximately $9.3 million compared to approximately $1.8 million for the nine months ended September 30, 2009. Depreciation expense consists primarily of deprecation on the buildings and site improvements at our properties. Amortization expense consists of the amortization of intangible assets resulting from our acquisitions. The increase in depreciation and amortization arises primarily from the increase in the number of properties owned. We expect depreciation and amortization expenses to increase in future periods as we acquire additional operating facilities.
Interest Expense
Interest expense for the nine months ended September 30, 2010 was approximately $4.1 million compared to approximately $0.6 million for the nine months ended September 30, 2009 and relates to interest incurred on the promissory notes we have entered into and on the promissory notes related to the properties acquired in the Merger Transactions. Interest expense also includes the amortization of debt discounts. The increase between 2009 and 2010 is due to increased debt levels, primarily resulting from the Merger Transactions and to a lesser extent the various other incremental promissory notes we have entered into. We expect interest expense to increase in future periods if we acquire additional operating facilities through the issuance or assumption of promissory notes.
38
Table of Contents
Property Acquisition Expenses
Property acquisition expenses for the nine months ended September 30, 2010 were approximately $2.4 million compared to approximately $2.7 million for the nine months ended September 30, 2009. The decrease between 2009 and 2010 is due to decreased acquisition and merger activity during the nine months ended September 30, 2010. We expect that such costs will increase in future periods as we increase our acquisition activity.
Equity in Earnings of Real Estate Ventures
Equity in earnings of real estate ventures for the nine months ended September 30, 2010 was approximately $0.7 million compared to $14,000 for the nine months ended September 30, 2009. The increase between 2009 and 2010 is due to investments acquired in the Merger Transactions and subsequent additional investments thereto.
Funds From Operations
We believe that funds from operations (“FFO”) provides relevant and meaningful information about our operating performance that is necessary, along with net income and cash flows, for an understanding of our operating results. Because FFO calculations exclude such factors as depreciation and amortization of real estate assets and gains from sales of operating real estate assets (which can vary among owners of identical assets in similar conditions based on historical cost accounting and useful life estimates), they facilitate comparisons of operating performance between periods and between other REITs. We believe that historical cost accounting for real estate assets in accordance with GAAP implicitly assumes that the value of real estate assets diminishes predictably over time. Since real estate values have historically risen or fallen with market conditions, many industry investors and analysts have considered the presentation of operating results for real estate companies that use historical cost accounting to be insufficient by themselves. As a result, we believe that the use of FFO, together with the required GAAP presentations, provides a more complete understanding of our performance relative to our competitors and a more informed and appropriate basis on which to make decisions involving operating, financing, and investing activities. Other REITs may not define FFO in accordance with the current National Association of Real Estate Investment Trusts (“NAREIT”) definition or may interpret the current NAREIT definition differently from us.
We believe that the FFO calculation can be further adjusted to provide a more beneficial indicator of performance and comparability, which we refer to as Modified Funds from Operations (“MFFO”). In calculating MFFO, FFO is adjusted for other non-cash items, such as acquisition fees and expenses, non cash interest expense, and other similar items.
FFO and MFFO are non-GAAP financial measures and do not represent net income as defined by GAAP. Net income as defined by GAAP is the most relevant measure in determining our operating performance because FFO and MFFO include adjustments that investors may deem substantive. Accordingly, FFO and MFFO should not be considered alternatives to net income as an indicator of our operating performance.
39
Table of Contents
Our calculation of FFO is presented in the following table for the three and nine months ended September 30, 2010 and 2009:
| Three Months Ended September 30, 2010 |
Three Months Ended September 30, 2009 |
Nine Months Ended September 30, 2010 |
Nine Months Ended September 30, 2009 |
|||||||||||||
| Net loss attributable to Strategic Storage Trust, Inc. |
$ | (2,158,501 | ) | $ | (1,993,751 | ) | $ | (7,899,163 | ) | $ | (5,107,174 | ) | ||||
| Add: |
||||||||||||||||
| Depreciation |
1,281,490 | 375,630 | 3,494,560 | 757,339 | ||||||||||||
| Amortization of intangible assets |
2,074,463 | 562,687 | 5,752,432 | 1,033,526 | ||||||||||||
| Deduct: |
||||||||||||||||
| Adjustment for noncontrolling interest – consolidated entity(1) |
(180,870 | ) | — | (556,428 | ) | — | ||||||||||
| FFO |
1,016,582 | (1,055,434 | ) | 791,401 | (3,316,309 | ) | ||||||||||
| Other Adjustments: |
||||||||||||||||
| Acquisition expenses(2) |
459,642 | 1,175,381 | 2,400,066 | 2,720,762 | ||||||||||||
| Deferred financing amortization expense |
70,339 | 24,219 | 176,505 | 122,885 | ||||||||||||
| Amortization of fair value debt discount |
81,307 | 21,651 | 196,046 | 45,382 | ||||||||||||
| Adjustment for noncontrolling interest – consolidated entity(1) |
(29,809 | ) | — | (29,809 | ) | — | ||||||||||
| Modified FFO |
$ | 1,598,061 | $ | 165,817 | $ | 3,534,209 | $ | (427,280 | ) | |||||||
| (1) | Relates to our consolidated joint venture. The noncontrolling interest holder’s share of our consolidated venture’s real estate depreciation, amortization of intangible assets and amortization of FMV debt discount was $52,704, $128,166 and $29,809, respectively, for the three months ended September 30, 2010 and $158,016, $398,412 and $29,809, respectively, for the nine months ended September 30, 2010. |
| (2) | In accordance with GAAP, as of January 1, 2009, acquisition related transaction costs are required to be expensed as incurred compared to the prior practice of capitalizing such costs and amortizing them over the estimated useful lives of the assets acquired. These costs have been and will continue to be funded with cash proceeds from our Primary Offering. |
Cash Flows
A comparison of cash flows for operating, investing and financing activities for the nine months ended September 30, 2010 and 2009 is as follows:
| Nine Months Ended | ||||||||||||
| September 30, 2010 | September 30, 2009 | Change | ||||||||||
| Net cash flow provided by (used in): |
||||||||||||
| Operating activities |
$ | 2,207,953 | $ | (1,809,216 | ) | $ | 4,017,169 | |||||
| Investing activities |
(52,478,926 | ) | (38,448,454 | ) | (14,030,472 | ) | ||||||
| Financing activities |
83,370,102 | 45,195,988 | 38,174,114 | |||||||||
40
Table of Contents
Cash flows provided by (used in) operating activities for the nine months ended September 30, 2010 and 2009 were approximately $2.2 million and ($1.8) million, respectively, a decrease in the use of cash of approximately $4.0 million, primarily as a result of the reduction in our net loss, as adjusted for noncash items in the current year.
Cash flows used in investing activities for the nine months ended September 30, 2010 and 2009 were approximately $52.5 million and $38.4 million, respectively, an increase in the use of cash of $14.1 million. The increase compared to the prior period primarily relates to the increased amount spent on acquisitions in the current year as compared with the prior year.
Cash flows provided by financing activities for the nine months ended September 30, 2010 and 2009 were approximately $83.4 million and $45.2 million, respectively, an increase of $38.2 million. The increase in cash provided by financing activities over the prior period primarily relates to an increase in proceeds from our ongoing public offering of shares of our common stock and proceeds from the issuance of secured promissory notes.
Liquidity and Capital Resources
Short-Term Liquidity and Capital Resources
We generally expect that we will meet our short-term operating liquidity requirements from the combination of proceeds of the Offering, net cash provided by property operations and advances from our Advisor which will be repaid, without interest, as funds are available after meeting our current liquidity requirements, subject to the limitations on reimbursement set forth in our advisory agreement with our Advisor (our “Advisory Agreement”). Per the Advisory Agreement, all advances from our Advisor shall be reimbursed no less frequently than monthly, although our Advisor has indicated that it may waive such a requirement on a month-by-month basis. The organizational and offering costs associated with the Offering will initially be paid by us or our Advisor. Our Advisor must reimburse us within 60 days after the end of the month in which the Offering terminates to the extent we paid or reimbursed organization and offering costs (excluding sales commissions and dealer manager fees) in excess of 3.5% of the gross offering proceeds from the Primary Offering. Our short-term operating liquidity is expected to increase as properties are added to our portfolio.
Distribution Policy and Distributions
Our board of directors will determine the amount and timing of distributions to our stockholders and will base such determination on a number of factors, including funds available for payment of distributions, financial condition, capital expenditure requirements and annual distribution requirements needed to maintain our status as a REIT under the Code. Distributions will be paid to our stockholders as of the record date selected by our board of directors. We declare and pay distributions monthly based on daily declaration and record dates so that investors may be entitled to distributions immediately upon purchasing our shares. We expect to continue to regularly pay distributions unless our results of operations, our general financial condition, general economic conditions, or other factors inhibit us from doing so. Distributions will be authorized at the discretion of our board of directors, which will be directed, in substantial part, by its obligation to cause us to comply with the REIT requirements of the Code. The funds we receive from operations that are available for distribution may be affected by a number of factors, including the following:
| • | the amount of time required for us to invest the funds received in the offering; |
| • | our operating and interest expenses; |
41
Table of Contents
| • | the amount of distributions or dividends received by us from our indirect real estate investments; |
| • | our ability to keep our properties occupied; |
| • | our ability to maintain or increase rental rates; |
| • | capital expenditures and reserves for such expenditures; |
| • | the issuance of additional shares; and |
| • | financings and refinancings |
The following data supplements, and should be read in conjunction with our prospectus dated October 28, 2009 and the section captioned “Description of Shares – Distribution Policy.”
| Three Months Ended | ||||||||||||||||||||
| September 30, 2010 |
June 30, 2010 |
March 31, 2010 |
December 31, 2009 |
September 30, 2009 |
||||||||||||||||
| Distributions paid in cash |
$ | 2,266,448 | $ | 2,003,364 | $ | 1,696,367 | $ | 1,305,798 | $ | 560,745 | ||||||||||
| Distributions reinvested |
1,661,398 | 1,463,181 | 1,234,525 | 929,160 | 445,046 | |||||||||||||||
| Total distributions |
$ | 3,927,846 | $ | 3,466,545 | $ | 2,930,892 | $ | 2,234,958 | $ | 1,005,791 | ||||||||||
| Source of distributions |
||||||||||||||||||||
| Cash flows provided by (used in) operations |
$ | 1,386,895 | $ | 940,956 | $ | (119,898 | ) | $ | (786,675 | ) | $ | (772,937 | ) | |||||||
| Proceeds from issuance of common stock |
2,540,951 | 2,525,589 | 3,050,790 | 3,021,633 | 1,778,728 | |||||||||||||||
| Total sources |
$ | 3,927,846 | $ | 3,466,545 | $ | 2,930,892 | $ | 2,234,958 | $ | 1,005,791 | ||||||||||
Cash flows provided by (used in) operations for the three months ended September 30, 2010, June 30, 2010, March 31, 2010, December 31, 2009 and September 30, 2009 include approximately $0.5 million, $0.8 million, $1.1 million, $0.6 million and $1.2 million, respectively, of real estate acquisition related expenses expensed in accordance with GAAP. We consider the real estate acquisition related expenses to have been funded by proceeds from our ongoing public offering of shares of our common stock because the expenses were incurred to acquire our real estate investments.
During our Offering, when we may raise capital more quickly than we acquire income-producing assets, and for some period after our Offering, we may not be able to pay distributions from our cash flows from operations, in which case distributions may be paid in part from debt financing or from proceeds from the issuance of common stock.
Over the long-term, we expect that a greater percentage of our distributions will be paid from cash flows from operations. However, our operating performance cannot be accurately predicted and may deteriorate in the future due to numerous factors, including our ability to raise and invest capital at favorable yields, the financial performance of our investments in the current real estate and financial environment and the types and mix of investments in our portfolio. As a result, future distributions declared and paid may exceed cash flow from operations.
Indebtedness
As of September 30, 2010, we had approximately $116.8 million of outstanding consolidated indebtedness (excluding net unamortized debt discounts of approximately $1.7 million). The weighted average interest rate on our consolidated fixed rate indebtedness as of September 30, 2010 was approximately 5.74%. As of September 30, 2010, approximately $5.0 million of our total consolidated indebtedness was variable rate debt.
42
Table of Contents
Long-Term Liquidity and Capital Resources
On a long-term basis, our principal demands for funds will be for property acquisitions, either directly or through equity interests, for the payment of operating expenses and distributions, and for the payment of interest on our outstanding indebtedness. Generally, cash needs for items, other than property acquisitions, will be met from operations and proceeds received from the Offering. However, there may be a delay between the sale of our shares and our purchase of properties that could result in a delay in the benefits to our stockholders, if any, of returns generated from our investment operations. Our Advisor will evaluate potential additional property acquisitions and engage in negotiations with sellers on our behalf. After a purchase contract is executed that contains specific terms, the property will not be purchased until the successful completion of due diligence, which includes, among other items, review of the title insurance commitment, an appraisal and an environmental analysis. In some instances, the proposed acquisition will require the negotiation of final binding agreements, which may include financing documents. During this period, we may decide to temporarily invest any unused proceeds from the Offering in certain investments that could yield lower returns than the properties. These lower returns may affect our ability to make distributions.
Potential future sources of capital include proceeds from the Offering, proceeds from secured or unsecured financings from banks or other lenders, proceeds from the sale of properties and undistributed funds from operations. If necessary, we may use financings or other sources of capital in the event of unforeseen significant capital expenditures. To the extent we are not able to secure additional financing in the form of a credit facility or other third party source of liquidity, we will be heavily dependent upon the proceeds of the Offering and income from operations in order to meet our long-term liquidity requirements and to fund our distributions.
Contractual Obligations
The following table summarizes our contractual obligations as of September 30, 2010:
| Payments due by period: | ||||||||||||||||||||
| Less than | After 5 Years |
|||||||||||||||||||
| Total | 1 Year | 1-3 Years | 3- 5 Years | |||||||||||||||||
| Mortgage interest |
$ | 42,768,825 | $ | 2,970,811 | $ | 13,145,142 | $ | 12,066,593 | $ | 14,586,279 | ||||||||||
| Mortgage principal |
116,796,595 | 256,365 | 9,764,284 | 9,691,625 | 97,084,321 | |||||||||||||||
| Total contractual obligations |
$ | 159,565,420 | $ | 3,227,176 | $ | 22,909,426 | $ | 21,758,218 | $ | 111,670,600 | ||||||||||
Subsequent Events
Acquisitions
On October 22, 2010, we acquired a self storage facility located in Chicago, Illinois (95th Street), from an unaffiliated third party for a total purchase price of $6.3 million, plus closing costs and acquisition fees. We paid cash for the entire purchase price and paid our Advisor an acquisition fee of $157,500 in connection with this acquisition.
On October 22, 2010, we acquired a self storage facility located in Chicago, Illinois (Western Ave), from an unaffiliated third party for a total purchase price of $1.4 million, plus closing costs and acquisition fees. We paid cash for the entire purchase price and paid our Advisor an acquisition fee of $35,000 in connection with this acquisition.
On October 26, 2010 we acquired a self storage facility located in Chicago, Illinois (Ogden Ave), from an unaffiliated third party for a total purchase price of $4.0 million, plus closing costs and
43
Table of Contents
acquisition fees. We paid cash for the entire purchase price and paid our Advisor an acquisition fee of $100,000 in connection with this acquisition.
On October 29, 2010, we acquired a self storage facility located in Las Vegas, Nevada (Ann Rd.), from an unaffiliated third party for a total purchase price of $4,3 million, plus closing costs and acquisition fees. We paid cash for the entire purchase price and paid our Advisor an acquisition fee of $106,875 in connection with this acquisition.
On November 8, 2010, we increased our ownership percentage in one of our minority interest investments from 5.05% to 8.21% through a cash purchase from unaffiliated third parties for a total purchase price of $0.4 million. We paid our Advisor an acquisition fee of approximately $15,000 in connection with this acquisition.
Potential Acquisitions
We have entered into purchase and sale agreements for nine additional self storage facilities in three states and Canada. We expect to close each of these acquisitions in the fourth quarter of 2010 or the first quarter of 2011. We expect to fund such acquisitions with a combination of net proceeds from our initial public offering, debt proceeds from a group of loans previously obtained from The Prudential Insurance Company of America that are secured by a first priority mortgage or deed of trust on eleven of the properties in our existing portfolio and the assumption of existing loans on certain properties we expect to acquire. If we complete all of these acquisitions, we will wholly-own 48 self storage facilities located in 15 states (Alabama, Arizona, California, Florida, Georgia, Illinois, Kentucky, Mississippi, Nevada, New Jersey, Pennsylvania, South Carolina, Tennessee, Texas and Virginia) and Canada, comprising approximately 33,210 units and approximately 4,072,200 million rentable square feet.
The table below is an updated summary of our nine potential acquisitions:
| Property |
Date of Purchase and Sale Agreement |
Acquisition Price | Year Built/ Converted |
Approx. Units |
Approx. Rentable Sq. Ft. (net) |
|||||||||||||||
| El Paso – TX |
9/13/10 | $ | 1,250,000 | 2010 | 260 | (1) | 40,500 | (1) | ||||||||||||
| SF Bay Area – Morgan Hill – CA |
9/14/10 | 6,290,000 | 1997 | 490 | 61,000 | |||||||||||||||
| SF Bay Area – Vallejo – CA |
9/14/10 | 7,800,000 | 2001 | 860 | 75,000 | |||||||||||||||
| SF Bay Area – San Lorenzo – CA |
9/14/10 | 2,850,000 | 2000 | 640 | 62,000 | |||||||||||||||
| SF Bay Area – Gilroy – CA |
9/14/10 | 6,560,000 | 1999 | 600 | 63,500 | |||||||||||||||
| Chicago – Roosevelt Rd. – IL |
9/17/10 | 1,800,000 | 2004 | 445 | 41,000 | |||||||||||||||
| Toronto – Ontario – Canada |
10/8/10 | 14,150,000 | 1965/2008 | 1,060 | 110,000 | |||||||||||||||
| Hawthorne II – Hawthorne – CA |
11/8/2010 | 13,100,000 | 2004 | 770 | 87,000 | |||||||||||||||
| Long Beach – Long Beach – CA |
11/8/2010 | 12,900,000 | 1999 | 830 | 87,000 | |||||||||||||||
| Total |
$ | 66,700,000 | 5,955 | 627,000 | ||||||||||||||||
| (1) | Amount of units and square footage when construction is completed in December 2010. |
Offering Status
As of November 9, 2010, in connection with our Offering we have issued approximately 19.2 million shares of our common stock for gross proceeds of approximately $191.0 million.
44
Table of Contents
| ITEM 3. | QUANTITATIVE AND QUALITATIVE DISCLOSURES ABOUT MARKET RISK |
Market risk includes risks that arise from changes in interest rates, foreign currency exchange rates, commodity prices, equity prices and other market changes that affect market sensitive instruments. In pursuing our business plan, we expect that the primary market risk to which we will be exposed is interest rate risk.
As of September 30, 2010, our debt consisted of approximately $111.8 million in fixed rate debt and approximately $5.0 million in variable rate debt. These instruments were entered into for other than trading purposes. Changes in interest rates have different impacts on the fixed and variable portions of our debt portfolio. A change in interest rates could impact the fixed portion of our debt portfolio only by impacting its fair value, but would have no impact on interest incurred or cash flows. A change in interest rates on the variable portion of our debt portfolio, which includes a note with an interest rate floor, could impact the interest incurred and cash flows and its fair value.
The following table summarizes future annual debt maturities, average interest rates and estimated fair values on our outstanding debt as of September 30, 2010:
| Year Ending December 31, | ||||||||||||||||||||||||||||||||
| 2010 | 2011 | 2012 | 2013 | 2014 | Thereafter | Total | Fair Value | |||||||||||||||||||||||||
| Fixed rate debt |
$ | 242,453 | $ | 1,027,230 | $ | 3,797,486 | $ | 1,404,411 | $ | 8,287,214 | $ | 97,084,321 | $ | 111,843,115 | $ | 111,955,448 | ||||||||||||||||
| Average interest rate |
5.74 | % | 5.74 | % | 5.75 | % | 5.75 | % | 5.81 | % | 6.08 | % | ||||||||||||||||||||
| Variable rate debt |
$ | 13,912 | $ | 57,084 | $ | 4,882,484 | $ | — | $ | — | $ | — | $ | 4,953,480 | $ | 4,953,480 | ||||||||||||||||
| Average interest rate |
6.50 | % | 6.50 | % | 6.50 | % | ||||||||||||||||||||||||||
In the future, we may be exposed to the effects of interest rate changes primarily as a result of borrowings used to maintain liquidity and fund acquisition, expansion, and financing of our real estate investment portfolio and operations. Our interest rate risk management objectives will be to limit the impact of interest rate changes on earnings and cash flows and to lower overall borrowing costs. To achieve our objectives, we may borrow at fixed rates or variable rates. We may also enter into derivative financial instruments such as interest rate swaps and caps in order to mitigate our interest rate risk on a related financial instrument. We will not enter into derivative or interest rate transactions for speculative purposes.
| ITEM 4. | CONTROLS AND PROCEDURES |
Disclosure Controls and Procedures
As of the end of the period covered by this report, management, including our chief executive officer and chief financial officer, evaluated the effectiveness of the design and operation of our disclosure controls and procedures. Based upon, and as of the date of, the evaluation, our chief executive officer and chief financial officer concluded that the disclosure controls and procedures were effective as of the end of the period covered by this report to ensure that information required to be disclosed in the reports we file and submit under the Exchange Act is recorded, processed, summarized and reported as and when required. Disclosure controls and procedures include, without limitation, controls and
45
Table of Contents
procedures designed to ensure that information required to be disclosed by us in the reports we file and submit under the Exchange Act is accumulated and communicated to our management, including our chief executive officer and our chief financial officer, as appropriate to allow timely decisions regarding required disclosure.
Internal Control Over Financial Reporting
There have been no changes in our internal control over financial reporting that occurred during the quarter ended September 30, 2010 that have materially affected, or are reasonably likely to materially affect, our internal control over financial reporting.
PART II. OTHER INFORMATION
| ITEM 1. | LEGAL PROCEEDINGS |
None.
| ITEM 1A. | RISK FACTORS |
There have been no material changes to the risk factors set forth in our Annual Report on Form 10-K for the year ended December 31, 2009.
| ITEM 2. | UNREGISTERED SALES OF EQUITY SECURITIES AND USE OF PROCEEDS |
| (a) | None. |
| (b) | We registered 110,000,000 shares of our common stock in the Offering (SEC File No. 333-146959, effective March 17, 2008), of which we registered 100,000,000 shares at $10.00 per share to be offered to the public in the Primary Offering and 10,000,000 shares offered to our investors pursuant to our distribution reinvestment plan at $9.50 per share. As of September 30, 2010, we had issued approximately 18.2 million shares of common stock in our Offering, raising gross offering proceeds of approximately $181.8 million. From this amount, we paid approximately $3.1 million in acquisition fees to our Advisor, approximately $17.4 million in selling commissions and dealer manager fees to our Dealer Manager (of which approximately $13.9 million was reallowed to third-party broker dealers), and approximately $3.3 million in organization and offering costs to our Advisor. With the net offering proceeds, we acquired (exclusive of the REIT I Merger Transaction, REIT II Merger Transaction and any debt financing) approximately $110.5 million in self storage facilities and made the other payments reflected under “Cash Flows from Financing Activities” in our consolidated statements of cash flows. |
| (c) | As noted in Notes 2 and 7 to the consolidated financial statements included in this report, and more fully described in our prospectus dated October 28, 2009, as supplemented from time to time, our board of directors adopted a share redemption program on February 25, 2008, which enables our stockholders to have their shares redeemed by us, subject to the significant conditions and limitations described in our prospectus. Our share redemption program has no set termination date, but our ability to redeem shares under the program is limited as described in the prospectus. Prior to September 30, 2010, we honored all redemption requests that complied with the applicable requirements of our share redemption program set forth in our prospectus. During the nine months ended September 30, 2010 we redeemed 253,712 shares for approximately $2.4 million. As of September 30, 2010, there were approximately 128,000 shares related to redemption requests to be processed subsequent to September 30, 2010. The redemption of these |
46
Table of Contents
| shares will total approximately $1.2 million and was reclassified from redeemable common stock to accounts payable and accrued liabilities in the consolidated balance sheets as of September 30, 2010. There was an additional approximately 127,000 shares that were requested to be redeemed but could not be as we had reached our annual maximum redemption amount under our share redemption program. Pursuant to the share redemption program, when qualifying requests exceed the then remaining amount available to be redeemed all such pending requests are redeemed on a pro rata basis. The aforementioned shares not redeemed, as well any additional qualifying requests received in 2010, will be treated as requests for redemption in the first quarter of 2011. Our board of directors may choose to amend, suspend or terminate our share redemption program upon 30 days’ written notice at any time. |
During the three months ended September 30, 2010, we redeemed shares as follows:
| Month Ended |
Total Number of Shares Redeemed |
Average Price Paid Per Share |
Total Number of Shares Redeemed as Part of Publicly Announced Plans or Programs |
|||||||||
| July 31, 2010 |
138,713 | $ | 9.52 | 138,713 | ||||||||
| August 31, 2010 |
— | — | — | |||||||||
| September 30, 2010 |
— | — | — | |||||||||
| 138,713 | 138,713 | |||||||||||
| ITEM 3. | DEFAULTS UPON SENIOR SECURITIES |
None.
| ITEM 4. | (REMOVED AND RESERVED) |
| ITEM 5. | OTHER INFORMATION |
| (a) | During the third quarter 2010, there was no information required to be disclosed in a report on Form 8-K which was not disclosed in a report on Form 8-K. |
| (b) | Not applicable. |
| ITEM 6. | EXHIBITS |
The exhibits required to be filed with this report are set forth on the Exhibit Index hereto and incorporated by reference herein.
47
Table of Contents
EXHIBIT INDEX
The following exhibits are included in this report on Form 10-Q for the period ended September 30, 2010 (and are numbered in accordance with Item 601 of Regulation S-K).
| Exhibit No. |
Description | |
| 3.1* | Articles of Amendment and Restatement of Strategic Storage Trust, Inc., incorporated by reference to Exhibit 3.1 to Post-Effective Amendment No. 1 to the Company’s Registration Statement on Form S-11, filed on April 29, 2008, Commission File No. 333-146959 | |
| 3.2* | Bylaws of Strategic Storage Trust, Inc., incorporated by reference to Exhibit 3.2 to Pre-Effective Amendment No. 3 to the Company’s Registration Statement on Form S-11, filed on March 7, 2008, Commission File No. 333-146959 | |
| 4.1* | Form of Subscription Agreement and Subscription Agreement Signature Page, incorporated by reference to Exhibit 4.1 to the Company’s Form 10-K for the year ended December 31, 2009, filed on March 30, 2010, Commission File No. 000-53644 | |
| 10.1* | Collateral Loan Agreement by and among The Prudential Life Insurance Company of America and Eleven Special-Purpose Entities dated August 25, 2010, incorporated by reference to Exhibit 10.1 to the Company’s Form 8-K, filed on August 31, 2010, Commission File No. 000-53644 | |
| 10.2* | Form of Promissory Note, incorporated by reference to Exhibit 10.2 to the Company’s Form 8-K, filed on August 31, 2010, Commission File No. 000-53644 | |
| 10.3* | Form of Mortgage or Deed of Trust and Security Agreement, incorporated by reference to Exhibit 10.3 to the Company’s Form 8-K, filed on August 31, 2010, Commission File No. 000-53644 | |
| 10.4* | Form of Assignment of Leases and Rents, incorporated by reference to Exhibit 10.4 to the Company’s Form 8-K, filed on August 31, 2010, Commission File No. 000-53644 | |
| 10.5* | Form of Supplemental Guaranty, incorporated by reference to Exhibit 10.5 to the Company’s Form 8-K, filed on August 31, 2010, Commission File No. 000-53644 | |
| 10.6* | Form of Recourse Liabilities Guaranty, incorporated by reference to Exhibit 10.6 to the Company’s Form 8-K, filed on August 31, 2010, Commission File No. 000-53644 | |
| 10.7* | Purchase and Sale Agreement for the SF Bay Area-Morgan Hill Property, incorporated by reference to Exhibit 10.37 to Post-Effective Amendment No. 9 to the Company’s Registration Statement on Form S-11, filed on October 14, 2010, Commission File No. 333-146959 | |
| 10.8* | Purchase and Sale Agreement for the SF Bay Area-Vallejo Property, incorporated by reference to Exhibit 10.38 to Post-Effective Amendment No. 9 to the Company’s Registration Statement on Form S-11, filed on October 14, 2010, Commission File No. 333-146959 | |
| 10.9* | Purchase and Sale Agreement for the SF Bay Area-San Lorenzo Property, incorporated by reference to Exhibit 10.39 to Post-Effective Amendment No. 9 to the Company’s Registration Statement on Form S-11, filed on October 14, 2010, Commission File No. 333-146959 | |
| 10.10* | Purchase and Sale Agreement for the SF Bay Area-Gilroy Property, incorporated by reference to Exhibit 10.40 to Post-Effective Amendment No. 9 to the Company’s Registration Statement on Form S-11, filed on October 14, 2010, Commission File No. 333-146959 | |
| 10.11* | Standard Offer, Agreement and Escrow Instructions for Purchase of Real Estate dated November 8, 2010 for Hawthorne II Property and Long Beach Property, incorporated by reference to Exhibit 10.1 to the Company’s Form 8-K, filed on November 12, 2010, Commission File No. 000-53644 | |
| 10.12* | Addendum to Standard Offer, Agreement and Escrow Instructions for Purchase of Real Estate dated November 8, 2010 for Hawthorne II Property and Long Beach Property, incorporated by reference to Exhibit 10.1 to the Company’s Form 8-K, filed on November 12, 2010, Commission File No. 000-53644 | |
48
Table of Contents
| 31.1 | Certification of Principal Executive Officer, pursuant to Section 302 of the Sarbanes-Oxley Act of 2002 | |
| 31.2 | Certification of Principal Financial Officer, pursuant to Section 302 of the Sarbanes-Oxley Act of 2002 | |
| 32.1 | Certification of Principal Executive Officer, pursuant to 18 U.S.C. Section 1350, as created by Section 906 of the Sarbanes-Oxley Act of 2002 | |
| 32.2 | Certification of Principal Financial Officer, pursuant to 18 U.S.C. Section 1350, as created by Section 906 of the Sarbanes-Oxley Act of 2002 | |
| * | Previously filed and incorporated herein by reference. |
49
Table of Contents
SIGNATURES
Pursuant to the requirements of the Securities Exchange Act of 1934, the Registrant has duly caused this report to be signed on its behalf by the undersigned thereunto duly authorized.
| STRATEGIC STORAGE TRUST, INC. (Registrant) | ||||
| Dated: November 12, 2010 | By: | /s/ Michael S. McClure | ||
| Michael S. McClure Chief Financial Officer and Treasurer | ||||