Attached files
| file | filename |
|---|---|
| 8-K - 8-K - CLOUD PEAK ENERGY INC. | a14-12117_28k.htm |
Exhibit 99.1
|
|
ANNUAL STOCKHOLDERS MEETING May 14, 2014 |
|
|
1 Cautionary Note Regarding Forward-Looking Statements This presentation contains “forward-looking statements” within the meaning of the safe harbor provisions of Section 27A of the Securities Act of 1933 and Section 21E of the Securities Exchange Act of 1934. Forward-looking statements are not statements of historical facts, and often contain words such as “may,” “will,” “expect,” “believe,” “anticipate,” “plan,” “estimate,” “seek,” “could,” “should,” “intend,” “potential,” or words of similar meaning. Forward-looking statements are based on management’s current expectations, beliefs, assumptions and estimates regarding our company, industry, economic conditions, government regulations, energy policies and other factors. These statements are subject to significant risks, uncertainties and assumptions that are difficult to predict and could cause actual results to differ materially and adversely from those expressed or implied in the forward-looking statements. For a description of some of the risks and uncertainties that may adversely affect our future results, refer to the risk factors described from time to time in the reports and registration statements we file with the Securities and Exchange Commission, including those in Item 1A "Risk Factors" of our most recent Form 10-K and any updates thereto in our Forms 10-Q and current reports on Forms 8-K. There may be other risks and uncertainties that are not currently known to us or that we currently believe are not material. We make forward-looking statements based on currently available information, and we assume no obligation to, and expressly disclaim any obligation to, update or revise publicly any forward-looking statements made in our presentation, whether as a result of new information, future events or otherwise, except as required by law. |
|
|
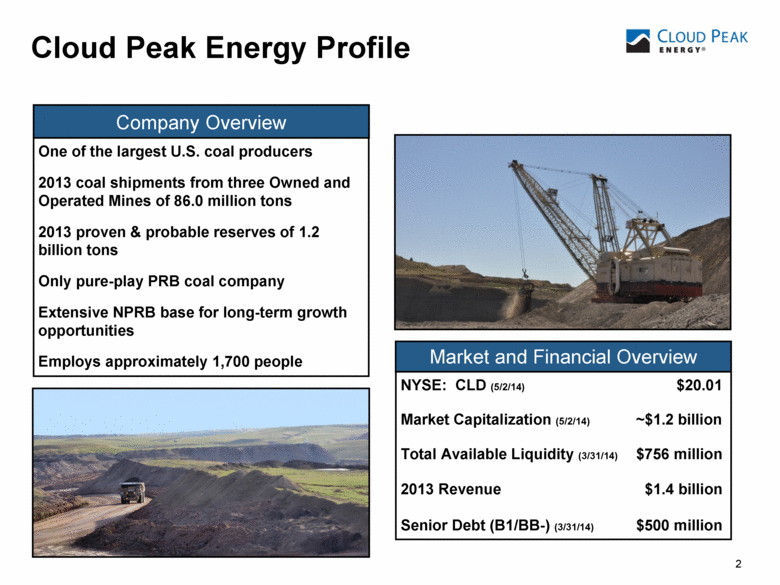
2 2 2 Cloud Peak Energy Profile One of the largest U.S. coal producers 2013 coal shipments from three Owned and Operated Mines of 86.0 million tons 2013 proven & probable reserves of 1.2 billion tons Only pure-play PRB coal company Extensive NPRB base for long-term growth opportunities Employs approximately 1,700 people NYSE: CLD (5/2/14) $20.01 Market Capitalization (5/2/14) ~$1.2 billion Total Available Liquidity (3/31/14) $756 million 2013 Revenue $1.4 billion Senior Debt (B1/BB-) (3/31/14) $500 million Market and Financial Overview Company Overview |
|
|
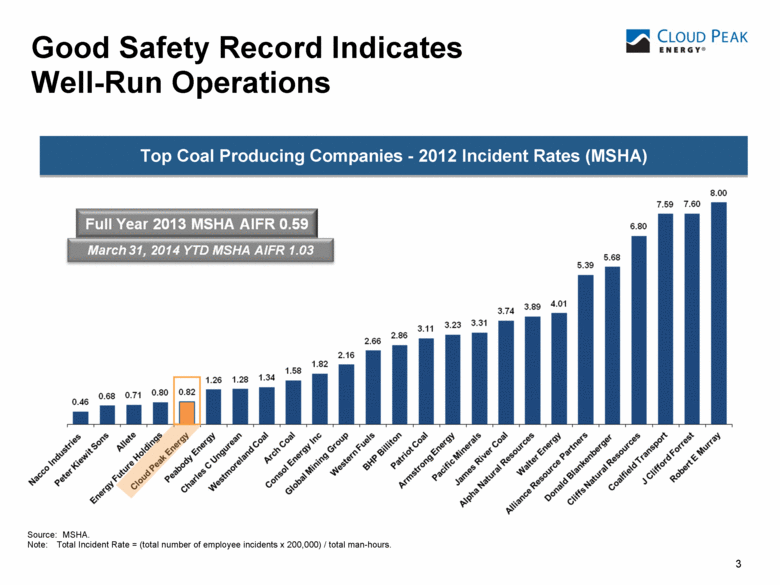
3 3 3 3 Top Coal Producing Companies - 2012 Incident Rates (MSHA) Source: MSHA. Note: Total Incident Rate = (total number of employee incidents x 200,000) / total man-hours. Good Safety Record Indicates Well-Run Operations |
|
|
Extensive Coal Reserves and Significant Projects 4 Spring Creek Mine – MT 2013 Tons Sold 18.0M tons 2013 Proven & Probable Reserves 279M tons Average Reserve Coal Quality 9,350 Btu/lb Average lbs SO2 0.73/mmBtu Cordero Rojo Mine – WY 2013 Tons Sold 36.7M tons 2013 Proven & Probable Reserves 290M tons Average Reserve Coal Quality 8,425 Btu/lb Average lbs SO2 0.69/mmBtu Antelope Mine – WY 2013 Tons Sold 31.4M tons 2013 Proven & Probable Reserves 617M tons Average Reserve Coal Quality 8,875 Btu/lb Average lbs SO2 0.52/mmBtu 4 2013 Proven & Probable Reserves 1.2B Tons Antelope Mine 9M tons Cordero Rojo Mine 163M tons Spring Creek Mine 6M tons Youngs Creek Project 287M tons 465M tons 2013 Non-Reserve Coal Deposits 0.5B Tons Source: SNL Energy (1) Represents a current estimate of physical in-place coal tons. Does not represent proven and probable reserves, non-reserve coal deposits or a forecast of tons to be produced and sold in the future. Future production and sales of such tons, if any, are subject to exercise of options and significant risk and uncertainty. Crow Project (1) (subject to exercise of options) 1,380M tons Additional Coal 1.4B Tons |
|
|
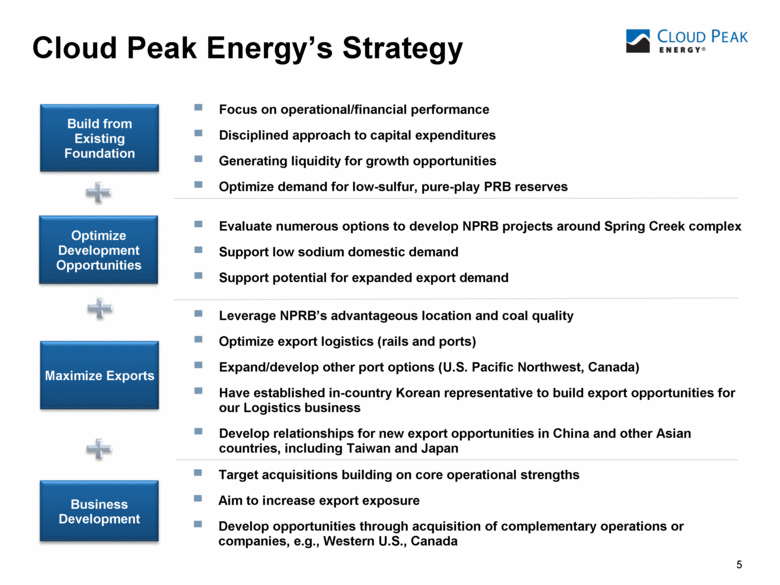
5 Cloud Peak Energy’s Strategy Focus on operational/financial performance Disciplined approach to capital expenditures Generating liquidity for growth opportunities Optimize demand for low-sulfur, pure-play PRB reserves Build from Existing Foundation Optimize Development Opportunities Business Development Evaluate numerous options to develop NPRB projects around Spring Creek complex Support low sodium domestic demand Support potential for expanded export demand Target acquisitions building on core operational strengths Aim to increase export exposure Develop opportunities through acquisition of complementary operations or companies, e.g., Western U.S., Canada Maximize Exports Leverage NPRB’s advantageous location and coal quality Optimize export logistics (rails and ports) Expand/develop other port options (U.S. Pacific Northwest, Canada) Have established in-country Korean representative to build export opportunities for our Logistics business Develop relationships for new export opportunities in China and other Asian countries, including Taiwan and Japan |
|
|
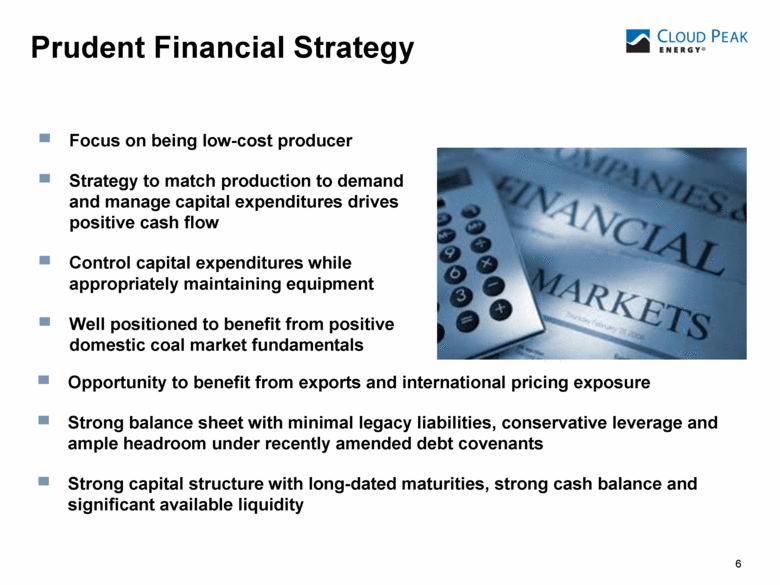
6 Prudent Financial Strategy 6 6 (1) Focus on being low-cost producer Strategy to match production to demand and manage capital expenditures drives positive cash flow Control capital expenditures while appropriately maintaining equipment Well positioned to benefit from positive domestic coal market fundamentals Opportunity to benefit from exports and international pricing exposure Strong balance sheet with minimal legacy liabilities, conservative leverage and ample headroom under recently amended debt covenants Strong capital structure with long-dated maturities, strong cash balance and significant available liquidity |
|
|
CONFIDENTIAL Recent Refinancings 7 Revolving Credit Facility $500M Extended maturity from 2016 to 2019 Relaxed covenants and increased total available liquidity Repaid $100M of Bond Debt Tender offer to buy $300M 2017, 8.25% Bonds Repaid with 1) $200M 2024, 6.375% new Bonds 2) $100M cash from balance sheet Redemption of 2017 Bonds required early tender premium of $14M Reduced annualized cash interest cost by approximately $12M per year Extended maturity to 2024, delevers balance sheet, supports credit rating |
|
|
8 Domestic Strategy Consistent Forward Selling Strategy Focus on Matching Production to Market Demand Optimize Operational Focus on Cost Control and Improvement Programs Disciplined Capital Expenditures and Significant Reserve Base |
|
|
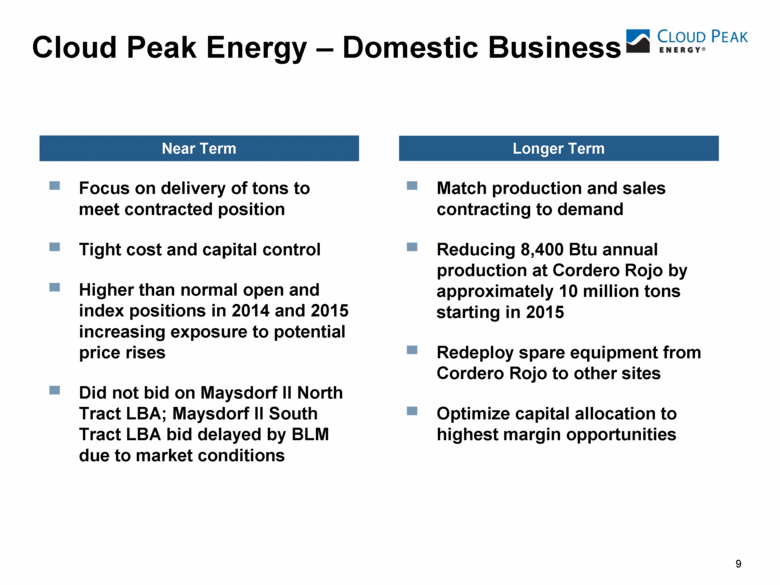
9 9 9 (1) Focus on delivery of tons to meet contracted position Tight cost and capital control Higher than normal open and index positions in 2014 and 2015 increasing exposure to potential price rises Did not bid on Maysdorf II North Tract LBA; Maysdorf II South Tract LBA bid delayed by BLM due to market conditions Cloud Peak Energy – Domestic Business Match production and sales contracting to demand Reducing 8,400 Btu annual production at Cordero Rojo by approximately 10 million tons starting in 2015 Redeploy spare equipment from Cordero Rojo to other sites Optimize capital allocation to highest margin opportunities Near Term Longer Term |
|
|
10 PRB – Favorable Domestic Demand vs. Other Basins CAPP coal production declining High operating costs Difficult regulatory environment Not economical for many customers relative to natural gas Cloud Peak Energy’s strategy: Match production to market demand in order to maximize cash generation Source: Company estimates and industry sources PRB, ILB and natural gas are replacing CAPP production PRB coal has low sulfur and lower Btu ILB has higher Btu and higher sulfur 2007 2012 2020E Domestic Thermal Consumption Total 950Mt PRB 427Mt Total 827Mt PRB 413Mt Total 775Mt PRB 418Mt |
|
|
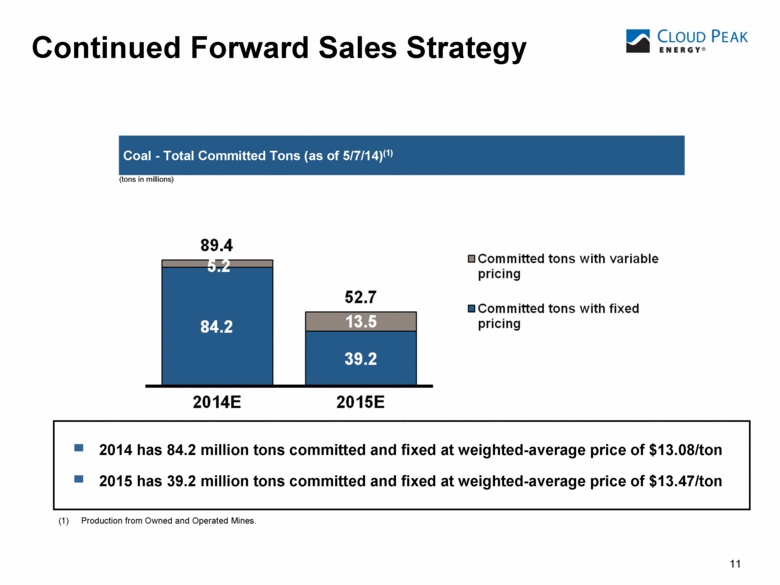
11 Continued Forward Sales Strategy (tons in millions) (1) Production from Owned and Operated Mines. 2014 has 84.2 million tons committed and fixed at weighted-average price of $13.08/ton 2015 has 39.2 million tons committed and fixed at weighted-average price of $13.47/ton Coal - Total Committed Tons (as of 5/7/14)(1) |
|
|
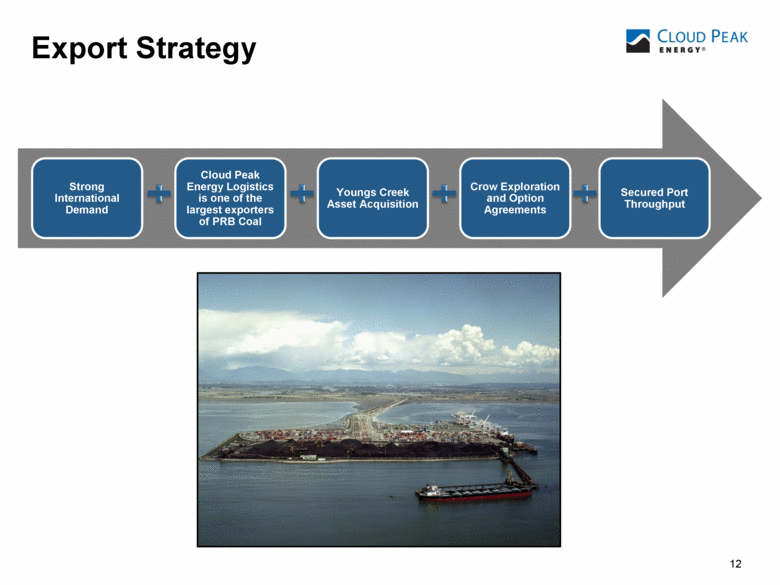
12 Export Strategy Strong International Demand Cloud Peak Energy Logistics is one of the largest exporters of PRB Coal Youngs Creek Asset Acquisition Crow Exploration and Option Agreements Secured Port Throughput |
|
|
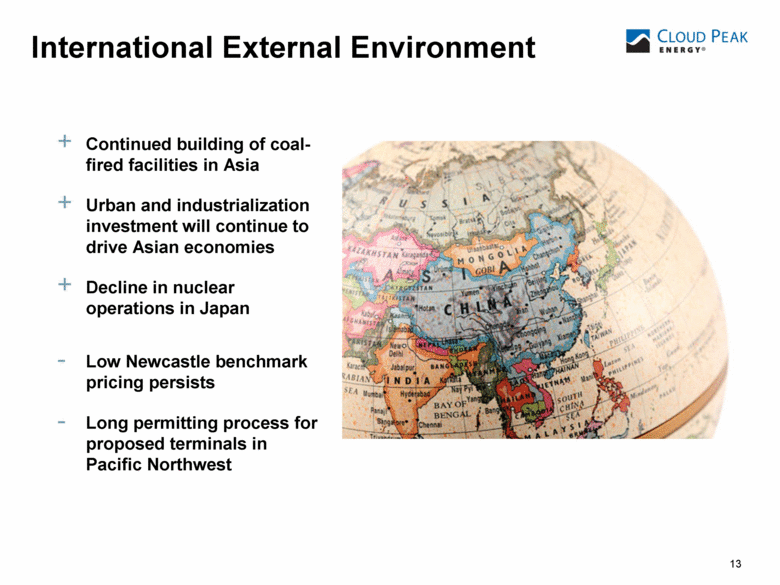
13 International External Environment 13 13 (1) Continued building of coal-fired facilities in Asia Urban and industrialization investment will continue to drive Asian economies Decline in nuclear operations in Japan Low Newcastle benchmark pricing persists Long permitting process for proposed terminals in Pacific Northwest |
|
|
14 Increasing International Demand Requires PRB Exports China Japan South Korea Taiwan India Australia Indonesia Asian utilities seeking diversity and surety of long-term supply In 2013, Cloud Peak Energy’s logistics business was the largest U.S. exporter of thermal coal into South Korea Growing customer base with sales to Taiwan and Japan Thermal Exports Total 27Mt PRB 8Mt Total 56Mt PRB 11Mt Total 150Mt PRB 75Mt 2007 2012 2020E Source: EIA and internal estimates |
|
|
15 External Environment - International 15 15 (1) (1) Positive Trends: Strong demand growth for coal imports in Asia (including China, India, Japan, Taiwan, Korea and Vietnam) should balance/overcome supply creating price support Large greenfield coal mine projects in Australia and elsewhere are being cancelled or postponed and are not economic without a significant increase in prices Existing Canadian export terminals are moving ahead with capacity expansions Headwinds: Increase in Australian and Indonesian supply from existing mines and recently commissioned mines that were developed under higher market prices Newcastle benchmark pricing has been in a trough since mid-2013 The permitting process for proposed coal export terminals in the U.S. Pacific Northwest is being politicized, creating delays Strong US$ |
|
|
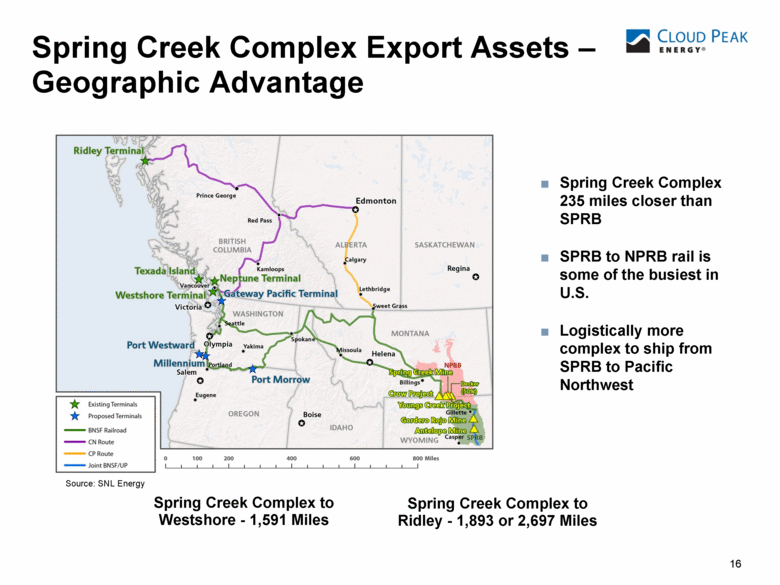
16 Spring Creek Complex Export Assets – Geographic Advantage Spring Creek Complex to Ridley - 1,893 or 2,697 Miles Spring Creek Complex to Westshore - 1,591 Miles Spring Creek Complex 235 miles closer than SPRB SPRB to NPRB rail is some of the busiest in U.S. Logistically more complex to ship from SPRB to Pacific Northwest Source: SNL Energy |
|
|
Spring Creek Complex – Export Quality Advantage 17 Demand for subbituminous coal is growing in international markets Indonesian coal (primary market competitor) is declining in quality Northern PRB (Spring Creek and Youngs Creek) coal: Coal quality ~9,200 – 9,350 Btu Converts to ~4,770 – 4,850 Kcal/kg NAR Spring Creek is a premium subbituminous coal in the international market 17 4770-4850 4544 Average Source: Company estimates Premium Subbituminous Product |
|
|
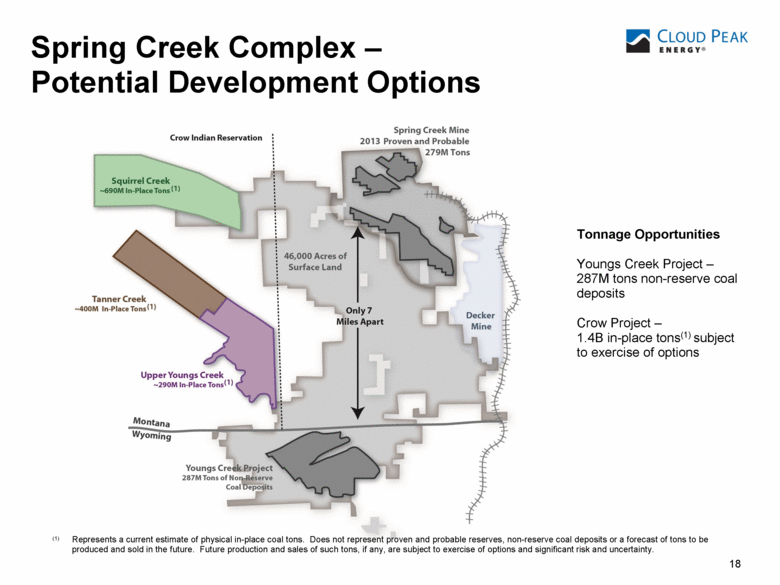
18 Spring Creek Complex – Potential Development Options (1) Represents a current estimate of physical in-place coal tons. Does not represent proven and probable reserves, non-reserve coal deposits or a forecast of tons to be produced and sold in the future. Future production and sales of such tons, if any, are subject to exercise of options and significant risk and uncertainty. Tonnage Opportunities Youngs Creek Project – 287M tons non-reserve coal deposits Crow Project – 1.4B in-place tons(1) subject to exercise of options |
|
|
19 Cloud Peak Energy Port Position 19 19 Westshore Terminal Capesize vessels – deep-water port 2012 expanded to 33 million tonnes total capacity Cloud Peak Energy has throughput agreement to 2023 for a portion of our anticipated exports Cloud Peak Energy expects to ship approximately 4.5 million tons in 2014 Gateway Pacific Terminal (multi-commodity) Capesize vessels – deep-water port 48 million tonnes of coal at planned full development Cloud Peak Energy secured option for up to 17.6 million tons throughput, depending on ultimate terminal size Scoping concluded January 2013 – EIS process continues Initial opening expected ~2018 |
|
|
20 Cloud Peak Energy’s Position on Climate Change Cloud Peak Energy accepts that concern about climate change and CO2 emissions are a political reality. All mainstream analysts (including EIA and the IPCC) forecast continued strong growth in coal usage. Coal is abundant, cheap and reliable. This inevitably means that finding a technical solution to reduce and/or capture CO2 emissions from coal-fired power plants must be actively pursued. Cloud Peak Energy is an active member of the Coal Utilization Research Council and the National Carbon Capture Center. The actions of some groups who seek unrealistic reductions, or even complete elimination of fossil fuels, are not adding value to the debate or assisting in the development of a generation mix that will meet national and global energy needs. This is a technical/economic challenge that is currently being treated as a political/emotional issue. |
|
|
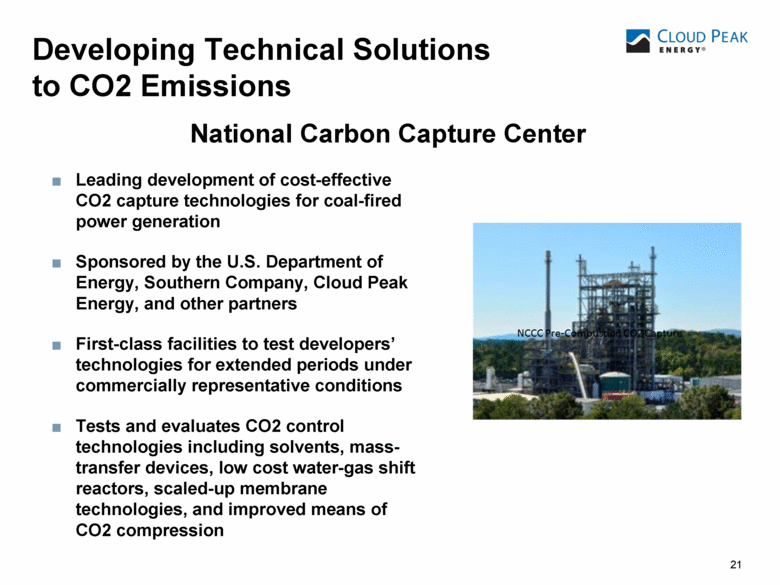
21 Developing Technical Solutions to CO2 Emissions Leading development of cost-effective CO2 capture technologies for coal-fired power generation Sponsored by the U.S. Department of Energy, Southern Company, Cloud Peak Energy, and other partners First-class facilities to test developers’ technologies for extended periods under commercially representative conditions Tests and evaluates CO2 control technologies including solvents, mass-transfer devices, low cost water-gas shift reactors, scaled-up membrane technologies, and improved means of CO2 compression National Carbon Capture Center |
|
|
22 Cloud Peak Energy’s View If society wants to reduce GHG emissions then we need to develop technology to allow this to happen Energy/electricity demand will continue to grow along with global population so will GHG emissions under current policies and with current technology Science on warming is not settled – it will continue to develop as all true science does Reducing GHG emissions is a technical/engineering challenge; can be met at a given cost over a calculable timescale. Developing the lowest-cost pathways to reduce GHG emissions is vital. NGO’s fail to offer viable solution: “Our vision is that we skip right over carbon capture and storage.” – Bruce Nilles, Sierra Club’s Beyond Coal |
|
|
QUESTIONS? |

