Attached files
| file | filename |
|---|---|
| 8-K - 8-K - CVB FINANCIAL CORP | d724092d8k.htm |
| EX-99.2 - EX-99.2 - CVB FINANCIAL CORP | d724092dex992.htm |
| Exhibit 99.1
|
CVB Financial Corp.
May 2014
1Q Results 2014 | cbbank.com
|
|
Safe Harbor
Certain matters set forth herein (including the exhibits hereto) constitute forward-looking statements within the meaning of the Private Securities Litigation Reform Act of 1995, including forward-looking statements relating to the Company’s current business plans and expectations regarding future operating results. These forward-looking statements are subject to risks and uncertainties that could cause actual results, performance or achievements to differ materially from those projected. These risks and uncertainties include, but are not limited to, local, regional, national and international economic conditions and events and the impact they may have on us and our customers; ability to attract deposits and other sources of liquidity; supply and demand for real property inventory and periodic deterioration in values of California real estate, both residential and commercial; a prolonged slowdown or decline in construction activity; changes in the financial performance and/or condition of our borrowers; changes in the level of non-performing assets and charge-offs; the cost or effect of acquisitions we may make; the effect of changes in laws and regulations (including laws, regulations and judicial decisions concerning financial reform, taxes, banking capital levels, securities, employment, executive compensation, insurance and information security) with which we and our subsidiaries must comply; changes in estimates of future reserve requirements and minimum capital requirements based upon the periodic review thereof under relevant regulatory and accounting requirements, including changes in the Basel Committee framework establishing capital standards for credit, operations and market risk; inflation, interest rate, securities market and monetary fluctuations; changes in government interest rate or monetary policies; changes in the amount and availability of deposit insurance; cyber-security threats including loss of system functionality or theft or loss of Company or customer data; political instability; acts of war or terrorism, or natural disasters, such as earthquakes, or the effects of pandemic diseases; the timely development and acceptance of new banking products and services and perceived overall value of these products and services by users; changes in consumer spending, borrowing and savings habits; technological changes and the expanding use of technology in banking (including the adoption of mobile banking applications); the ability to retain and increase market share, retain and grow customers and control expenses; changes in the competitive environment among financial and bank holding companies and other financial service providers; continued volatility in the credit and equity markets and its effect on the general economy or local business conditions; fluctuations in the price of the Company’s stock; the effect of changes in accounting policies and practices, as may be adopted from time-to-time by the regulatory agencies, as well as by the Public Company Accounting Oversight Board, the Financial Accounting Standards Board and other accounting standard- setters; changes in our organization, management, compensation and benefit plans, and our ability to retain or expand our management team and/or our board of directors; the costs and effects of legal and regulatory developments, including the resolution of legal proceedings or regulatory or other governmental inquiries or investigations and the results of regulatory examinations or reviews; our success at managing the risks involved in the foregoing items and all other factors set forth in the Company’s public reports including its Annual Report on Form 10-K for the year ended December 31, 2013, and particularly the discussion of risk factors within that document. The Company does not undertake, and specifically disclaims any obligation, to update any forward-looking statements to reflect occurrences or unanticipated events or circumstances after the date of such statements except as required by law.
1Q Results 2014 | cbbank.com
|
|
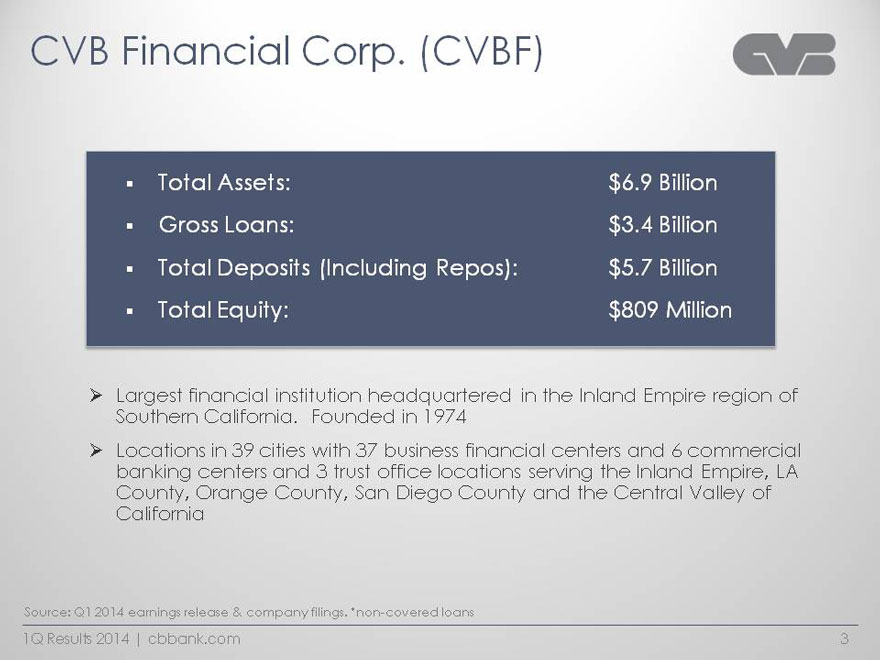
CVB Financial Corp. (CVBF)
§ Total Assets: $6.9 Billion
§ Gross Loans: $3.4 Billion
§ Total Deposits (Including Repos): $5.7 Billion
§ Total Equity: $809 Million
Ø Largest financial institution headquartered in the Inland Empire region of Southern California. Founded in 1974
Ø Locations in 39 cities with 37 business financial centers and 6 commercial banking centers and 3 trust office locations serving the Inland Empire, LA County, Orange County, San Diego County and the Central Valley of California
Source: Q1 2014 earnings release & company filings. *non-covered loans
1Q Results 2014 | cbbank.com
|
|
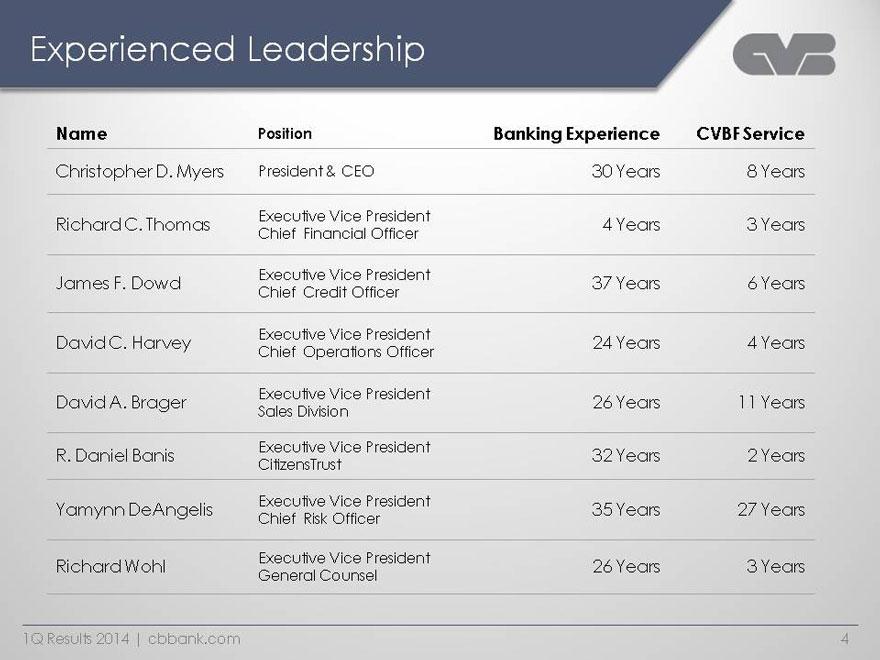
Experienced Leadership
Name Position Banking Experience CVBF Service
Christopher D. Myers President & CEO 30 Years 8 Years
Richard C. Thomas Executive Vice President Chief Financial Officer 4 Years 3 Years
James F. Dowd Executive Vice President Chief Credit Officer 37 Years 6 Years
David C. Harvey Executive Vice President Chief Operations Officer 24 Years 4 Years
David A. Brager Executive Vice President
Sales Division 26 Years 11 Years
R. Daniel Banis Executive Vice President CitizensTrust 32 Years 2 Years
Yamynn DeAngelis Executive Vice President Chief Risk Officer 35 Years 27 Years
Richard Wohl Executive Vice President
General Counsel 26 Years 3 Years
1Q Results 2014 | cbbank.com
|
|
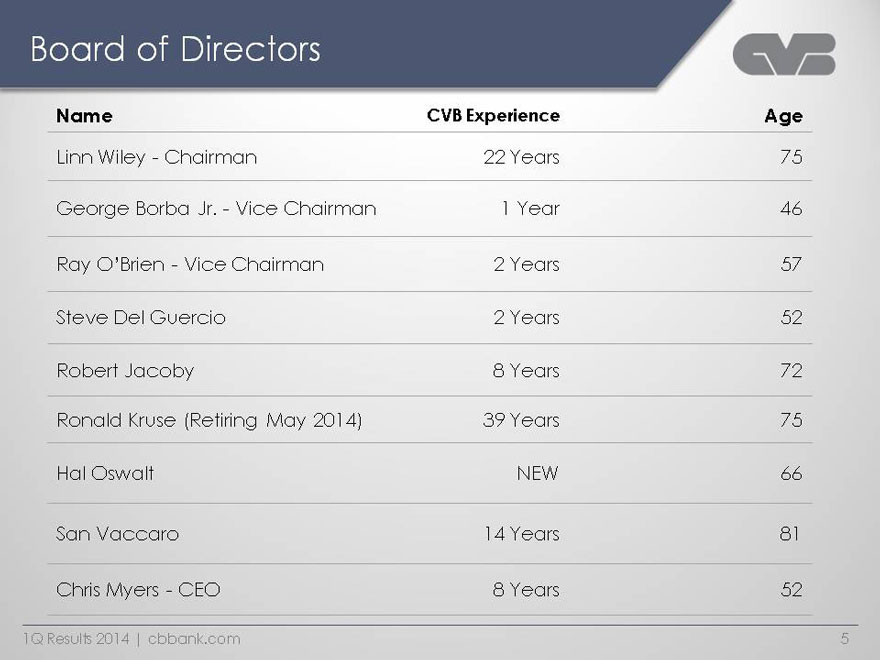
Board of Directors
Name CVB Experience Age
Linn Wiley - Chairman 22 Years 75
George Borba Jr. - Vice Chairman 1 Year 46
Ray O’Brien - Vice Chairman 2 Years 57
Steve Del Guercio 2 Years 52
Robert Jacoby 8 Years 72
Ronald Kruse (Retiring May 2014) 39 Years 75
Hal Oswalt NEW 66
San Vaccaro 14 Years 81
Chris Myers - CEO
|
|
Who is CVB Financial Corp.?
1Q Results 2014 | cbbank.com
|
|
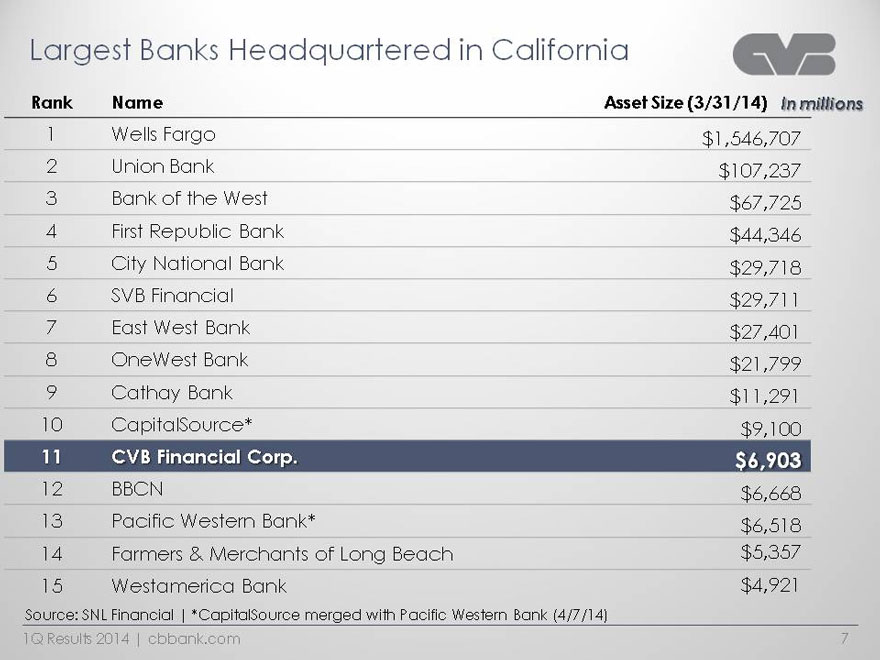
Largest Banks Headquartered in California
Rank Name Asset Size (3/31/14)
1 Wells Fargo $1,546,707
2 Union Bank $107,237
3 Bank of the West $67,725
4 First Republic Bank $44,346
5 City National Bank $29,718
6 SVB Financial $29,711
7 East West Bank $27,401
8 OneWest Bank $21,799
9 Cathay Bank $11,291
10 CapitalSource* $9,100
11 CVB Financial Corp. $6,903
12 BBCN $6,668
13 Pacific Western Bank* $6,518
14 Farmers & Merchants of Long Beach $5,357
15 Westamerica Bank $4,921
Source: SNL Financial | *CapitalSource merged with Pacific Western Bank (4/7/14)
1Q Results 2014 | cbbank.com
|
|
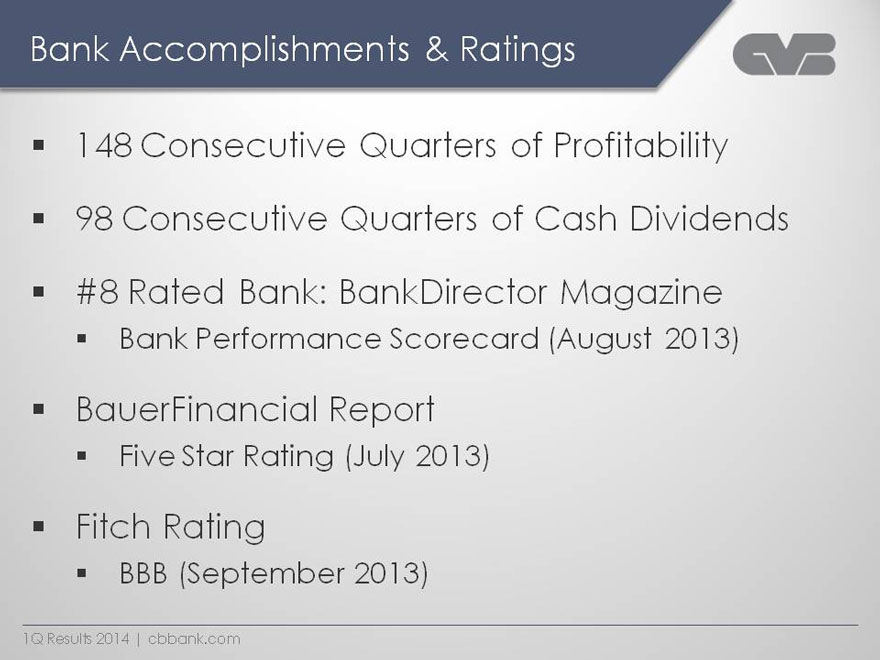
Bank Accomplishments & Ratings
§ 148 Consecutive Quarters of Profitability
§ 98 Consecutive Quarters of Cash Dividends
§ #8 Rated Bank: BankDirector Magazine
§ Bank Performance Scorecard (August 2013)
§ BauerFinancial Report
§ Five Star Rating (July 2013)
§ Fitch Rating
BBB (September 2013)
1Q Results 2014 | cbbank.com
|
|
Our Markets
CVB Financial Corp.
1Q Results 2014 | cbbank.com
|
|
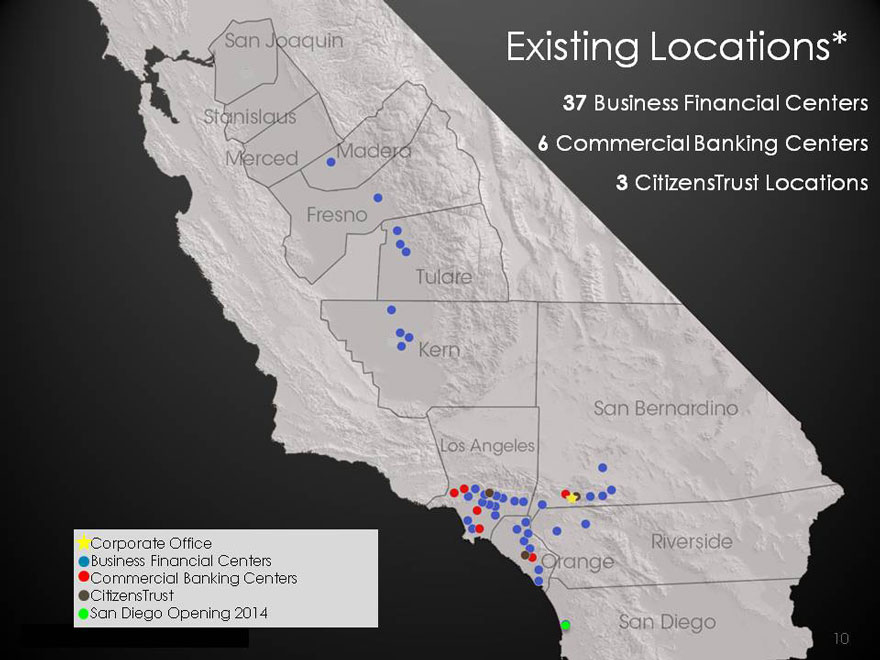
Existing Locations*
37 Business Financial Centers
6 Commercial Banking Centers
3 CitizensTrust Locations
Corporate Office
Business Financial Centers
Commercial Banking Centers
CitizensTrust
San Diego Opening 2014
1Q Results 2014 | cbbank.com
|
|
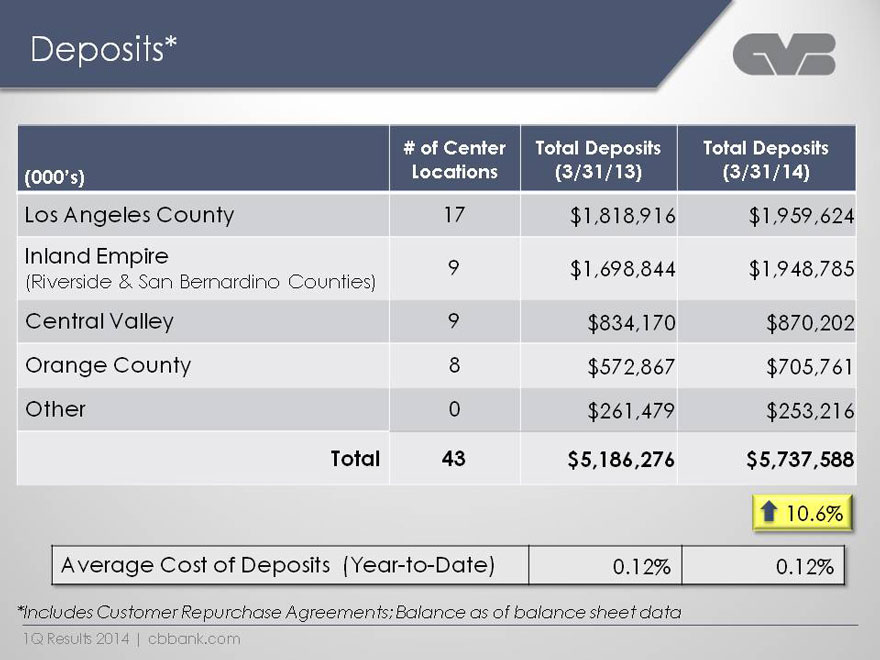
Deposits*
(000’s) # of Center Locations Total Deposits
(3/31/13) Total Deposits
(3/31/14)
Los Angeles County 17 $1,818,916 $1,959,624
Inland Empire
(Riverside & San Bernardino Counties) 9 $1,698,844 $1,948,785
Central Valley 9 $834,170 $870,202
Orange County 8 $572,867 $705,761
Other 0 $261,479 $253,216
Total 43 $5,186,276 $5,737,588
10.6%
Average Cost of Deposits (Year-to-Date) 0.12% 0.12%
*Includes Customer Repurchase Agreements; Balance as of balance sheet data
1Q Results 2014 | cbbank.com
|
|
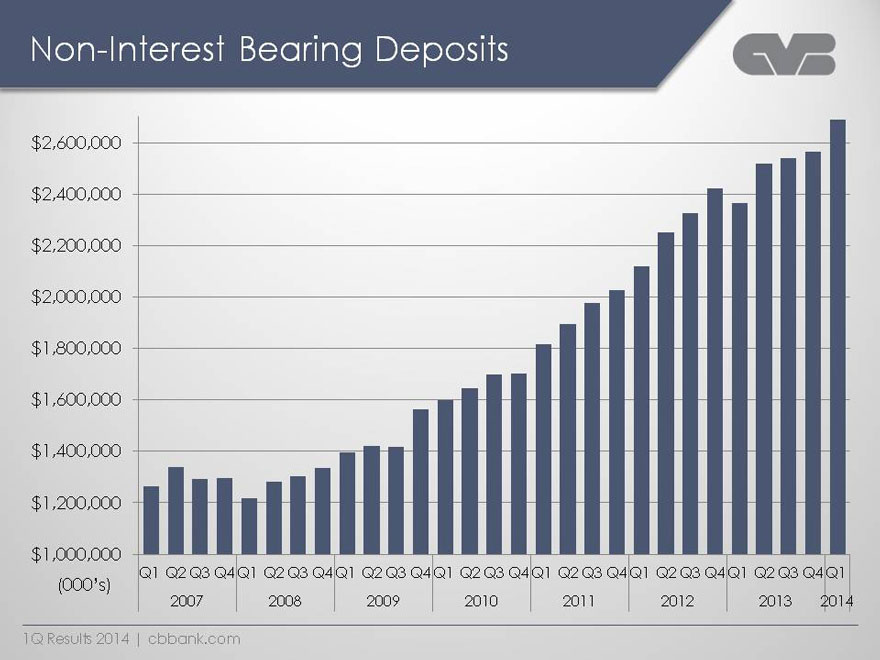
Non-Interest Bearing Deposits
Column1 Non-Int Bearing Dep
2007 Q1 $ 1,264,243
Q2 $ 1,340,495
Q3 $ 1,292,825
Q4 $ 1,295,959
2008 Q1 $ 1,218,660
Q2 $ 1,281,838
Q3 $ 1,302,205
Q4 $ 1,334,248
2009 Q1 $ 1,396,087
Q2 $ 1,420,535
Q3 $ 1,416,558
Q4 $ 1,561,981
2010 Q1 $ 1,598,022
Q2 $ 1,646,717
Q3 $ 1,699,096
Q4 $ 1,701,523
2011 Q1 $ 1,817,951
Q2 $ 1,894,558
Q3 $ 1,977,137
Q4 $ 2,027,876
2012 Q1 $ 2,120,382
Q2 $ 2,252,280
Q3 $ 2,324,404
Q4 $ 2,420,993
2013 Q1 $ 2,366,719
Q2 $ 2,518,886
Q3 $ 2,538,461
Q4 $ 2,562,980
2014 Q1 $ 2,688,585
1Q Results 2014 | cbbank.com
|
|
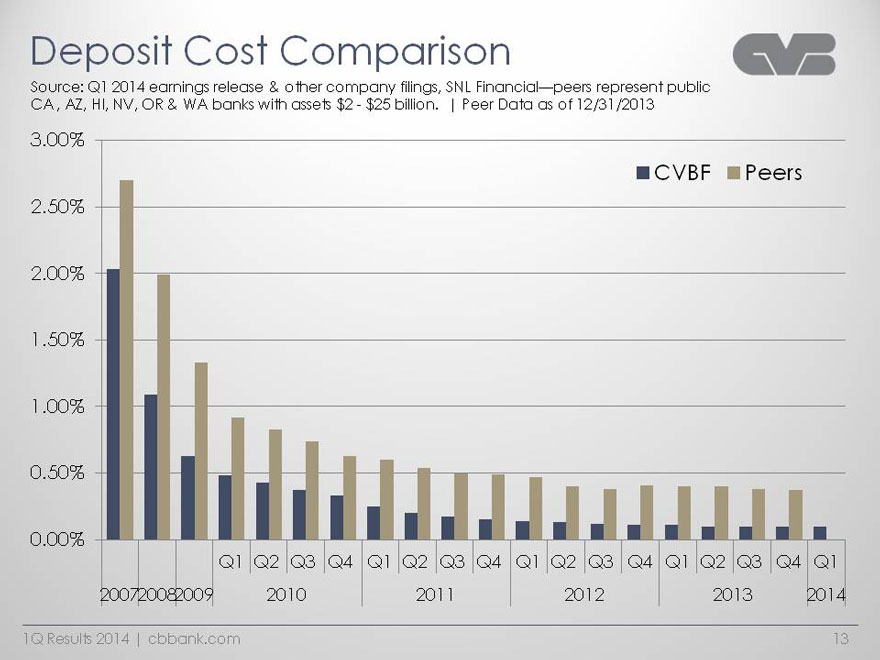
Deposit Cost Comparison
Column1 CVBF Peers
2007 2.03% 2.70%
2008 1.09% 1.99%
2009 0.63% 1.33%
2010 Q1 0.48% 0.92%
Q2 0.43% 0.83%
Q3 0.37% 0.74%
Q4 0.33% 0.63%
2011 Q1 0.25% 0.60%
Q2 0.20% 0.54%
Q3 0.17% 0.50%
Q4 0.15% 0.49%
2012 Q1 0.14% 0.47%
Q2 0.13% 0.40%
Q3 0.12% 0.38%
Q4 0.11% 0.41%
2013 Q1 0.11% 0.40%
Q2 0.10% 0.40%
Q3 0.10% 0.38%
Q4 0.10% 0.37%
2014 Q1 0.10%
1Q Results 2014 | cbbank.com
|
|
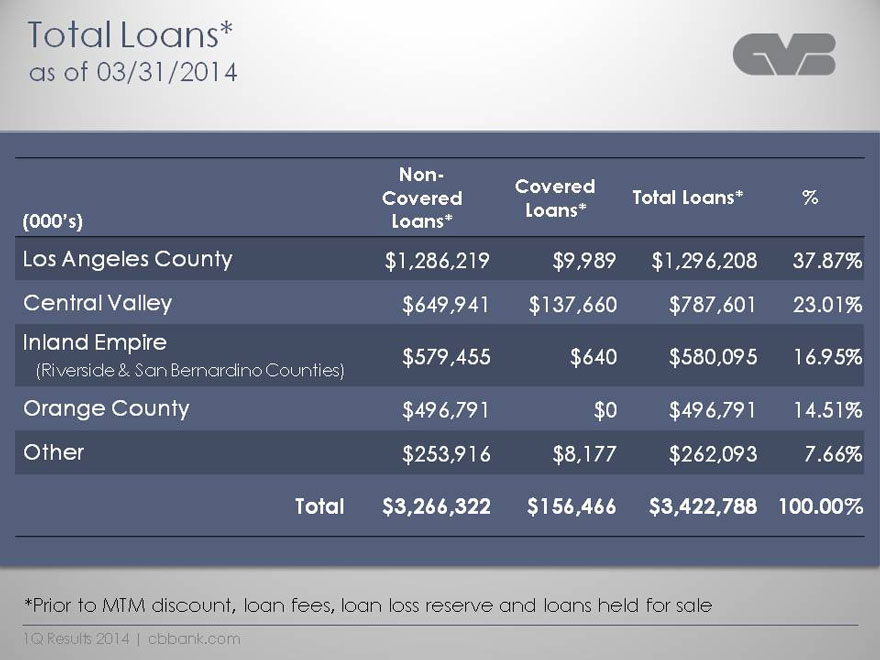
Total Loans*
as of 03/31/2014
(000’s) Non-Covered Loans* Covered Loans* Total Loans* %
Los Angeles County $1,286,219 $9,989 $1,296,208 37.87%
Central Valley $649,941 $137,660 $787,601 23.01%
Inland Empire
(Riverside & San Bernardino Counties) $579,455 $640 $580,095 16.95%
Orange County $496,791 $0 $496,791 14.51%
Other $253,916 $8,177 $262,093 7.66%
Total $3,266,322 $156,466 $3,422,788 100.00%
*Prior to MTM discount, loan fees, loan loss reserve and loans held for sale
1Q Results 2014 | cbbank.com
|
|
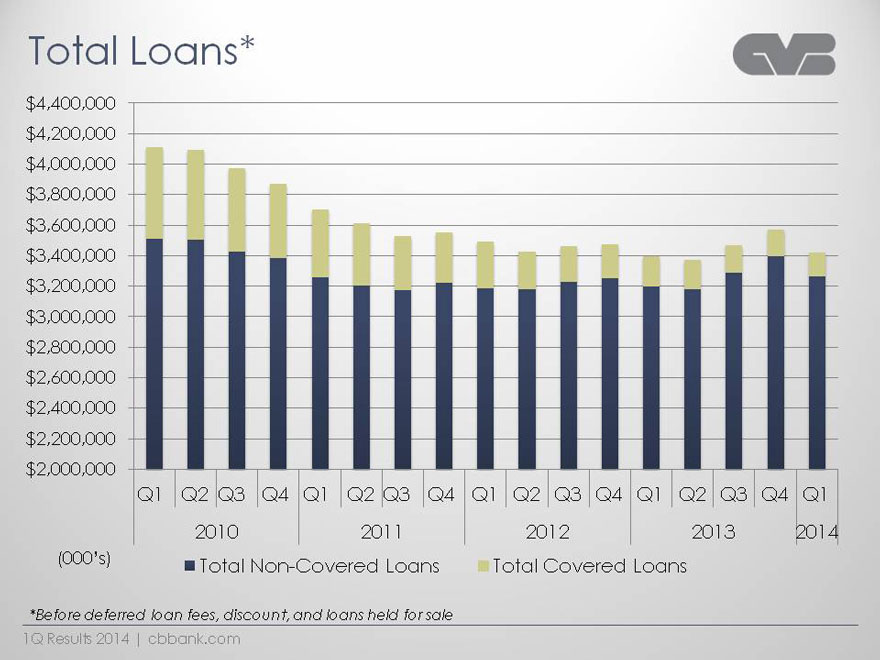
Total Loans*
Column1 Column2 Total Non-Covered Loans Total Covered Loans
2010 Q1 $ 3,508,590 $ 602,381
Q2 $ 3,507,197 $ 583,770
Q3 $ 3,427,592 $ 547,573
Q4 $ 3,382,165 $ 488,776
2011 Q1 $ 3,258,833 $ 446,876
Q2 $ 3,205,097 $ 407,674
Q3 $ 3,174,604 $ 354,558
Q4 $ 3,220,076 $ 330,412
2012 Q1 $ 3,186,643 $ 305,044
Q2 $ 3,177,788 $ 246,649
Q3 $ 3,228,401 $ 235,897
Q4 $ 3,252,313 $ 220,559
2013 Q1 $ 3,197,001 $ 199,602
Q2 $ 3,177,971 $ 191,369
Q3 $ 3,290,471 $ 177,863
Q4 $ 3,395,150 $ 173,104
2014 Q1 $ 3,266,322 $ 156,466
*Before deferred loan fees, discount, and loans held for sale
1Q Results 2014 | cbbank.com
|
|
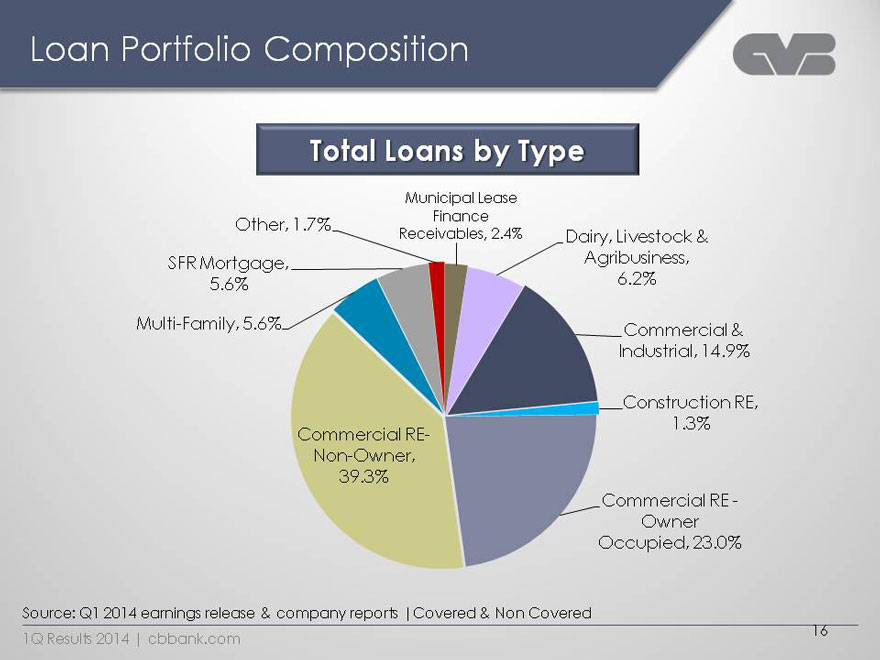
Loan Portfolio Composition
Total Loans by Type
Total Loans
Municipal Lease Finance Receivables 2.4%
Dairy, Livestock & Agribusiness 6.2%
Commercial & Industrial 14.9%
Construction RE 1.3%
Commercial RE - Owner Occupied 23.0%
Commercial RE- Non-Owner 39.3%
Multi-Family 5.6%
SFR Mortgage 5.6%
Other 1.7%
1Q Results 2014 | cbbank.com
|
|
New/Enhanced Lending Initiatives
• Residential Real Estate
• Multi-Family
• Asset Based Lending
Residential and Commercial Construction
1Q Results 2014 | cbbank.com
|
|
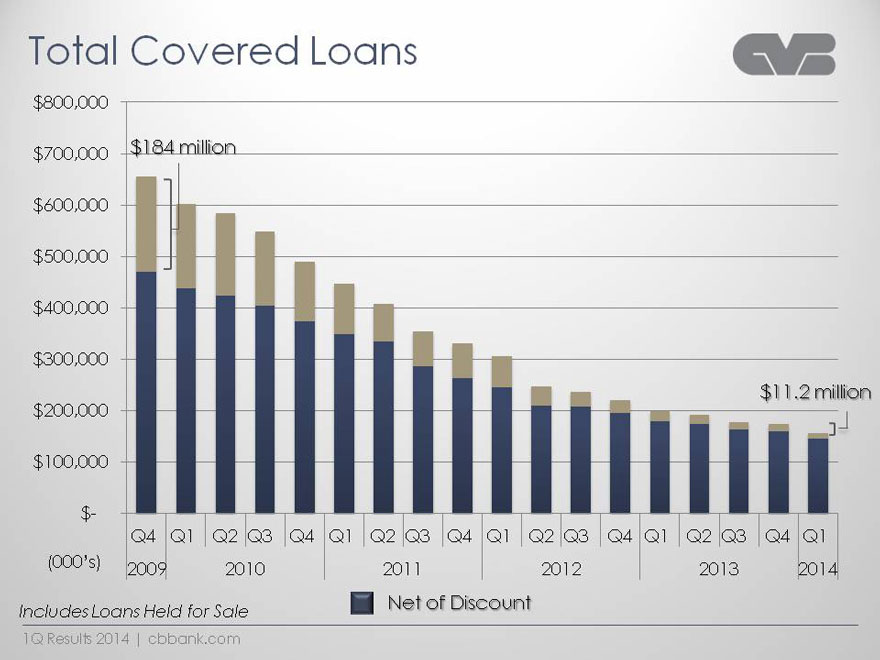
Total Covered Loans
Column1 Net of Discount Discount
2009 Q4 $ 470,634 $ 184,419
2010 Q1 $ 438,539 $ 163,842
Q2 $ 424,377 $ 159,393
Q3 $ 403,821 $ 143,752
Q4 $ 374,013 $ 114,763
2011 Q1 $ 348,759 $ 98,117
Q2 $ 334,225 $ 73,449
Q3 $ 286,063 $ 68,495
Q4 $ 262,533 $ 67,879
2012 Q1 $ 245,714 $ 59,330
Q2 $ 210,147 $ 36,502
Q3 $207,307 $28,590
Q4 $ 195,215 $ 25,344
2013 Q1 $ 178,694 $ 20,908
Q2 $173,843 $17,526
Q3 $ 163,334 $ 14,529
Q4 $160,315 $12,789
2014 Q1 $145,313 $11,153
1Q Results 2014 | cbbank.com
|
|
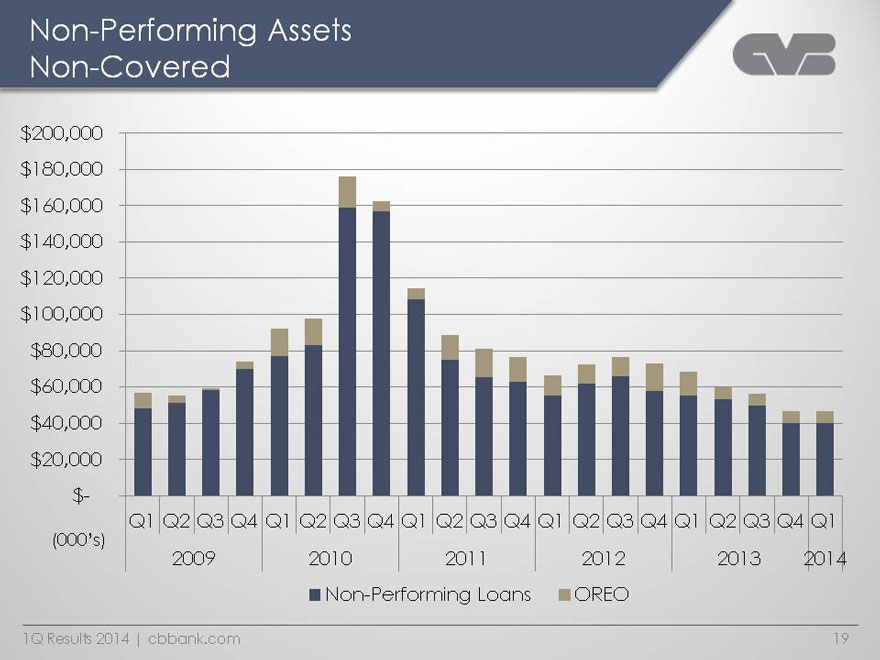
Non-Performing Assets Non-Covered
Column1 Non-Performing Loans OREO
2009 Q1 $ 48,037 $ 8,666
Q2 $ 51,265 $ 4,035
Q3 $ 58,134 $ 1,137
Q4 $ 69,779 $ 3,936
2010 Q1 $ 76,840 $ 15,178
Q2 $ 82,850 $ 15,001
Q3 $ 158,871 $ 17,387
Q4 $ 157,020 $ 5,290
2011 Q1 $ 108,150 $ 6,240
Q2 $ 75,050 $ 13,718
Q3 $ 65,212 $ 15,956
Q4 $ 62,672 $ 13,820
2012 Q1 $55,212 $11,237
Q2 $ 61,865 $ 10,394
Q3 $ 65,988 $ 10,473
Q4 $ 57,997 $ 14,832
2013 Q1 $ 55,129 $ 13,341
Q2 $ 53,351 $ 6,524
Q3 $ 49,484 $ 6,524
Q4 $ 39,954 $ 6,475
2014 Q1 40,202 6,475
1Q Results 2014 | cbbank.com
|
|
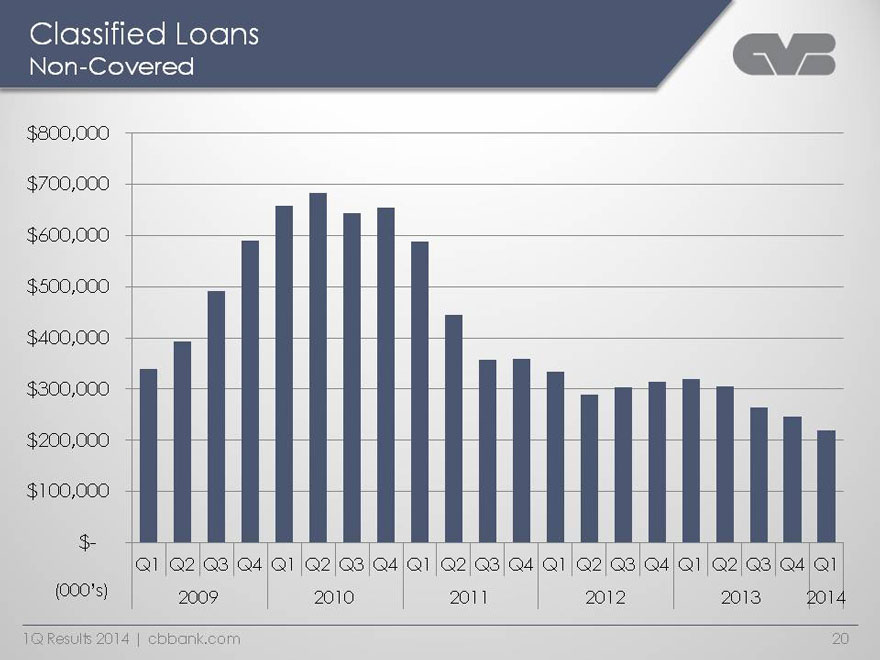
Classified Loans Non-Covered
Column1 Classified Loans (non Covered)
2009 Q1 $ 339,242
Q2 $ 392,128
Q3 $ 492,175
Q4 $ 590,595
2010 Q1 $ 658,766
Q2 $ 683,959
Q3 $ 644,301
Q4 $ 654,149
2011 Q1 $ 588,673
Q2 $ 445,253
Q3 $ 357,239
Q4 $359,179
2012 Q1 $334,117
Q2 $ 289,150
Q3 $ 302,526
Q4 $ 314,008
2013 Q1 $ 319,524
Q2 $ 304,432
Q3 $ 264,127
Q4 $ 245,589
2014 Q1 219,208
1Q Results 2014 | cbbank.com
|
|
Profits
CVB Financial Corp.
1Q Results 2014 | cbbank.com
|
|
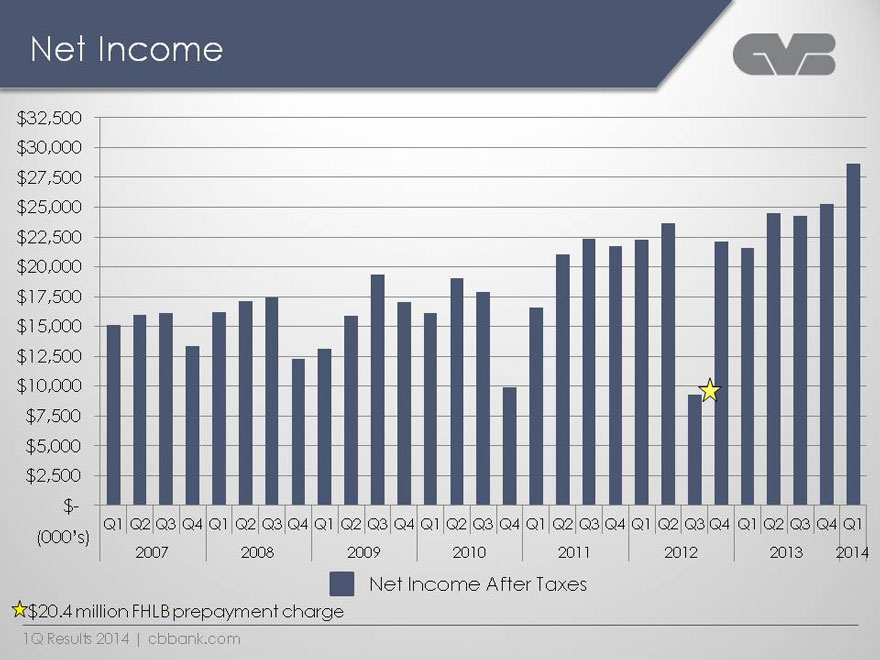
Net Income
Column1 Net Income
2007 Q1 $ 15,142
Q2 $ 15,954
Q3 $ 16,121
Q4 $ 13,367
2008 Q1 $ 16,184
Q2 $ 17,152
Q3 $ 17,460
Q4 $ 12,277
2009 Q1 $ 13,168
Q2 $ 15,861
Q3 $ 19,322
Q4 $ 17,068
2010 Q1 $ 16,119
Q2 $19,015
Q3 $ 17,927
Q4 $ 9,874
2011 Q1 $ 16,600
Q2 $ 21,038
Q3 $ 22,383
Q4 $ 21,712
2012 Q1 $22,268
Q2 $ 23,619
Q3 $ 9,257
Q4 $ 22,136
2013 Q1 $ 21,615
Q2 $ 24,466
Q3 $ 24,239
Q4 $ 25,288
2014 Q1 $ 28,661
1Q Results 2014 | cbbank.com
|
|
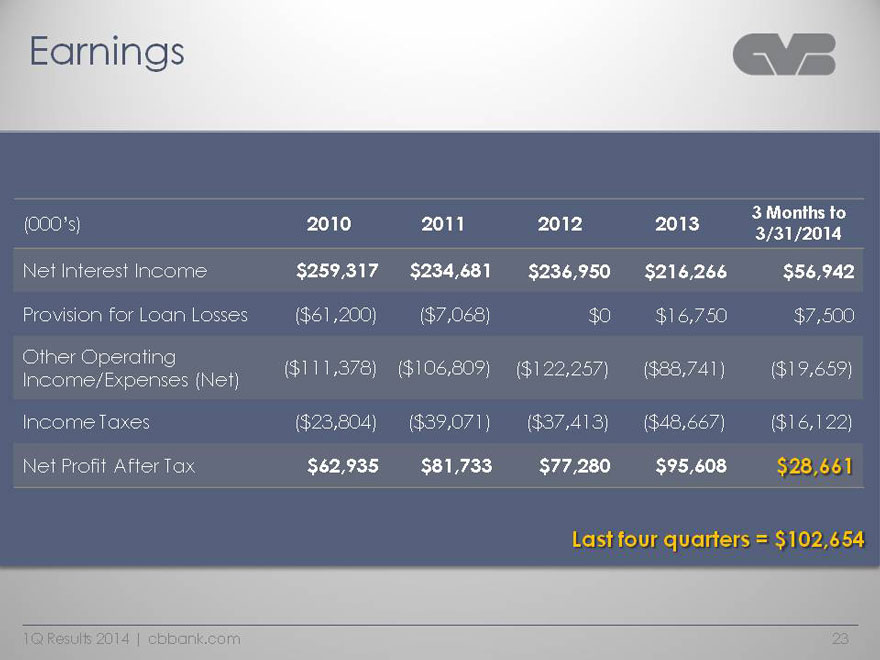
Earnings
(000’s) 2010 2011 2012 2013 3 Months to 3/31/2014
Net Interest Income $259,317 $234,681 $236,950 $216,266 $56,942
Provision for Loan Losses ($61,200) ($7,068) $0 $16,750 $7,500
Other Operating Income/Expenses (Net) ($111,378) ($106,809) ($122,257) ($88,741) ($19,659)
Income Taxes ($23,804) ($39,071) ($37,413) ($48,667) ($16,122)
Net Profit After Tax $62,935 $81,733 $77,280 $95,608 $28,661
Last four quarters = $102,654
1Q Results 2014 | cbbank.com
|
|
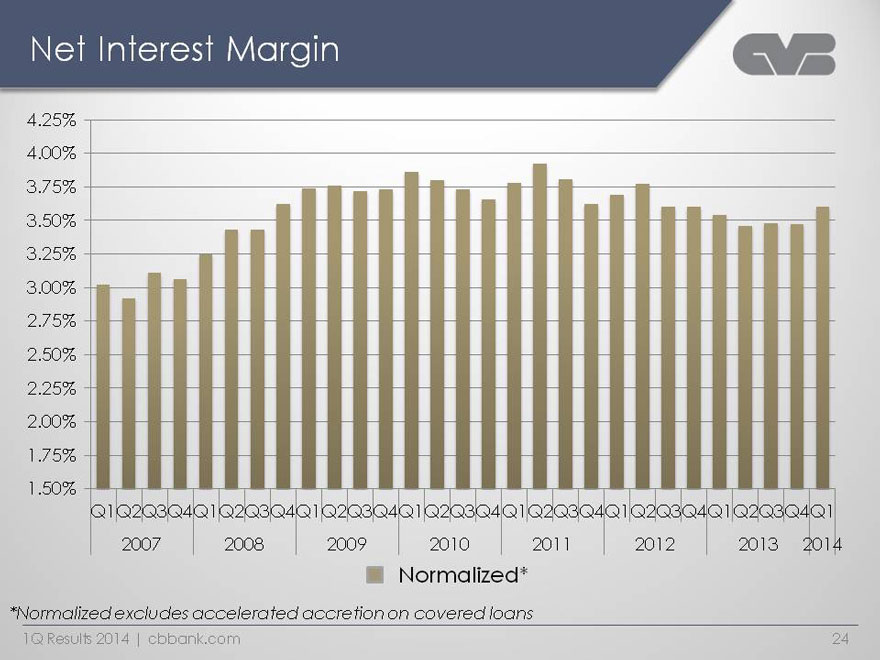
Net Interest Margin
Column1 Normalized
2007 Q1 3.02%
Q2 2.92%
Q3 3.11%
Q4 3.06%
2008 Q1 3.25%
Q2 3.43%
Q3 3.43%
Q4 3.62%
2009 Q1 3.74%
Q2 3.76%
Q3 3.72%
Q4 3.73%
2010 Q1 3.86%
Q2 3.80%
Q3 3.73%
Q4 3.66%
2011 Q1 3.78%
Q2 3.92%
Q3 3.81%
Q4 3.62%
2012 Q1 3.69%
Q2 3.77%
Q3 3.60%
Q4 3.60%
2013 Q1 3.54%
Q2 3.46%
Q3 3.48%
Q4 3.47%
2014 Q1 3.60%
1Q Results 2014 | cbbank.com
|
|
Expenses
CVB Financial Corp.
1Q Results 2014 | cbbank.com
|
|
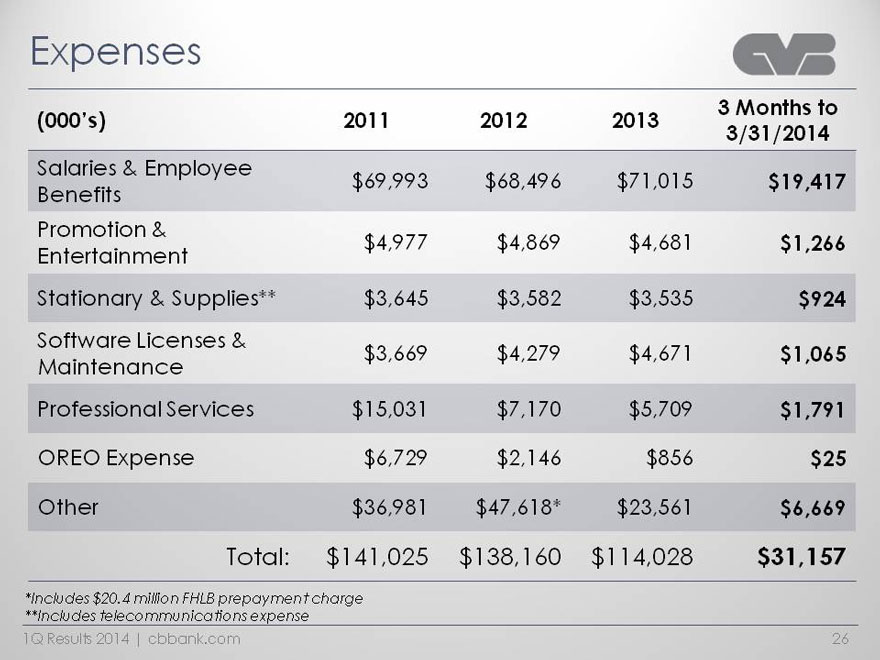
Expenses
(000’s) 2011 2012 2013 3 Months to 3/31/2014
Salaries & Employee Benefits $69,993 $68,496 $71,015 $19,417
Promotion & Entertainment $4,977 $4,869 $4,681 $1,266
Stationary & Supplies** $3,645 $3,582 $3,535 $924
Software Licenses & Maintenance $3,669 $4,279 $4,671 $1,065
Professional Services $15,031 $7,170 $5,709 $1,791
OREO Expense $6,729 $2,146 $856 $25
Other $36,981 $47,618* $23,561 $6,669
Total: $141,025 $138,160 $114,028 $31,157
1Q Results 2014 | cbbank.com
|
|

Capital
CVB Financial Corp.
1Q Results 2014 | cbbank.com
|
|
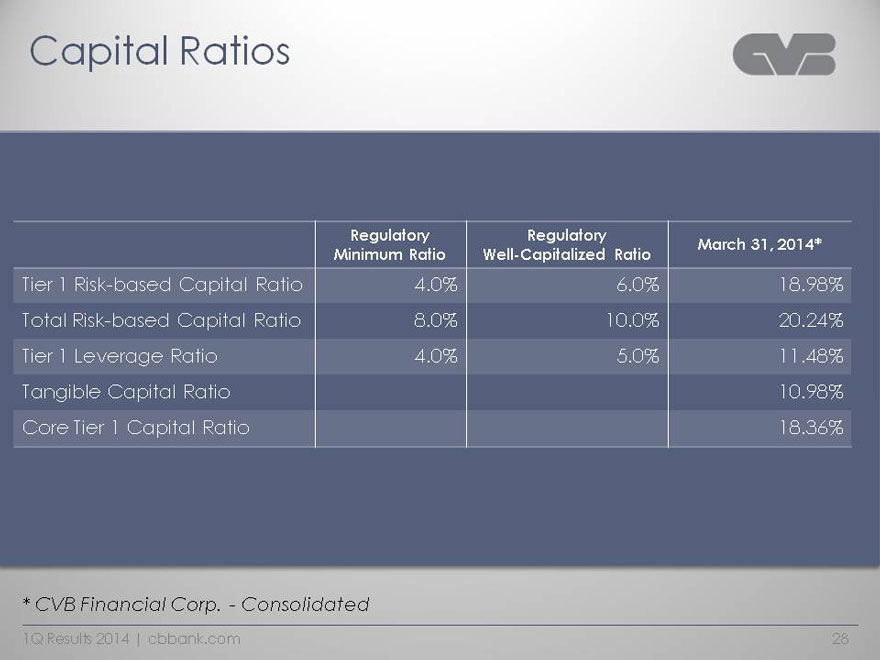
Capital Ratios
Regulatory Minimum Ratio Regulatory
Well-Capitalized Ratio March 31, 2014*
Tier 1 Risk-based Capital Ratio 4.0% 6.0% 18.98%
Total Risk-based Capital Ratio 8.0% 10.0% 20.24%
Tier 1 Leverage Ratio 4.0% 5.0% 11.48%
Tangible Capital Ratio 10.98%
Core Tier 1 Capital Ratio 18.36%
* CVB Financial Corp. - Consolidated
1Q Results 2014 | cbbank.com
|
|
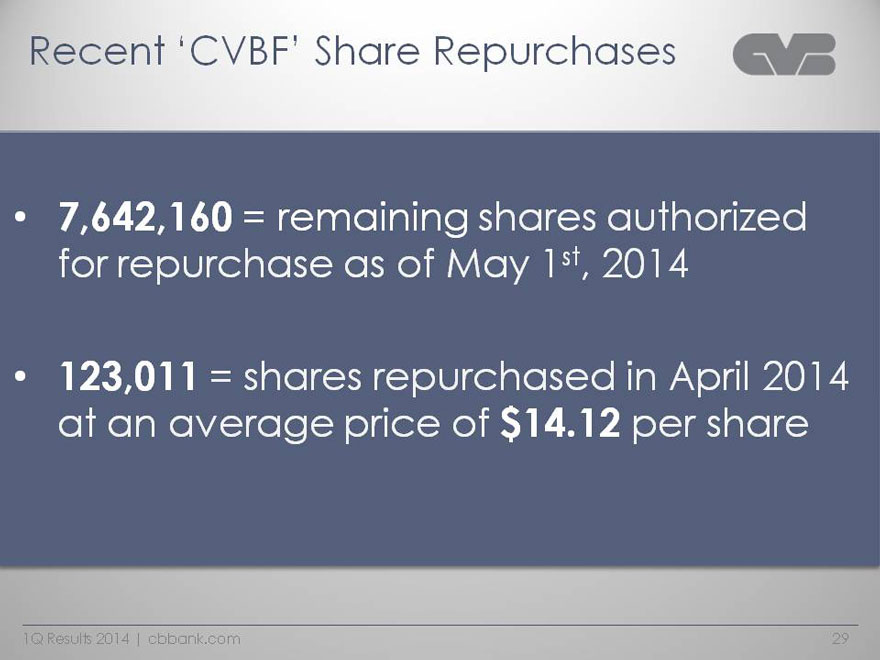
Recent ‘CVBF’ Share Repurchases
• 7,642,160 = remaining shares authorized for repurchase as of May 1st, 2014
123,011 = shares repurchased in April 2014 at an average price of $14.12 per share
1Q Results 2014 | cbbank.com
|
|
Securities & Investments
CVB Financial Corp.
1Q Results 2014 | cbbank.com
|
|
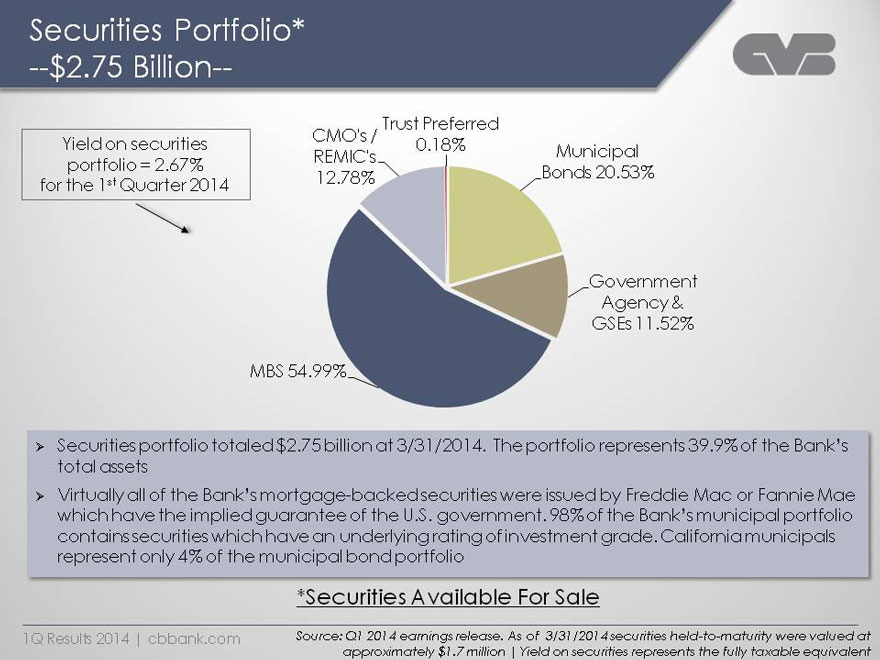
Securities Portfolio* --$2.75 Billion-2-
Yield on securities portfolio = 2.67% for the 1st Quarter 2014
Sales
Municipal Bonds 20.53%
Government Agency & GSEs 11.52%
MBS 54.99%
CMO’s / REMIC’s 12.78%
Trust Preferred 0.18%
Ø Securities portfolio totaled $2.75 billion at 3/31/2014. The portfolio represents 39.9% of the Bank’s total assets
Virtually all of the Bank’s mortgage-backed securities were issued by Freddie Mac or Fannie Mae which have the implied guarantee of the U.S. government. 98% of the Bank’s municipal portfolio contains securities which have an underlying rating of investment grade. California municipals represent only 4% of the municipal bond portfolio
*Securities Available For Sale
Source: Q1 2014 earnings release. As of 3/31/2014 securities held-to-maturity were valued at approximately $1.7 million | Yield on securities represents the fully taxable equivalent
1Q Results 2014 | cbbank.com
|
|
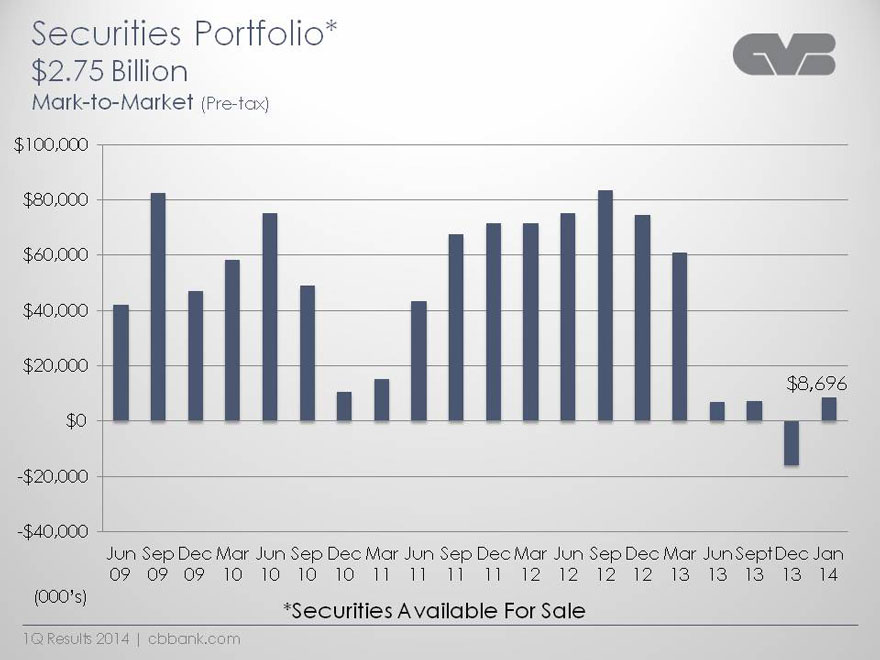
Securities Portfolio* $2.75 Billion Mark-to-Market (Pre-tax)
Column3 Mark to Market Column1
Jun 09 $ 42,197
Sep 09 $ 82,480
Dec 09 $ 47,154
Mar 10 $ 58,178
Jun 10 $ 75,117
Sep 10 $ 49,022
Dec 10 $ 10,664
Mar 11 $ 15,068
Jun 11 $ 43,390
Sep 11 $ 67,648
Dec 11 $ 71,498
Mar 12 $ 71,425
Jun 12 $ 75,145
Sep 12 $ 83,561
Dec 12 $ 74,571
Mar 13 $60,781
Jun 13 $6,927
Sept 13 $ 7,348
Dec 13 $ (16,085)
Jan 14 $ 8,696
1Q Results 2014 | cbbank.com
|
|
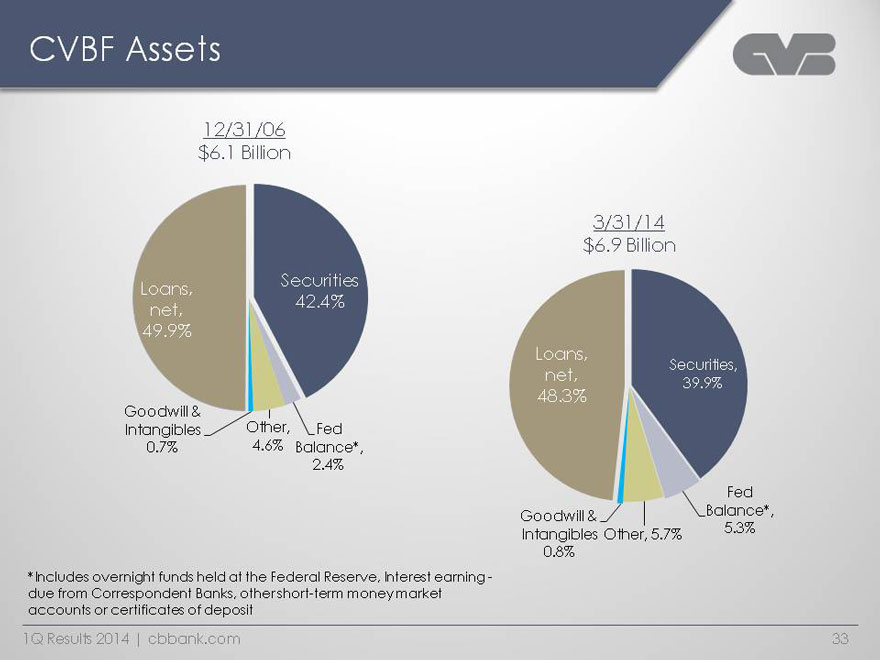
CVBF Assets
12/31/06
$6.1 Billion
Sales
Securities 42.4%
Fed Balance* 2.4%
Other 4.6%
Goodwill & Intangibles 0.7%
Loans, net 49.9%
3/31/14
$6.9 Billion
Column1
Securities 39.9%
Fed Balance* 5.3%
Other 5.7%
Goodwill & Intangibles 0.8%
Loans, net 48.3%
1Q Results 2014 | cbbank.com
|
|
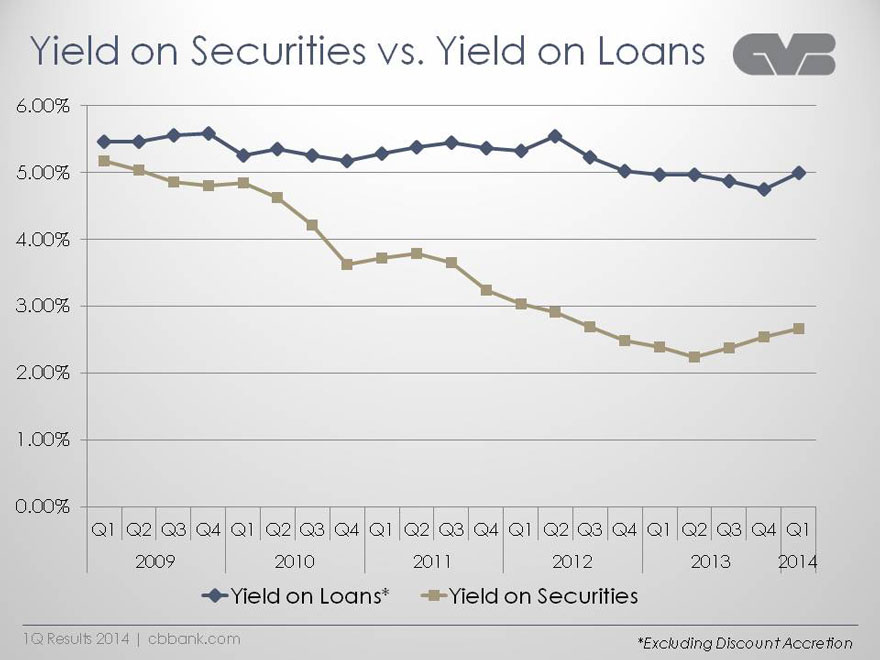
Yield on Securities vs. Yield on Loans
Column1 Yield on Loans* Yield on Securities
2009 Q1 5.46% 5.17%
Q2 5.46% 5.04%
Q3 5.56% 4.86%
Q4 5.58% 4.81%
2010 Q1 5.25% 4.85%
Q2 5.35% 4.63%
Q3 5.26% 4.21%
Q4 5.17% 3.62%
2011 Q1 5.28% 3.72%
Q2 5.38% 3.79%
Q3 5.45% 3.65%
Q4 5.37% 3.24%
2012 Q1 5.32% 3.03%
Q2 5.55% 2.91%
Q3 5.23% 2.69%
Q4 5.03% 2.49%
2013 Q1 4.97% 2.39%
Q2 4.97% 2.24%
Q3 4.87% 2.38%
Q4 4.75% 2.54%
2014 Q1 5.00% 2.67%
*Excluding Discount Accretion
1Q Results 2014 | cbbank.com
|
|
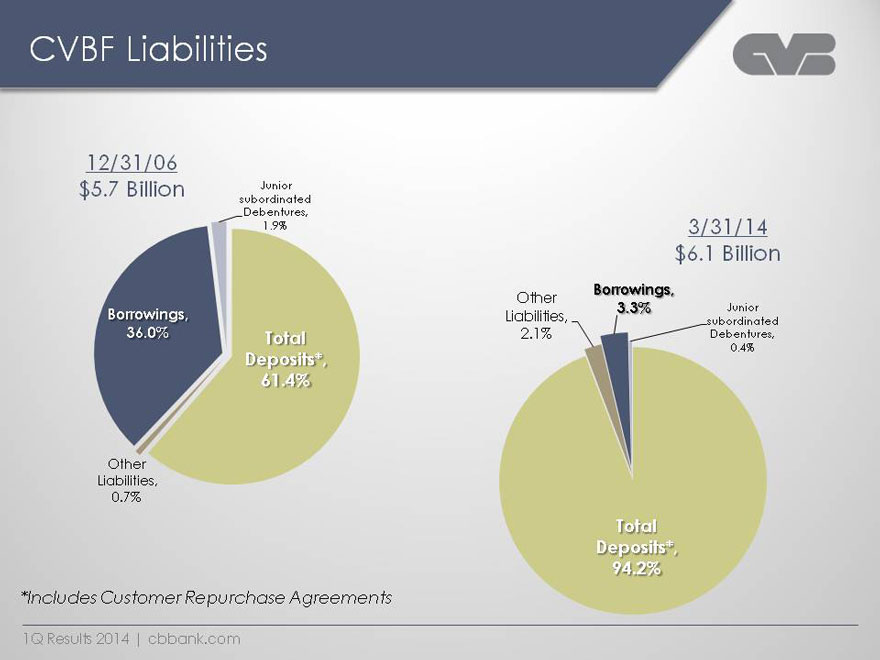
CVBF Liabilities
12/31/06
$5.7 Billion
Sales
Total Deposits* 61.4%
Other Liabilities 0.7%
Borrowings 36.0%
Junior subordinated Debentures 1.9%
3/31/14
$6.1 Billion
Sales
Total Deposits* 94.2%
Other Liabilities 2.1%
Borrowings 3.3%
Junior subordinated Debentures 0.4%
1Q Results 2014 | cbbank.com
|
|
New Acquisition “American Security Bank”
CVB Financial Corp.
1Q Results 2014 | cbbank.com
|
|
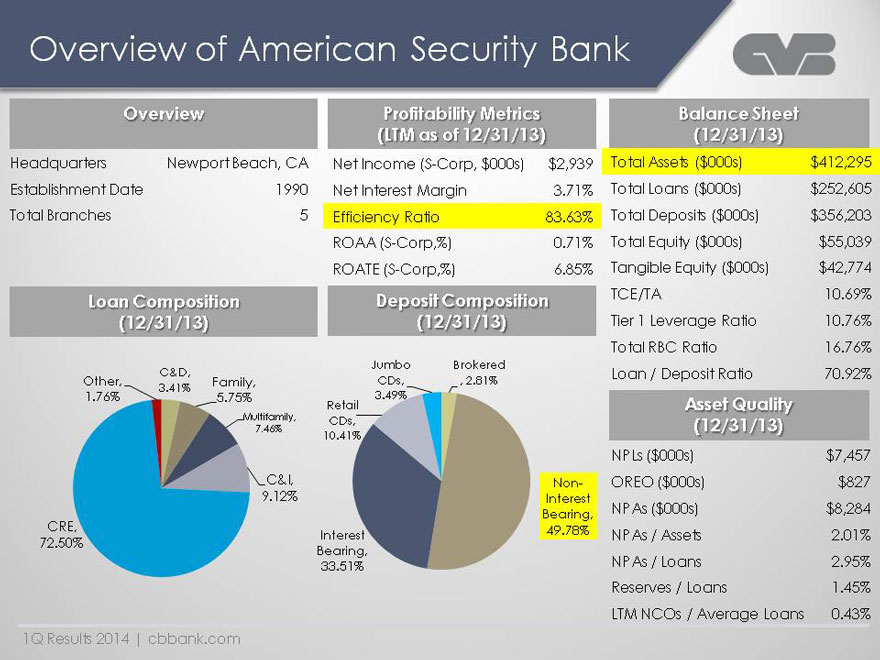
Overview of American Security Bank Overview
Headquarters Newport Beach, CA
Establishment Date 1990
Total Branches 5 Profitability Metrics (LTM as of 12/31/13)
Net Income (S-Corp, $000s) $2,939
Net Interest Margin 3.71%
Efficiency Ratio 83.63%
ROAA (S-Corp,%) 0.71%
ROATE (S-Corp,%) 6.85%
Balance Sheet (12/31/13)
Total Assets ($000s) $412,295
Total Loans ($000s) $252,605
Total Deposits ($000s) $356,203
Total Equity ($000s) $55,039
Tangible Equity ($000s) $42,774 TCE/TA 10.69%
Tier 1 Leverage Ratio 10.76% Total RBC Ratio 16.76%
Loan / Deposit Ratio 70.92% Loan Composition (12/31/13)
Column1 C&D 3.41%
Family 5.75%
Multifamily 7.46%
C&I 9.12%
CRE 72.50%
Other 1.76%
Deposit Composition (12/31/13) Column1
Brokered 2.81%
Non-Interest Bearing 49.78%
Interest Bearing 33.51%
Retail CDs 10.41% Jumbo CDs 3.49%
Asset Quality (12/31/13)
NPLs ($000s) $7,457 OREO ($000s) $827
NPAs ($000s) $8,284 NPAs / Assets 2.01%
NPAs / Loans 2.95% Reserves / Loans 1.45% LTM NCOs / Average Loans 0.43%
1Q Results 2014 | cbbank.com
|
|
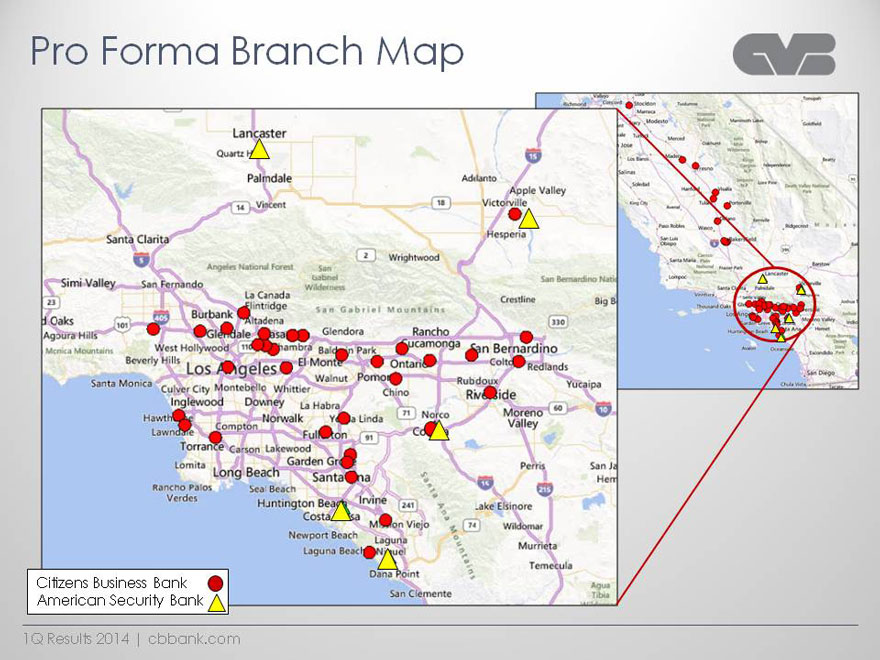
Pro Forma Branch Map
Citizens Business Bank
American Security Bank
1Q Results 2014 | cbbank.com
|
|
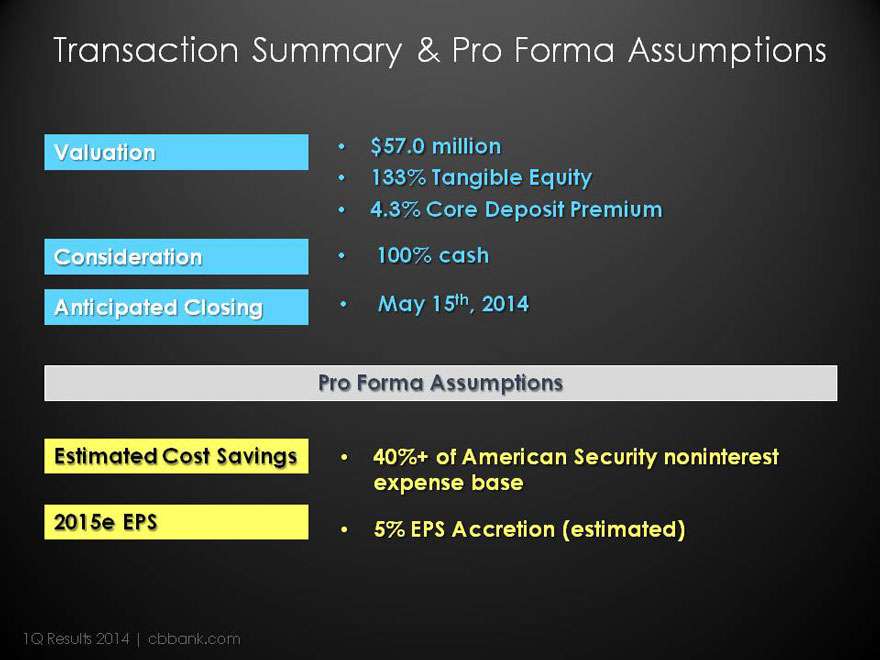
Transaction Summary & Pro Forma Assumptions
Valuation
• $57.0 million
• 133% Tangible Equity
4.3% Core Deposit Premium
Consideration
100% cash
Anticipated Closing
May 15th, 2014
Pro Forma Assumptions
Estimated Cost Savings
• 40%+ of American Security noninterest expense base
2015e EPS
5% EPS Accretion (estimated)
1Q Results 2014 | cbbank.com
|
|
Our Growth Strategy
CVB Financial Corp.
1Q Results 2014 | cbbank.com
|
|
Our Vision
Citizens Business Bank will strive to become the dominant financial services company operating throughout the state of California, servicing the comprehensive financial needs of successful small to medium sized businesses and their owners.
1Q Results 2014 | cbbank.com
|
|
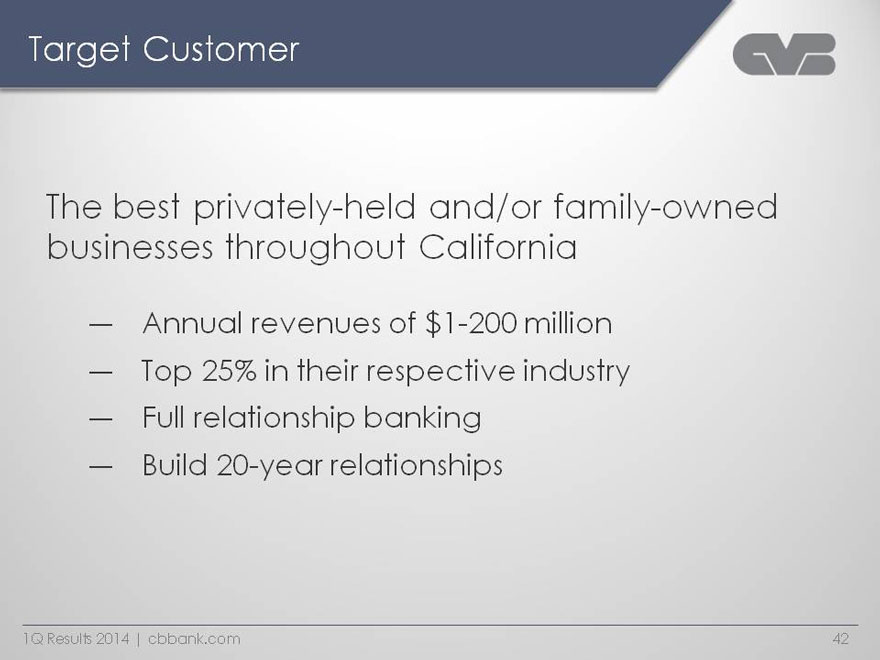
List Paragraph;Target Customer
The best privately-held and/or family-owned businesses throughout California
― Annual revenues of $1-200 million
― Top 25% in their respective industry
― Full relationship banking
― Build 20-year relationships
― 1Q Results 2014 | cbbank.com
|
|
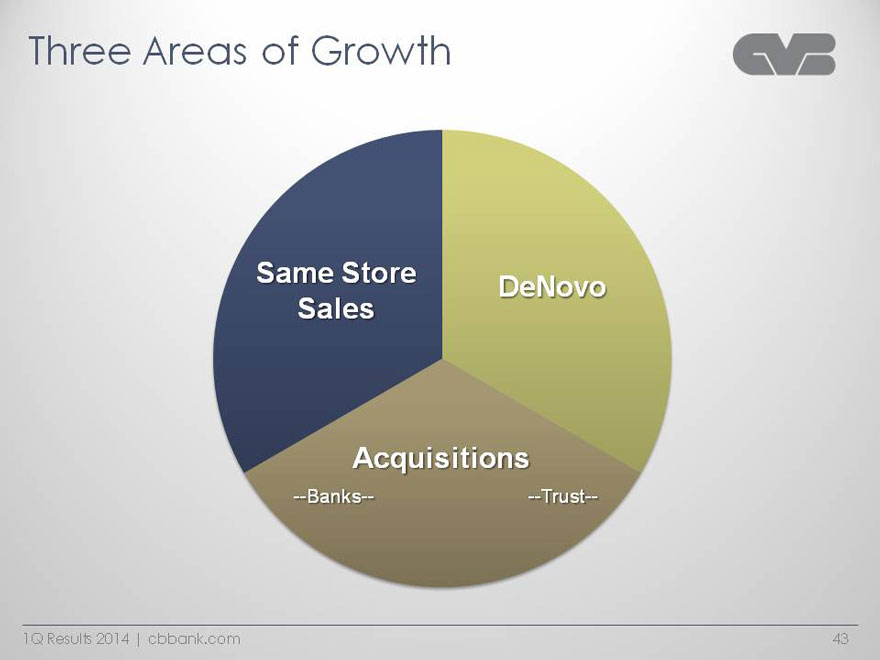
Three Areas of Growth
Sales
Same Store Sales 3
De Novo 3
Acquisitions 3
1Q Results 2014 | cbbank.com
|
|
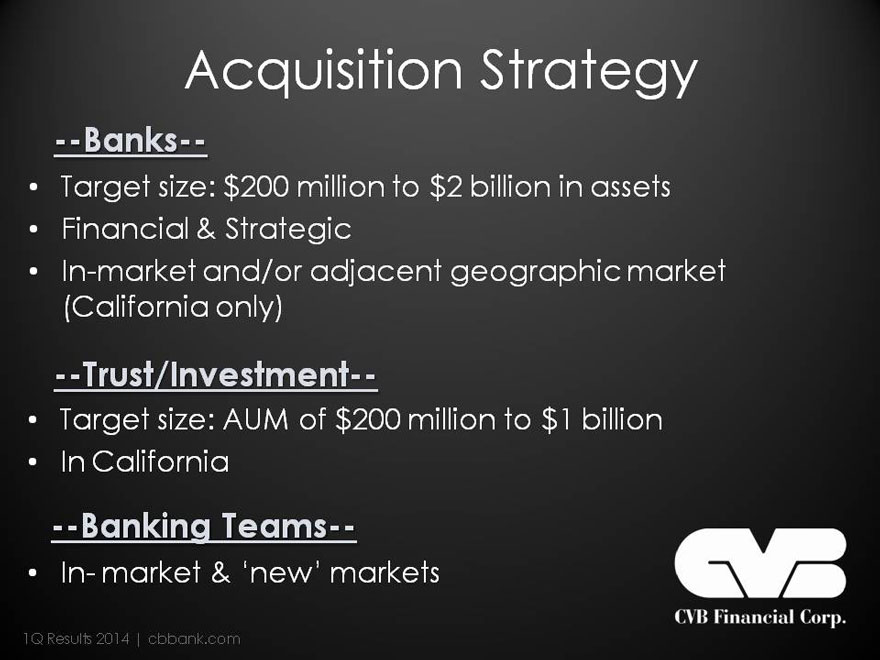
List Paragraph;Acquisition Strategy
--Banks—
• Target size: $200 million to $2 billion in assets
• Financial & Strategic
• In-market and/or adjacent geographic market (California only)
--Trust/Investment—
• Target size: AUM of $200 million to $1 billion
• In California
--Banking Teams—
In- market & ‘new’ markets
1Q Results 2014 | cbbank.com
|
|
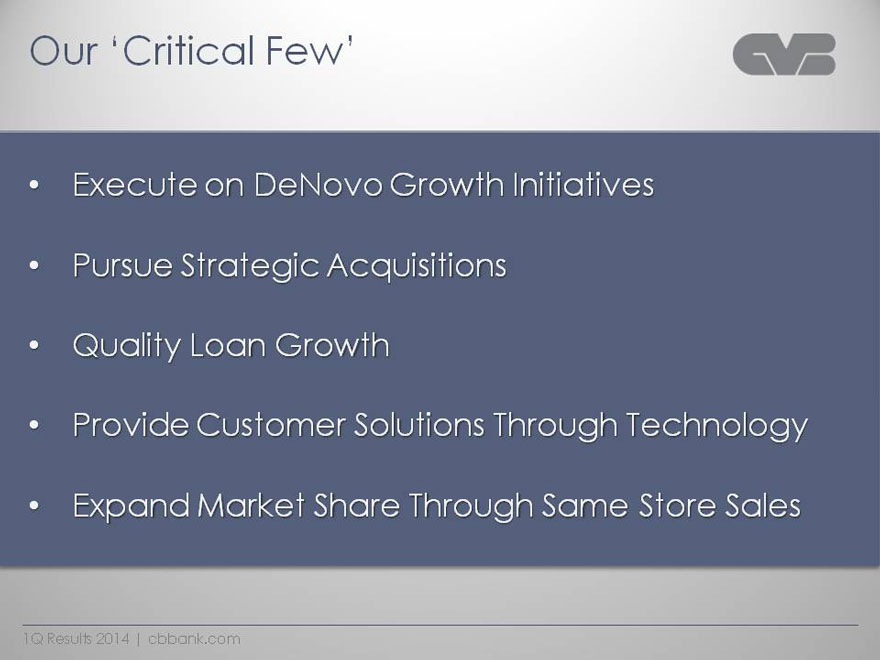
Our ‘Critical Few’
• Execute on DeNovo Growth Initiatives
• Pursue Strategic Acquisitions
• Quality Loan Growth
• Provide Customer Solutions Through Technology
Expand Market Share Through Same Store Sales
1Q Results 2014 | cbbank.com
|
|
CVB Financial Corp.
Copy of presentation at www.cbbank.com
1Q Results 2014 | cbbank.com