Attached files
| file | filename |
|---|---|
| 8-K - 8-K - BROADWIND, INC. | a14-11192_28k.htm |
| EX-99.1 - EX-99.1 - BROADWIND, INC. | a14-11192_2ex99d1.htm |
Exhibit 99.2
|
|
Broadwind Energy, Inc. Q1 2014 Investor Call Presentation April 30, 2014 © 2014 Broadwind Energy, Inc. All Rights Reserved. |

|
|
Industry Disclaimer and Forward-Looking Statements Broadwind obtained the industry and market data used throughout this presentation from our own research, internal surveys and studies conducted by third parties, independent industry associations or general publications and other publicly available information. Independent industry publications and surveys generally state that they have obtained information from sources believed to be reliable, but do not guarantee the accuracy and completeness of such information. Forecasts are particularly likely to be inaccurate, especially over long periods of time. We are not aware of any misstatements in the industry data we have presented herein, but estimates involve risks and uncertainties and are subject to change based on various factors beyond our control. This presentation includes various forward-looking statements related to future, not past, events. Statements in this presentation that are not historical are forward-looking statements. These statements are based on current expectations and we undertake no obligation to update these statements to reflect events or circumstances occurring after this presentation. Such statements are subject to various risks and uncertainties that could cause actual results to vary materially from those stated. Such risks and uncertainties include, but are not limited to: expectations regarding our business, end-markets, relationships with customers and our ability to diversify our customer base; the impact of competition and economic volatility on the industries in which we compete; our ability to realize revenue from customer orders and backlog; the impact of regulation on end-markets, including the wind energy industry in particular; the sufficiency of our liquidity and working capital; our restructuring plans and the associated cost savings; the ability to preserve and utilize our tax net operating loss carry-forwards; and other risks and uncertainties described in our filings with the Securities and Exchange Commission, including those contained in Part I, Item A “Risk Factors” of our Annual Reports on Form 10-K. This presentation contains non-GAAP financial information. We believe that certain non-GAAP financial measures may provide users of this financial information meaningful comparisons between current results and results in prior operating periods. We believe that these non-GAAP financial measures can provide additional meaningful reflection of underlying trends of the business because they provide a comparison of historical information that excludes certain infrequently occurring or non-operational items that impact the overall comparability. Non-GAAP financial measures should be viewed in addition to, and not as an alternative to, our reported results prepared in accordance with GAAP. Please see our earnings release dated as of April 30, 2014 for a reconciliation of certain non-GAAP measures presented in this presentation. 2 © 2014 Broadwind Energy, Inc. All rights reserved. 4/30/2014 |

|
|
Q1 2014 Highlights Business Highlights Revenue of $58.8M, up 29% from Q1 2013 Gross profit margin* of 9.1%, up 330 bp from Q1 2013 Operating loss reduced to $1.0M, from $4.5M in Q1 2013 EPS loss of $.07, improvement of $.25 per share from Q1 2013 Adj. EBITDA of $2.8M, more than double Q1 2013 4/30/2014 © 2014 Broadwind Energy, Inc. All rights reserved. 3 * Excluding Restructuring |
|
|
Orders and Backlog 4/30/2014 © 2014 Broadwind Energy, Inc. All rights reserved. 4 Orders – $M Pause in wind tower orders following surge in 2013; industrial weldment orders of $3.9M, primarily for 1 large customer Gearing orders down due to absence of large wind replacement gearing order in Q1 2013, partly offset by increased industrial orders Services ahead of Q1 2013, which included cancellation of a large drivetrain assembly project Order Backlog – $M Q1 2014 ending backlog of $267M Q1 2014 backlog up 58% from Q1 2013 ~90% of 2014 revenue shipped or in backlog at 3/31/14 Q1 2013 Q1 2014 Towers 80.5 3.9 Gears 11.7 8.3 Services (0.3) 3.6 Total 91.9 15.8 |
|
|
U.S. Wind Market Forecast – Long Term Bull Case PTC phase-out Natural gas prices increase to $6-7/MMBtu by 2018 3% reduction in levelized cost of wind energy Wind in RPS compliance increases 10.2 pp Electricity demand CAGR = 1.5%/year 65 GW of coal capacity retired 4 GW of wind capacity installed offshore Broadwind established as a strong player – despite PTC political uncertainty Bear Case PTC not renewed Natural gas prices $4-5/MMBtu through 2020 1% reduction in levelized cost of wind energy Wind in RPS compliance decreases 8.5 pp Electricity demand CAGR = 0.8%/year 35 GW of coal capacity retired 1.3 GW of wind capacity installed offshore 4/30/2014 © 2014 Broadwind Energy, Inc. All rights reserved. 5 Source: MAKE Consulting March 11, 2014 |

|
|
Natural Gas Driven Infrastructure 4/30/2014 © 2014 Broadwind Energy, Inc. All rights reserved. 6 $110B investment by chemical manufacturers and refineries 79 identified projects underway Large infrastructure components with a high % of industrial weldment work Broadwind developing relationships with EPC firms Investing in infrastructure to support weldments product line Nitrogen separation Liquid separation |
|
|
Gearing Update 4/30/2014 © 2014 Broadwind Energy, Inc. All rights reserved. 7 What Went Well Improved productivity by 7 pp from year-end Defect rate lower by 2 pp Gear manufacturer M&A activity generating some new opportunities with new customers Inventory reduced $3.0M from prior year Opportunities for Improvement On-time delivery slightly worse from year-end Qualification orders from new sales reps taking longer with new customers Labor negotiations underway Equipment downtime higher than previous quarter |
|
|
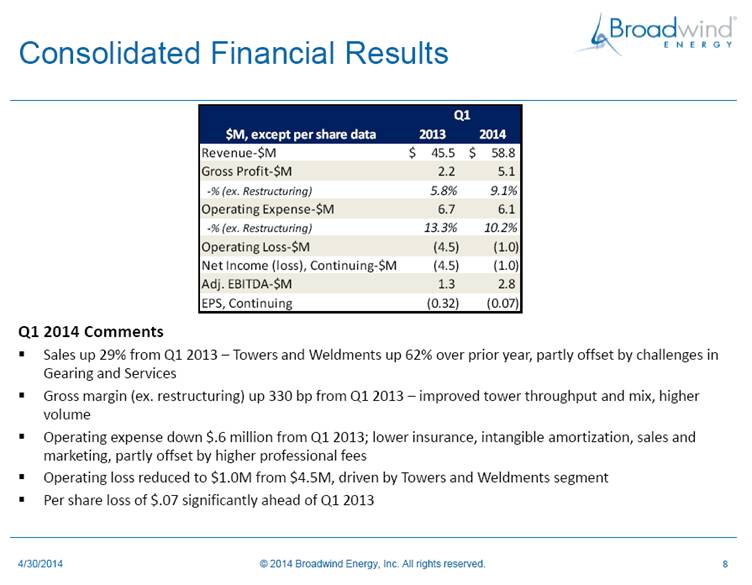
Consolidated Financial Results 4/30/2014 © 2014 Broadwind Energy, Inc. All rights reserved. 8 Q1 2014 Comments Sales up 29% from Q1 2013 – Towers and Weldments up 62% over prior year, partly offset by challenges in Gearing and Services Gross margin (ex. restructuring) up 330 bp from Q1 2013 – improved tower throughput and mix, higher volume Operating expense down $.6 million from Q1 2013; lower insurance, intangible amortization, sales and marketing, partly offset by higher professional fees Operating loss reduced to $1.0M from $4.5M, driven by Towers and Weldments segment Per share loss of $.07 significantly ahead of Q1 2013 $M, except per share data 2013 2014 Revenue-$M 45.5 $ 58.8 $ Gross Profit-$M 2.2 5.1 -% (ex. Restructuring) 5.8% 9.1% Operating Expense-$M 6.7 6.1 -% (ex. Restructuring) 13.3% 10.2% Operating Loss-$M (4.5) (1.0) Net Income (loss), Continuing-$M (4.5) (1.0) Adj. EBITDA-$M 1.3 2.8 EPS, Continuing (0.32) (0.07) Q1 |
|
|
Towers and Weldments 4/30/2014 © 2014 Broadwind Energy, Inc. All rights reserved. 9 First Quarter 2014 Highlights Tower volume increased 50% compared to weak Q1 2013 Short-term reduction in industrial weldment revenue from large mining customer Q1 2014 productivity increase from process improvements and simplified mix $700K in professional fees related to 2013 accounting investigation booked in current quarter Operating profit more than doubled due to higher volumes, improved sourcing and favorable mix Q1 2013 2014 Towers 72 108 Sections 284 352 Revenue-$M 29.9 48.3 Towers 26.0 46.7 Weldments 3.9 1.6 EBITDA-$M 3.5 6.7 Op. Income-$M 2.2 5.6 Op. Margin 7.2% 11.6% |
|
|
Gearing 4/30/2014 © 2014 Broadwind Energy, Inc. All rights reserved. 10 First Quarter 2014 Highlights Revenue affected by operational inefficiencies EBITDA down due to lower volumes Operating loss flat despite 18% reduction in revenue; lower non-cash charges and restructuring and focus on expense management Plant consolidation ~ 95% complete; 4 key machines remaining to be moved 16 new customers placed qualifying orders totaling $450K Sales force staff up 50% from 2013 level 2013 2014 Revenue-$M 10.7 8.8 EBITDA-$M 0.0 (0.8) Op. Loss-$M (3.0) (3.0) Op. Margin -27.8% -33.8% Q1 |
|
|
Services 4/30/2014 © 2014 Broadwind Energy, Inc. All rights reserved. 11 First Quarter 2014 Highlights Industry recovering – quoting activity up; orders up 51% from Q4 2013 Revenue down 67% from Q1 2013 – lower industrial drivetrain assembly work, partly offset by higher demand for blade repair work Operating loss worse due to lower revenue, partly offset by reductions in manufacturing space and other cost-containment efforts Q1 2013 2014 Revenue-$M 7.5 2.4 EBITDA-$M (0.0) (0.9) Op. Loss-$M (0.7) (1.3) Op. Margin -9.4% -54.9% |
|
|
Operating Working Capital 4/30/2014 © 2014 Broadwind Energy, Inc. All rights reserved. 12 3/31/14 operating working capital increased $14M from 12/31/13 to $19.6M 8% of annualized Q1 2014 sales Similar level of working capital projected throughout 2014; supply chain lengthening and deposits decreasing *Operating Working Capital = Trade Receivables + Inventories – Trade Payables – Customer Deposits |
|
|
Debt and Liquidity 4/30/2014 © 2014 Broadwind Energy, Inc. All rights reserved. 13 Net debt negative Debt and capital leases less than $5M More than half of outstanding debt is low or 0% interest rates from New Markets Tax Credit and other grant financing $20M credit line remained undrawn at 3/31/14 3/31/2014 $M AloStar line of credit - Long-term debt - Capital leases 1.9 Subtotal: debt ex. grants 1.9 Grants/tax credits 2.8 Total Debt 4.7 Less: Cash and related assets 11.5 Net Debt (6.8) |
|
|
2014 Financial Outlook 4/30/2014 © 2014 Broadwind Energy, Inc. All rights reserved. 14 2014 EPS Walk Q1 and Q4 are typically the weakest quarters 2014 revenue growth mainly from Towers Projecting to cross into profitability in Q2: first time in company history FY 2010 FY 2011 FY 2012 FY 2013 2014 E Q2 14 Q2 13 Revenue-$M 137.0 186.0 210.7 215.7 260-270 > 70 52.9 Gross Profit-$M 1.9 7.2 6.8 12.3 3.4 -% (ex. Restructuring) 1.4% 3.9% 4.0% 8.0% > 10% > 10% 8.7% Operating Expense-$M 30.4 27.6 24.1 25.6 5.9 -% (ex. Restructuring) 22.2% 14.6% 11.1% 11.3% < 10% < 10% 10.9% Impairment Exp. -$M 40.8 0 Operating Profit (Loss)-$M (69.2) (20.4) (17.3) (13.2) positive 1.5-2.5 (2.5) Adj. EBITDA-$M (9.2) (2.1) 5.5 10.3 > 16 5.0-6.0 3.5 EPS, Continuing - $ (6.56) (1.79) (1.27) (0.72) positive .10-.15 0.03 |
|
|
Click to edit Master title style Click to edit Master text styles Second level Third level Fourth level Fifth level Broadwind Energy is committed to helping customers maximize performance of their energy and infrastructure investments— quicker, easier and smarter. 15 © 2014 Broadwind Energy, Inc. All rights reserved. |