Attached files
| file | filename |
|---|---|
| 8-K - FORM 8-K - FIRST FINANCIAL BANCORP /OH/ | a8kearningsrelease1q14.htm |
| EX-99.1 - EXHIBIT 99.1 - FIRST FINANCIAL BANCORP /OH/ | a8k1q14earningsreleaseex991.htm |

First Financial Bancorp First Quarter 2014 Earnings Release Supplemental Information Exhibit 99.2

2 Certain statements contained in this release which are not statements of historical fact constitute forward-looking statements within the meaning of the Private Securities Litigation Reform Act. Examples of forward-looking statements include, but are not limited to, projections of revenues, income or loss, earnings or loss per share, the payment or non- payment of dividends, capital structure and other financial items, statements of plans and objectives of First Financial or its management or board of directors and statements of future economic performances and statements of assumptions underlying such statements. Words such as ‘‘believes,’’ ‘‘anticipates,’’ “likely,” “expected,” ‘‘intends,’’ and other similar expressions are intended to identify forward-looking statements but are not the exclusive means of identifying such statements. Management’s analysis contains forward-looking statements that are provided to assist in the understanding of anticipated future financial performance. However, such performance involves risks and uncertainties that may cause actual results to differ materially. These factors include, but are not limited to: economic, market, liquidity, credit, interest rate, operational and technological risks associated with the Company’s business; the effect of and changes in policies and laws or regulatory agencies (notably the recently enacted Dodd-Frank Wall Street Reform and Consumer Protection Act); management’s ability to effectively execute its business plan; mergers and acquisitions, including costs or difficulties related to the integration of acquired companies, including the recently announced proposed acquisitions of The First Bexley Bank, Insight Bank and Guernsey Bancorp; the Company’s ability to comply with the terms of loss sharing agreements with the FDIC; the effect of changes in accounting policies and practices; and the costs and effects of litigation and of unexpected or adverse outcomes in such litigation. Please refer to the Company’s Annual Report on Form 10-K for the year ended December 31, 2013, as well as its other filings with the SEC, for a more detailed discussion of these risks, uncertainties and other factors that could cause actual results to differ from those discussed in the forward-looking statements. Such forward-looking statements are meaningful only on the date when such statements are made, and the Company undertakes no obligation to update any forward-looking statement to reflect events or circumstances after the date on which such a statement is made to reflect the occurrence of unanticipated events. Forward Looking Statement Disclosure

3 Adjusted Pre-Tax, Pre-Provision Income Trend Adjusted pre-tax, pre-provision (“PTPP”) income represents income before taxes plus provision for all loans less FDIC loss sharing income and accelerated discount adjusted for significant non- operating and non-recurring items First quarter adjusted PTPP income decreased $3.8 million compared to the linked quarter due to declines in net interest income and noninterest income as well as an increase in operating expenses Noninterest income and expense variances were significantly impacted by seasonal factors $25,250 $26,429 $26,371 $27,429 $23,632 1.60% 1.68% 1.69% 1.75% 1.50% 1Q13 2Q13 3Q13 4Q13 1Q14 (Dollars in thousands) Adjusted PTPP Income Adjusted PTPP Income / Average Assets

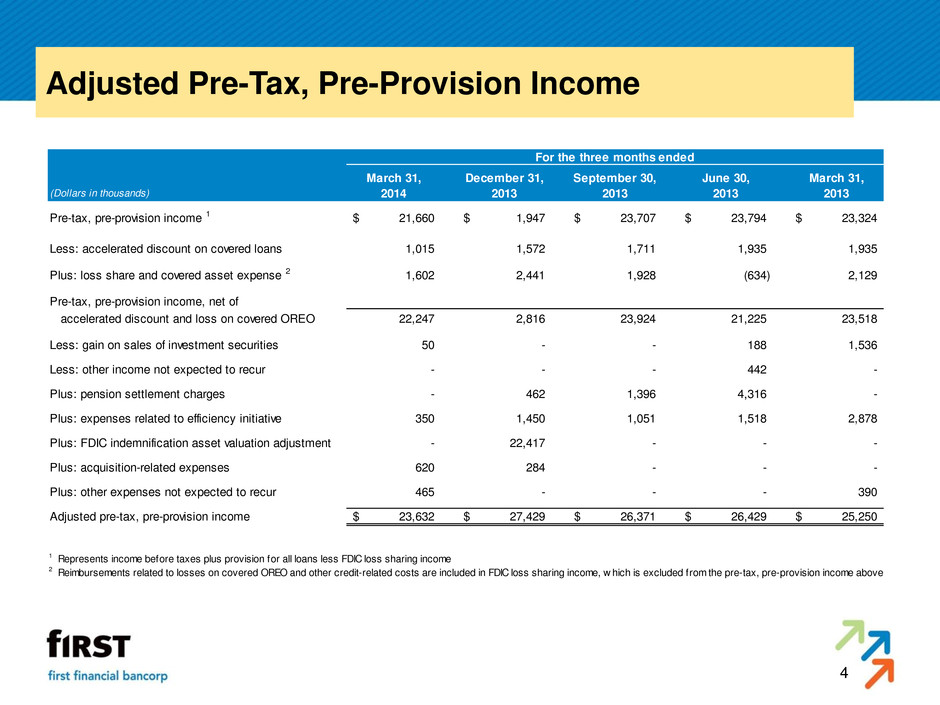
4 Adjusted Pre-Tax, Pre-Provision Income For the three months ended March 31, December 31, September 30, June 30, March 31, (Dollars in thousands) 2014 2013 2013 2013 2013 Pre-tax, pre-provision income 1 21,660$ 1,947$ 23,707$ 23,794$ 23,324$ Less: accelerated discount on covered loans 1,015 1,572 1,711 1,935 1,935 Plus: loss share and covered asset expense 2 1,602 2,441 1,928 (634) 2,129 Pre-tax, pre-provision income, net of accelerated discount and loss on covered OREO 22,247 2,816 23,924 21,225 23,518 Less: gain on sales of investment securities 50 - - 188 1,536 Less: other income not expected to recur - - - 442 - Plus: pension settlement charges - 462 1,396 4,316 - Plus: expenses related to efficiency initiative 350 1,450 1,051 1,518 2,878 Plus: FDIC indemnification asset valuation adjustment - 22,417 - - - Plus: acquisition-related expenses 620 284 - - - Plus: other expenses not expected to recur 465 - - - 390 Adjusted pre-tax, pre-provision income 23,632$ 27,429$ 26,371$ 26,429$ 25,250$ 1 Represents income before taxes plus provision for all loans less FDIC loss sharing income 2 Reimbursements related to losses on covered OREO and other credit-related costs are included in FDIC loss sharing income, w hich is excluded from the pre-tax, pre-provision income above

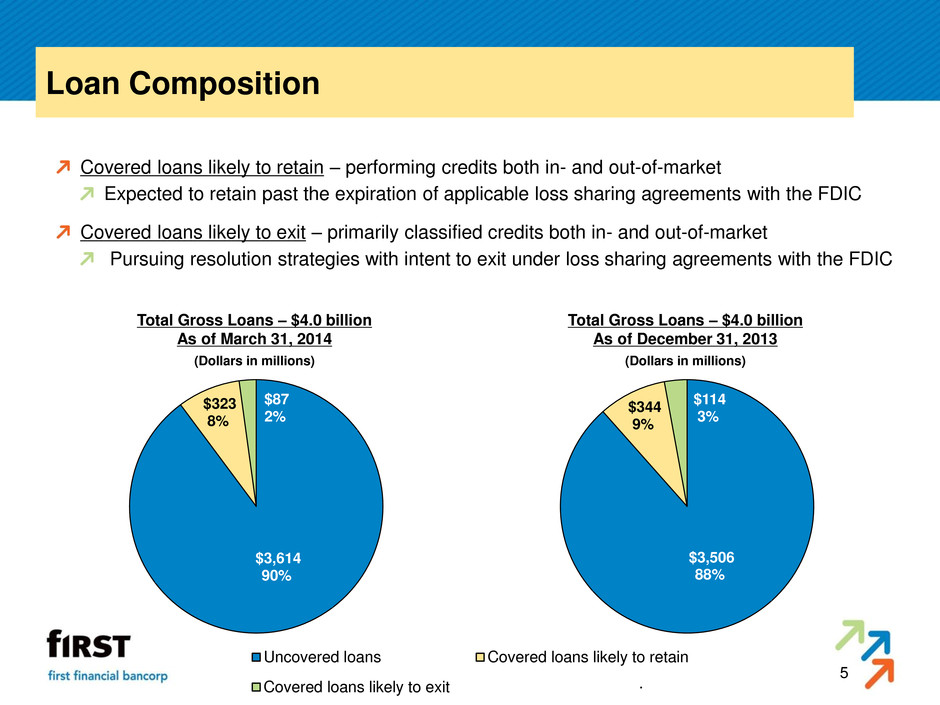
5 Loan Composition Total Gross Loans – $4.0 billion As of March 31, 2014 (Dollars in millions) Covered loans likely to retain – performing credits both in- and out-of-market Expected to retain past the expiration of applicable loss sharing agreements with the FDIC Covered loans likely to exit – primarily classified credits both in- and out-of-market Pursuing resolution strategies with intent to exit under loss sharing agreements with the FDIC Total Gross Loans – $4.0 billion As of December 31, 2013 (Dollars in millions) Uncovered loans Covered loans likely to retain Covered loans likely to exit $3,614 90% $323 8% $87 2% $3,506 88% $344 9% $114 3%

6 Loan Composition Total uncovered loans increased $108.6 million, or 12.6% on an annualized basis, compared to the linked quarter Growth driven by performance in the C&I / owner-occupied CRE, franchise and investment CRE Uncovered loan growth has exceeded covered loan decline for five of the past six quarters Total loans increased $60.1 million during the quarter 10.2% of total loans covered under FDIC loss share agreements 8.0% represent loans likely to retain 1 Includes unpaid principal balance of covered loans likely to retain and excludes loan mark / other of ($49.7) million associated with these loans Total Uncovered Loans and Covered Loans Likely to Retain – $3.9 billion1 As of March 31, 2014 (Dollars in millions) $932 23% $830 21% $575 15% $494 12% $101 3% $92 2% $443 11% $452 11% $68 2% C&I and owner occupied CRE Investment CRE Business banking Franchise Business credit Equipment finance Residential mortgage Home equity Other consumer

7 Credit Product Diversity During the first quarter, the Company’s comprehensive set of credit products produced solid loan growth driven though multiple channels led by C&I / owner-occupied CRE lending, franchise finance and investment CRE Category As of Percent As of Percent As of Percent (Dollars in thousands) December 31, 2008 of Portfolio December 31, 2013 1 of Portfolio March 31, 2014 1 of Portfolio Commercial and CRE $1,887,382 70.3% $2,263,709 58.8% $2,337,001 59.4% Franchise finance - 0.0% 477,616 12.4% 493,918 12.5% Business credit - 0.0% 102,234 2.7% 100,937 2.6% Equipment finance 50 0.0% 89,983 2.3% 91,940 2.3% Total commercial lending 1,887,432 70.3% 2,933,542 76.2% 3,023,796 76.8% Residential mortgage 383,599 14.3% 438,945 11.4% 443,236 11.3% Home equity 286,110 10.7% 460,293 12.0% 451,733 11.5% Other consumer 126,119 4.7% 70,968 1.8% 67,869 1.7% Total consumer lending 795,828 29.7% 970,206 25.2% 962,838 24.5% Loan mark / other - 0.0% (54,269) (1.4%) (49,710) (1.3%) Total loans $2,683,260 100.0% $3,849,479 100.0% $3,936,924 100.0% 1 Includes all uncovered loans and unpaid principal balance of covered loans likely to retain

8 Components of Covered Asset Credit Losses For the three months ended March 31, (Dollars in thousands) 2014 Description Net incremental impairment / (relief) for period ($8,328) Reduction / (increase) in expected cash flows related to certain loan pools net of prior period impairment relief / recapture Net charge-offs 6,136 Represents actual net charge-offs of the recorded investment in covered loans during the period 1 Provision for loan and lease losses - covered (2,192) (Gain) / loss on sale - covered OREO 33 Other credit-related expenses 2 1,524 Total gross credit losses ($635) FDIC loss sharing income ($508) Represents receivable due from the FDIC on estimated credit (Noninterest income) losses; calculated as approximately 80% of gross credit losses related to covered assets ($127) Difference between these two amounts represents actual credit costs for the period 1 Investment in covered loans originally recorded at less than unpaid principal balance to reflect anticipated credit losses at time of acquisition 2 Represents credit related expenses of $1.6 million net of $45 thousand of rental income on covered OREO properties $(1,846) $1,388 $(250) $(127) 2Q13 3Q13 4Q13 1Q14 Covered Asset Credit Losses

First Financial Bancorp First Quarter 2014 Earnings Release Supplemental Information
