Attached files
| file | filename |
|---|---|
| 8-K - 8-K - CARPENTER TECHNOLOGY CORP | a14-11118_28k.htm |
Exhibit 99.1
|
|
Fiscal Year 2014 3rd Quarter Earnings Call April 24, 2014 |

|
|
2 Forward-Looking Statements This presentation contains forward-looking statements within the meaning of the Private Securities Litigation Act of 1995. These forward-looking statements are subject to risks and uncertainties that could cause actual results to differ from those projected, anticipated or implied. The most significant of these uncertainties are described in Carpenter’s filings with the Securities and Exchange Commission including its annual report on Form 10-K for the year ended June 30, 2013, 10Qs for the quarters ended September 30, 2013 and December 31, 2013 and the exhibits attached to those filings. They include but are not limited to: (1) the cyclical nature of the specialty materials business and certain end-use markets, including aerospace, defense, industrial, transportation, consumer, medical, and energy, or other influences on Carpenter’s business such as new competitors, the consolidation of competitors, customers, and suppliers or the transfer of manufacturing capacity from the United States to foreign countries; (2) the ability of Carpenter to achieve cash generation, growth, profitability, cost savings, productivity improvements or process changes; (3) the ability to recoup increases in the cost of energy, raw materials, freight or other factors; (4) domestic and foreign excess manufacturing capacity for certain metals; (5) fluctuations in currency exchange rates; (6) the degree of success of government trade actions; (7) the valuation of the assets and liabilities in Carpenter’s pension trusts and the accounting for pension plans; (8) possible labor disputes or work stoppages; (9) the potential that our customers may substitute alternate materials or adopt different manufacturing practices that replace or limit the suitability of our products; (10) the ability to successfully acquire and integrate acquisitions; (11) the availability of credit facilities to Carpenter, its customers or other members of the supply chain; (12) the ability to obtain energy or raw materials, especially from suppliers located in countries that may be subject to unstable political or economic conditions; (13) Carpenter’s manufacturing processes are dependent upon highly specialized equipment located primarily in facilities in Reading, Latrobe and Athens for which there may be limited alternatives if there are significant equipment failures or catastrophic event; and (14) Carpenter’s future success depends on the continued service and availability of key personnel, including members of the executive management team, management, metallurgists and other skilled personnel and the loss of these key personnel could affect Carpenter’s ability to perform until suitable replacements are found. Any of these factors could have an adverse and/or fluctuating effect on Carpenter’s results of operations. The forward-looking statements in this document are intended to be subject to the safe harbor protection provided by Section 27A of the Securities Act of 1933, as amended, and Section 21E of the Securities Exchange Act of 1934, as amended. Carpenter undertakes no obligation to update or revise any forward-looking statements. Non-GAAP Financial Measures Some of the information included in this presentation is derived from Carpenter’s consolidated financial information but is not presented in Carpenter’s financial statements prepared in accordance with U.S. Generally Accepted Accounting Principles (GAAP). Certain of these data are considered “non-GAAP financial measures” under SEC rules. These non-GAAP financial measures supplement our GAAP disclosures and should not be considered an alternative to the GAAP measure. Reconciliations to the most directly comparable GAAP financial measures and management’s rationale for the use of the non-GAAP financial measures can be found in the Appendix to this presentation. Cautionary Statement |

|
|
3rd Quarter FY14 Summary Bill Wulfsohn President and Chief Executive Officer 3 |

|
|
Q3 earnings significantly impacted by weather related expenses Large increase in energy costs due to temporary price spikes Excluding these unusual expenses, operating margins were up 120 basis points sequentially Specialty Alloys Operations (SAO) volume up 12% vs. Q2-14 Performance Engineered Products (PEP) drove operational improvements resulting in income improvement Well positioned for future growth Q3 sales back-log up 19% from Q2-14 Lead times are extending Athens now shipping commercial product Positive free cash flow to begin in Q4-14 3rd Quarter FY14 Summary 4 |

|
|
Aerospace & Defense 202.5 43% -6% +14% Tons were flat versus the prior year but higher sequentially Revenue per ton was down due to greater sales volume of structural component materials and continued demand weakness for nickel engine and fastener material Titanium fastener revenues up 25 percent year-over-year (YOY) Energy 72.5 16% +2% +12% Directional rig count grew 5% vs. same quarter last year Energy tons were up 10% YOY but revenue per ton was down due to softer demand for oil and gas completion materials Amega West increased sales, primarily driven by drill collar rentals Medical 28.2 6% +11% +26% YOY sales growth was driven by: Stabilizing demand for orthopedic and surgical devices Increased distributor demand for titanium materials Transpor-tation 30.6 7% +8% +8% North American light vehicle sales continue to rise Carpenter results benefit from strong demand for materials used in the next generation of fuel delivery systems Industrial & Consumer 98.0 21% +1% +10% Demand for Carpenter materials has been strong in: Plant and equipment applications Materials used in bridge infrastructure projects 5 3Q FY14 End Market Highlights Q3-14 Net Sales ex. Sur ($M)* vs. Q3-13 Comments *Excludes sales through Carpenter’s Distribution businesses vs. Q2-14 Backlog & volume up, mix improving but will take time as lead times are now extended |

|
|
Tony Thene Senior Vice President and Chief Financial Officer 6 3rd Quarter FY14 Financial Overview |

|
|
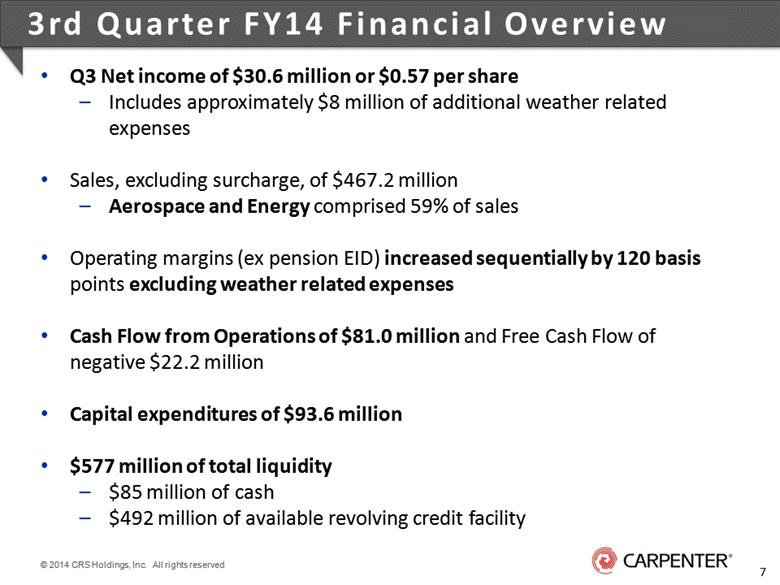
Q3 Net income of $30.6 million or $0.57 per share Includes approximately $8 million of additional weather related expenses Sales, excluding surcharge, of $467.2 million Aerospace and Energy comprised 59% of sales Operating margins (ex pension EID) increased sequentially by 120 basis points excluding weather related expenses Cash Flow from Operations of $81.0 million and Free Cash Flow of negative $22.2 million Capital expenditures of $93.6 million $577 million of total liquidity $85 million of cash $492 million of available revolving credit facility 7 3rd Quarter FY14 Financial Overview |
|
|
Income Statement Summary Q3-14 includes approximately $8 million of weather related expenses 8 * Detailed schedule included in Non-GAAP Schedules in Appendix $ Millions, except pounds and per-share amounts Q3-13 Q2-14 Q3-14 Sequential Change Pounds ('000) 71,768 67,378 77,580 10,202 Net Sales 581.4 503.5 566.3 62.8 Sales ex. Surcharge * 471.2 414.6 467.2 52.6 Gross Profit 101.0 95.4 94.5 (0.9) % of Sales ex. Surcharge 21.4% 23.0% 20.2% -2.8% pts. Selling, General and Administrative Expenses 48.0 47.9 45.0 (2.9) % of Sales ex. Surcharge 10.2% 11.6% 9.6% -2.0% pts. Operating Income 53.0 47.5 49.5 2.0 % of Sales ex. Surcharge 11.2% 11.5% 10.6% -0.9% pts. Operating Income ex. Pension EID * 61.0 51.3 55.5 4.2 % of Sales ex. Surcharge 12.9% 12.4% 11.9% -0.5% pts. Effective Tax Rate 33.1% 33.6% 33.8% 0.2% Net Income 32.9 29.5 30.6 1.1 Diluted Earnings Per Share $0.62 $0.55 $0.57 $0.02 |

|
|
9 Free Cash Flow Summary The clerical accuracy of certain amounts may be impacted due to rounding. At cash flow generation inflection point – moving to positive FCF by Q4-14 $ Millions Q3-13 YTD Q1 Q2 Q3 Q3-14 YTD Net Income + Non-cash Items 273 76 69 76 221 Inventory (42) (47) (12) (1) (61) Other working capital (79) 12 (32) 8 (11) Total Net Working Capital (121) (35) (44) 7 (72) Pension Plan Contributions - Required (68) (1) (2) (2) (5) Net Cash from Operating Activities 84 40 23 81 144 Before Discretionary Pension Plan Contributions Pension Plan Contribution - Discretionary (75) 0 0 0 0 Net Cash from Operating Activities 9 40 23 81 144 Purchases of property, equipment and software (201) (90) (114) (94) (298) Dividends paid (29) (9) (10) (9) (29) Other 0 (1) 1 0 Free Cash Flow (221) (60) (100) (22) (183) |

|
|
SAO Business Update Andy Ziolkowski Senior Vice President Commercial, Specialty Alloys Operations 10 |
|
|
Q3 Operating Results Q3 Business Highlights Q4-14 Outlook Operating income impacted by additional $8m of energy costs due to weather Excluding weather impact, operating margin was in line with Q2 Volume was up in all markets except Aerospace (which was flat) Aerospace and energy both had a weaker mix on a sales $ per ton basis Back-log up 19% with continued increase in order intake rate relative to Q2 Sales mix trending similar to Q3 Recent price increases will have an impact beginning in FY15 Athens facility fully operational and beginning customer qualification process Challenging year-over-year comparison due to strong Q4-13 mix SAO Segment Summary 11 SAO Segment Q3-14 Results and Q4-14 Outlook Q3-13 Q2-14 Q3-14 vs LY vs Q2 Pounds ('000) 69,028 66,734 74,836 5,808 8,102 Sales ex. Surcharge ($M) 360.1 316.6 351.4 (8.7) 34.8 Op Inc ex. EID ($M) 59.6 54.4 51.6 (8.0) (2.8) % of Sales ex. Surcharge 16.6% 17.2% 14.7% -1.9% -2.5% |

|
|
PEP Business Update Gary Heasley Senior Vice President Performance Engineered Products 12 |

|
|
Q3 Operating Results Q3 Business Highlights Q4 -14 Outlook Sales improved across most businesses Increased demand for titanium fastener material Strong order activity through Distribution Improved demand for down-hole drilling tools Mix and operational improvements drive OI Increased rental revenue and titanium sales Higher production activity Backlogs above prior year and growing Demand for Aerospace fastener material expected to remain strong Drilling activity expected to remain strong Operational improvements remain key focus in areas with low margins Competitive actions in certain markets continue to pressure margins on some products PEP Segment Summary 13 PEP Segment Q3-14 Results and Q4-14 Outlook Q3-13 Q2-14 Q3-14 vs LY vs Q2 Pounds ('000) 3,338 2,683 3,108 (230) 425 Sales ex. Surcharge ($M) 124.0 113.3 129.8 5.8 16.5 Op Inc ex. EID ($M) 11.4 8.6 13.1 1.7 4.5 % of Sales ex. Surcharge 9.2% 7.6% 10.1% 0.9% 2.5% |

|
|
Forward Outlook Bill Wulfsohn President and Chief Executive Officer 14 |

|
|
15 Athens Facility Update Integrated Manufacturing Primary Melting supplied from Reading and Latrobe Technical support from all locations highly involved CRS employees operating all equipment Strong focus on automation and process control Great leverage potential across the entire system Construction/Start-up 90% of project spend completed Front-end operations producing on a stable and planned basis Finishing operations moving from start-up into production Have successfully processed orders through each key area and shipped commercial product Certification/Qualification Accreditations: ISO17025 – certified NADCAP Met Lab and NDT - certified AS9100 – certified Customer audits/approvals underway |

|
|
3rd Quarter FY14 Summary 16 Q3 Highlights Q3 earnings significantly impacted by weather related expenses Large increase in energy costs due to temporary price spikes Excluding these unusual expenses, operating margins were up 120 basis points sequentially SAO volume up 12% vs. Q2 PEP drove operational improvements resulting in operating income improvements Well positioned for future growth Q3 sales back-log up 19% from Q2 Lead times extending Athens now shipping commercial product Forward Outlook Aerospace and Energy demand recovery to continue into FY15 PEP operational improvements on track to yield additional gains Athens operational – pursuing customer qualifications Volume and margin improvement opportunity as fixed investment in place – but will be gradual Expect positive free cash flow in Q4-14 Strong balance sheet and flexibility to redeploy cash |

|
|
Appendix of Non-GAAP Schedules 17 |

|
|
18 Preliminary Non-GAAP Unaudited Schedules (in millions) OPERATING MARGIN EXCLUDING SURCHARGE AND Three Months Ended Nine Months Ended PENSION EARNINGS, INTEREST AND DEFERRALS December 31, March 31, 2014 2013 2013 2014 2013 Net sales 566.3 $ 581.4 $ 503.5 $ 1,568.4 $ 1,659.9 $ Less: surcharge revenue 99.1 110.2 88.9 274.5 317.3 Consolidated net sales excluding surcharge 467.2 $ 471.2 $ 414.6 $ 1,293.9 $ 1,342.6 $ Operating income 49.5 $ 53.0 $ 47.5 $ 152.8 $ 167.3 $ Pension earnings, interest & deferrals 6.0 8.0 3.8 15.8 23.9 Operating income excluding pension earnings, interest and deferrals 55.5 $ 61.0 $ 51.3 $ 168.6 $ 191.2 $ Operating margin excluding surcharge and pension earnings, interest and deferrals 11.9% 12.9% 12.4% 13.0% 14.2% March 31, Management believes that removing the impacts of raw material surcharges from operating margin provides a more consistent basis for comparing results of operations from period to period. Management believes that excluding the impact of pension earnings, interest and deferrals, which may be volatile due to changes in the financial markets, is helpful in analyzing the true operating performance of the Company. |

|
|
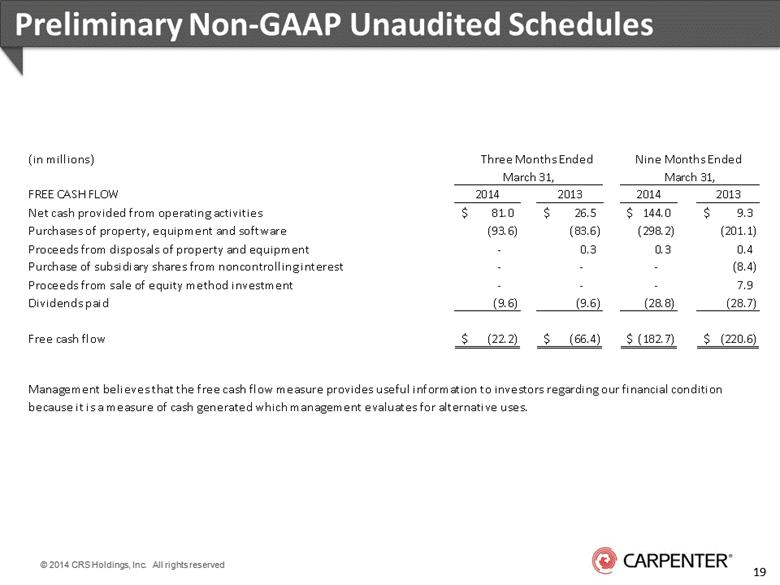
19 Preliminary Non-GAAP Unaudited Schedules (in millions) Three Months Ended Nine Months Ended March 31, FREE CASH FLOW 2014 2013 2014 2013 Net cash provided from operating activities 81.0 $ 26.5 $ 144.0 $ 9.3 $ Purchases of property, equipment and software (93.6) (83.6) (298.2) (201.1) Proceeds from disposals of property and equipment - 0.3 0.3 0.4 Purchase of subsidiary shares from noncontrolling interest - - - (8.4) Proceeds from sale of equity method investment - - - 7.9 Dividends paid (9.6) (9.6) (28.8) (28.7) Free cash flow (22.2) $ (66.4) $ (182.7) $ (220.6) $ Management believes that the free cash flow measure provides useful information to investors regarding our financial condition because it is a measure of cash generated which management evaluates for alternative uses. March 31, |