Attached files
| file | filename |
|---|---|
| EX-99.1 - EX-99.1 - HD SUPPLY, INC. | a14-8756_1ex99d1.htm |
| 8-K - 8-K - HD SUPPLY, INC. | a14-8756_18k.htm |
Exhibit 99.2
|
|
2013 Fourth-Quarter and Full-Year Performance March 25, 2014 Financial Results and Company Highlights |

|
|
Disclaimers Forward-Looking Statements This presentation includes “forward-looking statements” within the meaning of Section 27A of the Securities Act and Section 21E of the Exchange Act. Forward-looking statements are subject to known and unknown risks and uncertainties, many of which may be beyond our control. We caution you that the forward-looking information presented herein is not a guarantee of future events, and that actual events may differ materially from those made in or suggested by the forward-looking information contained in this presentation. In addition, forward-looking statements generally can be identified by the use of forward-looking terminology such as “may,” “plan,” “seek,” “comfortable with,” “will,” “expect,” “intend,” “estimate,” “anticipate,” “believe” or “continue” or the negative thereof or variations thereon or similar terminology. A number of important factors could cause actual events to differ materially from those contained in or implied by the forward-looking statements, including those factors discussed in our filings with the U.S. Securities & Exchange Commission’s (the “SEC”), including our annual report on Form 10-K for the year ended February 2, 2014, filed on March 24, 2014, which can be found at the SEC’s website www.sec.gov. Any forward-looking information presented herein is made only as of the date of this presentation, and we do not undertake any obligation to update or revise any forward-looking information to reflect changes in assumptions, the occurrence of unanticipated events, or otherwise. Non-GAAP Financial Measures HD Supply supplements its reporting net income (loss) with non-GAAP measurements, including Adjusted EBITDA, Adjusted net income (loss) and Adjusted net income (loss) per share. This supplemental information should not be considered in isolation or as a substitute for the GAAP measurements. Additional information regarding Adjusted EBITDA, Adjusted net income (loss) and Adjusted net income (loss) per share referred to in this presentation is included at the end of this presentation under “Reconciliation of Non-GAAP Measures.” |
|
|
FY’13 Performance Highlights +9% Sales Growth Versus Prior Year1 (“VPY”); +8% Organic Sales Growth VPY1 +21% Adjusted EBITDA Growth VPY1 +600 BPs Versus Market Estimate2 $70M of Investment in Strategic Growth Initiatives Across 5 Growth Strategies: Sell More to Existing Customers (i.e., Share of Wallet) Introduce New Products and Services Expand the Channels to Reach Our Customers (e.g., Internet, Catalog, Mobility) Acquire New Customers Enter New Geographies (i.e., Open New Locations) +600 BPs of Growth in Excess of Estimated Market Growth 1 Prior year comparison adjusts Fiscal 2012 to eliminate impact of 53rd week and the Crown Bolt contract amendment (see slide 5) 2 Management estimate; market estimate is management estimate of the growth of our markets based on multiple quantitative and qualitative inputs Note: “VPY” denotes versus prior year |
|
|
Q4’13 Performance Highlights +7% Sales Growth Versus Prior Year1 (“VPY”) +31% Adjusted EBITDA Growth VPY1 Executed Proactive Cost Structure Alignment to Enhance Growth Momentum Encouraging “Green Shoots” of Construction Activity Despite Weather Impact Business Unit Performance VPY1: Facilities Maintenance: +7% Sales, +20% Adjusted EBITDA +500 BPs Versus Estimated Market Growth2 Waterworks: +4% Sales, +15% Adjusted EBITDA +300 BPs Versus Estimated Market Growth2 Power Solutions: +6% Sales, +27% Adjusted EBITDA +700 BPs Versus Estimated Market Growth2 White Cap: +11% Sales, +100% Adjusted EBITDA +800 BPs Versus Estimated Market Growth2 “Green Shoots” of Activity Offset by Weather 1 Prior year comparison adjusts Fiscal 2012 to eliminate impact of 53rd week and the Crown Bolt contract amendment 2 Management estimate; market estimate is management estimate of the growth of our markets based on multiple quantitative and qualitative inputs Note: “VPY” denotes versus prior year |
|
|
FY’12 Adjustments for Comparability Adjustments for Crown Bolt Amendment and 53rd Week 1 See reconciliation on slide 27 $7,943M FY’12 (147) (41) $7,755M 53rd Week Crown Bolt Amendment FY’12 Adj.1 Net Sales ($ in millions) $685M (14) Adj. EBITDA $630M (41) FY’12 53rd Week Crown Bolt Amendment FY’12 Adj.1 |
|
|
FY’13 Performance Relative to Guidance Adjustments for Canadian Discontinued Operations $8,487M As Reported $82M Canadian Disposal Adjusted Sales ($ in millions) Guidance $8,575M $8,500M Adj. EBITDA $764M ($4M) Guidance $760M $750M Adj. Net Income Per Diluted Share1 As Reported Adjusted $0.58 ($0.02) Guidance $0.58M $0.52M As Reported Adjusted $8,569M $760M $0.56 1 Fiscal 2013 Adjusted Net Income per Share guidance range and actuals both include a fully diluted weighted average share count of 172 million Canadian Disposal Canadian Disposal |
|
|
FY’13 Financial Results $7.8B $8.5B +9% ’12 Adj.1 Sales ’13 Adj.2 Gross Profit Gross Margin % Adj. EBITDA4 Operating Income Op. Income % VPY3 $2,217M $2,475M 28.6% 29.2% $630M $764M $271 $500M 8.1% 9.0% 3.5% 5.9% +12% +60BPs +85% +240BPs +90BPs +21% +9% Sales Growth; +21% Adjusted EBITDA Growth in FY’13 ($ in millions, unless otherwise noted) ($129M) $99M +$228M FY’13 Sales Growth From: ~$500M of Growth Initiatives ~$150M of End Market Growth ~$105M of Acquisitions 2.3x FY’13 Operating Leverage 1 Adjusted to eliminate the impact of the 53rd week and Crown Bolt contract amendment (see slide 27) 2 Adjusted to include impact of Restructuring 3 Comparisons to FY’12 adjusted to eliminate the impact of the 53rd week and Crown Bolt contract amendment (see slide 5) 4 See appendix slides 29 and 30 for a reconciliation of Adjusted EBITDA and Adjusted Net Income to Net Income Adj. EBITDA % Adj. Net Income4 |
|
|
Q4’13 Financial Results $1.8B $1.9B +7% Gross Profit Gross Margin % Operating Income Adj. EBITDA % Op. Income % $518M $563M 28.7% 29.2% $118M $154M $28M $87M 6.5% 8.0% 4.5% +9% +50BPs +150BPs +31% +7% Sales Growth; +31% Adjusted EBITDA Growth in FY’13 ($ in millions, unless otherwise noted) ($80M) $ – M +$80M $12M Restructuring Charge in Q4’13: $3M of Power Solution Inventory Liquidation (COGS) $9M Reflected on Restructuring Line of Income Statement +211% Sales 1 Adjusted to eliminate the impact of the 53rd week and Crown Bolt contract amendment (see slide 26) 2 Adjusted to include impact of Restructuring 3 Comparisons to FY’12 adjusted to eliminate the impact of the 53rd week and Crown Bolt contract amendment (see slide 5) 4 See appendix slides 29 and 30 for a reconciliation of Adjusted EBITDA and Adjusted Net Income to Net Income ’12 Adj1 Adj. EBITDA4 VPY3 Adj. Net Income4 1.6% +290BPs ’13 Adj.2 |
|
|
Segment Performance Adj. EBITDA Operating Leverage ($ in millions) Sales Growth and Operating Leverage 1 Excludes impact of 53rd week (see slide 28) 2 Comparisons to FY’12 adjusted to eliminate the impact of the 53rd week (see slide 28) VPY2 +14% FY ’13 $2,331M $434M 1.6x 4Q ’13 $522M $90M +7% +20% VPY2 +12% +28% $470M $30M VPY2 +4% +15% Sales Sales $2,227M $173M 2.4x . $381M +9% $2,141M VPY2 $75M $486M FY ’13 4Q ’13 FY ’121 4Q ’121 $135M $1,992M $26M $451M FY ’121 4Q ’121 |

|
|
Segment Performance ($ in millions) Sales Growth and Operating Leverage +5% +9% $1,843M $76M 1.6x $453M $19M +6% +27% +12% +44% $1,293M $79M 3.7x . $295M $14M +11% +100% Sales Sales VPY2 FY'13 4Q'13 VPY2 FY'121 $70M $1,751M VPY2 4Q'121 $15M $428M FY'13 4Q'13 FY'121 4Q'121 $55M $1,157M $7M $266M VPY2 Adj. EBITDA Operating Leverage 1 Excludes impact of 53rd week (see slide 28) 2 Comparisons to FY’12 adjusted to eliminate the impact of the 53rd week (see slide 28) |

|
|
Liquidity and Capital Structure Q4’13 Debt Balances Sec. ABL Sec. Term Loan Sec. 1st Lien Notes Sec. 2nd Lien Notes Unsec. Sr. Notes Unsec. Sr. Notes $360 (Adjusted for Feb. ’14 Term Loan Amendment) 1,268 675 1,000 1,275 6/28/18 6/28/18 4/15/19 4/15/20 7/15/20 7/15/20 Gross Debt Cash Net Debt $5,429 115 $5,544 Facility Balance2 Maturity 1 Estimated cash taxes for future periods 2 Net of original issue discount and premium 3 Represents the stated rate of interest, without including the effect of discounts of premiums $5.4B Net Debt at the End of Q4’13 $994M Liquidity at the End of Q4’13 No Material Bank Debt Maturities Until 2018 and No Note Maturities Until 2019 Re-priced and Extended Maturity of Term Loan; ~$5M of Annual Interest Expense Savings (after FYE ’13) Favorable Tax Asset with Significant Gross Federal Net Operating Loss Carryforwards of $2.3B ($1B Tax-affected Amount of Federal and State NOLs) Cash Taxes of: $8M in FY’13 $10M1 to $20M1 Estimated for FY’14 $131M Capital Expenditures During FY’13 (1.5% of Sales) $994M of Liquidity with No Near Term Debt Maturities Positioned for Growth ($ in millions, unless otherwise noted) 1.66% 4.50% 8.125% 11.0% 11.5% 7.5% Interest Rate3 966 4.00% |
|
|
Q4’13 and February ’14 Sales (%) HD Supply Average Daily Sales Growth VPY 4% February Average Daily Sales Growth ’13 Selling Days Q3’13 4.1% ’14 Selling Days 3.9% 64 14.5% 0.9% 10.7% 64 7.2% Nov. Jan. Q4’13 Feb. 8.1% 18 13.7% 7.4% 9.2% 18 9.3% 0.6% 19 -7.5% -2.8% 2.3% 19 -2.2% 10.6% 24 6.0% 10.4% 19.9% 24 8.6% 7.2% 61 4.4% 5.6% 11.2% 61 5.7% 9.8% 20 2.2% -3.9% 9.4% 20 ’12 Selling Days 64 18 20 28 66 20 Dec. |

|
|
’14 End Market Outlook Cautious Optimism Preliminary Perspective1 Residential Infrastructure & Other MRO Municipal Power 1 Management estimates (~20%) (~80%) (~25%) (~50%) (~25%) (~25%) (~75%) (~100%) (Approximate End Market Exposure1) FY ’14 End Markets Primary End Market Mid-teens Growth Single-digit Growth Down Low Single-digits to Flat +1% to +2% Non- Residential |

|
|
Controllable Execution Committed to Deliver +300 Basis Points Above Market Execution Focus LT Growth Target1 Share of Wallet (Sales Force Effectiveness); New Products and Services (Category Management) Analyze and Prioritize Growth Investments (BPs Above BU End Market Estimate) +200 - +500 BPs Share of Wallet (Sales Force Effectiveness); New Products and Services (Category Management) SG&A Reductions Given Market Realities and Inventory Alignment Share of Wallet (Sales Force Effectiveness); New Products and Services (Category Management); New Locations Refresh Priority Market Sales Force Effectiveness Relevant Experience to Execute in Uncertain Markets Strict Accountability, Deep Talent Base Executing Structural Cost Reductions and Growth Intensity New Products and Services (Adjacent Offerings); New Locations Acquire New Customers (Talent Acquisition) 1 Long-term average growth target based on management estimates and aspirations “Non-Residential” “Industry Transformation” “Pent-Up Demand” “MRO” “Focused Execution” +300 BPs +200 - +500 BPs +200 - +500 BPs 0 - +200 BPs |

|
|
’14 Operating Leverage Framework 1.5x – 2.0x FY’14 Operating Leverage Target; 11% – 14% Implied FY’14 Adjusted EBITDA Growth HDS Market Growth1 :: Illustrative :: 4% + Above Market Growth2 300BPs = End Market Growth Controllable Execution Annual Sales Growth Illustrative Adj. EBITDA Growth Adjusted EBITDA Growth 14.0% HDS Market Growth 10.5% Above Market Growth 7% 2.0x 1.5x Operating Leverage Target3 1 Management estimates 2 Long-term average growth target based on management estimates and aspirations 3 Operating Leverage defined as the percentage change in Adjusted EBITDA divided by the percentage change in Sales; target based on management estimates and aspirations |

|
|
Q1’14 Guidance 9% – 15% Implied Q1’14 Adjusted EBITDA Growth $2,175M $2,100M $165M $2,048M $190M $180M VPY Q1’13 Q1’14 Q1’13 Q1’14 Q1’13 Q1’14 Net Sales Adj. EBITDA Adj. Net Income Per Diluted Share1 +6% +3% VPY 1 Fiscal 2014 Adjusted Net Income per Share range assumes a fully diluted weighted average share count of 198 million +15% +9% $0.21 $0.14 nmf nmf VPY ($ in millions, except per share amounts) ($0.11) . . . . |
|
|
Q&A We Supply the Products and Services to Build Your City and Keep it Running |

|
|
Concluding Remarks +9% Sales Growth and +21% Adjusted EBITDA Growth in FY’13 VPY1 Executed Proactive Cost Structure Alignment to Enhance Growth Momentum Enhance Capital Structure Investing to Fuel Future Growth Encouraging “Green Shoots” of Construction Despite Weather Impact Early Innings of Our Full Potential Well Positioned in Large, Fragmented Markets 1 Prior year comparison adjusts Fiscal 2012 to eliminate impact of 53rd week and the Crown Bolt contract amendment (see slide 5) Note: “VPY” denotes versus prior year |
|
|
Appendix |

|
|
Q4’13 End Market Growth Estimates +600BPs of Estimated End Market Outgrowth in Q4’13 MRO Residential Non-Resi. Municipal Power Q4’13 BU Market2 Q4’13 Growth3 Growth in Excess of Estimated Market Growth2 100% 25% 25% 50% 20% 80% 25% 75% ~1% 7% +600BPs ~2% ~Flat (~1%) ~3% 7% 3% 6% 11% +500BPs +300BPs +700BPs +800BPs (Approximate End Market Exposure1) 1 Management estimates based on Fiscal Year 2012 Net Sales 2 Management estimate 3 Organic Sales growth Primary End Market1 Q4 Primary End Market Estimate2 ~2% ~15% (~2%) (~1%) ~Flat |

|
|
Monthly Average Daily Sales Growth (%) HD Supply Average Daily Sales Growth VPY 4.1% Average Daily Sales Growth in Feb. ’14 ’14 Selling Days ’13 Selling Days 11.6% 20 13.8% 6.5% 16.6% 20 11.6% Feb. 14.6% Mar. 12.8% Apr. 10.5% May 10.0% Jun. 11.1% 15.2% 18.9% 17.9% 15.5% 11.6% 9.2% 16.0% 13.1% 12.2% 4.4% 10.6% 13.0% 14.1% 2.5% 9.9% 20 20 25 25 19 19 20 20 9.1% Jul. 9.3% 15.7% 3.8% 7.3% 24 24 6.5% Aug. 1.6% 15.1% -0.4% 10.5% 20 20 8.3% Sep. 6.0% 15.7% 1.4% 12.4% 19 19 6.8% Oct. 4.5% 13.0% 1.3% 9.5% 25 25 9.3% Nov. 8.1% 13.7% 7.4% 9.2% 18 18 -2.2% Dec. 0.6% -7.5% -2.8% 2.3% 19 19 8.6% Jan. 10.6% 6.0% 10.4% 19.9% 24 24 4.1% Feb. 9.8% 2.2% -3.9% 9.4% 20 20 FY 2014 FY 2013 ’12 Selling Days 20 20 25 20 19 24 20 19 25 18 20 28 20 (VPY%) |

|
|
Monthly Net Sales ($) HD Supply Net Sales $609M Feb. ’14 Sales ($ in millions) $160 $143 $140 $87 $585M Feb. Mar. Apr. May Jun. Jul. Aug. Sep. Oct. Nov. Dec. Jan. Feb. $170 $157 $149 $98 $231 $223 $173 $125 $179 $175 $133 $99 $203 $193 $147 $109 $256 $233 $176 $128 $199 $201 $141 $108 $184 $194 $136 $105 $227 $238 $195 $139 $162 $163 $145 $95 $153 $139 $134 $88 $207 $168 $174 $112 $176 $146 $134 $96 $609M $633M $830M $650M $717M $870M $714M $682M $877M $627M $571M $731M ’14 Selling Days ’13 Selling Days 20 20 20 20 25 25 19 19 20 20 24 24 20 20 19 19 25 25 18 18 19 19 24 24 ’12 Selling Days 20 20 25 20 19 24 20 19 25 18 20 28 20 20 20 FY 2014 FY 2013 |

|
|
Monthly Average Daily Sales Growth – Organic (%) HD Supply Organic Average Daily Sales Growth VPY1 ~7% Organic Average Daily Sales Growth in Q4’13 8.3% 8.1% 6.5% 16.6% 9.7% Feb. 12.7% Mar. 10.9% Apr. 8.6% May 8.2% Jun. 7.8% 9.8% 18.9% 17.9% 11.8% 7.2% 9.2% 16.0% 9.3% 7.7% 4.4% 10.6% 9.8% 9.2% 2.5% 9.9% 8.2% Jul. 8.8% 11.1% 3.8% 7.3% 5.8% Aug. 1.6% 11.2% -0.4% 10.5% 7.5% Sep. 6.0% 11.7% 1.4% 12.4% 6.1% Oct. 4.5% 9.3% 1.3% 9.5% 8.6% Nov. 8.1% 9.7% 7.4% 9.2% -2.0% Dec. 0.6% -7.5% -2.8% 2.3% 11.5% Jan. 10.6% 6.0% 10.4% 19.9% Feb. 9.8% 2.2% -3.9% 9.4% ’14 Selling Days ’13 Selling Days 20 20 20 20 25 25 19 19 20 20 24 24 20 20 19 19 25 25 18 18 19 19 24 24 20 20 ’12 Selling Days 20 20 25 20 19 24 20 19 25 18 20 28 20 (VPY%) 4.1% FY 2014 FY 2013 1 Adjusted for Acquisitions, Crown Bolt Contract Amendment, and Selling Days |

|
|
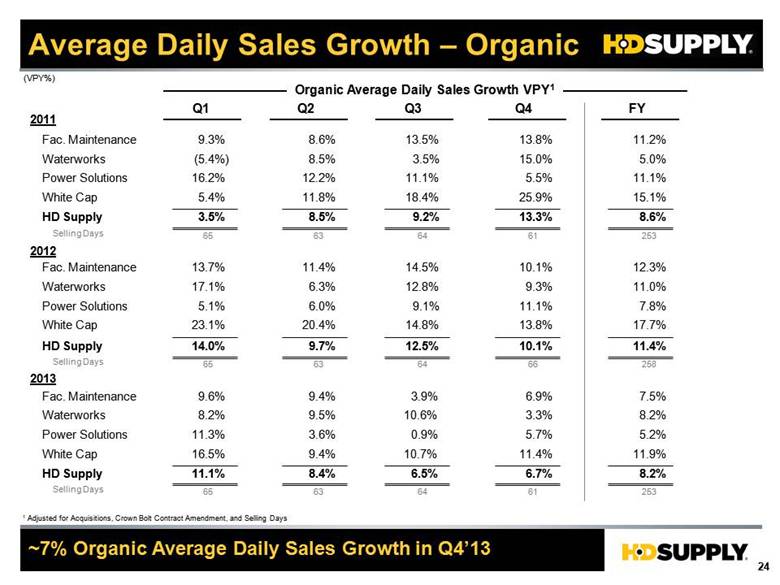
Average Daily Sales Growth – Organic ~7% Organic Average Daily Sales Growth in Q4’13 Q1 9.6% 9.4% 8.2% 9.5% 11.3% 3.6% 16.5% 9.4% 11.1% 8.4% 2011 2012 2013 Fac. Maintenance Waterworks Power Solutions White Cap HD Supply Fac. Maintenance Waterworks Power Solutions White Cap HD Supply Fac. Maintenance Waterworks Power Solutions White Cap HD Supply 13.7% 11.4% 14.5% 10.1% 17.1% 6.3% 12.8% 9.3% 5.1% 6.0% 9.1% 11.1% 23.1% 20.4% 14.8% 13.8% 14.0% 9.7% 12.5% 10.1% 6.9% 3.3% 5.7% 11.4% 6.7% Organic Average Daily Sales Growth VPY1 9.3% 8.6% 13.5% 13.8% (5.4%) 8.5% 3.5% 15.0% 16.2% 12.2% 11.1% 5.5% 5.4% 11.8% 18.4% 25.9% 3.5% 8.5% 9.2% 13.3% 1 Adjusted for Acquisitions, Crown Bolt Contract Amendment, and Selling Days Selling Days 65 63 64 61 Selling Days 65 63 64 66 Selling Days 65 63 64 61 (VPY%) 3.9% 10.6% 0.9% 10.7% 6.5% Q2 Q3 Q4 12.3% 11.0% 7.8% 17.7% 11.4% 7.5% 8.2% 5.2% 11.9% 8.2% 11.2% 5.0% 11.1% 15.1% 8.6% 253 258 253 FY |
|
|
Operating Leverage 2.3x Operating Leverage in FY’13 2011 2012 2013 Facilities Maintenance Waterworks Power Solutions White Cap HD Supply Facilities Maintenance Waterworks Power Solutions White Cap HD Supply Facilities Maintenance Waterworks Power Solutions White Cap HD Supply 1.2x 6.6x nm 1.2x nm 1 Operating Leverage is Defined as Adjusted EBITDA Growth Divided by Adjusted Sales Growth. Adjustments Comprise the 53rd Week in fiscal 2012 and the Crown Bolt Amended Agreement. Not Meaningful (“nm”) when Sales Growth is Negative, and when Prior Period Adjusted EBITDA is Negative. 1.5x 2.9x 1.3x 0.6x nm 0.7x 1.9x 2.5x 1.2x 12.2x 1.3x 2.2x 3.6x (6.6x) nm 1.3x 2.7x 1.7x 3.3x nm 1.2x 2.4x 2.9x 7.2x 7.7x 1.6x 2.4x 1.0x 2.6x 4.7x 1.3x 3.1x 1.8x 10.5x nm 1.4x 2.2x 2.7x 2.5x 4.5x 1.3x 1.7x 2.0x (2.8x) 3.5x 1.6x 1.9x 2.1x - 2.1x 2.7x 4.4x 3.7x 4.6x 9.2x Q1 Q2 Q3 Q4 FY Operating Leverage1 1.1x 2.7x 2.8x nm 1.4x 2.6x 1.7x 5.1x 12.5x 1.6x 2.3x 2.4x 1.6x 3.7x 0.2x |

|
|
Reconciliation of Non-GAAP Measures: Consolidated Results ($ in millions) Fourth - Quarter Fiscal 2013 Fourth - Quarter Fiscal 2012 As Reported turing (1) Adjusted As Reported 53 rd Week (2) CB / THD (3) Impair - ment (4) Adjusted Net Sales $ 1,929 $ – $ 1,929 $ 1,974 $ (147) $ (23) $ – $ 1,804 Cost of sales 1,369 (3) 1,36 6 1,392 (106) – – 1,286 Gross Profit 560 3 56 3 582 (41) (23) – 518 Operating expenses: Selling, general and administrative 415 – 415 431 (27) – – 404 Depreciation and amortization 61 – 61 86 – – – 86 Restructuring charge 9 (9) – – – – – – Goodwill & other intangible asset impairment – – – 152 – – (152) Total operating expenses 485 (9) 4 76 669 (27) – (152) 490 Operating Income (Loss) $ 75 12 $ 87 $ (87) (14) (23) 152 $ 28 Adjusted EBITDA $ 154 – $ 15 4 $ 155 (14) (23) – $ 118 (1) Represents the costs incurred for workforce reductions, branch closures or consolidations, and inventory liquidation. These costs include occupancy costs, severance, and other costs incurred to exit a location. (2) Represents the 53rd week of operations in fiscal 2012. Fiscal 2013 includes 52 weeks of operations. (3) Represents the impact of the amendment of the strategic purchase agreement between our Crown Bolt business and The Home Depot, Inc. The new 7-year exclusive agreement through January 2020 reduced pricing levels and eliminated the minimum purchase guarantee from the original agreement. (4) Represents the 2012 Crown Bolt non-cash impairment charge of goodwill and an intangible asset. Restruc- – |

|
|
Reconciliation of Non-GAAP Measures: Consolidated Results ($ in millions) (1) Represents the costs incurred for workforce reductions, branch closures or consolidations, and inventory liquidation. These costs include occupancy costs, severance, and other costs incurred to exit a location. (2) Represents the 53rd week of operations in fiscal 2012. Fiscal 2013 includes 52 weeks of operations. (3) Represents the impact of the amendment of the strategic purchase agreement between our Crown Bolt business and The Home Depot, Inc. The new 7-year exclusive agreement through January 2020 reduced pricing levels and eliminated the minimum purchase guarantee from the original agreement. (4) Represents the 2012 Crown Bolt non-cash impairment charge of goodwill and an intangible asset. Fiscal 2013 Fiscal 2012 As Reported Restruc- turing (1) Adjusted As Reported 53 rd Week (2) CB / THD (3) Impair - ment (4) Adjusted Net Sales $ 8,487 $ – $ 8,487 $ 7,943 $ (147) $ (41) $ – $ 7,755 Cost of sales 6,015 (3) 6,012 5,644 (106) – – 5,538 Gross Profit 2,472 3 2,475 2,299 (41) (41) – 2,217 Operating expenses: Selling, general and administrative 1,733 – 1,733 1,637 (27) – – 1,610 Depreciation and amortization 242 – 242 336 – – – 336 Restructuring charge 9 (9) – – – – – – Goodwill & other intangible asset impairment – – – 152 – – (152) – Total operating expenses 1,984 (9) 1,975 2,125 (27) – (152) 1,946 Operating Income (Loss) $ 488 12 $ 500 $ 174 (14) (41) 152 $ 271 Adjusted EBITDA $ 764 – $ 764 $ 685 (14) (41) – $ 630 |

|
|
Reconciliation of Non-GAAP Measures: Segment Results ($ in millions) Fourth - Quarter Fiscal 2012 Fiscal 2012 As Reported 53 rd Week (1) 52 - Week Basis As Reported 53 rd Week (1) 52 - Week Basis Net Sales Facilities Maintenance $ 527 $ (41) $ 486 $ 2,182 $ (41) $ 2,141 Waterworks 487 (36) 451 2,028 (36) 1,992 Power Solutions 464 (36) 428 1,787 (36) 1,751 White Cap 287 (21) 266 1,178 (21) 1,157 Adjusted EBITDA Facilities Maintenance $ 83 (8) $ 75 $ 389 (8) $ 381 Waterworks 28 (2) 26 137 (2) 135 Power Solutions 17 (2) 15 72 (2) 70 White Cap 8 (1) 7 56 (1) 55 (1) Represents the 53rd week of operations in fiscal 2012. Fiscal 2013 includes 52 weeks of operations |

|
|
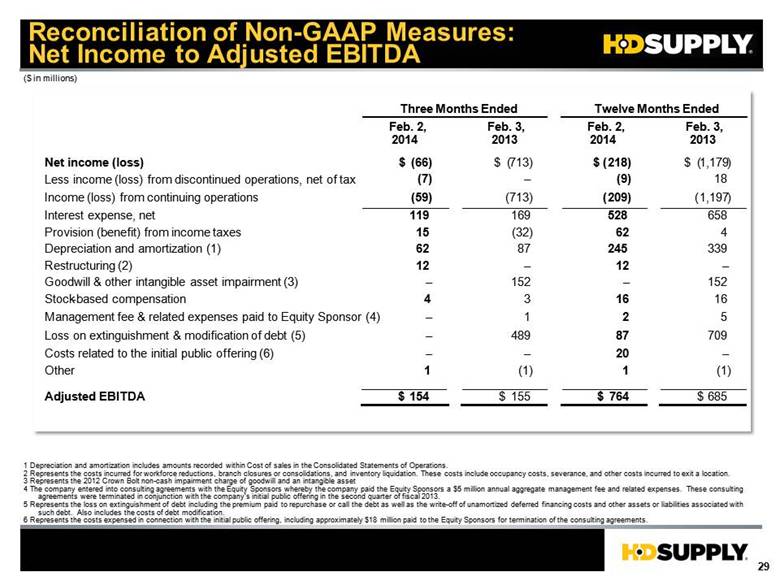
Reconciliation of Non-GAAP Measures: Net Income to Adjusted EBITDA ($ in millions) Net income (loss) $ (66) $ (713) $ (218) $ (1,179) Less income (loss) from discontinued operations, net of tax (7) – (9) 18 Income (loss) from continuing operations (59) (713) (209) (1,197) Interest expense, net 119 169 528 658 Provision (benefit) from income taxes 15 (32) 62 4 Depreciation and amortization (1) 62 87 245 339 Restructuring (2) 12 – 12 – Goodwill & other intangible asset impairment (3) – 152 – 152 Stock - based compensation 4 3 1 6 1 6 Management fee & related expenses paid to Equity Sponsor (4) – 1 2 5 Loss on extinguishment & modification of debt (5) – 489 87 709 Costs related to the initial public offering (6) – – 20 – Other 1 (1) 1 (1) Adjusted EBITDA $ 154 $ 155 $ 764 $ 685 1 Depreciation and amortization includes amounts recorded within Cost of sales in the Consolidated Statements of Operations. 2 Represents the costs incurred for workforce reductions, branch closures or consolidations, and inventory liquidation. These costs include occupancy costs, severance, and other costs incurred to exit a location. 3 Represents the 2012 Crown Bolt non-cash impairment charge of goodwill and an intangible asset 4 The company entered into consulting agreements with the Equity Sponsors whereby the company paid the Equity Sponsors a $5 million annual aggregate management fee and related expenses. These consulting agreements were terminated in conjunction with the company’s initial public offering in the second quarter of fiscal 2013. 5 Represents the loss on extinguishment of debt including the premium paid to repurchase or call the debt as well as the write-off of unamortized deferred financing costs and other assets or liabilities associated with such debt. Also includes the costs of debt modification. 6 Represents the costs expensed in connection with the initial public offering, including approximately $18 million paid to the Equity Sponsors for termination of the consulting agreements. Three Months Ended Twelve Months Ended Feb. 2, 2014 Feb. 3, 2013 Feb. 2, 2014 Feb. 3, 2013 |
|
|
Reconciliation of Non-GAAP Measures: Net Income to Adjusted Net Income ($ in millions) Net income (loss) Three Months Ended Twelve Months Ended Feb. 2, 2014 Feb. 3, 2013 Feb. 2, 2014 Feb. 3, 2013 $ (66) $ (713) $ (218) $ (1,179) Less income (loss) from discontinued operations, net of tax (7) – (9) 18 Income (loss) from continuing operations (59) (713) (209) (1,197) Plus: Provision (benefit) for income taxes 15 (32) 62 4 Less: Cash income taxes (paid) received (2) 1 (8) (1) Plus: Amortization of acquisition - related intangible assets (other than software) 34 6 2 1 35 243 Plus: Restructuring (1) 12 – 12 – Plus: Goodwill &other intangible asset impairment (2) – 113 – 113 Plus: Loss on extinguishment & modification of debt (3) – 489 87 709 Plus: Costs related to the initial public offering (4) – – 20 – Adjusted net income (loss) $ – $ (80) $ 99 $ (129) 1 Represents the costs incurred for workforce reductions, branch closures or consolidations, and inventory liquidation. These costs include occupancy costs, severance, and other costs incurred to exit a location. 2 Represents the 2012 Crown Bolt non-cash impairment charge of goodwill and an intangible asset 3 Represents the loss on extinguishment of debt including the premium paid to repurchase or call the debt as well as the write-off of unamortized deferred financing costs and other assets or liabilities associated with such debt. Also includes the costs of debt modification. 4 Represents the costs expensed in connection with the initial public offering, including approximately $18 million paid to the Equity Sponsors for termination of the consulting agreements. Weighted average common shares outstanding (in thousands) Basic 191,858 130,578 166,905 130,561 Diluted 191,858 130,578 171,764 130,561 Adjusted Net Income (Loss) Per Share - Basic $ - ($0.61) $0.59 ($0.99) Adjusted Net Income (Loss) Per Share - Diluted $0.58 ($0.99) $ - ($0.61) |
