Attached files
Table of Contents
Index to Financial Statements
UNITED STATES SECURITIES AND EXCHANGE COMMISSION
Washington, D.C. 20549
FORM 10-K
x ANNUAL REPORT PURSUANT TO SECTION 13 OR 15(d) OF THE SECURITIES EXCHANGE ACT OF 1934
For the fiscal year ended January 31, 2010
- or -
¨ TRANSITION REPORT PURSUANT TO SECTION 13 OR 15(d) OF THE SECURITIES EXCHANGE ACT OF 1934
For the transaction period from to
Commission File number: 333-159809
HD SUPPLY, INC.
(Exact name of registrant as specified in its charter)
| Delaware | 75-2007383 | |
| (State or other jurisdiction of incorporation or organization) |
(I.R.S. Employer Identification Number) | |
| 3100 Cumberland Boulevard, Suite 1480, Atlanta, Georgia (Address of principal executive offices) |
30339 (Zip Code) | |
(770) 852-9000
(Registrant’s telephone number, including area code)
(Former name, former address and former fiscal year, if changed since last report)
Securities registered pursuant to Section 12 (b) of the Act:
| Debt securities issued by HD Supply, Inc. 12.0% Senior Notes due 2014 13.5% Senior Subordinated PIK Notes due 2015 |
New York Stock Exchange
| |
| (Title of each class) | (Name of each exchange on which registered) |
Securities registered pursuant to Section 12 (g) of the Act:
| None |
| (Title of Class) |
Indicate by check mark if the registrant is a well-known seasoned issuer, as defined in Rule 405 of the Securities Act. ¨ Yes x No
Indicate by check mark if the registrant is not required to file reports pursuant to Section 13 or Section 15(d) of the Act. ¨ Yes x No
Indicate by check mark whether the registrant (1) has filed all reports required to be filed by Section 13 or 15(d) of the Securities Exchange Act of 1934 during the past 12 months (or for such shorter period that the registrant was required to file such reports), and (2) has been subject to such filing requirements for the past 90 days. x Yes ¨ No
Indicate by check mark whether the registrant has submitted electronically and posted on its corporate Web site, if any, every Interactive Data File required to be submitted and posted pursuant to Rule 405 of Regulation S-T (§232.405) during the preceding 12 months (or for such shorter period that the registrant was required to submit and post such files). ¨ Yes ¨ No
Indicate by check mark if disclosure of delinquent filers in response to Item 405 of Regulation S-K (§229.405) is not contained herein, and will not be contained, to the best of registrant’s knowledge, in definitive proxy or information statements incorporated by reference in Part III of this Form 10-K or any amendment to this Form 10-K. x
Indicate by check mark whether the registrant is a large accelerated filer, an accelerated filer, a non-accelerated filer, or a smaller reporting company. See the definitions of “large accelerated filer,” “accelerated filer,” and “smaller reporting company” in Rule 12b-2 of the Exchange Act.
Large accelerated filer ¨ Accelerated filer ¨ Non-accelerated filer x Smaller reporting company ¨
(Do not check if a smaller reporting company)
Indicate by check mark whether the registrant is a shell company (as defined in Rule 12b-2 of the Act). ¨ Yes x No
As of April 9, 2010, there were 1,000 shares of common stock of HD Supply, Inc. outstanding.
Table of Contents
Index to Financial Statements
| Page | ||||
| Background Information and Glossary of Certain Defined Terms | 1 | |||
| Forward-looking statements and information | 2 | |||
| Part I | ||||
| Item 1. | Business | 4 | ||
| Item 1A. | Risk Factors | 9 | ||
| Item 2. | Properties | 27 | ||
| Item 3. | Legal Proceedings | 28 | ||
| Part II | ||||
| Item 6. | Selected Financial Data | 29 | ||
| Item 7. | Management’s Discussion and Analysis of Financial Condition and Results of Operations | 34 | ||
| Item 7A. | Quantitative and Qualitative Disclosures about Market Risk | 69 | ||
| Item 8. | Financial Statements and Supplementary Data | 70 | ||
| Item 9A(T). | Controls and Procedures | 118 | ||
| Part III | ||||
| Item 10. | Directors, Executive Officers and Corporate Governance | 119 | ||
| Item 11. | Executive Compensation | 125 | ||
| Item 12. | Security Ownership of Certain Beneficial Owners and Management and Related Stockholder Matters | 138 | ||
| Item 13. | Certain Relationships and Related Transactions, and Director Independence | 141 | ||
| Item 14. | Principal Accounting Fees and Services | 143 | ||
| Part IV | ||||
| Item 15. | Exhibits and Financial Statement Schedules | 144 | ||
| Signatures | 152 | |||
Table of Contents
Index to Financial Statements
Background Information and Glossary of Certain Defined Terms
The Transactions
On August 30, 2007, investment funds associated with Bain Capital Partners, LLC, The Carlyle Group and Clayton, Dubilier & Rice, Inc. (collectively, the “Equity Sponsors”) formed HDS Investment Holding, Inc. (“Holding”) and entered into a stock purchase agreement with The Home Depot, Inc. (“Home Depot” or “THD”) pursuant to which Home Depot agreed to sell to Holding or to a wholly owned subsidiary of Holding certain intellectual property and all the outstanding common stock of HD Supply, Inc. and the Canadian subsidiary CND Holdings, Inc. On August 30, 2007, through a series of transactions, Holding’s direct wholly owned subsidiary, HDS Holding Corporation, acquired direct control of HD Supply through the merger of its wholly owned subsidiary, HDS Acquisition Corp., with and into HD Supply (the “Company”). Through these transactions (the “Transactions”), Home Depot was paid cash of $8.2 billion and 12.5% of Holding’s common stock worth $325 million for certain intellectual property and all of the outstanding common stock of HD Supply and CND Holdings, Inc., including all dividends and interest payable associated with those shares. During the first quarter of fiscal 2009, the Company received $22 million from Home Depot for the working capital adjustment and settlement of other items finalizing the purchase price of the Transactions.
Description of Indebtedness
In connection with the Transactions, the Company entered into a senior secured credit facility (the “Senior Secured Credit Facility”) comprised of a $1 billion term loan (the “Term Loan”) and a $300 million revolving credit facility (the “Revolving Credit Facility”). The Senior Secured Credit Facility was amended in March 2010. Under the amendment, the maturity date of approximately $873 million of the Term Loan was extended from August 30, 2012 to April 1, 2014. On the date of the amendment, we also agreed to prepay $30 million of the Term Loan.
Also, in connection with the Transaction, the Company entered into a $2.1 billion asset based lending credit agreement (the “ABL Credit Facility”) subject to borrowing base limitations, a portion of which may be used for letters of credit or swing-line loans. The Company amended the ABL Credit Facility in March 2010 to, among other things, (i) convert approximately $214 million of commitments under the ABL Credit Facility into a term loan (the “ABL Term Loan”), (ii) extend the maturity date of approximately $1,537 million of the commitments from August 30, 2012 to April 1, 2014, and (iii) reduce the total commitments under the facility by approximately $45 million. Giving effect to the amendment, the ABL Credit Facility is comprised of the $1,841 million asset based revolving credit facility (the “ABL Revolving Credit Facility”) and the $214 million ABL Term Loan.
We refer to the Senior Secured Credit Facility and the ABL Credit Facility as our “Senior Credit Facilities.”
In connection with the Transactions, Home Depot agreed to guarantee our payment obligations for principal and interest under the Term Loan under the Senior Secured Credit Facility (“THD Guarantee”). The THD Guarantee, among other things, restricts our ability to incur secured debt and pay dividends. Home Depot extended the THD Guarantee in connection with the March 2010 amendments to our Senior Secured Credit Facility and our ABL Credit Facility and agreed to the prospective extension of the remaining $104 million of the Term Loan. In addition, in connection with the amendments we agreed that, while the THD Guarantee is outstanding, the Company would not voluntarily repurchase our outstanding notes, directly or indirectly, without Home Depot’s prior written consent, subject to certain exceptions.
The Company issued $2.5 billion of Senior Notes bearing interest at a rate of 12.0% (the “12.0% Senior Notes”) and $1.3 billion of Senior Subordinated Notes bearing interest at a rate of 13.5% (the “13.5% Senior Subordinated Notes”) in connection with the Transactions. During first quarter 2009, we repurchased $252 million principal amount, plus accrued interest of $15 million, of the 13.5% Senior Subordinated Notes due 2015 for $62 million.
Our Senior Credit Facilities, the THD Guarantee, the 12% Senior Notes and the 13.5% Senior Subordinated Notes are discussed in greater detail under “Management’s Discussion and Analysis of Financial Condition and Results of Operations – Liquidity and Capital Resources – External Financing.”
1
Table of Contents
Index to Financial Statements
Glossary of Other Terms
| ASC | Accounting Standards Codification | |
| Canada | HD Supply Canada | |
| CTI | Creative Touch Interiors | |
| DCF | Discounted cash flow | |
| DOT | U.S. Department of Transportation | |
| Exchange Act | Securities Exchange Act of 1934 | |
| Fiscal 2008 | Fiscal year ended February 1, 2009 | |
| Fiscal 2009 | Fiscal year ended January 31, 2010 | |
| Fiscal 2010 | Fiscal year ending January 30, 2011 | |
| Gross margin | Gross profit as a percentage of net sales | |
| HDPE | High-density polyethylene | |
| IPVF | Industrial Pipe, Valves and Fittings | |
| MRO | Maintenance, repair and operations | |
| NOLs | Net operating losses | |
| PIK | Paid-in-kind | |
| Predecessor 2007 | Predecessor period from January 29, 2007 to August 29, 2007 | |
| Pro forma 2007 | Period from January 29, 2007 to February 3, 2008 | |
| PVC | Polyvinyl chlorides | |
| SKU | Stock-keeping unit | |
| SFAS | Statement of Financial Accounting Standard | |
| Successor 2007 | Successor period from August 30, 2007 to February 3, 2008 | |
| U.S. GAAP | Generally accepted accounting principles in the United States of America | |
| SEC | U.S. Securities and Exchange Commission | |
| Vendor rebates | Vendors providing for inventory purchase rebates |
Forward-looking statements and information
This annual report on Form 10-K includes forward-looking statements within the meaning of the Private Securities Litigation Reform Act of 1995. Some of the forward-looking statements can be identified by the use of forward-looking terms such as “believes,” “expects,” “may,” “will,” “should,” “could,” “seeks,” “intends,” “plans,” “estimates,” “anticipates” or other comparable terms. These forward-looking statements include all matters that are not historical facts. They appear in a number of places throughout this report and include statements regarding our intentions, beliefs or current expectations concerning, among other things, our results of operations, financial condition, liquidity, prospects, growth strategies and the industries in which we operate.
Forward-looking statements are subject to known and unknown risks and uncertainties, many of which may be beyond our control. We caution you that forward-looking statements are not guarantees of future performance and that our actual results of operations, financial condition and liquidity, and the development of the industries in which we operate may differ materially from those made in or suggested by the forward-looking statements contained in this report. In addition, even if our results of operations, financial condition and liquidity, and the development of the industries in which we operate are consistent with the forward-looking statements contained in this report, those results or developments may not be indicative of results or developments in subsequent periods. A number of important factors could cause actual results to differ materially from those contained in or implied by the forward-looking statements, including those reflected in forward-looking statements relating to our operations and business, the risks and uncertainties discussed in this annual report on Form 10-K (See “Risk Factors”) and those described from time to time in our other filings with the U.S. Securities and Exchange Commission. Factors that could cause actual results to differ from those reflected in forward-looking statements relating to our operations and business include:
| — | Inherent risks of the residential, non-residential and public infrastructure construction and facility maintenance and repair markets; |
| — | Wind down of the emergency actions of the U.S. government, the U.S. Treasury, Federal Reserve and other governmental and regulatory bodies; |
2
Table of Contents
Index to Financial Statements
| — | Our ability to achieve profitability; |
| — | Our ability to service our debt and to refinance all or a portion of our indebtedness; |
| — | Our substantial indebtedness and our ability to incur additional indebtedness; |
| — | Limitations and restrictions in the agreements governing our indebtedness; |
| — | Our ability to obtain additional financing on acceptable terms; |
| — | Increases in interest rates; |
| — | Rating agency actions with respect to our indebtedness; |
| — | The interests of the Equity Sponsors; |
| — | Changes in our business as a result of the Transactions; |
| — | The competitive environment in which we operate and demand for our products and services in highly competitive and fragmented industries; |
| — | Goodwill and other impairment charges; |
| — | Our obligations under long-term, non-cancelable leases; |
| — | Consolidation among our competitors; |
| — | The loss of any of our significant customers; |
| — | Failure to collect monies owed from customers, including on credit sales; |
| — | Competitive pricing pressure from our customers; |
| — | Variability in our revenues and earnings; |
| — | Cyclicality and seasonality of the residential, non-residential and infrastructure construction and facility maintenance and repair markets; |
| — | Fluctuations in commodity and energy prices; |
| — | Our ability to identify and develop relationships with a sufficient number of qualified suppliers and to maintain our supply chains; |
| — | Our ability to manage fixed costs; |
| — | Changes in our product mix; |
| — | The impairment of financial institutions; |
| — | The development of alternatives to distributors in the supply chain; |
| — | Our ability to manage our product purchasing and customer credit policies; |
| — | Inclement weather, anti-terrorism measures and other disruptions to the transportation network; |
| — | Interruptions in the proper functioning of information technology (“IT”) systems; |
| — | Our ability to implement our technology initiatives; |
| — | Changes in U.S. federal, state or local regulations; |
| — | Exposure to construction defect and product liability claims and other legal proceedings; |
| — | Potential material liabilities under our self-insured programs; |
| — | Our ability to attract, retain and retrain highly qualified associates and key personnel; |
| — | Fluctuations in foreign currency exchange rates; |
| — | Inability to protect our intellectual property rights; |
| — | Significant costs related to compliance with environmental, health and safety regulations, including new climate change legislation; |
| — | Our ability to achieve and maintain effective disclosure controls and internal control over our financial reporting; and |
| — | Increased costs related to our becoming an SEC registrant. |
You should read this annual report on Form 10-K completely and with the understanding that actual future results may be materially different from expectations. All forward-looking statements made in this report are
3
Table of Contents
Index to Financial Statements
qualified by these cautionary statements. These forward-looking statements are made only as of the date of this annual report on Form 10-K, and we do not undertake any obligation, other than as may be required by law, to update or revise any forward-looking statements to reflect changes in assumptions, the occurrence of unanticipated events, changes in future operating results over time or otherwise. Comparisons of results for current and any prior periods are not intended to express any future trends or indications of future performance, unless expressed as such, and should only be viewed as historical data.
PART I
HD Supply, Inc. (“HD Supply” or the “Company”) is one of the largest wholesale distributors based on sales serving the highly fragmented U.S. and Canadian Infrastructure & Energy, Maintenance, Repair & Improvement and Specialty Construction market sectors. Through approximately 800 locations across the United States and Canada, we operate a diverse portfolio of distribution businesses that provide over 1 million stock-keeping units (“SKUs”) to over 450,000 professional customers, including contractors, government entities, maintenance professionals, home builders and industrial businesses. Our Company is organized in three distinct market sectors, each of which offers different products and services to the end customer.
Our history
In March 1997, The Home Depot, Inc. (“Home Depot”), our former parent, acquired Maintenance Warehouse / America Corp., a Texas corporation organized on January 26, 1985, and a leading direct marketer of maintenance, repair and operations (“MRO”) products to the hospitality and multifamily housing markets. Since 1997, our business has grown rapidly, primarily through the acquisition of more than 40 businesses. We changed our name to HD Supply, Inc. on January 1, 2007 and converted to a Delaware corporation on August 31, 2007.
From fiscal 2000 to fiscal 2004, we extended our presence into new categories while growing existing businesses through 10 acquisitions. New businesses included plumbing and HVAC (through the acquisition of Apex Supply), flooring products and installation (Floors Inc., Floor Works, Arvada Hardwood Floor Co.) and specialty hardware, tools and materials for construction contractors (White Cap).
Growth at existing businesses was driven organically and through “tuck-in” acquisitions, expanding our presence in the MRO segment (N-E Thing Supply, Economy Maintenance Supply) and flooring and design services for professional homebuilders (Creative Touch Interiors). In fiscal 2005, we accelerated the pace of consolidation by acquiring 18 businesses, the largest of which was National Waterworks, a leading distributor of products used to build, repair and maintain water and wastewater transmission systems. In fiscal 2006, we transformed our business with the acquisition of Hughes Supply, which doubled our Net sales and further established our market leadership in a number of our largest businesses, which we supplemented with 11 other strategic acquisitions.
In 2007, through a series of transactions (the “Transactions”), investment funds associated with Bain Capital Partners LLC, The Carlyle Group and Clayton, Dubilier & Rice, Inc. (the “Equity Sponsors”) formed HDS Investment Holding, Inc. and purchased HD Supply from Home Depot. In connection with the Transactions, Home Depot obtained a 12.5% interest in the common stock of HDS Investment Holding, Inc.
Since 2007, we have focused on extending our presence in key growth sectors and exiting unattractive sectors. In February 2008, we sold our Lumber and Building Materials operations to ProBuild Holdings. In June 2009, we purchased substantially all of the assets of ORCO Construction Supply, the second largest construction materials distributor in the U.S., through our White Cap business.
Our sectors
Through ten wholesale distribution companies in the U.S. and a Canadian operation, we provide products and services to professional customers in the Infrastructure & Energy, Maintenance, Repair & Improvement and Specialty Construction market sectors. Most of our businesses operate in markets with a high degree of customer and supplier fragmentation, which typically demand a high level of service and availability of a broad set of complex products from a large number of suppliers. These factors drive the importance of the distributor within the value chain and create barriers to entry for suppliers to sell directly to customers.
4
Table of Contents
Index to Financial Statements
The following table sets forth the relationship among our three market sectors, our ten businesses and our seven financial reporting segments.
| Market sector |
Business |
Financial reporting segment | ||
| — Infrastructure & Energy |
— Waterworks
— Utilities
— Industrial Pipe, Valves and Fittings
(“IPVF”)
— Electrical |
— Waterworks
— Utilities
— IPVF
— Other | ||
| — Maintenance, Repair & Improvement |
— Facilities Maintenance
— Crown Bolt
— Repair & Remodel |
— Facilities Maintenance
— Other
— Other | ||
| — Specialty Construction |
— White Cap
— Plumbing
— Creative Touch Interiors (“CTI”) |
— White Cap
— Plumbing
— CTI | ||
For segment information, including Net sales, Operating income, Total assets of each financial reporting segment, and financial geographic data see Note 17 to the consolidated financial statements appearing elsewhere in this annual report on Form 10-K.
Customers and suppliers
We maintain a customer base of greater than 450,000 customers, the majority of which represent long-term relationships. Home Depot is our largest customer, accounting for 3.9% of fiscal 2009 Net sales. We are subject to very low customer concentration with no customer, other than Home Depot, representing more than 1% of fiscal 2009 Net sales, reducing our exposure to any single customer.
We have developed relationships with more than 17,000 strategic suppliers, many of which are long-standing relationships. These supplier relationships provide us with reliable access to inventory, volume purchasing benefits and the ability to deliver a diverse product offering on a cost-effective basis. We maintain multiple suppliers for a substantial number of our products, thereby limiting the risk of product shortage for customers.
Competition
We operate in a highly fragmented industry and hold a leading position in multiple sectors. Our national competitors include Wolseley (Ferguson Enterprises), Rexel, Grainger, Wesco, Fastenal, Watsco, Interline, and McJunkin Redman Corporation. The majority of our competitors, however, are mid-size regional distributors and small, local distributors.
Seasonality
In a typical year, our operating results are impacted by seasonality. Historically, sales of our products have been higher in the second and third quarters of each fiscal year due to favorable weather and longer daylight conditions during these periods. Seasonal variations in operating results may also be significantly impacted by inclement weather conditions, such as cold or wet weather, which can delay construction projects.
Infrastructure & Energy market sector
We serve customers in the Infrastructure & Energy market sector by meeting their demand for the critical supplies and services required to support established infrastructure and promote economic growth. The Waterworks, Utilities, IPVF and Electrical businesses serve this sector. Their broad geographic presence, through a regionally organized distribution network of branches, reduces our exposure to economic factors in any single region.
5
Table of Contents
Index to Financial Statements
Products
Waterworks: Pipes, fittings, valves, hydrants and meters for use in the construction, maintenance and repair of water and waste-water systems as well as fire-protection systems.
Utilities: Conductors (wire and cable), transformers, overhead transmission and distribution hardware, switches, protective devices and underground distribution and connectors used in the construction or maintenance and repair of electricity transmission and substation distribution infrastructure.
IPVF: Stainless and carbon steel and special alloy pipe, plate, sheet, flanges, fittings, high performance valves and actuators, as well as high-density polyethylene (“HDPE”) pipe and fittings with primary applications in high temperature, high pressure and high corrosion processing environments.
Electrical: Electrical wire and cable, switchgear, supplies, lighting and conduit used in residential and commercial construction.
Maintenance, Repair & Improvement market sector
We serve customers in the Maintenance, Repair & Improvement market sector by delivering supplies and services needed to maintain and upgrade facilities across multiple industries. Our businesses serving customers in this market sector include Facilities Maintenance, Repair & Remodel and Crown Bolt. These businesses are our only non-branch based operating models. Facilities Maintenance and Crown Bolt are distribution center based models, while the Repair & Remodel business is a retail outlet primarily serving cash and carry customers.
Products
Facilities Maintenance: Kitchen and bathroom plumbing products, HVAC, tools and repair materials, appliances, cabinet and drawer hardware, door hardware and locksets, fasteners, lighting, electrical maintenance supplies, safety products, guest amenities, textiles, healthcare maintenance and janitorial supplies for the maintenance, repair and ongoing operations of multifamily, hospitality, healthcare, institutional and commercial properties.
Crown Bolt: Fasteners, builders hardware, rope and chain, audio-visual accessories and plumbing accessories primarily consumed in home improvement, do-it-yourself projects and residential construction.
Repair & Remodel: Lumber, kitchen cabinets, windows, plumbing materials, masonry, electrical equipment, flooring and tools and tool rentals for small remodeling, home improvement and do-it-yourself residential projects.
Specialty Construction market sector
We serve customers in the Specialty Construction market sector by delivering distinct, targeted products and services for commercial, residential and industrial applications. Our businesses serving this market sector include White Cap, Plumbing and Creative Touch Interiors. Their broad geographic presence, through a regionally organized distribution network of branches, reduces our exposure to economic factors in any single region.
Products
White Cap: Tilt-up brace systems, forming and shoring systems, concrete chemicals, hand and power tools, rebar, ladders, safety and fall arrest equipment, specialty screws and fasteners, sealants and adhesives, drainage pipe, geo-synthetics, and erosion and sediment control used broadly across all types of residential and non-residential construction.
Plumbing: Plumbing fixtures, faucets and finishes, HVAC equipment, pipes, valves, fittings and water heaters used in the construction and repair of residential and non-residential properties.
CTI: Flooring, cabinets, countertops and window coverings for the interior finish of residential and non-residential construction projects.
HD Supply Canada
HD Supply Canada (“Canada”) is an industrial wholesale distributor and primarily focuses on servicing specialty lighting, full-line electrical and fasteners/industrial supplies markets. Canada operates across nine provinces in 60 locations, from which it supports a base of approximately 18,000 customers. In the Canadian electrical and
6
Table of Contents
Index to Financial Statements
specialty lighting distribution market, Canada competes with other large national players as well as regional distributors. In the fasteners market, Canada’s key competitors are a few large, national players, including Fastenal and Acklands-Grainger, as well as regional competitors.
Operations
Intellectual property
Our trademarks and those of our subsidiaries, certain of which are material to our business, are registered or otherwise legally protected in the United States, Canada and elsewhere. We, together with our subsidiaries, own over 100 federally registered trademarks in the United States. We also rely upon trade secrets and know-how to develop and maintain our competitive position. We protect intellectual property rights through a variety of methods, including trademark, patent, copyright and trade secret laws, in addition to confidentiality agreements with suppliers, employees, consultants and others who have access to our proprietary information. Generally, registered trademarks have a perpetual life, provided that they are renewed on a timely basis and continue to be used properly as trademarks. We intend to maintain our material trademark registrations so long as they remain valuable to our business. We have also registered certain copyrightable works in the United States and have patents, or patent applications pending in the United States and Canada. Other than the trademarks HD Supply (and design), Crown Bolt, National Waterworks (and design), USABluebook and White Cap, we do not believe our business is dependent to a material degree on trademarks, patents, copyrights or trade secrets. Other than commercially available software licenses, we do not believe that any of our licenses to third-party intellectual property are material to our business, taken as a whole. See “Risk factors–If we are unable to protect our intellectual property rights, or we infringe on the intellectual property rights of others, our ability to compete could be negatively impacted.”
Employees
In domestic and international operations, we had approximately 15,000 employees as of January 31, 2010, consisting of approximately 9,400 hourly personnel and 5,900 salaried employees. As of January 31, 2010, less than one percent of our hourly workforce was covered by three separate collective bargaining agreements.
Regulation
Our operations are affected by various statutes, regulations and laws in the markets in which we operate, which historically have not had a material effect on our business. While we are not engaged in a “regulated” industry, we are subject to various laws applicable to businesses generally, including laws affecting land usage, zoning, the environment, health and safety, transportation, labor and employment practices (including pensions), competition, immigration and other matters. Additionally, building codes may affect the products our customers are allowed to use, and consequently, changes in building codes may affect the saleability of our products. The transportation and disposal of many of our products are also subject to federal regulations. The U.S. Department of Transportation (“DOT”) regulates our operations in domestic interstate commerce. We are subject to safety requirements governing interstate operations prescribed by the DOT. Vehicle dimensions and driver hours of service also remain subject to both federal and state regulation. See “Risk factors—Our costs of doing business could increase as a result of changes in U.S. federal, state or local regulations.”
Environmental, health and safety matters
We are subject to a broad range of foreign, federal, state and local environmental, health and safety laws and regulations, including those pertaining to air emissions, water discharges, the handling, disposal and transport of solid and hazardous materials and wastes, the investigation and remediation of contamination and otherwise relating to health and safety and the protection of the environment and natural resources. As our operations, and those of many of the companies we have acquired, to a limited extent involve and have involved the handling, transport and distribution of materials that are or could be classified as toxic or hazardous, there is some risk of contamination and environmental damage inherent in our operations and the products we handle, transport and distribute. Our environmental, health and safety liabilities and obligations may result in significant capital expenditures and other costs, which could negatively impact our business, financial condition and results of operations. We may be fined or penalized by regulators for failing to comply with environmental, health and safety laws and regulations or we may be held responsible for such failures by companies we have acquired. In
7
Table of Contents
Index to Financial Statements
addition, contamination resulting from our current or past operations, and those of many of the companies we have acquired, may trigger investigation or remediation obligations, which may have a material adverse effect on our business, financial condition and results of operations.
Available Information
We are subject to the reporting and information requirements of the Exchange Act and, as a result, we file periodic reports and other information with the SEC. In addition, the indentures pursuant to which our 12% Senior Notes and our 13.5% Senior Subordinated Notes are issued require us to distribute to the holders of the notes annual reports containing our financial statements audited by our independent auditors as well as other information, documents and other information we file with the SEC under Sections 13(a) or 15(d) of the Securities Exchange Act of 1934.
The public may read and copy any reports or other information that we file with the SEC. Such filings are available to the public over the internet at the SEC’s website at http://www.sec.gov. The SEC’s website is included in this annual report on Form 10-K as an inactive textual reference only. You may also read and copy any document that we file with the SEC at its public reference room at 100 F Street, N.E., Washington D.C. 20549. You may obtain information on the operation of the public reference room by calling the SEC at 1-800-SEC-0330. You may also obtain a copy of any information that we file with the SEC at no cost by calling us or writing to us at the following address:
HD Supply, Inc.
3100 Cumberland Boulevard, Suite 1480
Atlanta, Georgia 30339
Attn: General Counsel
(770) 852-9000
8
Table of Contents
Index to Financial Statements
You should carefully consider the risk factors set forth below as well as the other information included in this annual report on Form 10-K in evaluating our business. The risks described below are not the only risks that we face. Additional risks and uncertainties not currently known to us or that we currently deem to be immaterial may also impair our business operations. Any of these risks may have a material adverse effect on our business, financial condition, results of operations and cash flows. In such a case, you may lose all or part of your investment in the securities of the Company.
We are subject to inherent risks of the residential, non-residential and public infrastructure construction and facility maintenance and repair markets, including risks related to general economic conditions.
Demand for our products and services depends to a significant degree on spending in the residential, non-residential and infrastructure construction and facility maintenance and repair markets. The level of activity in these end markets depends on a variety of factors that we cannot control. In the residential construction market these factors include:
| — | changes in interest rates; |
| — | unemployment; |
| — | unsold new housing inventory; |
| — | periods of economic slowdown or recession; |
| — | availability of mortgage financing (including the impact of recent disruption in the mortgage markets); |
| — | adverse changes in local or regional economic conditions; |
| — | a decrease in the affordability of homes; |
| — | more stringent lending standards for home mortgages; |
| — | local, state and federal government regulation; and |
| — | shifts in populations away from the markets that we serve. |
Historically, both new housing starts and residential remodeling decrease in slow economic periods. The level of activity in the nonresidential construction market depends largely on vacancy rates, interest rates, the availability of financing, capital spending, the industrial economic outlook, corporate profitability, capacity utilization, commercial investment and regional and general economic conditions. In addition, residential construction activity can impact the level of non-residential construction activity. In the infrastructure construction market, the level of activity depends largely on interest rates, availability and commitment of public funds for municipal spending and general economic conditions. In the facility maintenance and repair market, the level of activity depends largely on occupancy and vacancy rates within multifamily, hospitality, healthcare and institutional facilities markets. Because all of our markets are sensitive to changes in the economy, downturns (or lack of substantial improvement) in the economy in any region in which we operate have adversely affected and could continue to adversely affect our business, financial condition and results of operations. For example, we distribute many of our products to waterworks contractors in connection with residential, commercial and industrial construction projects. The water and wastewater transmission products industry is affected by changes in economic conditions, including national, regional and local standards in construction activity, and the amount spent by municipalities on waterworks infrastructure. While we operate in many markets in the United States, our business is particularly impacted by changes in the economies of California, Texas and Florida, which represented approximately 15%, 14%, and 10%, respectively, in net sales by branch for fiscal 2009.
In addition, the residential, non-residential and public infrastructure construction and facility maintenance and repair markets in which we compete are sensitive to general business and economic conditions in the United States and worldwide, including availability of credit, interest rates, fluctuations in capital, credit and mortgage markets, and business and consumer confidence. There has been a significant decline in economic growth, both in the U.S. and globally, that began in 2008 and continued through 2009. In addition, volatility and disruption in the capital and credit markets has reached unprecedented levels, with stock markets falling dramatically and credit becoming very expensive or unavailable to many companies without regard to those companies’ underlying financial strength. As a result of these developments, many lenders and institutional investors have reduced, and in some cases, ceased to provide funding to borrowers. Continuing adverse developments in global
9
Table of Contents
Index to Financial Statements
financial markets and general business and economic conditions, including through recession, ongoing downturn or otherwise, could continue to have a material adverse effect on business, financial condition, results of operations and cash flows, including our ability and the ability of our customers and suppliers to access capital.
We have been and expect to continue to be adversely impacted by the decline in the new residential construction market.
Most of our businesses are dependent to varying degrees upon the new residential construction market. The homebuilding industry is undergoing a significant and sustained downturn. According to the U.S. Census Bureau, actual single family housing starts in the U.S. during 2009 declined 28.5% from 2008 levels and declined 57.5% from 2007 to 2009. We believe that the market downturn is attributable to a variety of factors including: the ongoing economic recession; limited credit availability; excess home inventories; a substantial reduction in speculative home investment; a decline in consumer confidence; higher unemployment; and an industry-wide softening of demand. The downturn in the homebuilding industry has resulted in a substantial reduction in demand for our products and services, which in turn had a significant adverse effect on our business and operating results during fiscal years 2008 and 2009.
In addition, beginning in 2007, the mortgage markets experienced substantial disruption due to increased defaults, primarily as a result of credit quality deterioration. The disruption has continued to date and has precipitated evolving changes in the regulatory environment and reduced availability of mortgages for potential homebuyers due to an illiquid credit market and more restrictive standards to qualify for mortgages. During 2008 and 2009, the conditions in the credit markets continued to worsen and the economy fell into a recession. In addition, the credit markets and the financial services industry recently experienced a significant crisis characterized by the bankruptcy or failure of various financial institutions and severe limitations on credit availability. As a result, the credit markets have become highly illiquid as financial and lending institutions severely restricted lending in order to conserve cash and protect their balance sheets. Although Congress and applicable regulatory authorities have enacted legislation and implemented programs designed to protect financial institutions and free up the credit markets, it is unclear whether these actions have been effective to date or will be effective in the future. As the housing industry is dependent upon the economy as well as potential homebuyers’ access to mortgage financing and homebuilders’ access to commercial credit, it is likely there will be further damage to an already weak housing industry until conditions in the economy and the credit markets substantially improve.
We cannot predict the duration of the current market conditions, or the timing or strength of any future recovery of housing activity in our markets. We also cannot provide any assurances that the homebuilding industry will not weaken further, or that the operational strategies we have implemented to address the current market conditions will be successful. Continued weakness in the new residential construction market would have a significant adverse effect on our business, financial condition and operating results. In addition, because of these factors, there may be fluctuations in our operating results, and the results for any historical period may not be indicative of results for any future period.
The non-residential construction industry is currently experiencing a downturn which, if sustained, could materially and adversely affect our business, liquidity and results of operations.
Many of our businesses are dependent on the non-residential construction industry and the slowdown and volatility of the United States economy in general is having an adverse effect on our businesses that serve this industry. According to Moody’s Economy.com, the non-residential construction industry is expected to decline in 2010 at a rate of 10.5%, as office vacancy rates continue to increase, rental costs decrease, the availability of financing continues to be limited and clarity on the strength of the economy remains uncertain. From time to time, our businesses that serve the non-residential construction industry have also been adversely affected in various parts of the country by declines in non-residential construction starts due to, among other things, changes in tax laws affecting the real estate industry, high interest rates and the level of residential construction activity. Continued uncertainty about current economic conditions will continue to pose a risk to our businesses that serve the non-residential construction industry as participants in this industry may postpone spending in response to tighter credit, negative financial news and/or declines in income or asset values, which could have a continued material negative effect on the demand for our products.
10
Table of Contents
Index to Financial Statements
We cannot predict the duration of the current market conditions, or the timing or strength of any future recovery of non-residential construction activity in our markets. We also cannot provide any assurances that the non-residential construction industry will not weaken further. Continued weakness in the non-residential construction market would have a significant adverse effect on our business, financial condition and operating results. In addition, because of these factors, there may be fluctuations in our operating results, and the results for any historical period may not be indicative of results for any future period.
Residential renovation and improvement activity levels are experiencing a downturn which may negatively impact our business, liquidity and results of operations.
Certain of our businesses rely on residential renovation and improvement (including repair and remodeling) activity levels. Unlike most previous cyclical declines in new home construction in which we did not experience comparable declines in our home improvement businesses, the current economic decline is adversely affecting our home improvement businesses as well. According to Moody’s Economy.com, residential improvement project spending in the United States declined 3.4% in 2009. Sharply declining home prices that are expected to continue to decline in 2010, increasing mortgage delinquency and foreclosure rates, reduction in the availability of mortgage and home improvement financing and significantly lower housing turnover, have limited and may continue to limit consumers’ spending, particularly on discretionary items, and affect their confidence level leading to further reduced spending on home improvement projects. The impact of these economic factors specific to the home improvement industry is exacerbated by rising unemployment in a weak job market.
We cannot provide any assurances that current market conditions will not deteriorate further and we cannot predict the timing or strength of a recovery in these markets. Continued depressed activity levels in consumer spending for home improvement and new home construction will continue to adversely affect our results of operations and our financial position. Furthermore, continued economic turmoil may cause unanticipated shifts in consumer preferences and purchasing practices and in the business models and strategies of our customers. Such shifts may alter the nature and prices of products demanded by the end consumer and our customers and could adversely affect our operating performance.
Emergency actions of the U.S. government, the U.S. Treasury, Federal Reserve and other governmental and regulatory bodies for the purpose of stabilizing the financial markets, or market response to those actions are beginning to wind down.
In response to the financial issues affecting the banking system and financial markets and going concern threats to investment banks and other financial institutions, the Emergency Economic Stabilization Act of 2008, or the EESA, was enacted. Additionally, in response to the decline in economic growth in the U.S. brought about by the subprime mortgage crisis and the resulting “credit crunch,” the American Recovery and Reinvestment Act of 2009, or the ARRA, was enacted, which was intended to provide a stimulus to the U.S. economy and includes federal tax cuts, expansion of unemployment benefits and other social welfare provisions, and domestic spending in education, health care and infrastructure, including the energy sector.
Some of these programs have begun to expire and the impact of the winding down of these programs on the financial sector and on the economic recovery is unknown. A continuation or worsening of current financial market conditions could materially and adversely affect our business and results of operations.
We may be unable to achieve or maintain profitability.
We have set goals to progressively improve our profitability over time by increasing our gross margin and reducing our expenses. For the fiscal years 2009 and 2008 we had net losses of $514 million and $1,255 million, respectively. There can be no assurance that we will achieve our enhanced profitability goals. Factors that could significantly adversely affect our efforts to achieve these goals include, but are not limited to, the following:
| — | failure to integrate the businesses we have acquired; |
| — | failure to improve our revenue mix by investing (including through acquisitions) in businesses that provide higher margins than we have been able to generate historically; |
| — | failure to achieve improvements in purchasing or to increase our rebates from vendors through our vendor consolidation and/or low-cost country initiatives; |
11
Table of Contents
Index to Financial Statements
| — | failure to improve our gross margins through the utilization of improved pricing practices and technology and sourcing savings; |
| — | failure to reduce our overhead and support expenses following the full implementation of our new advanced distribution, operating and financial management systems; |
| — | delays in implementing, or unexpected costs associated with, the continued rationalization of our branch distribution and support network; |
| — | failure to effectively evaluate future inventory reserves; and |
| — | inability to maintain vendor rebates at historical levels. |
Any of these failures or delays may adversely affect our ability to increase our profitability.
Our ability to generate the significant amount of cash needed to pay interest and principal on our 12% Senior Notes and our 13.5% Senior Subordinated Notes and service our other debt and our ability to refinance all or a portion of our indebtedness or obtain additional financing depends on many factors beyond our control.
As a holding company, we have no independent operations or material assets other than our ownership of equity interests in our subsidiaries and invested cash, and we depend on our subsidiaries to distribute funds to us so that we may pay our obligations and expenses, including to satisfy our obligations under the notes and our senior secured credit facility (“Senior Secured Credit Facility”) and our asset based lending credit agreement (“ABL Credit Facility” and collectively with the “Senior Secured Credit Facility,” the “Senior Credit Facilities”). Our ability to make scheduled payments on, or to refinance our obligations under, our debt depends on the ability of our subsidiaries to make distributions and dividends to us, which, in turn, depends on their operating results, cash requirements and financial condition, general business conditions, and any legal and regulatory restrictions on the payment of dividends to which they may be subject, many of which may be beyond our control. If we do not receive sufficient distributions from our subsidiaries, we may not be able to meet our obligations to fund general corporate expenses or service our debt obligations, including our 12% Senior Notes and our 13.5% Senior Subordinated Notes.
If our cash flow and capital resources are insufficient to fund our debt service obligations, we may be forced to reduce or delay capital expenditures, sell assets, seek to obtain additional equity capital or refinance our debt. We cannot assure you that we will be able to refinance our debt on terms acceptable to us, or at all. In the future, our cash flow and capital resources may not be sufficient for payments of interest on and principal of our debt, and such alternative measures may not be successful and may not permit us to meet our scheduled debt service obligations.
Significant amounts of our outstanding indebtedness will mature in 2012, 2013 and 2014. As discussed in “Item 7. Management’s Discussion and Analysis of Financial Condition and Results of Operations – Liquidity, capital resources and financial condition— External financing,” we amended and extended certain of our outstanding debt on March 19, 2010. The table below summarizes amounts outstanding as of March 28, 2010 under our Senior Credit Facilities, and the maturity dates of such indebtedness, giving effect to the amendment and extension (amounts in millions).
| August 30,
2012 |
August 30,
2013 |
April 1,
2014 | ||||
| Senior Secured Credit Facility |
||||||
| Term Loan |
$74 | $ – | $874 | |||
| Revolving Credit Facility |
– | 300 | – | |||
| ABL Credit Facility |
||||||
| ABL Term Loan |
– | – | 214 | |||
| ABL Revolving Credit Facility |
60 | – | 315 |
As a result, we may be required to refinance any outstanding amounts under those facilities prior to the maturity date of our 12% Senior Notes and our 13.5% Senior Subordinated Notes. We cannot assure you that we will be able to refinance any of our indebtedness or obtain additional financing, particularly because of our anticipated high levels of debt and the debt incurrence restrictions imposed by the agreements governing our debt, as well as prevailing market conditions. In the absence of such operating results and resources, we could face substantial liquidity problems and might be required to dispose of material assets or operations to meet our debt service and
12
Table of Contents
Index to Financial Statements
other obligations. Our debt facilities and the indentures governing our outstanding notes restrict our ability to dispose of assets and use the proceeds from any such dispositions. We cannot assure you we will be able to consummate those dispositions, or if we do, what the timing of the dispositions will be or whether the proceeds that we realize will be adequate to meet debt service obligations, including under our outstanding notes, when due.
We have substantial debt and may incur substantial additional debt, which could adversely affect our financial health and our ability to obtain financing in the future, react to changes in our business and make payments on the notes.
As of March 28, 2010, we had an aggregate principal amount of $5,832 million of outstanding debt and $353 million available under our ABL Revolving Credit Facility (after giving effect to the borrowing base limitations and approximately $69 million in letters of credit issued). For fiscal 2009, our earnings were insufficient to cover our fixed charges by $716 million. In addition, under our 13.5% Senior Subordinated Notes, we are required to pay interest in kind through 2011. Our debt will increase by the amount of such paid in kind (“PIK”) interest.
Our substantial debt could have important consequences to holders of our 12% Senior Notes and our 13.5% Senior Subordinated Notes. Because of our substantial debt:
| — | our ability to engage in acquisitions without raising additional equity or obtaining additional debt financing may be impaired in the future; |
| — | our ability to obtain additional financing for working capital, capital expenditures, acquisitions, debt service requirements or general corporate purposes and our ability to satisfy our obligations with respect to our outstanding notes may be impaired in the future; |
| — | a substantial portion of our cash flow from operations must be dedicated to the payment of principal and interest on our indebtedness, thereby reducing the funds available to us for other purposes; |
| — | we are exposed to the risk of increased interest rates because a portion of our borrowings, including under our debt facilities, is at variable rates of interest; |
| — | it may be more difficult for us to satisfy our obligations to our creditors, resulting in possible defaults on and acceleration of such indebtedness; |
| — | we may be more vulnerable to general adverse economic and industry conditions, including the ongoing economic downturn; |
| — | we may be at a competitive disadvantage compared to our competitors with less debt or with comparable debt at more favorable interest rates and that, as a result, may be better positioned to withstand economic downturns; |
| — | our ability to refinance indebtedness may be limited or the associated costs may increase; and |
| — | our flexibility to adjust to changing market conditions and our ability to withstand competitive pressures could be limited, or we may be prevented from carrying out capital spending that is necessary or important to our operations in general, growth strategy and efforts to improve operating margins of our businesses. |
Despite current indebtedness levels, we and our subsidiaries may be able to incur substantially more debt, including secured debt. This could further exacerbate the risks associated with our substantial indebtedness.
We and our subsidiaries may be able to incur substantial additional indebtedness in the future. The terms of the indentures governing our 12% Senior Notes and our 13.5% Senior Subordinated Notes do not prohibit us or our subsidiaries from doing so. As of March 28, 2010, our ABL Revolving Credit Facility provided us with availability for additional borrowings of up to $353 million (after giving effect to the borrowing base limitations and approximately $69 million in letters of credit issued). All of those borrowings and any other secured indebtedness permitted under the agreements governing our Senior Credit Facilities and the indentures governing our outstanding notes would be effectively senior to the notes to the extent of the value of the assets securing such indebtedness. In addition, under the 13.5% Senior Subordinated Notes, we are required to pay interest in kind through 2011, which will increase our debt by the amount of such PIK interest. If new debt is added to our current debt levels, the debt-related risks that we now face would increase, and we may not be able
13
Table of Contents
Index to Financial Statements
to meet all our debt obligations, including the repayment of the notes. In addition, the indentures governing our outstanding notes do not prevent us from incurring obligations that do not constitute indebtedness.
The agreements and instruments governing our debt contain restrictions and limitations that could significantly impact our ability to operate our business and adversely affect the holders of our 12% Senior Notes and our 13.5% Senior Subordinated Notes.
The Senior Credit Facilities contain covenants that, among other things, restrict our ability to:
| — | dispose of assets; |
| — | incur additional indebtedness (including guarantees of additional indebtedness); |
| — | prepay the notes or amend other specified debt instruments; |
| — | pay dividends and make certain payments; |
| — | create liens on assets; |
| — | engage in certain asset sales, mergers, acquisitions, consolidations or sales of all or substantially all of our assets; |
| — | engage in certain transactions with affiliates; and |
| — | permit restrictions on our subsidiaries’ ability to pay dividends. |
The indentures governing our 12% Senior Notes and our 13.5% Senior Subordinated Notes also contain restrictive covenants that, among other things, limit our ability and the ability of our restricted subsidiaries to:
| — | incur additional debt; |
| — | pay dividends, redeem stock or make other distributions; |
| — | make certain investments; |
| — | create liens; |
| — | transfer or sell assets; |
| — | merge or consolidate with other companies; and |
| — | enter into certain transactions with our affiliates. |
THD guarantees payment of the Term Loan (the “THD Guarantee”) under the Senior Secured Credit Facility. The THD Guarantee also contains restrictive covenants that limit our ability to and the ability of our restricted subsidiaries to:
| — | incur additional secured debt; and |
| — | pay dividends. |
The restrictions in the indentures governing our outstanding notes, the THD Guarantee, and the Senior Credit Facilities may prevent us from taking actions that we believe would be in the best interest of our business and may make it difficult for us to execute our business strategy successfully or effectively compete with companies that are not similarly restricted. We may also incur future debt obligations that might subject us to additional restrictive covenants that could affect our financial and operational flexibility.
Our ability to comply with the covenants and restrictions contained in the Senior Credit Facilities and the indentures governing our outstanding notes may be affected by economic, financial and industry conditions beyond our control. The breach of any of these covenants or restrictions could result in a default under either the Senior Credit Facilities or the indentures that would permit the applicable lenders or noteholders, as the case may be, to declare all amounts outstanding thereunder to be due and payable, together with accrued and unpaid interest. If we are unable to repay debt, lenders having secured obligations, such as the lenders under the Senior Credit Facilities, could proceed against the collateral securing the secured obligations. In any such case, we may be unable to borrow under the Senior Credit Facilities and may not be able to repay amounts due under such facilities and the notes. This could have serious consequences to our financial condition and results of operations and could cause us to become bankrupt or insolvent.
14
Table of Contents
Index to Financial Statements
We may have future capital needs and may not be able to obtain additional financing on acceptable terms.
Although we believe that the additional committed funding available under our ABL Revolving Credit Facility is sufficient for our current operations, any reductions in our available borrowing capacity, or our inability to renew or replace our debt facilities, when required or when business conditions warrant, could have a material adverse effect on our business, financial condition and results of operations. The economic conditions, credit market conditions, and economic climate affecting our industry, as well as other factors, may constrain our financing abilities. Our ability to secure additional financing, if available, and to satisfy our financial obligations under indebtedness outstanding from time to time will depend upon our future operating performance, the availability of credit generally, economic conditions and financial, business and other factors, many of which are beyond our control. The prolonged continuation or worsening of the current market and the macroeconomic conditions that affect our industry could have a material adverse effect on our ability to secure financing of favorable terms, if at all.
We may be unable to secure additional financing or financing on favorable terms or our operating cash flow may be insufficient to satisfy our financial obligations under indebtedness outstanding from time to time. Furthermore, if financing is not available when needed, or is available on unfavorable terms, we may be unable to take advantage of business opportunities or respond to competitive pressures, any of which could have a material adverse effect on our business, financial condition and results of operations. If additional funds are raised through the issuance of additional equity securities, our stockholders may experience significant dilution.
Increases in interest rates would increase the cost of servicing our debt and could reduce our profitability.
A significant portion of our outstanding debt, including under the Senior Credit Facilities, bears interest at variable rates. As a result, increases in interest rates would increase the cost of servicing our debt and could materially reduce our profitability and cash flows. Each one percentage point change in interest rates would result in a $12 million change in the annual cash interest expense on our term loans outstanding under our Senior Credit Facilities before any principal payment or effect of interest rate swap agreements based on balances as of March 28, 2010. Assuming all revolving loans were fully drawn, each one percentage point change in interest rates would result in a $21 million change in annual cash interest expense on our Senior Credit Facilities. The impact of increases in interest rates could be more significant for us than it would be for some other companies because of our substantial indebtedness.
A downgrade, suspension or withdrawal of the rating assigned by a rating agency to the notes or our Senior Credit Facilities, if any, could cause the liquidity or market value of the notes to decline.
Our 12% Senior Notes and our 13.5% Senior Subordinated Notes have been rated by Standard & Poor’s Corporation and Moody’s Investor Services. Our Senior Credit Facilities have also been rated by Standard & Poor’s and Moody’s. In determining our credit ratings, the rating agencies consider a number of both quantitative and qualitative factors. These factors include earnings, fixed charges such as interest, cash flows, total debt outstanding, total secured debt, off balance sheet obligations and other commitments, total capitalization and various ratios calculated from these factors. Our outstanding notes and our debt facilities may in the future be rated by additional rating agencies. We cannot assure you that any rating so assigned will remain for any given period of time or that a rating will not be lowered or withdrawn entirely by a rating agency if, in that rating agency’s judgment, circumstances relating to the basis of the rating, such as adverse change to our business, so warrant. During the third quarter of fiscal 2009, Standard & Poor’s reaffirmed our B rating, but lowered its outlook to negative and Moody’s Investors Service lowered our rating to CAA1, with a stable outlook, from B3. Both agencies cited our exposure to the ongoing weakness in U.S. construction as well as high leverage levels as the primary pressures on the ratings. Any lowering or withdrawal of a rating by a rating agency could reduce the liquidity or market value of our outstanding notes or increase the cost of borrowing funds under our debt facilities and make our ability to raise new funds or renew maturing debt more difficult.
Goodwill is subject to impairment testing and may affect fair value of reporting units and future cash flows.
As of January 31, 2010, goodwill represented approximately 40% of our total assets. Goodwill is no longer amortized and is subject to impairment testing at least annually using a fair value based approach. The identification and measurement of impairment involves the estimation of the fair value of reporting units.
15
Table of Contents
Index to Financial Statements
Accounting for impairment contains uncertainty because management must use judgment in determining appropriate assumptions to be used in the measurement of fair value. The estimates of fair value of reporting units are based on the best information available as of the date of the assessment and incorporate management assumptions about expected future cash flows and contemplate other valuation techniques. Future cash flows can be affected by changes in industry or market conditions among other things.
The recoverability of goodwill is evaluated at least annually and when events or changes in circumstances indicate that the carrying amount of goodwill may not be recoverable. During fiscal 2009 and fiscal 2008, we recorded goodwill impairment charges of $224 million and $1,053 million, respectively, driven by a reduction in expected future cash flows for certain businesses primarily as a result of the decline in the residential construction market.
In view of the general economic downturn in the U.S., we may be required to take additional impairment charges relating to our operations or close under-performing locations.
During fiscal 2009, we recorded impairment charges related to the carrying value of goodwill for four of our reporting units. In addition, during fiscal 2008, we recorded impairment charges related to the carrying value of goodwill for six of our reporting units and some of our assets. If weakness in the homebuilding industry continues, we may need to take additional goodwill and/or asset impairment charges relating to certain of our reporting units and asset groups. Any such non-cash charges would have an adverse effect on our financial results.
In addition, we have closed certain branches in under-performing markets. As of January 31, 2010, approximately 225 branches have been closed and approximately 4,700 employees have been terminated since the Transactions. We may have to close additional branches in certain of our markets. Such facility closures could have a significant adverse effect on our financial condition, operating results and cash flows.
We occupy most of our facilities under long-term non-cancelable leases. We may be unable to renew leases at the end of their terms. If we close a facility, we remain obligated under the applicable lease.
Most of our facilities are located in leased premises. Many of our current leases are non-cancelable and typically have terms ranging from 3 to 10 years and most provide options to renew for specified periods of time. We believe that leases we enter into in the future will likely be long-term and non-cancelable and have similar renewal options. If we close or idle a facility, we generally remain committed to perform our obligations under the applicable lease, which would include, among other things, payment of the base rent for the balance of the lease term. Over the course of the last three fiscal years, we closed or idled a number of facilities for which we remain liable on the lease obligations. Our obligation to continue making rental payments in respect of leases for closed or idled facilities could have a material adverse effect on our business and results of operations.
The industries in which we operate are highly competitive and fragmented, and demand for our products and services could decrease if we are not able to compete effectively.
The industries in which we operate are fragmented, including the residential, non-residential and public infrastructure construction and facility repair and maintenance markets. There is significant competition in each of our businesses. Our competition includes other wholesalers and manufacturers that sell products directly to their respective customer base and some of our customers that resell our products. To a limited extent, retailers of plumbing, electrical fixtures and supplies, building materials, maintenance repair and operations supplies, and contractors’ tools also compete with us. We also expect that new competitors may develop over time as internet-based enterprises become more established and reliable and refine their service capabilities. Competition varies depending on product line, customer classification and geographic area. The principal competitive factors in our business include, but are not limited to:
| — | availability and cost of materials and supplies; |
| — | technical product knowledge and expertise as to application and usage; |
| — | advisory or other service capabilities; |
| — | ability to build and maintain customer relationships; |
| — | effective use of technology to identify sales and operational opportunities; |
16
Table of Contents
Index to Financial Statements
| — | same-day delivery capabilities in certain product lines; and |
| — | pricing of products and provisions of credit. |
We compete with many local, regional and, in several markets and product categories, other national distributors. Several of our competitors in one or more of our businesses, such as Wolseley (Ferguson Enterprises) in our plumbing/HVAC or WESCO Distribution in our electrical business, have substantially greater financial and other resources than us. No assurance can be given that we will be able to respond effectively to such competitive pressures. Increased competition by existing and future competitors could result in reductions in sales, prices, volumes and gross margins that could materially adversely affect our business, financial condition and results of operations. Furthermore, our success will depend, in part, on our ability to maintain our market share and gain market share from competitors.
In addition, our contracts with municipalities are often awarded and renewed through periodic competitive bidding. We may not be successful in obtaining or renewing these contracts. Our inability to replace a significant number of contracts lost through competitive bidding processes with other revenue sources within a reasonable time could be harmful to our business and financial performance.
Our competitors in the residential, non-residential and infrastructure construction and facility maintenance and repair distribution markets are consolidating, which could cause these markets to become more competitive and could negatively impact our business.
Our competitors in the residential, non-residential and infrastructure construction and facility maintenance and repair distribution markets in the United States and Canada are consolidating. This consolidation is being driven by customer needs and supplier capabilities, which could cause the industries to become more competitive as greater economies of scale are achieved by distributors. Customers are increasingly aware of the total costs of fulfillment and of the need to have consistent sources of supply at multiple locations. We believe these customer needs could result in fewer distributors as the remaining distributors become larger and capable of being a consistent source of supply.
There can be no assurance that we will be able in the future to take advantage effectively of the trend toward consolidation. The trend in our industry toward consolidation could make it more difficult for us to maintain operating margins and could also increase competition for our acquisition targets and result in higher purchase price multiples. Furthermore, as our industrial and construction customers face increased foreign competition, and potentially lose business to foreign competitors or shift their operations overseas in an effort to reduce expenses, we may face increased difficulty in growing and maintaining our market share and growth prospects.
The loss of any of our significant customers or the failure to collect monies owed from customers could adversely affect our financial health.
Our ten largest customers generated approximately 7.9% of our Net sales in fiscal 2009, and our largest customer accounted for 3.9% of our Net sales in that same period. We cannot guarantee that we will maintain or improve our relationships with these customers or that we will continue to supply these customers at historical levels. Due to the economic downturn, some of our customers have reduced their operations. For example, some homebuilder customers have exited or severely curtailed building activity in certain of our markets. A prolonged economic downturn could continue to have a significant adverse effect on our financial condition, operating results and cash flows.
In addition, consolidation among customers could also result in a loss of some of our present customers to our competitors. The loss of one or more of our significant customers or deterioration in our relations with any of them could significantly affect our financial condition, operating results and cash flows. Furthermore, our customers are not required to purchase any minimum amount of products from us. The contracts into which we have entered with most of our customers typically provide that we supply particular products or services for a certain period of time when and if ordered by the customer. Should our customers purchase our products in significantly lower quantities than they have in the past, such decreased purchases could have a material adverse effect on our financial condition, operating results and cash flows.
In addition, if the financial condition of our customers declines, our credit risk could increase. Significant contraction in the construction and industrial markets, coupled with tightened credit availability and financial
17
Table of Contents
Index to Financial Statements
institution underwriting standards, could adversely affect certain of our customers. Should one or more of our larger customers declare bankruptcy, it could adversely affect the collectability of our accounts receivable, bad debt reserves and net income.
The majority of our net sales are credit sales which are made primarily to customers whose ability to pay is dependent, in part, upon the economic strength of the industry and geographic areas in which they operate.
The majority of our Net sales volume in fiscal 2009 was facilitated through the extension of credit to our customers whose ability to pay is dependent, in part, upon the economic strength of the construction industry in the areas where they operate. Our businesses offer credit to customers, either through unsecured credit that is based solely upon the creditworthiness of the customer, or secured credit for materials sold for a specific job where the security lies in lien rights associated with the material going into the job. The type of credit offered depends both on the financial strength of the customer and the nature of the business in which the customer is involved. End users, resellers and other non-contractor customers generally purchase more on unsecured credit than secured credit. The inability of our customers to pay off their credit lines in a timely manner, or at all, would adversely affect our financial condition, operating results and cash flows. Furthermore, our collections efforts with respect to non-paying or slow-paying customers could negatively impact our customer relations going forward.
We are subject to competitive pricing pressure from our customers.
Certain of our largest customers, for example in our CTI business, historically have exerted significant pressure on their outside suppliers to keep prices low because of their market share and their ability to leverage such market share in the highly fragmented building products supply industry. The economic downturn has resulted in increased pricing pressures from our customers. If we are unable to generate sufficient cost savings to offset any price reductions, our financial condition, operating results and cash flows may be adversely affected.
We may not continue to achieve the acquisition component of our growth strategy.
Acquisitions will continue to be an essential component of our growth strategy; however, there can be no assurance that we will be able to continue to grow our business through acquisitions as we have done historically or that any businesses acquired will perform in accordance with expectations or that business judgments concerning the value, strengths and weaknesses of businesses acquired will prove to be correct. Future acquisitions may result in the incurrence of debt and contingent liabilities and an increase in interest expense and amortization expenses and significant charges relative to integration costs. Our strategy will be impeded if we do not identify suitable acquisition candidates and our financial condition and results of operations will be adversely affected if we overpay for opportunities.
Acquisitions involve a number of special risks, including:
| — | problems implementing disclosure controls and procedures; |
| — | unforeseen difficulties extending internal control over financial reporting and performing the required assessment at the newly-acquired business; |
| — | potential adverse short-term effects on operating results through increased costs or otherwise; |
| — | diversion of management’s attention, failure to recruit new, and retain existing, key personnel of the acquired business; |
| — | failure to successfully implement infrastructure, logistics and system integration; |
| — | our business growth could outpace the capability of our systems; |
| — | unforeseen liabilities inherent in the acquired business that manifest themselves after the acquisition is completed; and |
| — | the risks inherent in the systems of the acquired business and risks associated with unanticipated events or liabilities, any of which could have a material adverse effect on our business, financial condition and results of operations. |
In addition, in light of the disruptions in the credit markets, we may not be able to obtain financing necessary to complete acquisitions on attractive terms or at all.
18
Table of Contents
Index to Financial Statements
A range of factors may make our quarterly revenues and earnings variable.
We have historically experienced, and in the future will continue to experience, variability in revenues and earnings on a quarterly basis. The factors expected to contribute to this variability include, among others: (i) the cyclical nature of some of the markets in which we compete, including the new residential and commercial construction markets, (ii) general economic conditions in the various local markets in which we compete, (iii) the pricing policies of our competitors, (iv) the production schedules of our customers, and (v) the effects of the weather. These factors, among others, make it difficult to project our operating results on a consistent basis, which may affect the price of our securities.
The residential, non-residential and infrastructure construction and facility maintenance and repair markets are cyclical and seasonal.
Although weather patterns affect our operating results throughout the year, adverse weather historically has reduced construction and maintenance and repair activity in the fourth and first quarters in our markets. In contrast, our highest volume of net sales historically has occurred in our second fiscal quarter. To the extent that hurricanes, severe storms, floods, other natural disasters or similar events occur in the markets in which we operate, our business may be adversely affected. In addition, most of our businesses experience seasonal variation as a result of the dependence of our customers on suitable weather to engage in construction, maintenance and renovation and improvement projects. For example, White Cap sells products used primarily in the residential and non-residential construction industry. Generally, during the winter months, construction activity declines due to inclement weather and shorter daylight hours. As a result, operating results for the businesses that experience such seasonality may vary significantly from period to period. We anticipate that fluctuations from period to period will continue in the future.
Fluctuating commodity prices may adversely impact our results of operations.
The cost of steel, aluminum, copper, nickel, polyvinyl chlorides (“PVC”) and other commodities used in products we distribute can be volatile. For example, the price of nickel declined significantly during 2008. In our IPVF business, approximately 50% of our Net sales are attributable to nickel-based products. Although we attempt to resist cost increases by our suppliers and to pass on increased costs to our customers, we are not always able to do so quickly or at all. In addition, if prices decrease for commodities used in products we distribute, we may have inventories purchased at higher prices than prevailing market prices. Significant fluctuations in the cost of the commodities used in products we distribute have in the past adversely affected, and in the future may adversely affect, our results of operations and financial condition.
If petroleum prices increase, our results of operations could be adversely affected.
Petroleum prices have fluctuated significantly in recent years. Prices and availability of petroleum products are subject to political, economic and market factors that are generally outside our control. Political events in petroleum-producing regions as well as hurricanes and other weather-related events may cause the price of fuel to increase. Within several of our principal and other businesses, we deliver a significant volume of products to our customers by truck. Our operating profit will be adversely affected if we are unable to obtain the fuel we require or to fully offset the anticipated impact of higher fuel prices through increased prices or fuel surcharges to our customers. Besides passing fuel costs on to customers, we have not entered into any hedging arrangements that protect against fuel price increases and we do not have any long-term fuel purchase contracts. In addition, we estimate that PVC products, which are manufactured from plastic resin derived from petroleum, represented approximately 15% of our fiscal 2009 Net sales in our Waterworks business. If shortages occur in the supply of necessary petroleum products or a sharp increase in the price of petroleum results in higher PVC prices and we are not able to pass along the full impact of increased PVC prices to our customers, our results of operations would be adversely affected.
Product shortages and cyclicality in the residential, non-residential and infrastructure construction and facility maintenance and repair markets may impair our operating results.
Our ability to offer a wide variety of products to our customers is dependent upon our ability to obtain adequate product supply from manufacturers or other suppliers. Generally, our products are obtainable from various
19
Table of Contents
Index to Financial Statements
sources and in sufficient quantities. However, the loss of, or substantial decrease in the availability of, products from our suppliers, or the loss of our key supplier agreements, could adversely impact our financial condition, operating results and cash flows. In addition, supply interruptions could arise from shortages of raw materials (including petroleum products), labor disputes or weather conditions affecting products or shipments, transportation disruptions or other factors beyond our control. Short and long-term disruptions in our supply chain would result in a need to maintain higher inventory levels as we replace similar product domestically, a higher cost of product and ultimately a decrease in our net sales and profitability. A disruption in the timely availability of our products by our key suppliers would result in a decrease in our revenues and profitability, especially in our businesses with supplier concentration, such as our Waterworks business. Although in many instances we have agreements with our suppliers, these agreements are generally terminable by either party on limited notice. Failure by our suppliers to continue to supply us with products on commercially reasonable terms, or at all, would put pressure on our operating margins and have a material adverse effect on our financial condition, operating results and cash flows. Short-term changes in the cost of these materials, some of which are subject to significant fluctuations, are sometimes, but not always passed on to our customers. Our delayed ability to pass on material price increases to our customers could adversely impact our financial condition, operating results and cash flows.
In addition, the residential, non-residential and infrastructure construction and facility maintenance and repair markets are subject to cyclical market pressures. The length and magnitude of these cycles have varied over time and by market. Prices of the products we sell are historically volatile and subject to fluctuations arising from changes in supply and demand, national and international economic conditions, labor costs, competition, market speculation, government regulation and trade policies, as well as from periodic delays in the delivery of our products. We have limited ability to control the timing and amount of changes to prices that we pay for our products. In addition, the supply of our products fluctuates based on available manufacturing capacity. A shortage of capacity or excess capacity in the industry can result in significant increases or declines in market prices for those products, often within a short period of time. Such price fluctuations can adversely affect our financial condition, operating results and cash flows.
We rely on third party suppliers and long supply chains, and if we fail to identify and develop relationships with a sufficient number of qualified suppliers or if there is a significant interruption in our supply chains, our ability to timely and efficiently access products that meet our standards for quality could be adversely affected.
We buy our products and supplies from suppliers located throughout the world and they manufacture or purchase in the United States and abroad the products we buy from them. Our ability to continue to identify and develop relationships with qualified suppliers who can satisfy our standards for quality and our need to access products and supplies in a timely and efficient manner is a significant challenge. We may be required to replace a supplier if their products do not meet our quality or safety standards. In addition, our suppliers could discontinue selling products manufactured in foreign countries at any time for reasons that may or may not be in our control or the suppliers’ control. Our operating results and inventory levels could suffer if we are unable to promptly replace a supplier who is unwilling or unable to satisfy our requirements with a supplier providing equally appealing products. Our suppliers’ ability to deliver products may also be affected by financing constraints caused by credit market conditions, which could negatively impact our revenue and cost of products sold, at least until alternate sources of supply are arranged. In addition, since a portion of the products that we distribute is produced in foreign countries, we are dependent on long supply chains for the successful delivery of many of our products. The length and complexity of these supply chains make them vulnerable to numerous risks, many of which are beyond our control, which could cause significant interruptions or delays in delivery of our products. Factors such as political instability, the financial instability of suppliers, suppliers’ noncompliance with applicable laws, trade restrictions, labor disputes, currency fluctuations, changes in tariff or import policies, severe weather, terrorist attacks and transport capacity and cost may disrupt these supply chains and our ability to access products and supplies. As we increase the percentage of our products that are sourced from lower-cost countries, these risks will be amplified. Moreover, these risks will be amplified by our efforts to consolidate our supplier base across our businesses. We expect more of our products will be imported in the future, which will further increase these risks. A significant interruption in our supply chains caused by any of the above factors could result in increased costs or delivery delays and result in a decrease in our net sales and profitability.
20
Table of Contents
Index to Financial Statements
We have substantial fixed costs and, as a result, our operating income is sensitive to changes in our net sales.
A significant portion of our expenses are fixed costs (including personnel), which do not fluctuate with net sales. Consequently, a percentage decline in our net sales could have a greater percentage effect on our operating income if we do not act to reduce head count or take other cost reduction actions. Any decline in our net sales would cause our profitability to be adversely affected. Moreover, a key element of our strategy is managing our assets, including our substantial fixed assets, more effectively, including through sales or other disposals of excess assets. Our failure to rationalize our fixed assets in the time and within the costs we expect could have an adverse effect on our results of operations and financial condition.
A change in our product mix could adversely affect our results of operations.
Our results may be affected by a change in our sales mix. Our outlook, budgeting and strategic planning assume a certain volume mix of sales as well as a product mix of sales. If actual results vary from this projected volume and product mix of sales, our financial results could be negatively impacted.
The impairment or failure of financial institutions may adversely affect us.
We have exposure to counterparties with which we execute transactions, including U.S. and foreign commercial banks, insurance companies, investment banks, investment funds and other financial institutions, some of which may be exposed to bankruptcy, liquidity, default or similar risks, especially in connection with recent financial market turmoil. Many of these transactions could expose us to risk in the event of the bankruptcy, receivership, default or similar event involving a counterparty. For example, one of the financial institutions that is committed to fund each of our Revolving Credit Facility and our ABL Revolving Credit Facility failed in the third quarter of 2008. While we have not realized any significant losses to date, the bankruptcy, receivership, default or similar event involving one of our financial institution counterparties could have a material adverse impact on our access to funding or our ability to meet our financing agreement obligations.
The development of alternatives to distributors in the supply chain could cause a decrease in our sales and operating results and limit our ability to grow our business.
Our customers could begin purchasing more of their product needs directly from manufacturers, which would result in decreases in our net sales and earnings. Our suppliers could invest in infrastructure to expand their own local sales force and sell more products directly to our customers, which also would negatively impact our business. For example, multiple municipalities may outsource their entire waterworks systems to a single company, thereby increasing such company’s leverage in the marketplace and its ability to buy directly from suppliers, which may have a material adverse effect on our operating results.
In addition to these factors, our customers may: (i) seek to purchase some of the products that we currently sell directly from manufacturers, (ii) elect to establish their own building products manufacturing and distribution facilities, or (iii) give advantages to manufacturing or distribution intermediaries in which they have an economic stake. These changes in the supply chain could adversely affect our financial condition, operating results and cash flows.
Because our business is working-capital intensive, we rely on our ability to manage our product purchasing and customer credit policies.
Our operations are working-capital intensive, and our investments in inventories, accounts receivable and accounts payable are significant components of our net asset base. We manage our inventories and accounts payable through our purchasing policies and our accounts receivable through our customer credit policies. If we fail to adequately manage our product purchasing or customer credit policies, our working capital and financial condition may be adversely affected.
Inclement weather, anti-terrorism measures and other disruptions to the transportation network could impact our distribution system.
Our ability to provide efficient distribution of products to our customers is an integral component of our overall business strategy. Disruptions at distribution centers or shipping ports, due to events such as the hurricanes of 2005 and the longshoreman’s strike on the West Coast in 2002, may affect our ability to both maintain key
21
Table of Contents
Index to Financial Statements
products in inventory and deliver products to our customers on a timely basis, which may in turn adversely affect our results of operations.
Furthermore, in the aftermath of terrorist attacks in the United States, federal, state and local authorities have implemented and are implementing various security measures that affect many parts of the transportation network in the United States and abroad. Our customers typically need quick delivery and rely on our on-time delivery capabilities. If security measures disrupt or impede the timing of our deliveries, we may fail to meet the needs of our customers, or may incur increased expenses to do so.
Interruptions in the proper functioning of IT systems could disrupt operations and cause unanticipated increases in costs or decreases in revenues, or both.
Because we use our information systems to, among other things, manage inventories and accounts receivable, make purchasing decisions and monitor our results of operations, the proper functioning of our IT systems is critical to the successful operation of our business. Although our IT systems are protected through physical and software safeguards and remote processing capabilities exist, IT systems are still vulnerable to natural disasters, power losses, unauthorized access, telecommunication failures and other problems. If critical IT systems fail or are otherwise unavailable, our ability to process orders, track credit risk, identify business opportunities, maintain proper levels of inventories, collect accounts receivable and pay expenses and otherwise manage our businesses would be adversely affected.
The implementation of our technology initiatives could disrupt our operations in the near term, and our technology initiatives might not provide the anticipated benefits or might fail.
We have made, and will continue to make, significant technology investments in each of our businesses and in our administrative functions. In large measure, our continued need to invest heavily in IT (approximately $42 million in fiscal 2009 and $39 million in fiscal 2008) is due to the need to upgrade and integrate legacy systems of the 33 acquisitions we have made since the beginning of fiscal 2005. Many of those entities used systems that were inadequate and required upgrades, particularly in the larger environment of our company. Our technology initiatives are designed to streamline our operations to allow our associates to continue to provide high quality service to our customers and to provide our customers a better experience, while improving the quality of our internal control environment. The cost and potential problems and interruptions associated with the implementation of our technology initiatives could disrupt or reduce the efficiency of our operations in the near term. In addition, our new or upgraded technology might not provide the anticipated benefits, it might take longer than expected to realize the anticipated benefits or the technology might fail altogether.
Our combined financial information as of and for periods prior to the Transactions is not representative of our future financial position, future results of operations or future cash flows nor does it reflect what our financial position, results of operations or cash flows would have been as a stand-alone company during the periods presented.
Our combined financial information as of and for periods prior to the Transactions included in this annual report on Form 10-K is not representative of our future financial position, future results of operations or future cash flows nor does it reflect what our financial position, results of operations or cash flows would have been as a stand-alone company during the periods presented. This is primarily because:
| — | such combined financial information reflects allocation of expenses from Home Depot. Those allocations may be different from the comparable expenses we would have incurred as a stand-alone company; |
| — | our working capital requirements historically were satisfied as part of Home Depot’s corporate-wide cash management policies. In connection with the Transactions, we incurred a large amount of indebtedness and therefore assumed significant debt service costs. As a result, our cost of debt and capitalization is significantly different from that reflected in the historical combined financial information; and |
| — | as a result of the Transactions, we experienced increases in our costs, including the cost to establish an appropriate accounting and reporting system, debt service obligations, improving information technology, and other costs of being a stand-alone company. |
22
Table of Contents
Index to Financial Statements
The interests of the Equity Sponsors may differ from the interests of holders of our 12% Senior Notes and our 13.5% Senior Subordinates Notes.
As a result of the Transactions, the Equity Sponsors and their affiliates own most of the outstanding capital stock of our parent company, HDS Investment Holding, Inc. (“Holding”). Holding entered into a stockholders agreement with its stockholders in connection with the closing of the Transactions which contains, among other things, provisions relating to Holding’s governance, transfer restrictions, tag-along rights, drag-along rights, preemptive rights and certain unanimous approval rights. This stockholders agreement provides that the Equity Sponsors are entitled to elect (or cause to be elected) nine out of ten of Holding’s directors, which includes three designees of each Equity Sponsor. One of the directors designated by the Equity Sponsor associated with CD&R shall serve as the chairman. See “Item 13. Certain Relationships and Related Party Transactions, and Director Independence–Stockholders agreement and stockholder arrangements.” The interests of the Equity Sponsors may differ from those of holders of our outstanding notes in material respects. For example, the Equity Sponsors may have an interest in pursuing acquisitions, divestitures, financings or other transactions that, in their judgment, could enhance their overall equity portfolios, even though such transactions might involve risks to holders of our outstanding notes. The Equity Sponsors are in the business of making investments in companies, and may from time to time in the future, acquire interests in businesses that directly or indirectly compete with certain portions of our business or are suppliers of our customers. The companies in which one or more of the Equity Sponsors invest may also pursue acquisition opportunities that may be complementary to our business and, as a result, those acquisition opportunities may not be available to us. Additionally, the Equity Sponsors may determine that the disposition of some or all of their interests in our company would be beneficial to the Equity Sponsors at a time when such disposition could be detrimental to the holders of our outstanding notes. If we encounter financial difficulties, or we are unable to pay our debts as they mature, the interests of our equity holders might conflict with those of the holders of our outstanding notes. In that situation, for example, the holders of our outstanding notes might want us to raise additional equity from our equity holders or other investors to reduce our leverage and pay our debts, while our equity holders might not want to increase their investment in us or have their ownership diluted and instead choose to take other actions, such as selling our assets. Moreover, the Equity Sponsors’ ownership of our company may have the effect of discouraging offers to acquire control of our company.
Our costs of doing business could increase as a result of changes in U.S. federal, state or local regulations.
Our operations are principally affected by various statutes, regulations and laws in the 44 U.S. states and nine Canadian provinces in which we operate. While we are not engaged in a “regulated” industry, we are subject to various laws applicable to businesses generally, including laws affecting land usage, zoning, the environment, health and safety, transportation, labor and employment practices (including pensions), competition, immigration and other matters. Additionally, building codes may affect the products our customers are allowed to use, and consequently, changes in building codes may affect the saleability of our products. Changes in U.S. federal, state or local regulations governing the sale of some of our products could increase our costs of doing business. In addition, changes to U.S. federal, state and local tax regulations could increase our costs of doing business. We cannot provide assurance that we will not incur material costs or liabilities in connection with regulatory requirements.
We deliver products to our customers through our own fleet of vehicles. The U.S. Department of Transportation, or the “DOT,” regulates our operations in domestic interstate commerce. We are subject to safety requirements governing interstate operations prescribed by the DOT. Vehicle dimensions and driver hours of service also remain subject to both federal and state regulation. More restrictive limitations on vehicle weight and size, trailer length and configuration, or driver hours of service would increase our costs, which, if we are unable to pass these cost increases on to our customers, would reduce our gross margins, increase our selling, general and administrative expenses and reduce our net income.
We cannot predict whether future developments in law and regulations concerning our businesses will affect our business financial condition and results of operations in a negative manner. Similarly, we cannot assess whether our businesses will be successful in meeting future demands of regulatory agencies in a manner which will not materially adversely affect our business, financial condition or results of operations.
23
Table of Contents
Index to Financial Statements
The nature of our business exposes us to construction defect and product liability claims as well as other legal proceedings.
We rely on manufacturers and other suppliers to provide us with the products we sell and distribute. As we do not have direct control over the quality of the products manufactured or supplied by such third party suppliers, we are exposed to risks relating to the quality of the products we distribute and install. It is possible that inventory from a manufacturer or supplier could be sold to our customers and later be alleged to have quality problems or to have caused personal injury, subjecting us to potential claims from customers or third parties. We have been subject to claims in the past, which have been resolved without material financial impact. We are involved in construction defect and product liability claims relating to our various construction trades and the products we distribute and manufacture and relating to products we have installed. In certain situations, we have undertaken to voluntarily remediate any defects, which can be a costly measure.
We also operate a large fleet of trucks and other vehicles and therefore face the risk of accidents. While we currently maintain insurance coverage to address these types of liabilities, we cannot assure you that we will be able to obtain such insurance on acceptable terms in the future, if at all, or that any such insurance will provide adequate coverage against potential claims. Further, while we seek indemnification against potential liability for products liability claims from relevant parties, including but not limited to manufacturers and distributors, we cannot guarantee that we will be able to recover under such indemnification agreements. Moreover, as we increase the number of private label products we distribute, our exposure to potential liability for products liability claims may increase. Product liability claims can be expensive to defend and can divert the attention of management and other personnel for significant time periods, regardless of the ultimate outcome. An unsuccessful product liability defense could be highly costly and accordingly result in a decline in revenues and profitability. In addition, uncertainties with respect to the Chinese legal system may adversely affect us in resolving claims arising from our exclusive brand products manufactured in China. Because many laws and regulations are relatively new and the Chinese legal system is still evolving, the interpretations of many laws, regulations and rules are not always uniform. Finally, even if we are successful in defending any claim relating to the products we distribute, claims of this nature could negatively impact customer confidence in our products and our company.
We are involved in a number of legal proceedings, and while we cannot predict the outcomes of such proceedings and other contingencies with certainty, some of these outcomes may adversely affect our operations or increase our costs.
We are involved in a number of legal proceedings, including government inquiries and investigations, as well as class action, products liability, consumer, employment, tort and other litigation. We cannot predict with certainty the outcomes of these legal proceedings and other contingencies, including environmental remediation and other proceedings commenced by government authorities. The outcome of some of these legal proceedings and other contingencies could require us to take or refrain from taking actions which could adversely affect our operations or could require us to pay substantial amounts of money. Additionally, defending against these lawsuits and proceedings may involve significant expense and diversion of management’s attention and resources from other matters. See “Item 3. Legal Proceedings.”
If we become subject to material liabilities under our self-insured programs, our financial results may be adversely affected.
We provide workers’ compensation, automobile and product/general liability coverage through a program that is partially self-insured. In addition, we provide medical coverage to our employees through a self-insured preferred provider organization. Though we believe that we have adequate insurance coverage in excess of self-insured retention levels, our results of operations and financial condition may be adversely affected if the number and severity of insurance claims increase.
Our success depends upon our ability to attract, train and retain highly qualified associates and key personnel.
To be successful, we must attract, train and retain a large and growing number of highly qualified associates while controlling related labor costs. Our ability to control labor costs is subject to numerous external factors, including prevailing wage rates and health and other insurance costs. We compete with other businesses for
24
Table of Contents
Index to Financial Statements
these associates and invest significant resources in training and motivating them. There is no assurance that we will be able to attract or retain highly qualified associates in the future, including, in particular, those employed by companies we acquire. A very small proportion of our employees are currently covered by collective bargaining or other similar labor agreements. Historically, the effects of collective bargaining and other similar labor agreements on us have not been significant. However, if a larger number of our employees were to unionize, including in the wake of any future legislation that makes it easier for employees to unionize, the effect on us may be negative. Any inability by us to negotiate acceptable new contracts under these collective bargaining arrangements could cause strikes or other work stoppages, and new contracts could result in increased operating costs. If any such strikes or other work stoppages occur, or if other employees become represented by a union, we could experience a disruption of our operations and higher labor costs. Labor relations matters affecting our suppliers of products and services could also adversely affect our business from time to time.
In addition, our business results depend largely upon our executives as well as our branch managers and sales personnel, including those of companies recently acquired, and their experience, knowledge of local market dynamics and specifications and long-standing customer relationships. We customarily sign employment letters providing for an agreement not to compete with key personnel of companies we acquire in order to maintain key customer relationships and manage the transition of the acquired business. Our inability to retain or hire qualified branch managers or sales personnel at economically reasonable compensation levels would restrict our ability to grow our business, limit our ability to continue to successfully operate our business and result in lower operating results and profitability.
Fluctuations in foreign currency exchange rates may significantly reduce our revenues and profitability.
As a wholesale distributor of manufactured products, our profitability is tied to the prices we pay to the manufacturers from which we purchase our products. Some of our suppliers price their products in currencies other than the U.S. dollar or incur costs of production in non-U.S. currencies. Accordingly, depreciation of the U.S. dollar against foreign currencies increases the prices we pay for these products. Even short-term currency fluctuations could adversely impact revenues and profitability if we are unable to pass higher supply costs on to our customers. Our delayed ability to pass on material price increases to our customers could adversely impact our financial condition, operating results and cash flows.
If we are unable to protect our intellectual property rights, or we infringe on the intellectual property rights of others, our ability to compete could be negatively impacted.
Our ability to compete effectively depends, in part, upon our ability to protect and preserve proprietary aspects of our intellectual property, including our trademarks and customer lists. The use of our intellectual property or similar intellectual property by others could adversely impact our ability to compete, cause us to lose net sales or otherwise harm our business. If it became necessary for us to resort to litigation to protect these rights, any proceedings could be burdensome and costly and we may not prevail.
Also, we cannot be certain that the products that we sell do not and will not infringe issued patents or other intellectual property rights of others. Further, we are subject to legal proceedings and claims in the ordinary course of our business, including claims of alleged infringement of the trademarks, patents and other intellectual property rights of third parties by us or our customers in connection with their use of the products that we distribute. Should we be found liable for infringement, we (or our suppliers) may be required to enter into licensing agreements (if available on acceptable terms or at all) or pay damages and cease making or selling certain products. Moreover, we may need to redesign or sell different products to avoid future infringement liability. Any of the foregoing could cause us to incur significant costs, prevent us from selling our products or negatively impact our ability to compete.
Our business may be subject to significant environmental, health and safety costs.
Our operations are subject to a broad range of federal, state, local and foreign environmental health and safety laws and regulations, including those governing discharges to air, soil and water, the handling and disposal of hazardous substances and the investigation and remediation of contamination resulting from releases of petroleum products and other hazardous substances. In the course of our operations, we store fuel in on-site
25
Table of Contents
Index to Financial Statements
storage tanks and we use and dispose of a limited amount of hazardous substances. We cannot assure you that compliance with existing or future environmental, health and safety laws, such as those relating to our remediation obligations, will not adversely affect future operating results.
We may be affected by global climate change or by legal, regulatory or market responses to such potential change.
Concern over climate change, including the impact of global warming, has led to significant federal, state, and international legislative and regulatory efforts to limit greenhouse gas (“GHG”) emissions. For example, in the past several years, the U.S. Congress has considered various bills that would regulate GHG emissions. While these bills have not yet received sufficient Congressional support for enactment, some form of federal climate change legislation is possible in the future. Even in the absence of such legislation, the Environmental Protection Agency, spurred by judicial interpretation of the Clean Air Act, may regulate GHG emissions, especially diesel engine emissions, and this could impose substantial costs on us. These costs include an increase in the cost of the fuel and other energy we purchase and capital costs associated with updating or replacing our internal fleet of trucks and other vehicles prematurely. In addition, new laws or future regulation could directly and indirectly affect our customers and suppliers (through an increase in the cost of production or their ability to produce satisfactory products) and our business (through the impact on our inventory availability, cost of sales, operations or demands for the products we sell). Until the timing, scope and extent of any future regulation becomes known, we cannot predict its effect on our cost structure or our operating results. Notwithstanding our dedication to being a responsible corporate citizen, it is reasonably possible that such legislation or regulation could impose material costs on us. Moreover, even without such legislation or regulation, increased awareness and any adverse publicity in the global marketplace about the GHGs emitted by companies involved in the transportation of goods could harm our reputation and reduce customer demand for our services.
Our failure to achieve and maintain effective disclosure controls and internal control over financial reporting could adversely affect our business, financial position and results of operations.
We are subject to the reporting requirements of the Securities Exchange Act of 1934 (the “Exchange Act”), as amended. We are required to evaluate the effectiveness of our disclosure controls and internal control over financial reporting on a periodic basis and publicly disclose the results of these evaluations and related matters, in accordance with the requirements of Section 404 of the Sarbanes-Oxley Act of 2002. These reporting and other obligations place significant additional demands on our management and administrative and operational resources, including our accounting resources, which could adversely affect our operations among other things. To comply with these requirements, we have upgraded, and are continuing to upgrade our systems, including information technology, implemented additional financial and management controls, reporting systems and procedures and hired additional legal, internal audit, accounting and finance staff. We cannot be certain that we will be successful in implementing or maintaining adequate control over our financial reporting and financial processes. Furthermore, as we grow our business, our disclosure controls and internal controls will become more complex, and we will require significantly more resources to ensure that these controls remain effective. If we are unable to continue upgrading our financial and management controls, reporting systems, information technology and procedures in a timely and effective fashion, additional management and other resources of our company may need to be devoted to assist in compliance with the disclosure and financial reporting requirements and other rules that apply to reporting companies, which could adversely affect our business, financial position and results of operations.
26
Table of Contents
Index to Financial Statements
As of January 31, 2010, HD Supply reported 770 branches in the United States and Canada, as is shown in the tables below. These locations utilized approximately 21 million square feet, of which approximately 11% was owned (including locations subject to a ground lease) and approximately 89% was leased. We generally prefer to lease our locations, as it provides the flexibility to expand or relocate our sites as needed to serve evolving markets.
| UNITED STATES | STATE TOTALS | |||||
| Alabama |
AL | 8 | ||||
| Alaska |
AK | 1 | ||||
| Arizona |
AZ | 48 | ||||
| Arkansas |
AR | 4 | ||||
| California |
CA | 95 | ||||
| Colorado |
CO | 19 | ||||
| Delaware |
DE | 3 | ||||
| Florida |
FL | 91 | ||||
| Georgia |
GA | 40 | ||||
| Hawaii |
HI | 3 | ||||
| Idaho |
ID | 3 | ||||
| Illinois |
IL | 17 | ||||
| Indiana |
IN | 13 | ||||
| Iowa |
IA | 5 | ||||
| Kansas |
KS | 5 | ||||
| Kentucky |
KY | 7 | ||||
| Louisiana |
LA | 11 | ||||
| Maryland |
MD | 12 | ||||
| Massachusetts |
MA | 2 | ||||
| Michigan |
MI | 4 | ||||
| Minnesota |
MN | 6 | ||||
| Mississippi |
MS | 9 | ||||
| Missouri |
MO | 13 | ||||
| Montana |
MT | 5 | ||||
| Nebraska |
NE | 4 | ||||
| Nevada |
NV | 11 | ||||
| New Jersey |
NJ | 6 | ||||
| New Mexico |
NM | 7 | ||||
| North Carolina |
NC | 49 | ||||
| Ohio |
OH | 22 | ||||
| Oklahoma |
OK | 6 | ||||
| Oregon |
OR | 6 | ||||
| Pennsylvania |
PA | 8 | ||||
| South Carolina |
SC | 21 | ||||
| South Dakota |
SD | 2 | ||||
| Tennessee |
TN | 12 | ||||
| Texas |
TX | 69 | ||||
| Utah |
UT | 9 | ||||
| Virginia |
VA | 21 | ||||
| Washington |
WA | 19 | ||||
| West Virginia |
WV | 4 | ||||
| Wisconsin |
WI | 4 | ||||
| Wyoming |
WY | 6 | ||||
| SUBTOTAL (U.S. Only) | 710 | |||||
27
Table of Contents
Index to Financial Statements
| CANADA | PROV. TOTALS | |||||
| Alberta |
AB | 6 | ||||
| British Columbia |
BC | 4 | ||||
| Manitoba |
MB | 2 | ||||
| New Brunswick |
NB | 1 | ||||
| Nova Scotia |
NS | 2 | ||||
| Ontario |
ON | 41 | ||||
| Prince Edward Island |
PE | 1 | ||||
| Quebec |
QC | 2 | ||||
| Saskatchewan |
SK | 1 | ||||
| SUBTOTAL (Canada Only) | 60 | |||||
| TOTAL | 770 | |||||
HD Supply is involved in litigation from time to time in the ordinary course of business. In management’s opinion, none of the proceedings are material in relation to the consolidated operations, cash flows, or financial position of HD Supply and the Company has adequate reserves to cover its estimated probable loss exposure.
28
Table of Contents
Index to Financial Statements
PART II
ITEM 6. SELECTED FINANCIAL DATA
The selected consolidated and combined financial data set forth below should be read in conjunction with “Management’s discussion and analysis of financial condition and results of operations” and the audited consolidated and combined financial statements and related notes appearing elsewhere in this annual report on Form 10-K. Our consolidated and combined financial information may not be indicative of our future performance and our combined financial information does not reflect what our financial position and results of operations would have been had we operated as a separate stand-alone entity during the Predecessor periods. See “Item 1A. Risk Factors - Our combined financial information as of and for periods prior to the Transactions is not representative of our future financial position, future results of operations or future cash flows nor does it reflect what our financial position, results of operations or cash flows would have been as a stand-alone company during the periods presented.” In addition, we note that due to the significant size and number of acquisitions we completed in the fiscal year ended January 28, 2007 and the period from January 29, 2007 to August 29, 2007, our historical data is not directly comparable on a period-over-period basis. See “Item 1. Business – Our history.”
29
Table of Contents
Index to Financial Statements
Selected consolidated and combined financial information
| Successor | Predecessor | |||||||||||||||||||||
| Fiscal year ended | Period from | Period from | Fiscal year ended | |||||||||||||||||||
| (Dollars in millions) | January 31, 2010 |
February 1, 2009 |
August 30, 2007 to February 3, 2008 |
January 29, 2007 to August 29, 2007 |
January 28, 2007 |
January 29, 2006 |
||||||||||||||||
| Statement of income data: |
||||||||||||||||||||||
| Net sales |
$7,418 | $9,768 | $4,599 | $7,121 | $11,254 | $4,276 | ||||||||||||||||
| Cost of sales |
5,422 | 7,134 | 3,372 | 5,220 | 8,220 | 2,975 | ||||||||||||||||
|
Gross profit |
1,996 | 2,634 | 1,227 | 1,901 | 3,034 | 1,301 | ||||||||||||||||
| Operating expenses: |
||||||||||||||||||||||
| Selling, general and administrative(1) |
1,680 | 2,063 | 1,001 | 1,424 | 2,094 | 943 | ||||||||||||||||
| Depreciation and amortization |
386 | 403 | 168 | 115 | 184 | 68 | ||||||||||||||||
| Restructuring |
28 | 34 | – | – | – | – | ||||||||||||||||
| Goodwill impairment |
224 | 1,053 | – | – | – | – | ||||||||||||||||
|
Total operating expenses |
$2,318 | $3,553 | $1,169 | $1,539 | $2,278 | $1,011 | ||||||||||||||||
| Operating income (loss) |
(322 | ) | (919 | ) | 58 | 362 | 756 | 290 | ||||||||||||||
| Interest expense |
602 | 644 | 289 | 221 | 321 | 55 | ||||||||||||||||
| Interest (income) |
– | (2 | ) | – | – | – | – | |||||||||||||||
| Other (income) expense, net |
(208 | ) | 11 | – | – | – | – | |||||||||||||||
|
Income (loss) from continuing operations before provision for income taxes and discontinued operations |
(716 | ) | (1,572 | ) | (231 | ) | 141 | 435 | 235 | |||||||||||||
| Provision (benefit) for income taxes |
(211 | ) | (318 | ) | (83 | ) | 58 | 169 | 92 | |||||||||||||
| Income (loss) from continuing operations |
(505 | ) | (1,254 | ) | (148 | ) | 83 | 266 | 143 | |||||||||||||
| Income (loss) from discontinued operations, net of tax |
(9 | ) | (1 | ) | (15 | ) | (27 | ) | 7 | 7 | ||||||||||||
| Net income (loss) |
$(514 | ) | $(1,255 | ) | $(163 | ) | $56 | $273 | $150 | |||||||||||||
|
Balance sheet data (end of period): |
||||||||||||||||||||||
| Working capital (unaudited)(2) |
$1,925 | $2,071 | $2,009 | $1,984 | $783 | |||||||||||||||||
| Cash and cash equivalents |
539 | 771 | 108 | 22 | 1 | |||||||||||||||||
| Total assets |
7,845 | 9,088 | 10,593 | 11,365 | 5,132 | |||||||||||||||||
| Total debt(3) |
5,775 | 6,056 | 5,800 | 6,408 | 2,852 | |||||||||||||||||
| Total stockholders’ and owner’s equity |
688 | 1,175 | 2,433 | 2,970 | 1,340 | |||||||||||||||||
|
Other financial data: |
||||||||||||||||||||||
| Cash interest expense(4) |
$363 | $397 | $191 | $221 | $321 | $55 | ||||||||||||||||
|
EBITDA(5 ) |
278 | (519 | ) | 230 | 481 | 947 | 361 | |||||||||||||||
| Adjusted EBITDA(5) |
355 | 601 | 233 | 514 | 964 | 370 | ||||||||||||||||
| Capital expenditures |
58 | 77 | 75 | 176 | 243 | 91 | ||||||||||||||||
| Ratio of earnings to fixed charges (unaudited)(6) |
1.5x | 1.9x | 2.7x | |||||||||||||||||||
|
Statement of cash flows data: |
||||||||||||||||||||||
| Cash flows provided by (used in) operating activities (net) |
$69 | $548 | $364 | $408 | $248 | $441 | ||||||||||||||||
| Cash flows provided by (used in) investing activities (net) |
(41 | ) | 37 | (8,255 | ) | (140 | ) | (4,185 | ) | (2,447 | ) | |||||||||||
| Cash flows provided by (used in) financing activities (net) |
(263 | ) | 86 | 7,977 | (269 | ) | 3,958 | 2,007 | ||||||||||||||
| (1) | In fiscal 2006, we adopted the fair value based method of accounting for stock-based employee compensation as required by the Financial Accounting Standards Board’s guidance on share-based payments. The fair-value based method requires us to expense all stock-based employee compensation. Effective January 30, 2006, we have adopted this guidance using the modified prospective method. Accordingly, we have expensed all unvested options granted prior to fiscal 2003 in addition to continuing to recognize stock-based compensation expense for all share-based payments awarded since the adoption of the guidance in fiscal 2003, but prior period amounts have not been retrospectively adjusted. |
| (2) | We define working capital as current assets (including cash) minus current liabilities, which include the current portion of long-term debt and accrued interest thereon. |
| (3) | Total debt includes current and non-current installments of long-term debt and capital leases. |
30
Table of Contents
Index to Financial Statements
| (4) | Cash interest expense represents total interest expense in continuing operations less (i) amortization of deferred financing costs, (ii) amortization of the asset related to the estimated fair value of the THD Guarantee, (iii) paid-in-kind (“PIK”) interest expense on our 13.5% Senior Subordinated Notes and (iv) amortization of amounts in accumulated other comprehensive income related to derivatives. |
The following table provides a reconciliation of interest expense, the most directly comparable financial measure under generally accepted accounting principles in the United States of America (“U.S. GAAP”), to cash interest expense for the periods presented (amounts in millions):
| Successor | Predecessor | ||||||||||||||||||
| Fiscal year ended | Period from | Period from | Fiscal year ended | ||||||||||||||||
| January 31, 2010 |
February 1, 2009 |
August 30, 2007 to February 3, 2008 |
January 29, 2007 to August 29, 2007 |
January 28, 2007 |
January 29, 2006 | ||||||||||||||
| Interest expense | $602 | $644 | $289 | $221 | $321 | $55 | |||||||||||||
| Amortization of deferred financing costs | (33 | ) | (33 | ) | (14 | ) | – | – | – | ||||||||||
| Amortization of THD Guarantee | (21 | ) | (21 | ) | (9 | ) | – | – | – | ||||||||||
| PIK interest expense on our 13.5% Senior Subordinated Notes | (182 | ) | (192 | ) | (75 | ) | – | – | – | ||||||||||
| Amortization of amounts in accumulated other comprehensive income related to derivatives | (3 | ) | (1 | ) | – | – | – | – | |||||||||||
| Cash interest expense | $363 | $397 | $191 | $221 | $321 | $55 | |||||||||||||
Cash interest expense is not a recognized term under U.S. GAAP and does not purport to be an alternative to interest expense. Management believes that cash interest expense is useful for analyzing the cash flow needs and debt service requirements of the Company.
| (5) | EBITDA, a measure used by management to evaluate operating performance, is defined as Net income (loss) less Income (loss) from discontinued operations, net of tax, plus (i) Interest expense and Interest income, net, (ii) Provision (benefit) for income taxes, and (iii) Depreciation and amortization. EBITDA is not a recognized term under U.S. GAAP and does not purport to be an alternative to net income as a measure of operating performance or to cash flows from operating activities as a measure of liquidity. Additionally, EBITDA is not intended to be a measure of free cash flow available for management’s discretionary use, as it does not consider certain cash requirements such as interest payments, tax payments and other debt service requirements. We believe EBITDA is helpful in highlighting trends because EBITDA excludes the results of decisions that are outside the control of operating management and that can differ significantly from company to company depending on long-term strategic decisions regarding capital structure, the tax jurisdictions in which companies operate, age and book depreciation of facilities and capital investments. In addition, EBITDA provides more comparability between the historical results of HD Supply during the Predecessor periods and results that reflect the new capital structure in the Successor periods. We further believe that EBITDA is frequently used by securities analysts, investors and other interested parties in their evaluation of companies, many of which present an EBITDA measure when reporting their results. We compensate for the limitations of using non-GAAP financial measures by using them to supplement U.S. GAAP results to provide a more complete understanding of the factors and trends affecting the business than U.S. GAAP results alone. Because not all companies use identical calculations, our presentation of EBITDA may not be comparable to other similarly titled measures of other companies. |
In addition, we present Adjusted EBITDA because it is based on “Consolidated EBITDA,” a measure which is used in calculating financial ratios in several material debt covenants in our Senior Secured Credit Facility and our ABL Credit Facility. Borrowings under these facilities are a key source of liquidity and our ability to borrow under these facilities depends upon, among other things, our compliance with such financial ratio covenants. In particular, both facilities contain restrictive covenants that can restrict our activities if we do not maintain financial ratios calculated based on Consolidated EBITDA and our ABL Credit Facility requires us to maintain a fixed charge coverage ratio of 1:1 if we do not maintain $210 million of borrowing availability. Adjusted EBITDA is defined as EBITDA adjusted to exclude non-cash items and certain other adjustments to Consolidated Net Income permitted in calculating Consolidated EBITDA under our Senior Secured Credit Facility and our ABL Credit Facility. We believe that inclusion of supplementary adjustments to EBITDA applied in presenting Adjusted EBITDA is appropriate to provide additional information to investors about how the covenants in those agreements operate and about certain non-cash items, items that we do not expect to continue at the same level and other items. The Senior Secured Credit Facility and ABL Credit Facility permit us to make certain adjustments to Consolidated Net Income in calculating Consolidated EBITDA, such as projected net cost savings, which are not reflected in the Adjusted EBITDA data presented in this annual report on Form 10-K. We may in the future reflect such permitted adjustments in our calculations of Adjusted EBITDA. These covenants are important to the Company as failure to comply with certain covenants would result in a default under our Senior Credit Facilities. The material covenants in our Senior Credit Facilities are discussed in “Item 7. Management’s Discussion and Analysis of Financial Condition and Results of Operations – Liquidity and Capital Resources – External Financing.”
31
Table of Contents
Index to Financial Statements
EBITDA and Adjusted EBITDA have limitations as analytical tools and should not be considered in isolation or as substitutes for analyzing our results as reported under U.S. GAAP. Some of these limitations are:
| • | EBITDA and Adjusted EBITDA do not reflect changes in, or cash requirements for, our working capital needs; |
| • | EBITDA and Adjusted EBITDA do not reflect our interest expense, or the requirements necessary to service interest or principal payments on our debt; |
| • | EBITDA and Adjusted EBITDA do not reflect our income tax expenses or the cash requirements to pay our taxes; |
| • | EBITDA and Adjusted EBITDA do not reflect historical cash expenditures or future requirements for capital expenditures or contractual commitments; and |
| • | although depreciation and amortization charges are non-cash charges, the assets being depreciated and amortized will often have to be replaced in the future, and EBITDA and Adjusted EBITDA do not reflect any cash requirements for such replacements. |
The following table presents a reconciliation of net income (loss), the most directly comparable financial measure under U.S. GAAP, to EBITDA and Adjusted EBITDA for the periods presented (amounts in millions).
| Successor | Predecessor | ||||||||||||||||||||
| Fiscal year ended | Period from | Period from | Fiscal year ended | ||||||||||||||||||
| January 31, 2010 |
February 1, 2009 |
August 30, 2007 to February 3, 2008 |
January 29, 2007 to August 29, 2007 |
January 28, 2007 |
January 29, 2006 |
||||||||||||||||
| Net income (loss) |
$ (514 | ) | $ (1,255 | ) | $ (163 | ) | $ 56 | $ 273 | $ 150 | ||||||||||||
| Less income (loss) from discontinued operations, net of tax |
9 | 1 | 15 | 27 | (7 | ) | (7 | ) | |||||||||||||
| Income (loss) from continuing operations |
(505 | ) | (1,254 | ) | (148 | ) | 83 | 266 | 143 | ||||||||||||
| Interest expense, net |
602 | 642 | 289 | 221 | 321 | 55 | |||||||||||||||
| Provision (benefit) from income taxes |
(211 | ) | (318 | ) | (83 | ) | 58 | 169 | 92 | ||||||||||||
| Depreciation and amortization |
392 | 411 | 172 | 119 | 191 | 71 | |||||||||||||||
| EBITDA |
$ 278 | $ (519 | ) | $ 230 | $ 481 | $ 947 | $ 361 | ||||||||||||||
|
Adjustments to EBITDA: |
|||||||||||||||||||||
| Other (income) expense, net (i) |
(208 | ) | 11 | – | – | – | – | ||||||||||||||
| Goodwill impairment (ii) |
224 | 1,053 | – | – | – | – | |||||||||||||||
| Restructuring charge (iii) |
38 | 36 | – | – | – | – | |||||||||||||||
| Stock-based compensation (iv) |
18 | 14 | 1 | 33 | 17 | 9 | |||||||||||||||
| Management fee & related expenses paid to Equity Sponsors (v) |
5 | 6 | 2 | – | – | – | |||||||||||||||
| Adjusted EBITDA |
$ 355 | $ 601 | $ 233 | $ 514 | $ 964 | $ 370 | |||||||||||||||
|
|
|||||||||||||||||||||
| (i) | Represents the gain on extinguishment of debt, the gains/losses associated with the changes in fair value of interest rate swap contracts not accounted for under hedge accounting, and other non-operating income/expense. |
| (ii) | Represents the non-cash impairment charge of goodwill recognized during fiscal 2009 and fiscal 2008 in accordance with Accounting Standards Codification 350, Intangibles – Goodwill and Other. |
| (iii) | Represents the costs incurred for employee reductions and branch closures or consolidations. These costs include occupancy costs, severance, and other costs incurred to exit a location. |
| (iv) | The Predecessor periods include stock-based compensation costs for stock options, Employee Stock Purchase Plans and restricted stock. The Successor periods include stock-based compensation costs for stock options. |
| (v) | The Company entered into a management agreement whereby the Company pays the Equity Sponsors a $5 million annual aggregate management fee. In addition, the Company reimburses certain Equity Sponsor expenses. |
Amounts were derived from our consolidated and combined financial statements.
| (6) | For the purposes of calculating the ratio of earnings to fixed charges, earnings consist of Income from continuing operations before provision (benefit) for income taxes plus fixed charges. Fixed charges include cash and non-cash interest expense, whether expensed or capitalized, amortization of debt issuance cost, amortization of the THD Guarantee and the portion of rental expense representative of the interest factor. The ratio of earnings to fixed charges was calculated as follows (amounts in millions): |
32
Table of Contents
Index to Financial Statements
| Successor | Predecessor | |||||||||||||||
| Fiscal year ended | Period from | Period from | Fiscal year ended | |||||||||||||
| January 31, 2010 |
February 1, 2009 |
August 30, 2007 to February 3, 2008 |
January 29, 2007 to August 29, 2007 |
January 28, 2007 |
January 29, 2006 | |||||||||||
| Income (loss) from continuing operations before provision (benefit) for income taxes |
$ (716) | $ (1,572) | $ (231) | $ 141 | $ 435 | $ 235 | ||||||||||
| Add: |
||||||||||||||||
| Interest expense |
602 | 644 | 289 | 262 | 424 | 115 | ||||||||||
| Portion of rental expense under operating leases deemed to be the equivalent of interest |
60 | 65 | 28 | 41 | 59 | 20 | ||||||||||
| Adjusted earnings |
$ (54) | $ (863) | $ 86 | $ 444 | $ 918 | $ 370 | ||||||||||
| Fixed charges: |
||||||||||||||||
| Interest expense |
$ 602 | $ 644 | $ 289 | $ 262 | $ 424 | $ 115 | ||||||||||
| Portion of rental expense under operating leases deemed to be the equivalent of interest |
60 | 65 | 28 | 41 | 59 | 20 | ||||||||||
| Total fixed charges |
$ 662 | $ 709 | $ 317 | $ 303 | $ 483 | $ 135 | ||||||||||
| Ratio of earnings to fixed charges(i) |
1.5x | 1.9x | 2.7x | |||||||||||||
| (i) | For fiscal 2009, fiscal 2008, and the period from August 30, 2007 to February 3, 2008, our earnings were insufficient to cover fixed charges by $716 million, $1,572 million and $231 million, respectively. |
33
Table of Contents
Index to Financial Statements
ITEM 7. MANAGEMENT’S DISCUSSION AND ANALYSIS OF FINANCIAL CONDITION AND RESULTS OF OPERATIONS
Overview
We are one of the largest wholesale distributors based on sales serving the highly fragmented U.S. and Canadian Infrastructure & Energy, Maintenance, Repair & Improvement, and Specialty Construction market sectors. Through approximately 800 locations across the United States and Canada, we operate a diverse portfolio of distribution businesses that provide over 1 million SKUs to over 450,000 professional customers, including contractors, government entities, maintenance professionals, home builders and industrial businesses.
Description of market sectors
Through ten wholesale distribution businesses in the U.S. and a Canadian operation, we provide products and services to professional customers in the Infrastructure & Energy, Maintenance, Repair & Improvement and Specialty Construction market sectors, as presented below:
Infrastructure & Energy – To support established infrastructure and economic growth, our Infrastructure & Energy businesses serve customers in the Infrastructure & Energy market sector by meeting their demand for the critical supplies and services used to build and maintain water systems, oil refineries, and petrochemical plants, and for the generation, transmission, distribution and application of electrical power. This market sector is made up of the following businesses:
| — | Waterworks – Distributes complete lines of water and wastewater transmission products, serving contractors and municipalities in all aspects of the water and wastewater industries. |
| — | Utilities – Distributes electrical transmission and distribution products, power plant maintenance, repair and operations (“MRO”) supplies and smart-grid technologies and provides materials management and procurement outsourcing arrangements to investor-owned utilities, municipal and provincial power authorities, rural electric cooperatives and utility contractors. |
| — | Industrial Pipe, Valves and Fittings (“IPVF”) – Distributes stainless steel and special alloy pipes, plates, sheets, flanges and fittings, as well as high performance valves, actuation services and high-density polyethylene pipes and fittings for oil and gas, petrochemical, power, food and beverage, pulp and paper, mining, and marine industries; IPVF also serves pharmaceutical customers, industrial and mechanical contractors, fabricators, wholesale distributors, exporters and original equipment manufacturers. |
| — | Electrical – Supplies electrical products such as wire and cable, switch gear supplies, lighting and conduit to residential and commercial contractors. |
Maintenance, Repair & Improvement – Our Maintenance, Repair & Improvement businesses serve customers in the Maintenance, Repair & Improvement market sector by meeting their continual demand for supplies needed to fix and upgrade facilities across multiple industries. This market sector is made up of the following businesses:
| — | Facilities Maintenance – Supplies MRO products and upgrade and renovation services largely to the multifamily, healthcare, hospitality, and institutional markets. |
| — | Crown Bolt – A retail distribution operator, providing program and packaging solutions, sourcing, distribution, and in-store service, primarily serving The Home Depot, Inc. |
| — | Repair & Remodel – Offers light remodeling and construction supplies primarily to small remodeling contractors and trade professionals. |
Specialty Construction – Our Specialty Construction businesses serve customers in the Specialty Construction market sector by meeting their very distinct, customized supply needs in commercial, residential and industrial applications. This market sector is made up of the following businesses:
| — | White Cap – Distributes specialized hardware, tools and building materials to professional contractors. |
34
Table of Contents
Index to Financial Statements
HD SUPPLY, INC.
MANAGEMENT’S DISCUSSION AND ANALYSIS OF FINANCIAL CONDITION AND RESULTS OF OPERATIONS
(Continued)
| — | Plumbing – Distributes plumbing fixtures, faucets and finishes, HVAC equipment, pipes, valves, fittings and water heaters, as well as related services, to residential and commercial contractors. |
| — | Creative Touch Interiors (“CTI”) – Offers turnkey flooring installation services and countertop, cabinet and window covering installation services for the interior finish of residential and non-residential construction projects. |
For a description of the relationship among our market sectors, our businesses and our financial reporting segments, see “Item 1. Business – Our sectors” within Part I of this annual report on Form 10-K.
Discontinued operations
On February 3, 2008, we closed on an agreement with ProBuild Holdings, selling all our interests in our Lumber and Building Materials operations. Cash proceeds of $105 million, less $2.5 million remaining in escrow and $2 million of professional service fees, were received on February 4, 2008. In April 2009, the Company received the remaining $2.5 million cash proceeds from escrow. Based on the net book value of net assets sold and the net proceeds, no gain or loss on the sale was recorded. As a condition of the agreement, HD Supply retained certain facilities that have been shut down. These facilities are recorded at fair value less costs to sell and are presented as Other current assets in the consolidated balance sheets. In addition, on-going lease liabilities and other occupancy costs, net of estimated sublease income, have been accrued and are presented as Other accrued expenses and Other long-term liabilities in the consolidated balance sheets.
In accordance with accounting principles generally accepted in the United States of America (“U.S. GAAP”), the results of the Lumber and Building Materials segment are classified as discontinued operations. The presentation of discontinued operations includes revenues and expenses, net of tax, of the Lumber and Building Materials operations as one line item on the consolidated and combined statements of operations. For additional detail related to the results of operations of the discontinued operations, see “Note 3 – Discontinued operations” in the notes to the consolidated and combined financial statements within Item 8 of Part II of this annual report on Form 10-K.
Key business metrics
Revenues
We earn our revenues primarily from the sale of over 1 million construction, infrastructure, maintenance and renovation and improvement related products and our provision of related services to over 450,000 professional customers, including contractors, government entities, maintenance professionals, home builders and industrial businesses. We recognize substantially all of our revenue, net of sales tax and allowances for returns and discounts, when persuasive evidence of an agreement exists, delivery has occurred or services have been rendered, price to the buyer is fixed and determinable and collectability is reasonably assured. Net sales in certain of our market sectors, particularly Infrastructure & Energy, fluctuate with the costs of required commodities.
We ship products to customers predominantly by internal fleet and to a lesser extent by third party carriers. Revenues are recognized from product sales when title to the products is passed to the customer, which generally occurs at the point of destination for products shipped by internal fleet and at the point of shipping for products shipped by third party carriers.
We include shipping and handling fees billed to customers in Net sales. Shipping and handling costs associated with inbound freight are capitalized to inventories and relieved through Cost of sales as inventories are sold. Shipping and handling costs associated with outbound freight are included in Selling, general and administrative expenses and totaled $97 million, $125 million, $62 million, and $87 million in fiscal 2009, in fiscal 2008, in the period from August 30, 2007 to February 3, 2008, and in the period from January 29, 2007 to August 29, 2007, respectively.
35
Table of Contents
Index to Financial Statements
HD SUPPLY, INC.
MANAGEMENT’S DISCUSSION AND ANALYSIS OF FINANCIAL CONDITION AND RESULTS OF OPERATIONS
(Continued)
Gross profit
Gross profit primarily represents the difference between the product cost from our suppliers (net of earned rebates and discounts) including the cost of inbound freight and the sale price to our customers. The cost of outbound freight (including internal transfers), purchasing, receiving and warehousing are included in Selling, general and administrative expenses within operating expenses. Our gross profits may not be comparable to those of other companies, as other companies may include all of the costs related to their distribution network in cost of sales. We intend to improve gross profit through the continued implementation of analytical pricing optimization tools, which enable more sophisticated and disciplined product pricing at the individual customer level.
Operating expenses
Operating expenses are comprised of selling, general and administrative costs, including payroll expenses (salaries, wages, employee benefits, payroll taxes and bonuses), rent, insurance, utilities, repair and maintenance and professional fees, as well as depreciation and amortization, restructuring charges, and goodwill impairments.
Relationship with Home Depot
Historical relationship
On August 30, 2007, investment funds associated with Bain Capital Partners, LLC, The Carlyle Group and Clayton, Dubilier & Rice, Inc. formed HDS Investment Holding, Inc. (“Holding”) and entered into a stock purchase agreement with The Home Depot, Inc. (“Home Depot” or “THD”) pursuant to which Home Depot agreed to sell to Holding or to a wholly owned subsidiary of Holding certain intellectual property and all the outstanding common stock of HD Supply, Inc. and the Canadian subsidiary CND Holdings, Inc. On August 30, 2007, through a series of transactions, Holding’s direct wholly-owned subsidiary, HDS Holding Corporation, acquired direct control of HD Supply through the merger of its wholly owned subsidiary, HDS Acquisition Corp., with and into HD Supply (the “Company”). Through these transactions (the “Transactions”), Home Depot was paid cash of $8.2 billion and 12.5% of HDS Holding’s common stock worth $325 million for certain intellectual property and all of the outstanding common stock of HD Supply and CND Holdings, including all dividends and interest payable associated with those shares. During the first quarter of fiscal 2009, the Company received $22 million from Home Depot for the working capital adjustment and settlement of other items finalizing the purchase price of the Transactions.
Prior to the Transactions, Home Depot provided various support services to us, including human resources, tax, accounting, IT, legal, internal audit, operations and marketing. Cost for these services, which we refer to as the “THD management fee,” was charged to us based on specific identification of the services.
Home Depot also charged other costs directly to us such as payroll and related benefits, worker’s compensation and general liability self insurance costs, stock compensation, and general and administrative costs. These costs are recorded within Selling, general and administrative expenses.
Prior to the Transactions, we received advances from and made advances to Home Depot that represented loan and deposit agreements between various HD Supply entities and Home Depot. These agreements included debt funding as well as cash sweep arrangements. The interest rates when there were amounts due to Home Depot were the 90- day LIBOR rate plus a range from 100 to 250 points. When amounts were due from Home Depot the rates were the 90-day LIBOR rate less 12.5 basis points. Original maturity terms were ten years and maturity dates ranged from 2010 to 2016. These agreements included auto-renewal clauses that extended the maturity dates annually subsequent to the initial maturity date absent notice by Home Depot. In conjunction with the Transactions, the loan and deposit agreements, along with any outstanding balances, were contributed by THD to HD Supply.
On-going relationship
We derive revenue from the sale of products to Home Depot. Prior to and subsequent to the Transactions, revenue from these sales is recorded at an amount that approximates market but may not necessarily represent a
36
Table of Contents
Index to Financial Statements
HD SUPPLY, INC.
MANAGEMENT’S DISCUSSION AND ANALYSIS OF FINANCIAL CONDITION AND RESULTS OF OPERATIONS
(Continued)
price an unrelated third party would pay. In addition to sales, we purchase products from Home Depot. Prior to the Transactions, all purchases were at cost and were recorded in our cost of sales when the inventory was sold. Subsequent to the Transactions, all purchases are at amounts that management believes an unrelated third party would pay.
Strategic agreement
On the date of the Transactions, THD entered into a strategic purchase agreement with Crown Bolt. This agreement provides a guaranteed revenue stream to Crown Bolt through January 31, 2015 by specifying minimum annual purchase requirements from THD.
Seasonality
In a typical year, our operating results are impacted by seasonality. Historically, sales of our products have been higher in the second and third quarters of each fiscal year due to favorable weather and longer daylight conditions during these periods. Seasonal variations in operating results may also be significantly impacted by inclement weather conditions, such as cold or wet weather, which can delay construction projects.
Basis of Presentation
The accompanying consolidated and combined financial statements are presented for two periods: Predecessor and Successor, which relate to the period preceding the Transactions and the period succeeding the Transactions, respectively. The Predecessor financial statements represent the combined operations of HD Supply, Inc. and CND Holdings, Inc. (which has been dissolved as of February 2, 2009). The Successor financial statements represent the consolidated operations of HD Supply, Inc. and its subsidiaries. The Company refers to the operations of HD Supply for both the Predecessor and Successor periods. Prior to the Transactions, HD Supply was a wholly-owned subsidiary of Home Depot.
The Transactions were accounted for as a purchase in accordance with U.S. GAAP, which resulted in a new basis of accounting. Pursuant to that guidance, the 12.5% continuing ownership of Home Depot is reflected at fair value, together with the remainder of the purchase price for the Transactions related to new ownership, and such fair value is allocated to the tangible and intangible assets and liabilities based on estimates of fair value in accordance with U.S. GAAP. The Predecessor and Successor financial statements are not comparable as a result of applying a new basis of accounting.
The preparation of the Predecessor financial statements includes the use of “push down” accounting procedures wherein certain assets, liabilities and expenses historically recorded or incurred at the THD level, which related to or were incurred on behalf of HD Supply and have been identified and allocated or pushed down as appropriate to reflect the stand-alone financial results of HD Supply for the periods presented. Allocations were made primarily based on specific identification. Management believes the methodology applied in the allocation of these costs is reasonable. Interest expense included in these financial statements reflects the terms of the intercompany debt agreements between THD and HD Supply. These terms may not be indicative of terms reached on a third-party basis. These Predecessor financial statements may not necessarily be indicative of the cost structure or results of operations that would have existed if HD Supply operated as a stand-alone, independent business.
Fiscal Year
HD Supply’s fiscal year is a 52- or 53-week period ending on the Sunday nearest to January 31. Fiscal years ended January 31, 2010 (“fiscal 2009”) and February 1, 2009 (“fiscal 2008”) both include 52 weeks. The Successor period from August 30, 2007 to February 3, 2008 (“Successor 2007”) includes 22 weeks and 4 days. The Predecessor period from January 29, 2007 to August 29, 2007 (“Predecessor 2007”) includes 30 weeks and 3 days. Presented herein are unaudited pro forma results of operations for the period from January 29, 2007 to February 3, 2008 (“pro forma 2007”), assuming the Transactions had been completed as of January 29, 2007. Pro forma 2007 includes 53 weeks. The fiscal year ending January 30, 2011 (“fiscal 2010”) includes 52 weeks.
37
Table of Contents
Index to Financial Statements
HD SUPPLY, INC.
MANAGEMENT’S DISCUSSION AND ANALYSIS OF FINANCIAL CONDITION AND RESULTS OF OPERATIONS
(Continued)
Consolidated results of operations
Consolidated results of operations – fiscal 2009 and fiscal 2008
| Dollars in millions, Successor periods | Percentage increase (decrease) |
% of Net sales | Basis point increase (decrease) | |||||||||
| Fiscal 2009 |
Fiscal 2008 |
Fiscal 2009 |
Fiscal 2008 |
|||||||||
| Net sales |
$ 7,418 | $ 9,768 | (24.1)% | 100.0% | 100.0% | – | ||||||
| Gross profit |
1,996 | 2,634 | (24.2)% | 26.9 | 27.0 | (10) | ||||||
| Operating expenses: |
||||||||||||
| Selling, general & administrative |
1,680 | 2,063 | (18.6)% | 22.6 | 21.1 | 150 | ||||||
| Depreciation & amortization |
386 | 403 | (4.2)% | 5.2 | 4.1 | 110 | ||||||
| Restructuring |
28 | 34 | (17.6)% | 0.4 | 0.4 | – | ||||||
| Goodwill impairment(a) |
224 | 1,053 | (78.7)% | 3.0 | 10.8 | (780) | ||||||
| Total operating expenses |
2,318 | 3,553 | (34.8)% | 31.2 | 36.4 | (520) | ||||||
| Operating income (loss) |
(322) | (919) | (65.0)% | (4.3) | (9.4) | (510) | ||||||
| Interest expense |
602 | 644 | (6.5)% | 8.1 | 6.6 | 150 | ||||||
| Interest (income) |
– | (2) | * | – | – | – | ||||||
| Other (income) expense, net |
(208) | 11 | * | (2.8) | 0.1 | (290) | ||||||
| Income (loss) from continuing operations before provision (benefit) for income taxes |
(716) | (1,572) | (54.5)% | (9.6) | (16.1) | (650) | ||||||
| Provision (benefit) for income taxes |
(211) | (318) | (33.6)% | (2.8) | (3.3) | (50) | ||||||
| Income (loss) from continuing operations |
$ (505) | $ (1,254) | (59.7)% | (6.8) | (12.8) | (600) | ||||||
* not meaningful
(a) – See “Item 8. Financial Statements and Supplementary Data – Notes to Consolidated and Combined Financial Statements – Note 6, Goodwill and Intangible Assets.”
Highlights
Financial performance in fiscal 2009 declined compared to fiscal 2008, primarily as a result of continued decline in the residential, commercial, and municipal construction markets, decline in the oil and gas markets, and unfavorable fluctuations in prices of commodities, such as steel, PVC, copper, and nickel. After a decline of 12.4% in 2009, driven largely by a 27.1% decline in new residential spending, total U.S. construction spending is expected to grow at a 6.2% compound annual growth rate from 2009 through 2013. This forecasted growth is attributed to a recovery in residential construction, beginning with a 5.4% increase in 2010 spending, and, after a projected 10.5% decline in 2010, robust growth in 2011 and beyond for non-residential construction.
Fiscal 2009 was negatively impacted by a non-cash goodwill impairment charge of $224 million. In addition, the Company recorded charges of $28 million for branch closure and consolidation charges and $10 million for liquidation of excess inventory, primarily at our Specialty Construction and Infrastructure & Energy market sectors as part of our previously announced restructuring plan initiated in the third quarter of fiscal 2009. Fiscal 2009 was also negatively impacted by inventory valuation charges of $20 million, recorded in the fourth quarter as a result of continued weakness in the construction and oil and gas markets. The inventory liquidation and valuation charges are included in Cost of sales in the Company’s consolidated statement of operations. We expect to incur an additional $16 million in charges during fiscal 2010 for the fiscal 2009 restructuring plan. This plan should be complete by the end of the first half of fiscal 2010. As a result of changes in market conditions and the need to remain competitive for talent in our labor force, the Company adjusted the targets for its long-term incentive compensation plans, resulting in a charge of $7 million during the fourth quarter of fiscal 2009. We continued to benefit from our ongoing corporate cost reduction efforts and branch closure and consolidation activities. Despite the general economic weakness impacting our business, we have been able to maintain strong liquidity, with almost $900 million in liquidity as of January 31, 2010.
Net sales
Net sales decreased $2,350 million, or 24.1%, during fiscal 2009 as compared to fiscal 2008.
38
Table of Contents
Index to Financial Statements
HD SUPPLY, INC.
MANAGEMENT’S DISCUSSION AND ANALYSIS OF FINANCIAL CONDITION AND RESULTS OF OPERATIONS
(Continued)
The decrease in Net sales in fiscal 2009 was driven by our Infrastructure & Energy and Specialty Construction market sectors, in addition to a slight decrease at our Maintenance, Repair & Improvement market sector. Volume declines as a result of the weakening residential, commercial, and municipal construction markets and unfavorable commodity prices were the primary causes of the decreases in Net sales. Partially offsetting these declines were positive impacts from efforts to gain new market share.
Gross profit
Gross profit decreased $638 million, or 24.2%, during fiscal 2009 as compared to fiscal 2008.
The decrease was primarily at our Infrastructure & Energy and Specialty Construction market sectors with declines of $336 million and $277 million, respectively. In addition to volume declines, gross profit was negatively impacted by charges of $10 million for liquidation of excess inventory and $20 million of inventory valuation charges, recorded as a result of continued weakness in the construction and oil and gas markets. Our Maintenance, Repair & Improvement market sector’s gross profit was down slightly year over year, with a decline of $7 million, or 0.8%.
Gross profit as a percentage of Net sales (“gross margin”) decreased 10 basis points to 26.9% in fiscal 2009 from 27.0% in fiscal 2008, due to unfavorable commodity prices, competitive pricing, product inflation and the inventory liquidation and valuation charges, substantially offset by a shift in our business mix toward our higher margin Maintenance, Repair & Improvement market sector.
Operating expenses
Operating expenses decreased $1,235 million, or 34.8%, during fiscal 2009 as compared to fiscal 2008. Operating expenses were negatively impacted by goodwill impairment charges of $224 million and $1,053 million in fiscal 2009 and fiscal 2008, respectively. Excluding the goodwill impairment charges in both periods, operating expense decreased $406 million, or 16.2%, during fiscal 2009 as compared to fiscal 2008. Branch closures, personnel reductions and other cost initiatives resulted in a decrease in selling, general, and administrative expenses. In addition, depreciation and amortization expense decreased slightly in fiscal 2009 as compared to fiscal 2008 as certain intangible assets became fully amortized during fiscal 2009.
Operating expenses as a percentage of Net sales decreased to 31.2% in fiscal 2009 from 36.4% in fiscal 2008, primarily due to the goodwill impairment in fiscal 2008. Excluding the goodwill impairments in both periods, operating expenses as a percentage of Net sales increased 260 basis points during fiscal 2009 as compared to fiscal 2008. Our success in reducing operating expenses is partially offset by our continued investment in maintaining our infrastructure to support the key markets in which we serve in anticipation of a market recovery. The declines in unit sales and commodity prices at our Infrastructure & Energy and Maintenance, Repair & Improvement market sectors adversely affected absorption of overhead costs and contributed to the increase in operating expenses as a percentage of Net sales. This increase was partially offset by a slight decline in operating expenses, excluding goodwill impairment charges, as a percentage of Net sales at our Specialty Construction market sector.
Operating income (loss)
Operating loss of $322 million decreased $597 million during fiscal 2009 as compared to fiscal 2008, primarily due to the goodwill impairment charge in fiscal 2008. Excluding the goodwill impairment charges in both periods, operating loss increased $232 million during fiscal 2009 as compared to fiscal 2008. Operating loss excluding goodwill impairment charges increased primarily as a result of the volume declines due to the weakening of the residential, commercial, and municipal construction markets. Operating loss as a percentage of Net sales improved 510 basis points in fiscal 2009 as compared to fiscal 2008, primarily due to the larger goodwill impairment charge in fiscal 2008. Excluding the impact of the goodwill impairment charges in both periods, operating loss as a percentage of Net sales increased 270 basis points in fiscal 2009 as compared to fiscal 2008. The increase was driven by our Infrastructure & Energy and Specialty Construction market sectors, partially offset by a decrease at our Maintenance, Repair, & Improvement market sector.
39
Table of Contents
Index to Financial Statements
HD SUPPLY, INC.
MANAGEMENT’S DISCUSSION AND ANALYSIS OF FINANCIAL CONDITION AND RESULTS OF OPERATIONS
(Continued)
Interest expense
Interest expense associated with interest-bearing debt was lower in fiscal 2009 as compared to fiscal 2008. The decline in interest expense was primarily due to lower interest rates, and to a lesser extent, lower average debt balances. The lower average debt balances in fiscal 2009 as compared to fiscal 2008 were primarily due to the first quarter 2009 repurchase of $252 million in principal of the 13.5% Senior Subordinated Notes and repayments of the Senior ABL Credit Facility, partially offset by incremental borrowings associated with our third quarter fiscal 2008 draw on the Revolving Credit Facility in response to the volatility in the capital markets and, to a lesser extent, the interest capitalization on the 13.5% Senior Subordinated Notes.
Other (income) expense, net
During first quarter 2009, we repurchased $252 million principal amount, plus accrued interest of $15 million, of the 13.5% Senior Subordinated Notes due 2015 for $62 million. As a result, we recognized a $200 million pre-tax gain for the extinguishment of this portion of the 13.5% Senior Subordinated Notes, net of the write-off of unamortized deferred debt issuance costs. In addition, we recognized an $11 million gain in fiscal 2009 related to the valuation of our interest rate swaps.
Provision (benefit) for income taxes
The benefit for income taxes from continuing operations decreased to $211 million in fiscal 2009 from $318 million in fiscal 2008. The effective rate for continuing operations for fiscal 2009 and fiscal 2008 was a benefit of 29.5% and 20.2%, respectively. The higher effective rate for fiscal 2009 was primarily related to the larger goodwill impairment in fiscal 2008, a portion of which is non-deductible.
We regularly assess the realization of our net deferred tax assets and the need for any valuation allowance. This assessment requires management to make judgments about the benefits that could be realized from future taxable income, as well as other positive and negative factors influencing the realization of deferred tax assets. It is reasonably possible that a material adjustment of the valuation allowance could occur within one year.
Consolidated, combined, and pro forma results of operations – fiscal 2008 and fiscal 2007
The unaudited pro forma condensed consolidated results of operations for fiscal 2007 are presented giving effect to the Transactions as if they had occurred on January 29, 2007. The unaudited pro forma condensed consolidated results of operations for fiscal 2007 are based on our historical audited consolidated and combined financial statements included elsewhere in this annual report on Form 10-K, adjusted to give pro forma effect to the Transactions, which are deemed to occur concurrently and which are summarized below:
| — | Changes in depreciation and amortization expenses resulting from the fair value adjustments to net tangible and amortizable intangible assets; |
| — | Increase in interest expense resulting from additional indebtedness incurred in connection with the Transactions, and amortization of debt issuance costs and intangible assets related to the THD Guarantee; and |
| — | The effect on provision for income taxes of the pro forma adjustments. |
The unaudited pro forma condensed consolidated results of operations for fiscal 2007 are presented because management believes it provides a meaningful comparison of operating results enabling twelve months of fiscal 2007 to be compared with fiscal 2008, adjusting for the impact of the Transactions. The unaudited pro forma condensed consolidated financial statements are for informational purposes only and do not purport to represent what our actual results of operations would have been if the Transactions had been completed as of January 29, 2007 or that may be achieved in the future. The unaudited pro forma condensed consolidated financial information and the accompanying notes should be read in conjunction with our historical audited consolidated and combined financial statements and related notes appearing elsewhere in this annual report on Form 10-K and other financial information contained in “Risk Factors” in this annual report on Form 10-K.
40
Table of Contents
Index to Financial Statements
HD SUPPLY, INC.
MANAGEMENT’S DISCUSSION AND ANALYSIS OF FINANCIAL CONDITION AND RESULTS OF OPERATIONS
(Continued)
| Dollars in millions | Successor | Successor | Predecessor | Percentage Increase (Decrease) | |||||||||||||||||||
| Fiscal 2008 | Successor 2007 |
Predecessor 2007 |
Pro Forma Adjustments |
Pro Forma 2007 |
Fiscal 2008 vs. Successor 2007 |
Successor 2007 vs. Predecessor 2007 |
Fiscal 2008 vs. Pro Forma 2007 | ||||||||||||||||
| Net sales |
$ | 9,768 | $ | 4,599 | $ | 7,121 | $ – | $ | 11,720 | 112.4 | (35.4) | (16.7) | |||||||||||
| Gross profit |
2,634 | 1,227 | 1,901 | – | 3,128 | 114.7 | (35.5) | (15.8) | |||||||||||||||
| Operating expenses: |
|||||||||||||||||||||||
| Selling, general & administrative |
2,063 | 1,001 | 1,424 | – | 2,425 | 106.1 | (29.7) | (14.9) | |||||||||||||||
| Depreciation & amortization |
403 | 168 | 115 | 109 | a | 392 | 139.9 | 46.1 | 2.8 | ||||||||||||||
| Restructuring |
34 | – | – | – | – | * | – | * | |||||||||||||||
| Goodwill impairment |
1,053 | – | – | – | – | * | – | * | |||||||||||||||
| Total operating expenses |
3,553 | 1,169 | 1,539 | 109 | 2,817 | * | (24.0) | 26.1 | |||||||||||||||
| Operating income (loss) |
(919) | 58 | 362 | (109) | 311 | * | (84.0) | * | |||||||||||||||
| Interest expense |
644 | 289 | 221 | 178 | b | 688 | 122.8 | 30.8 | (6.4) | ||||||||||||||
| Interest (income) |
(2) | – | – | – | – | * | * | * | |||||||||||||||
| Other (income) expense, net |
11 | – | – | – | – | * | * | * | |||||||||||||||
| Income (loss) from continuing operations before provision (benefit) for income taxes |
(1,572) | (231) | 141 | (287) | (377) | * | * | * | |||||||||||||||
| Provision (benefit) for income taxes |
(318) | (83) | 58 | (106) | c | (131) | * | * | (142.7) | ||||||||||||||
| Income (loss) from continuing operations |
$ | (1,254) | $ | (148) | $ | 83 | $ | (181) | $ | (246) | * | * | * | ||||||||||
| * | not meaningful |
| (a) | The Transactions were accounted for as a purchase in accordance with U.S. GAAP. Under these principles, the acquisition consideration was allocated to our tangible assets and liabilities based on their fair values. The excess purchase price over the fair value of the net assets acquired was recorded as goodwill. The pro forma adjustment shown below is based upon our final valuation of tangible and intangible net assets as if the Transaction occurred on January 29, 2007 (amounts in millions). |
| New depreciation expense (i) |
$ | 71 | |||
| New amortization expense (i i) |
153 | ||||
| Total pro forma depreciation and amortization expense |
224 | ||||
| Less: Historical depreciation and amortization expense |
115 | ||||
| Adjustment to depreciation and amortization expense |
$ | 109 | |||
| (i) | Fair value of fixed assets acquired, and included in continuing operations, was $647 million with a weighted average useful life of 5.3 years. |
(ii)
| (Dollars in millions) |
Fair value | Useful life (in years) |
New amortization expense (7 months) |
|||||||
| Customer relationships |
$ | 1,546 | 7 | $ | 129 | |||||
| Strategic purchase agreement |
166 | 7 | 14 | |||||||
| Trade names |
150 | 20 | 4 | |||||||
| Leasehold interests |
18 | 4 | 3 | |||||||
| Covenant not to compete |
12 | 2 | 3 | |||||||
| $ | 1,892 | $ | 153 | |||||||
41
Table of Contents
Index to Financial Statements
HD SUPPLY, INC.
MANAGEMENT’S DISCUSSION AND ANALYSIS OF FINANCIAL CONDITION AND RESULTS OF OPERATIONS
(Continued)
| (b) | Reflects the pro forma adjustment to interest expense as if our capital structure from the Transactions was in place as of January 29, 2007 (amounts in millions): |
| Interest on new borrowings (i) |
$ | 367 | |||
| Amortization of deferred financing costs and THD Guarantee (ii) |
32 | ||||
| Total pro forma interest expense |
399 | ||||
| Less: Historical interest expense |
221 | ||||
| Adjustment to interest expense |
$ | 178 | |||
| (i) | Pro-forma interest expense for Predecessor 2007 assumes: (1) an estimated average outstanding balance of $1,350 million on our ABL Credit Facility using an assumed interest rate equal to the seven-month average of the 1-month LIBOR during the Predecessor 2007 period (5.32%) plus 1.5%, (2) $1,000 million on our Term Loan using an assumed interest rate equal to the seven-month average of the 1-month LIBOR during the Predecessor 2007 period (5.32%) plus 1.25%, (3) $2,500 million on our 12% Senior Notes and (4) $1,300 million on our 13.5% Senior Subordinated Notes. |
| (ii) | Represents amortization expense on approximately $210 million of deferred financing costs in connection with the Transactions using a weighted average maturity of 6.3 years and amortization of the $106 million THD Guarantee over 5 years. |
| (c) | Computed as the statutory tax rate of 39.1% and an adjustment for non-deductible paid-in-kind (“PIK”) interest expense. |
| % of Net Sales | ||||||||||||||||
| Successor | Successor | Predecessor | Basis Point Increase (Decrease) | |||||||||||||
| Fiscal 2008 | Successor 2007 |
Predecessor 2007 |
Pro Forma Adjustments |
Pro Forma 2007 |
Fiscal 2008 vs. Successor 2007 |
Successor 2007 vs. Predecessor 2007 |
Fiscal 2008 vs. Pro Forma 2007 | |||||||||
| Net sales |
100.0% | 100.0% | 100.0% | – | 100.0% | – | – | – | ||||||||
| Gross profit |
27.0 | 26.7 | 26.7 | – | 26.7 | 30 | – | 30 | ||||||||
| Operating expenses: |
||||||||||||||||
| Selling, general & administrative |
21.1 | 21.8 | 20.0 | – | 20.7 | (70) | 180 | 40 | ||||||||
| Depreciation & amortization |
4.1 | 3.6 | 1.6 | 1.5 | 3.3 | 50 | 200 | 80 | ||||||||
| Restructuring |
0.4 | – | – | – | – | 40 | – | 40 | ||||||||
| Goodwill impairment |
10.8 | – | – | – | – | 1,080 | – | 1,080 | ||||||||
| Total operating expenses |
36.4 | 25.4 | 21.6 | 1.5 | 24.0 | 1,100 | 380 | 1,240 | ||||||||
| Operating income (loss) |
(9.4) | 1.3 | 5.1 | (1.5) | 2.7 | (1,070) | (380) | (1,210) | ||||||||
| Interest expense |
6.6 | 6.3 | 3.1 | 2.5 | 5.9 | 30 | 320 | 70 | ||||||||
| Interest (income) |
0.0 | – | – | – | – | * | – | * | ||||||||
| Other (income) expense, net |
0.1 | – | – | – | – | 10 | – | 10 | ||||||||
| Income (loss) from continuing operations before provision (benefit) for income taxes |
(16.1) | (5.0) | 2.0 | (4.0) | (3.2) | (1,110) | (700) | (1,290) | ||||||||
| Provision (benefit) for income taxes |
(3.3) | (1.8) | 0.8 | (1.5) | (1.1) | (150) | (260) | (220) | ||||||||
| Income (loss) from continuing operations |
(12.8) | (3.2) | 1.2 | (2.5) | (2.1) | (960) | (440) | (1,070) | ||||||||
| * | not meaningful |
42
Table of Contents
Index to Financial Statements
HD SUPPLY, INC.
MANAGEMENT’S DISCUSSION AND ANALYSIS OF FINANCIAL CONDITION AND RESULTS OF OPERATIONS
(Continued)
Fiscal 2008 compared to Successor 2007
Highlights
Financial performance in fiscal 2008 declined compared to Successor 2007, primarily as a result of continued decline in the residential and commercial construction markets, but was positively influenced by changes in business mix, sales initiatives, reduction in force initiatives, pricing initiatives and other cost reductions. Fiscal 2008 was negatively impacted by a non-cash goodwill impairment charge of $1,053 million, a restructuring charge of $36 million and a charge related to the provision for uncollectible trade receivables of $33 million.
During fiscal 2008, we tested goodwill for recoverability at all ten reporting units assigned goodwill during the annual goodwill impairment testing in the third quarter, and we tested goodwill a second time at seven reporting units during the fourth quarter as a result of significant declines in economic conditions impacting these businesses. The testing resulted in a non-cash goodwill impairment charge for fiscal 2008 of $1,053 million related to six of the ten reporting units. The primary cause of impairment of the goodwill was a reduction in expected future cash flows for these businesses as a result of the decline in the residential and commercial construction markets and the general decline in economic conditions.
As a result of acquisition integration, the decline in the residential and commercial construction markets, and the general decline in economic conditions, management evaluated the operations and performance of individual branches and identified branches for closure or consolidation and a reduction in workforce. This analysis identified a total of 32 branches to be closed and a reduction in workforce of 1,300 employees. As a result, in fiscal 2008, we recorded a restructuring charge of $36 million, of which $2 million, related to inventory liquidation, is recorded in Cost of sales. We incurred an additional $5 million in restructuring costs during fiscal 2009 as part of this restructuring plan.
As a result of the deteriorating economic conditions and a review of the Company’s trade receivable aging and collection patterns, the Company recorded a charge of $33 million, included in selling, general and administrative expense, as a provision for uncollectible trade receivable accounts during the fourth quarter of fiscal 2008.
Net sales
Net sales increased to $9,768 million during fiscal 2008 from $4,599 million during Successor 2007, an increase of $5,169 million.
The increase in Net sales is primarily due to twelve months of operations included in fiscal 2008 compared to five months of operations included in Successor 2007. Partially offsetting the increase in fiscal 2008 Net sales was the impact of the weakening residential construction market, resulting in a significant decline in Net sales at our Infrastructure & Energy and Specialty Construction market sectors. Resulting branch closures also contributed to declines in Net sales. Partially offsetting these declines was organic sales growth at our Maintenance, Repair, & Improvement market sector.
Gross profit
Gross profit increased to $2,634 million during fiscal 2008 from $1,227 million during Successor 2007, an increase of $1,407 million.
The increase in gross profit was driven by twelve months of operations included in fiscal 2008 compared to five months of operations included in Successor 2007. Gross margin increased 30 basis points to 27.0% in fiscal 2008 as compared to Successor 2007, as a result of a shift in our business mix toward our higher margin Maintenance, Repair, & Improvement market sector as well as improvements in gross margin at this same market sector. This was substantially offset by an erosion of gross margins at our Specialty Construction market sector due to competitive pricing and fluctuations in commodity prices.
Operating expenses
Operating expenses increased $2,384 million during fiscal 2008 compared to Successor 2007, primarily due to twelve months of operations included in fiscal 2008 compared to five months of operations included in Successor 2007 as well as the goodwill impairment charge of $1,053 million recorded in fiscal 2008. Operating expenses as a
43
Table of Contents
Index to Financial Statements
HD SUPPLY, INC.
MANAGEMENT’S DISCUSSION AND ANALYSIS OF FINANCIAL CONDITION AND RESULTS OF OPERATIONS
(Continued)
percentage of Net sales increased 1,100 basis points in fiscal 2008 compared to Successor 2007, of which 1,080 basis points were attributable to the goodwill impairment charge. Excluding the goodwill impairment charge, operating expense as a percentage of Net sales increased 20 basis points. An additional 70 basis point increase was due to the restructuring charge of $34 million and a provision for uncollectible trade receivables charge of $33 million in fiscal 2008. Branch closures, personnel reductions and other cost initiatives resulted in a decrease in selling, general and administrative expenses as a percentage of Net sales.
Operating income (loss)
Operating income declined $977 million during fiscal 2008 compared to Successor 2007, primarily as a result of the goodwill impairment charge recorded in fiscal 2008. Excluding the goodwill impairment charge, operating income increased $76 million, primarily due to twelve months of operations included in fiscal 2008 compared to five months of operations included in Successor 2007, substantially offset by the impact of the continued weakening of the residential and commercial construction market and deteriorating general economic conditions. Operating income as a percentage of Net sales decreased 1,070 basis points in fiscal 2008, of which 1,080 basis points are attributable to the goodwill impairment charge recorded in fiscal 2008. Excluding the goodwill impairment charge, operating income as a percentage of Net sales in fiscal 2008 was comparable to Successor 2007, increasing 10 basis points. Branch closures, personnel reductions and other cost initiatives resulted in an increase in operating income as a percentage of Net sales in fiscal 2008. This increase was substantially offset by the impacts of the $36 million restructuring charge (including $2 million in Cost of sales) and $33 million provision for uncollectible trade receivables charge in fiscal 2008.
Interest expense
Interest expense increased $355 million in fiscal 2008 as compared to Successor 2007, primarily due to twelve months of interest included in fiscal 2008 compared to five months of interest included in Successor 2007. The effective rate for interest expense on indebtedness decreased during fiscal 2008 as compared to an annualized rate for Successor 2007 due to a decline in market interest rates, partially offset by a slight increase in the average balance outstanding during fiscal 2008.
Provision (benefit) for income taxes
The benefit for income taxes increased to $318 million in fiscal 2008 from $83 million in Successor 2007. As a percentage of pre-tax income, the benefit declined to 20.2% from 35.9%, primarily as a result of non-deductibility of a portion of the goodwill impairment recorded in fiscal 2008.
Successor 2007 compared to Predecessor 2007
Highlights
Financial performance in Successor 2007 declined slightly compared to Predecessor 2007, primarily as a result of continued decline in the residential construction market and, to a lesser extent, the impact of seasonality. Additionally, Successor 2007 reflects increased depreciation and amortization costs associated with the application of purchase accounting for the Transactions and the additional interest cost from the debt issued to finance the Transactions.
Net sales
Net sales decreased to $4,599 million during Successor 2007 from $7,121 million during Predecessor 2007, a decrease of $2,522 million.
The decrease in Net sales is primarily due to the inclusion of five months of operations in Successor 2007 as compared to seven months of operations included in Predecessor 2007. In addition, the Predecessor 2007 period includes the majority of the spring and summer months which typically experience higher construction spending due to better weather and longer daylight hours. The impact of the weakening residential construction market throughout fiscal 2007 resulted in declines in Net sales at our Infrastructure & Energy and Specialty Construction market sectors.
44
Table of Contents
Index to Financial Statements
HD SUPPLY, INC.
MANAGEMENT’S DISCUSSION AND ANALYSIS OF FINANCIAL CONDITION AND RESULTS OF OPERATIONS
(Continued)
Gross profit
Gross profit decreased to $1,227 million during Successor 2007 from $1,901 million during Predecessor 2007, a decrease of $674 million, or 35.5%.
The decline in gross profit was primarily due to the inclusion of five months of operations in Successor 2007 as compared to seven months of operations included in Predecessor 2007. Gross margin remained flat at 26.7% in Successor 2007 and Predecessor 2007. A slight increase in gross margins at our Specialty Construction sector was offset by slight declines at our other market sectors.
Operating expenses
Operating expenses decreased $370 million during Successor 2007 compared to Predecessor 2007, primarily due to the inclusion of five months of operations in Successor 2007 as compared to seven months of operations included in Predecessor 2007. Operating expenses as a percentage of Net sales increased 380 basis points in Successor 2007 as compared to Predecessor 2007, primarily due to the decline in unit sales adversely affecting the absorption of overhead costs and the increased depreciation and amortization expense as a result of the Transactions.
Operating income (loss)
Operating income declined $304 million during Successor 2007 compared to Predecessor 2007, primarily due to the inclusion of five months of operations in Successor 2007 as compared to seven months of operations included in Predecessor 2007. Operating income as a percentage of Net sales declined 380 basis points in Successor 2007 as compared to Predecessor 2007 due entirely to the increase in operating expenses as a percentage of Net sales.
Interest expense
Interest expense of $289 million for Successor 2007 reflects the indebtedness entered into to finance the Transactions. Interest expense of $221 million for Predecessor 2007 reflects the loan agreements between HD Supply and our former parent, Home Depot.
Provision (benefit) for income taxes
The Successor 2007 benefit for income taxes was $83 million compared with a provision of $58 million in Predecessor 2007. As a percentage of pre-tax income, the benefit of 35.9% in Successor 2007 compares with a provision of 41.1% in Predecessor 2007. The decline in the effective tax rate is reflective of an increase in non-deductible expenses related to interest expense.
Fiscal 2008 compared to pro forma 2007
Highlights
Financial performance in fiscal 2008 declined compared to pro forma 2007, primarily as a result of continued decline in the residential and commercial construction markets, but was positively influenced by changes in business mix, sales initiatives, reduction in force initiatives, pricing initiatives and other cost reductions. Fiscal 2008 was negatively impacted by a non-cash goodwill impairment charge of $1,053 million, a restructuring charge of $36 million, and a charge related to the provision for uncollectible trade receivables of $33 million.
During fiscal 2008, we tested goodwill for recoverability at all ten reporting units assigned goodwill during the annual goodwill impairment testing in the third quarter, and we tested goodwill a second time at seven reporting units during the fourth quarter as a result of significant declines in economic conditions impacting these businesses. The testing resulted in a non-cash goodwill impairment charge for fiscal 2008 of $1,053 million related to six of the ten reporting units. The primary cause of impairment of the goodwill was a reduction in expected future cash flows for these businesses as a result of the decline in the residential and commercial construction markets and the general decline in economic conditions.
As a result of acquisition integration, the decline in the residential and commercial construction markets, and the general decline in economic conditions, management evaluated the operations and performance of individual
45
Table of Contents
Index to Financial Statements
HD SUPPLY, INC.
MANAGEMENT’S DISCUSSION AND ANALYSIS OF FINANCIAL CONDITION AND RESULTS OF OPERATIONS
(Continued)
branches and identified branches for closure or consolidation and a reduction in workforce. This analysis identified a total of 32 branches to be closed and a reduction in workforce of 1,300 employees. As a result, in fiscal 2008, we recorded a restructuring charge of $36 million, of which $2 million, related to inventory liquidation, is recorded in Cost of sales. We expect to incur an additional $9 million in restructuring costs during fiscal 2009 as part of this restructuring plan.
As a result of the deteriorating economic conditions and a review of the Company’s trade receivable aging and collection patterns, the Company recorded a charge of $33 million, included in selling, general and administrative expense, as a provision for uncollectible trade receivable accounts during the fourth quarter of fiscal 2008.
Net sales
Net sales decreased to $9,768 million during fiscal 2008 from $11,720 million during pro forma 2007, a decrease of $1,952 million, or 16.7%.
The impact of the weakening residential construction market resulted in a significant decline in Net sales at our Infrastructure & Energy and Specialty Construction market sectors. Resulting branch closures also contributed to the decline in Net sales. In addition, Net sales in fiscal 2008 reflect fiscal 2008’s 52-week period versus pro forma 2007’s 53-week period. Partially offsetting these declines was organic sales growth at our Maintenance, Repair, & Improvement market sector.
Gross profit
Gross profit decreased to $2,634 million during fiscal 2008 from $3,128 million during pro forma 2007, a decrease of $494 million, or 15.8%.
The decline in gross profit was driven by declines at our Specialty Construction and Infrastructure & Energy market sectors of $310 million and $201 million, respectively. These declines were partially offset by an increase of $25 million at our Maintenance, Repair & Improvement market sector. Gross profit as a percentage of Net sales increased 30 basis points to 27.0% in fiscal 2008 from 26.7% in pro forma 2007, as a result of a shift in our business mix toward our higher margin Maintenance, Repair, & Improvement market sector. This was substantially offset by an erosion of margins at our Specialty Construction market sector due to competitive pricing and, to a lesser extent, our Infrastructure & Energy market sector due to fluctuations in commodity prices.
Operating expenses
Operating expenses increased $736 million during fiscal 2008 compared to pro forma 2007, primarily due to the goodwill impairment charge of $1,053 million recorded in fiscal 2008. Excluding the goodwill impairment charge, operating expenses decreased $317 million during fiscal 2008 compared to pro forma 2007. Branch closures, personnel reductions and other cost initiatives resulted in a decrease in selling, general, and administrative expenses. These decreases in expenses were partially offset in fiscal 2008 by a restructuring charge of $34 million and a provision for uncollectible trade receivables charge of $33 million. Operating expenses as a percentage of Net sales increased 1,240 basis points in fiscal 2008 compared to pro forma 2007, of which 1,080 basis points were attributable to the goodwill impairment charge. Excluding the goodwill impairment charge, operating expense as a percentage of Net sales increased 160 basis points. Declines in unit sales adversely affected absorption of overhead costs and contributed to the increase in operating expenses as a percentage of Net sales.
Operating income (loss)
Operating income declined $1,230 million during fiscal 2008 compared to pro forma 2007, primarily as a result of the goodwill impairment charge. Excluding the goodwill impairment charge, operating income declined $177 million, primarily as a result of the continued weakening of the residential and commercial construction market and deteriorating general economic conditions. Operating income as a percentage of Net sales decreased 1,210 basis points in fiscal 2008, of which 1,080 basis points are attributable to the goodwill impairment charge recorded in fiscal 2008. Excluding the goodwill impairment charge, operating income as a percentage of Net sales decreased 130 basis points in fiscal 2008 as compared to pro forma 2007 primarily due to the $36 million restructuring charge (including $2 million in Cost of sales), $33 million provision for uncollectible trade
46
Table of Contents
Index to Financial Statements
HD SUPPLY, INC.
MANAGEMENT’S DISCUSSION AND ANALYSIS OF FINANCIAL CONDITION AND RESULTS OF OPERATIONS
(Continued)
receivables charge, and an increase of $11 million in depreciation and amortization for recent additions to fixed assets.
Interest expense
Interest expense decreased $44 million in fiscal 2008 as compared to pro forma 2007, primarily due to a decline in market interest rates and, to a lesser extent, lower average balances outstanding during fiscal 2008.
Provision (benefit) for income taxes
The benefit for income taxes increased to $318 million in fiscal 2008 from $131 million in pro forma 2007. As a percentage of pre-tax income, the benefit declined to 20.2% in fiscal 2008 from 34.5% in pro forma 2007, primarily as a result of non-deductibility of a portion of the goodwill impairment recorded in fiscal 2008.
Results of operations by market sector
Infrastructure & Energy
Fiscal 2009 and fiscal 2008
| Dollars in millions, Successor periods | Fiscal 2009 | Fiscal 2008 | Increase (Decrease) |
|||||||
| Net sales |
$ | 3,694.6 | $ | 5,011.4 | (26.3)% | |||||
| Operating income (loss) |
(160.6) | (564.5) | (71.6)% | |||||||
| % of Net sales |
(4.3)% | (11.3)% | (700) bps | |||||||
Net sales
Net sales decreased $1,317 million, or 26.3%, during fiscal 2009 as compared to fiscal 2008.
The decline in Net sales in fiscal 2009 compared to fiscal 2008 was driven by Waterworks, which had a decline in Net sales of $707 million. Utilities, Electrical, and IPVF also had declines in Net sales in fiscal 2009 of $218 million, $214 million, and $174 million, respectively, as compared to fiscal 2008. Volume declines as a result of the continued economic weakness in the residential housing, municipal, and commercial construction markets were the primary drivers for the declines in Net sales at Waterworks, Utilities and Electrical, having an estimated impact of over $1 billion. Net sales declines at IPVF, and to a lesser extent Electrical, were driven by the fluctuation of commodity prices, primarily nickel at IPVF and copper and steel at Electrical.
Operating income (loss)
Operating loss decreased $404 million to a loss of $161 million during fiscal 2009 as compared to fiscal 2008. The primary driver of the decline was a goodwill impairment charge of $801 million during fiscal 2008, offset partially by a goodwill impairment charge of $194 million in fiscal 2009. Operating income excluding the goodwill impairment charges in both periods was $34 million and $237 million for fiscal 2009 and fiscal 2008, respectively, a decrease of $203 million, or 85.9%, during fiscal 2009 as compared to fiscal 2008.
The operating income decrease in fiscal 2009, excluding the goodwill impairment charges in both periods, compared to fiscal 2008 was driven by decreases of $87 million and $90 million at Waterworks and IPVF, respectively. Utilities and Electrical also experienced declines in operating income, excluding the goodwill impairment charges in both periods, of $12 million and $14 million, respectively. The decline in operating income for fiscal 2009, excluding the goodwill impairment charges in both periods, at Waterworks, Utilities, and Electrical was primarily driven by volume declines related to the weakening of the residential, municipal, and commercial construction markets. In addition, during the fourth quarter of fiscal 2009, inventory valuation charges of $20 million were recognized at Utilities and IPVF as a result of the continued weakening of the construction and oil and gas markets. Partially offsetting these negative impacts was a decline in selling, general, and administrative costs, primarily due to personnel reductions and branch closures, and other cost reduction efforts. The decline in operating income at IPVF, excluding the goodwill impairment charges in both periods, was driven by margin compression as a result of commodity price declines, the inventory valuation charge referred to above, and was also partially impacted by volume declines.
47
Table of Contents
Index to Financial Statements
HD SUPPLY, INC.
MANAGEMENT’S DISCUSSION AND ANALYSIS OF FINANCIAL CONDITION AND RESULTS OF OPERATIONS
(Continued)
Operating loss as a percentage of Net sales in fiscal 2009 improved as compared to fiscal 2008 primarily due to the goodwill impairment charge in fiscal 2008, partially offset by the goodwill impairment charge in fiscal 2009. Excluding the goodwill impairment charges in both periods, operating income as a percentage of Net sales declined 380 basis points in fiscal 2009 as compared to fiscal 2008. This decline was driven by gross margin declines at IPVF and the reduction in sales outpacing the reduction in fixed costs, primarily at Waterworks and Electrical.
Fiscal 2008 and fiscal 2007
| Dollars in millions | Successor | Successor | Predecessor | Increase (Decrease) | |||||||||||||||||||
| Fiscal 2008 | Successor 2007 |
Predecessor 2007 |
Pro Forma Adjustments |
Pro Forma 2007 |
Fiscal 2008 vs. Successor |
Successor 2007 vs. Predecessor 2007 |
Fiscal 2008 vs. Pro Forma 2007 | ||||||||||||||||
| Net sales |
$ | 5,011.4 | $ | 2,314.3 | $ | 3,606.1 | $ | – | $ | 5,920.4 | 116.5% | (35.8)% | (15.4)% | ||||||||||
| Operating income (loss) |
(564.5) | 141.0 | 292.9 | (44.0) | a | 389.9 | * | (51.9)% | * | ||||||||||||||
| % of Net sales |
(11.3)% | 6.1% | 8.1% | (1.2)% | 6.6% | (1,740) bps | (200) bps | (1,790) bps | |||||||||||||||
| * | not meaningful |
| (a) | The Transactions were accounted for as a purchase in accordance with U.S. GAAP. Under these principles, the acquisition consideration was allocated to our tangible assets and liabilities based on their fair values. The excess purchase price over the fair value of the net assets acquired was recorded as goodwill. The pro forma adjustment shown below is based upon our final valuation of tangible and intangible net assets as if the Transaction occurred on January 29, 2007 (amounts in millions). |
| New depreciation expense (i) |
$ | 15.5 | |||
| New amortization expense (i i) |
72.7 | ||||
| Total pro forma depreciation and amortization expense |
88.2 | ||||
| Less: Historical depreciation and amortization expense |
44.2 | ||||
| Adjustment to depreciation and amortization expense |
$ | 44.0 | |||
| (i) | Fair value of fixed assets acquired, and included in continuing operations, was $82 million with a weighted average useful life of 3.1 years. |
(ii)
| (Dollars in millions) |
Fair value | Useful life (in years) |
New amortization expense (7 months) |
||||||
| Customer relationships |
$ | 861 | 7 | $ 71 | |||||
| Leasehold interests |
(2) | 4 | – | ||||||
| Covenant not to compete |
7 | 2 | 2 | ||||||
| $ | 866 | $ 73 | |||||||
Fiscal 2008 compared to Successor 2007
Net sales
Net sales increased to $5,011.4 million during fiscal 2008 from $2,314.3 million during Successor 2007, an increase of $2,697 million. The increase in Net sales is primarily due to twelve months of operations included in fiscal 2008 compared to five months of operations included in Successor 2007.
Partially offsetting the increase in fiscal 2008 were volume declines as a result of the economic downturn, primarily in the residential housing market. Electrical was further impacted by branch closures that occurred in late Successor 2007 and the fluctuation of commodity prices, primarily copper and steel; though this impact was substantially offset by strong commercial business in Texas. IPVF also experienced a negative impact on Net sales related to commodity prices as a decrease in nickel prices resulted in lower average selling prices of key products. However, volume increases at IPVF within the key end markets of downstream oil and gas, as well as petrochemical and chemical markets, outweighed the impact of falling nickel prices during fiscal 2008.
48
Table of Contents
Index to Financial Statements
HD SUPPLY, INC.
MANAGEMENT’S DISCUSSION AND ANALYSIS OF FINANCIAL CONDITION AND RESULTS OF OPERATIONS
(Continued)
Operating income (loss)
Operating income decreased $705 million during fiscal 2008 compared to Successor 2007, primarily as a result of a goodwill impairment charge in fiscal 2008 of $801 million, partially offset by the inclusion of twelve months of operations in fiscal 2008 compared to five months of operations included in Successor 2007. Excluding the goodwill impairment charge, operating income increased $96 million in fiscal 2008. Operating income as a percentage of Net sales decreased 1,740 basis points in fiscal 2008 as compared to Successor 2007, of which 1,600 basis points were attributable to the goodwill impairment charge.
The operating income decrease in fiscal 2008 compared to Successor 2007 was driven by decreases of $663.6 million, $27.3 million, $7.6 million, and $7.1 million, at Waterworks, Utilities, IPVF, and Electrical, respectively. Excluding the goodwill impairment charge, operating income increased by $17.2 million, $17.1 million, and $68.7 million at Waterworks, Utilities, and IPVF, respectively, partially offset by a decrease of $7.1 million at Electrical.
During fiscal 2008, Waterworks, Utilities, and Electrical were impacted by volume declines related to the weakening of the residential and commercial construction markets. In addition, operating income for the market sector was negatively impacted by a restructuring charge of $8 million recorded in late fiscal 2008 for branch closures and consolidations and personnel reductions, and a $12 million charge recorded in late fiscal 2008 for a provision for uncollectible trade receivable accounts, primarily at Waterworks and IPVF, as a result of declining general economic conditions and a review of the aging trade receivable accounts and collection patterns.
Excluding the goodwill impairment charge, operating income as a percentage of Net sales declined 140 basis points in fiscal 2008 compared to Successor 2007. Gross margins at Waterworks and IPVF declined slightly during fiscal 2008 as compared to Successor 2007, while Utilities and Electrical experienced slight improvements, resulting in no change for the market sector period over period. However, the reduction in monthly sales outpaced the reduction in fixed costs as a result of cost initiatives for Waterworks, Utilities, and Electrical, resulting in a decrease in operating income as a percentage of Net sales. The decline in operating income as a percentage of Net sales at IPVF was primarily driven by a decline in gross margins as a result of lower average selling prices due to the decline in the price of nickel and, to a lesser extent, an increase in operating costs as a percentage of Net sales.
Successor 2007 compared to Predecessor 2007
Net sales
Net sales decreased to $2,314.3 million during Successor 2007 from $3,606.1 million during Predecessor 2007, a decrease of $1,292 million.
The decrease in Net sales is primarily due to five months of operations included in Successor 2007 compared to seven months of operations included in Predecessor 2007. In addition, the Predecessor 2007 period includes the majority of the spring and summer months which typically experience higher construction activity due to better weather and longer daylight hours. Waterworks experienced significant volume declines in Successor 2007 as compared to Predecessor 2007 as a result of the economic downturn, primarily in the residential housing market.
Operating income (loss)
Operating income decreased $152 million during Successor 2007 compared to Predecessor 2007, primarily due to the inclusion of five months of operations in Successor 2007 compared to seven months of operations included in Predecessor 2007. Operating income as a percentage of Net sales decreased 200 basis points in Successor 2007 as compared to Predecessor 2007.
The operating income decrease in Successor 2007 compared to Predecessor 2007 was driven by decreases of $82.5 million, $20.1 million, $38.9 million, and $10.4 million at Waterworks, Utilities, IPVF, and Electrical, respectively. Operating income as a percentage of Net sales declined across the entire sector, driven by an increase in depreciation and amortization as a result of the Transactions and a reduction in gross margins at IPVF due to the impact of fluctuating commodity prices.
49
Table of Contents
Index to Financial Statements
HD SUPPLY, INC.
MANAGEMENT’S DISCUSSION AND ANALYSIS OF FINANCIAL CONDITION AND RESULTS OF OPERATIONS
(Continued)
Fiscal 2008 compared to pro forma 2007
Net sales
Net sales decreased to $5,011.4 million during fiscal 2008 from $5,920.4 million during pro forma 2007, a decrease of $909 million. The decline in Net sales in fiscal 2008 compared to pro forma 2007 was driven by Waterworks, Utilities, and Electrical, which had declines in Net sales of $631 million, $163 million, and $169 million, respectively. Volume declines as a result of the economic downturn, primarily in the residential housing market, were the primary drivers for the declines in Net sales for these operations, having an estimated impact of approximately $930 million. Electrical was further impacted by branch closures that occurred in late fiscal 2007 and the fluctuation of commodity prices, primarily copper and steel; though this impact was substantially offset by strong commercial business in Texas. IPVF also experienced a negative impact on Net sales related to commodity prices as a decrease in nickel prices resulted in lower average selling prices of key products. However, volume increases at IPVF within the key end markets of downstream oil and gas, as well as petrochemical and chemical markets, outweighed the impact of falling nickel prices resulting in an increase in Net sales of $54 million during fiscal 2008 as compared to pro forma 2007.
Operating income (loss)
Operating income decreased $954 million during fiscal 2008 compared to pro forma 2007, primarily as a result of a goodwill impairment charge in fiscal 2008 of $801 million. Excluding the goodwill impairment charge, operating income decreased $153 million in fiscal 2008. Operating income as a percentage of Net sales decreased 1,790 basis points in fiscal 2008 as compared to the pro forma 2007, of which 1,600 basis points were attributable to the goodwill impairment charge.
The operating income decrease in fiscal 2008 compared to pro forma 2007 was driven by decreases of $775.9 million, $64.7 million, $23.4 million, and $90.4 million at Waterworks, Utilities, Electrical, and IPVF, respectively. Excluding the goodwill impairment charge, operating income declines were $95.1 million, $20.3 million, $23.4 million, and $14.1 million at Waterworks, Utilities, Electrical, and IPVF, respectively. Excluding the goodwill impairment charge, the decline in operating income at Waterworks, Utilities, and Electrical was primarily driven by volume declines related to the weakening of the residential and commercial construction markets. In addition, operating income for the market sector was negatively impacted by a restructuring charge of $8 million recorded in late fiscal 2008 for branch closures and consolidations and personnel reductions, and a $12 million charge recorded in late fiscal 2008 for a provision for uncollectible trade receivable accounts, primarily at Waterworks and IPVF, as a result of declining general economic conditions and a review of the aging trade receivable accounts and collection patterns. Partially offsetting these negative impacts, was a decline in selling, general, and administrative costs at Waterworks and Electrical, primarily due to personnel reductions and branch closures, and other cost reduction efforts.
Excluding the goodwill impairment charge, operating income as a percentage of Net sales declined 190 basis points in fiscal 2008 compared to pro forma 2007. Gross margins at Waterworks, Utilities, and Electrical were relatively flat year over year; however, the reduction in sales outpaced the reduction in fixed costs of these businesses, resulting in a decrease in operating income as a percentage of Net sales. The decline in operating income as a percentage of Net sales at IPVF was primarily driven by a decline in gross margins as a result of lower average selling prices due to the decline in the price of nickel.
Maintenance, Repair & Improvement
Fiscal 2009 and fiscal 2008
| Dollars in millions, Successor periods | Fiscal 2009 | Fiscal 2008 | Increase (Decrease) |
|||||||
| Net sales |
$ | 2,023.4 | $ | 2,070.2 | (2.3)% | |||||
| Operating income |
155.6 | 162.4 | (4.2)% | |||||||
| % of Net sales |
7.7% | 7.8% | (10) bps | |||||||
50
Table of Contents
Index to Financial Statements
HD SUPPLY, INC.
MANAGEMENT’S DISCUSSION AND ANALYSIS OF FINANCIAL CONDITION AND RESULTS OF OPERATIONS
(Continued)
Net sales
Net sales decreased $47 million, or 2.3%, during fiscal 2009 as compared to fiscal 2008.
The decline in Net sales was driven by Facilities Maintenance and Repair & Remodel, which both had declines in Net sales of $25 million. These declines were partially offset at Crown Bolt, which had an increase in Net sales of $4 million in fiscal 2009 as compared to fiscal 2008. The general economic deterioration and the weakening of the residential construction market were the primary causes of the declines in Net sales in fiscal 2009. Partially offsetting the volume declines was an increase in Net sales driven by sales initiatives at both Crown Bolt and Facilities Maintenance.
Operating income
Operating income decreased $7 million, or 4.2%, during fiscal 2009 as compared to fiscal 2008. The primary driver of the decline was a goodwill impairment charge of $30 million at Repair & Remodel during fiscal 2009. Excluding the goodwill impairment charge, operating income increased $23 million during fiscal 2009 as compared to fiscal 2008.
The operating income increase in fiscal 2009, excluding the goodwill impairment charge, as compared to fiscal 2008 was driven by increases of $23 million and $5 million at Facilities Maintenance and Crown Bolt, respectively, partially offset by a decrease of $5 million at Repair & Remodel.
The operating income increases at Facilities Maintenance and Crown Bolt for fiscal 2009 were driven by decreases in selling, general and administrative expenses primarily as a result of lower personnel and freight costs. In addition, operating income at Facilities Maintenance was positively impacted in fiscal 2009 by a reduction in depreciation and amortization expense and an increase in gross profit as a result of strategic pricing partially offset by product inflation. The operating income decrease at Repair & Remodel, excluding the goodwill impairment charge, was driven by volume declines, as a result of the weakening residential construction market partially offset by a decline in selling, general, and administrative expense due to cost reduction efforts.
Operating income as a percentage of Net sales decreased 10 basis points in fiscal 2009 as compared to fiscal 2008, driven by the goodwill impairment charge at Repair & Remodel. Excluding the goodwill impairment charge, operating income as a percentage of Net sales increased 140 basis points in fiscal 2009 as compared to fiscal 2008, driven by declines in selling, general and administrative expenses across the sector and improvements in gross margin at Facilities Maintenance.
During November 2009, Facilities Maintenance replaced a highly customized and overburdened software system with SAP. The November launch encompassed order entry, customer relationship management, sales, receiving, returns, billing, inventory payables, business intelligence, and purchasing management processes which are now highly integrated and streamlined. The new SAP platform operates on stronger and more secure IT infrastructure to enable continued growth and expansion as well as a better customer experience. Facilities Maintenance’s capital expenditures for the system were $40 million, incurred during fiscal 2009, fiscal 2008, and fiscal 2007. The SAP platform will be amortized over 6 years, resulting in an incremental annualized amortization expense of approximately $7 million. Fiscal 2009 includes an incremental $1 million of amortization expense related to the new SAP platform.
Fiscal 2008 and fiscal 2007
| Dollars in millions | Successor | Successor | Predecessor | Increase (Decrease) | |||||||||||||||||||
| Fiscal 2008 | Successor 2007 |
Predecessor 2007 |
Pro Forma Adjustments |
Pro Forma 2007 |
Fiscal 2008 Successor |
Successor 2007 vs. Predecessor 2007 |
Fiscal 2008 vs. Pro | ||||||||||||||||
| Net sales |
$ | 2,070.2 | $ | 850.2 | $ | 1,237.2 | $ | – | $ | 2,087.4 | 143.5% | (31.3)% | (0.8)% | ||||||||||
| Operating income (loss) |
162.4 | 44.7 | 157.8 | (59.1) | a | 143.4 | * | (71.7)% | 13.2% | ||||||||||||||
| % of Net sales |
7.8% | 5.3% | 12.8% | (4.8)% | 6.9% | 250 bps | (750) bps | 90 bps | |||||||||||||||
| * | not meaningful |
51
Table of Contents
Index to Financial Statements
HD SUPPLY, INC.
MANAGEMENT’S DISCUSSION AND ANALYSIS OF FINANCIAL CONDITION AND RESULTS OF OPERATIONS
(Continued)
| (a) | The Transactions were accounted for as a purchase in accordance with U.S. GAAP. Under these principles, the acquisition consideration was allocated to our tangible assets and liabilities based on their fair values. The excess purchase price over the fair value of the net assets acquired was recorded as goodwill. The pro forma adjustment shown below is based upon our final valuation of tangible and intangible net assets as if the Transaction occurred on January 29, 2007 (amounts in millions). |
| New depreciation expense (i) |
$ | 20.7 | |||
| New amortization expense (i i) |
61.8 | ||||
| Total pro forma depreciation and amortization expense |
82.5 | ||||
| Less: Historical depreciation and amortization expense |
23.4 | ||||
| Adjustment to depreciation and amortization expense |
$ | 59.1 | |||
| (i) | Fair value of fixed assets acquired, and included in continuing operations, was $178 million with a weighted average useful life of 5.0 years. |
(ii)
| (Dollars in millions) |
Fair value | Useful life (in years) |
New amortization expense (7 months) |
|||||
| Customer relationships |
$ 549 | 7 | $ 45 | |||||
| Strategic purchase agreement |
166 | 7 | 14 | |||||
| Trade names |
18 | 20 | 1 | |||||
| Leasehold interests |
10 | 4 | 1 | |||||
| Covenant not to compete |
2 | 2 | 1 | |||||
| $ 745 | $ 62 | |||||||
Fiscal 2008 compared to successor 2007
Net sales
Net sales increased to $2,070.2 million during fiscal 2008 from $850.2 million during Successor 2007, an increase of $1,220 million.
The increase in Net sales is primarily due to twelve months of operations included in fiscal 2008 compared to five months of operations included in Successor 2007. In addition, Net sales at Facilities Maintenance increased due to an increase in renovation sales, pricing initiatives and overall organic growth in the business. Partially offsetting these increases was the negative impact of the weakening residential construction market at Repair & Remodel.
Operating income
Operating income increased $117.7 million during fiscal 2008 compared to Successor 2007, primarily due to twelve months of operations included in fiscal 2008 compared to five months of operations included in Successor 2007. The operating income increase in fiscal 2008 compared to Successor 2007 was driven by increases of $104.4 million, $10.2 million and $3.1 million at Facilities Maintenance, Crown Bolt, and Repair & Remodel, respectively.
Operating income as a percentage of Net sales increased 250 basis points in fiscal 2008 as compared to Successor 2007. This increase was primarily driven by gross margin improvements across the entire market sector. Improvements in gross margins at both Facilities Maintenance and Crown Bolt were primarily due to pricing initiatives and the impact of a new product launch by Crown Bolt in late 2007, which temporarily reduced margins during Successor 2007. Gross margins at Repair & Remodel improved during fiscal 2008 as a result of closing less profitable branches in fiscal 2007.
Successor 2007 compared to Predecessor 2007
Net sales
Net sales decreased to $850.2 million during Successor 2007 as compared to $1,237.2 million during Predecessor 2007, a decrease of $387 million.
The decrease in Net sales is primarily due to the inclusion of five months of operations in Successor 2007 as compared to seven months of operations included in Predecessor 2007. In addition, the Predecessor 2007 period
52
Table of Contents
Index to Financial Statements
HD SUPPLY, INC.
MANAGEMENT’S DISCUSSION AND ANALYSIS OF FINANCIAL CONDITION AND RESULTS OF OPERATIONS
(Continued)
includes the majority of the spring and summer months which typically experience higher construction activity due to better weather and longer daylight hours. Repair & Remodel was also negatively impacted by the weakening of the residential construction market, which led to four branch closures.
Operating income
Operating income decreased $113.1 million during Successor 2007 compared to Predecessor 2007, primarily due to the inclusion of five months of operations in Successor 2007 as compared to seven months of operations included in Predecessor 2007. The operating income decrease in Successor 2007 compared to Predecessor 2007 was driven by decreases of $62.1 million, $35.3 million and $15.6 million at Facilities Maintenance, Crown Bolt, and Repair & Remodel, respectively.
Operating income as a percentage of Net sales decreased 750 basis points in Successor 2007 as compared to the Predecessor 2007, driven by an increase in depreciation and amortization primarily due to the Transactions. In addition, Crown Bolt’s gross margins and operating income as a percentage of Net sales in Successor 2007 were negatively impacted by the initial costs related to a new product launch in late 2007. Repair & Remodel’s gross margins in Successor 2007 were negatively impacted by the weakening residential construction market. Partially offsetting these negative impacts was a decrease in selling, general and administrative costs as a percentage of Net sales at Facilities Maintenance.
Fiscal 2008 compared to pro forma 2007
Net sales
Net sales decreased to $2,070.2 million during fiscal 2008 from $2,087.4 million during pro forma 2007, a decrease of $17 million.
The decline in Net sales in fiscal 2008 compared to pro forma 2007 was driven by Repair & Remodel, which had a decline in Net sales of $67 million. This decline was significantly offset at Facilities Maintenance and Crown Bolt, which had increases in Net sales of $32 million and $17 million, respectively, in fiscal 2008 compared to pro forma 2007. The weakening of the residential construction market was the primary driver of the decline in Net sales at Repair & Remodel, which led to four branch closures. Substantially offsetting these declines was sales growth at Facilities Maintenance, driven by an increase in renovation sales, pricing initiatives and overall organic growth in the business, the impact of sales initiatives at Repair & Remodel, and sales growth at Crown Bolt as a result of pricing initiatives and the addition of a new product line offering in late fiscal 2007.
Operating income
Operating income increased $19 million during fiscal 2008 compared to pro forma 2007. Operating income as a percentage of Net sales increased 90 basis points in fiscal 2008 as compared to pro forma 2007. The operating income increase in fiscal 2008 compared to pro forma 2007 was driven by increases of $30.2 million and $0.3 million at Facilities Maintenance and Crown Bolt, respectively, partially offset by a decrease of $11.5 million at Repair & Remodel.
The operating income increases at Facilities Maintenance and Crown Bolt were driven by improvements in gross margins due to pricing initiatives. Substantially offsetting this improvement at Crown Bolt was a $7 million increase in depreciation and amortization expense due to capital expenditures on store fixtures with relatively short useful lives. The operating income decrease at Repair & Remodel was driven by volume declines and related branch closures, as a result of the weakening residential construction market. Partially offsetting these negative impacts to operating income was a decline in selling, general, and administrative expense at Repair & Remodel due to cost reduction efforts.
The increase in operating income as a percentage of Net sales was driven by gross margin improvements at Facilities Maintenance and Crown Bolt due to pricing initiatives. However, the improvement at Crown Bolt was substantially offset by an increase in depreciation and amortization expense. Gross margins at Repair & Remodel also improved during fiscal 2008 as a result of closing less profitable branches in fiscal 2007. However, the
53
Table of Contents
Index to Financial Statements
HD SUPPLY, INC.
NOTES TO CONSOLIDATED AND COMBINED FINANCIAL STATEMENTS
(Continued)
reduction in sales outpaced the reduction in fixed costs of the business, resulting in a decrease in operating income as a percentage of Net sales.
Specialty Construction
Fiscal 2009 and fiscal 2008
| Dollars in millions, Successor periods | Fiscal 2009 | Fiscal 2008 | Increase (Decrease) | |||
| Net sales |
$ 1,530.6 | $2,460.4 | (37.8)% | |||
| Operating income (loss) |
(196.2) | (365.1) | (46.3)% | |||
| % of Net sales |
(12.8)% | (14.8)% | (200) bps |
Net sales
Net sales decreased $930 million, or 37.8%, during fiscal 2009 as compared to fiscal 2008.
White Cap, CTI, and Plumbing experienced declines in Net sales of $498 million, $152 million, and $280 million, respectively, in fiscal 2009 as compared to fiscal 2008. The weakening of the residential and commercial construction markets continued to have a negative impact on the Specialty Construction sector, having an estimated volume impact of approximately $700 million in fiscal 2009 as compared to fiscal 2008. In addition, branch closures at Plumbing in the second half of fiscal 2008 and during fiscal 2009 had an estimated negative impact on Net sales of $43 million in fiscal 2009 as compared to fiscal 2008. During fiscal 2009, CTI experienced a negative impact on Net sales due to fewer upgrade purchases by customers in new home construction and White Cap and Plumbing reported declines in Net sales due to unfavorable commodity prices, such as rebar and copper.
Operating income (loss)
Operating loss decreased $169 million during fiscal 2009 as compared to fiscal 2008, primarily as a result of a $252 million goodwill impairment charges in fiscal 2008. Excluding the goodwill impairment charge, operating loss increased $83 million during fiscal 2009 as compared to fiscal 2008.
The increase in operating loss in fiscal 2009 as compared to fiscal 2008, excluding the goodwill impairment charges, was driven by increases of $85 million and $31 million at White Cap and Plumbing, respectively, partially offset by a decrease in operating loss of $32 million at CTI.
The increases in operating loss during fiscal 2009, excluding the goodwill impairment charges, were primarily driven by volume declines related to the weakening of the residential and commercial construction markets and, to a lesser extent, competitive pricing pressures and fluctuating commodity prices. Operating income (loss) in fiscal 2009 and fiscal 2008 were negatively impacted by restructuring charges for additional branch closures and consolidations and personnel reductions. Charges of $29 million and $18 million were recorded in fiscal 2009 and fiscal 2008, respectively. Of these charges, $9 million and $2 million for fiscal 2009 and fiscal 2008, respectively, was related to inventory liquidation charges, which are included in Cost of sales in the Company’s consolidated statement of operations. Under the fiscal 2009 plan initiated in the third quarter of fiscal 2009, the Specialty Construction sector expects to close approximately 15 branches and reduce workforce personnel by approximately 340 employees. As of January 31, 2010, we have completed the closure of 8 branches and approximately 180 headcount reductions. We expect to incur an additional $15 million under this plan in fiscal 2010. During fiscal 2009, operating loss was positively impacted by a decline in selling, general and administrative costs primarily due to personnel reductions and other cost reduction efforts.
Operating loss as a percentage of Net sales decreased 200 basis points in fiscal 2009 as compared to fiscal 2008. Excluding the goodwill impairment charge in fiscal 2008, operating loss as a percentage of Net sales increased 820 basis points in fiscal 2009 as compared to fiscal 2008. During fiscal 2009, volume declines, fluctuating commodity prices, and pricing pressures resulted in a decline in gross margins that outpaced the reduction in fixed costs of the business, resulting in an increase in operating loss as a percentage of Net sales.
54
Table of Contents
Index to Financial Statements
HD SUPPLY, INC.
MANAGEMENT’S DISCUSSION AND ANALYSIS OF FINANCIAL CONDITION AND RESULTS OF OPERATIONS
(Continued)
Fiscal 2008 and fiscal 2007
| Dollars in millions | Successor | Successor | Predecessor | Increase (Decrease) | |||||||||||||||||
| Fiscal 2008 | Successor 2007 |
Predecessor 2007 |
Pro Forma Adjustments |
Pro Forma 2007 |
Fiscal 2008 vs. Successor 2007 |
Successor 2007 vs. Predecessor 2007 |
Fiscal 2008 vs. Pro Forma 2007 | ||||||||||||||
| Net sales |
$ | 2,460.4 | $ | 1,323.5 | $ | 2,120.5 | $ | – | $ | 3,444.0 | 85.9% | (37.6)% | (28.6)% | ||||||||
| Operating income (loss) |
(365.1) | (12.8) | 23.3 | (2.7) a | 7.8 | * | * | * | |||||||||||||
| % of Net sales |
(14.8)% | (1.0)% | 1.1% | (0.1)% | 0.2% | (1,380) bps | (210) bps | (1,500) bps | |||||||||||||
| * | not meaningful |
| (a) | The Transactions were accounted for as a purchase in accordance with U.S. GAAP. Under these principles, the acquisition consideration was allocated to our tangible assets and liabilities based on their fair values. The excess purchase price over the fair value of the net assets acquired was recorded as goodwill. The pro forma adjustment shown below is based upon our final valuation of tangible and intangible net assets as if the Transaction occurred on January 29, 2007 (amounts in millions). |
| New depreciation expense (i) |
$ | 20.2 | |||
| New amortization expense (i i) |
15.6 | ||||
| Total pro forma depreciation and amortization expense |
35.8 | ||||
| Less: Historical depreciation and amortization expense |
33.1 | ||||
| Adjustment to depreciation and amortization expense |
$ | 2.7 | |||
| (i) | Fair value of fixed assets acquired, and included in continuing operations, was $247 million with a weighted average useful life of 7.1 years. |
(ii)
| (Dollars in millions) |
Fair value | Useful life (in years) |
New amortization expense (7 months) |
||||||
| Customer relationships |
$ | 136 | 7 | $ 11 | |||||
| Trade names |
21 | 20 | 1 | ||||||
| Leasehold interests |
21 | 4 | 3 | ||||||
| Covenant not to compete |
2 | 2 | 1 | ||||||
| $ | 180 | $ 16 | |||||||
Fiscal 2008 compared to successor 2007
Net sales
Net sales increased to $2,460.4 million during fiscal 2008 from $1,323.5 million during Successor 2007, an increase of $1,137 million.
The increase in Net sales is primarily due to twelve months of operations included in fiscal 2008 compared to five months of operations included in Successor 2007. Partially offsetting this increase was the negative impact of the weakening of the residential and commercial construction markets. In addition, Plumbing closed approximately 60 branches during fiscal 2008 and CTI experienced a negative impact due to competitive pressure on pricing.
Operating income (loss)
Operating income decreased $352 million during fiscal 2008 compared to Successor 2007, primarily as a result of a goodwill impairment charge of $252 million, partially offset by the inclusion of twelve months of operations in fiscal 2008 compared to five months of operations in Successor 2007. Excluding the goodwill impairment charge, operating income decreased $100 million in fiscal 2008. Operating income as a percentage of Net sales decreased 1,380 basis points during fiscal 2008 compared to Successor 2007, of which 1,020 basis points were attributable to the goodwill impairment charge.
The decrease in operating income in fiscal 2008 compared to Successor 2007 was driven by decreases of $159.4 million, $130.0 million, and $62.8 million at CTI, Plumbing, and White Cap, respectively. Excluding the goodwill
55
Table of Contents
Index to Financial Statements
HD SUPPLY, INC.
MANAGEMENT’S DISCUSSION AND ANALYSIS OF FINANCIAL CONDITION AND RESULTS OF OPERATIONS
(Continued)
impairment charges, the operating income decreases were $91.9 million and $19.3 million at CTI and Plumbing, respectively, partially offset by an increase of $11.3 million at White Cap.
Excluding the goodwill impairment charge, the decline in operating income was primarily driven by volume declines related to the weakening of the residential and commercial construction markets. In addition, CTI’s operating income was negatively impacted by competitive pressure on pricing. During fiscal 2008, operating income was positively impacted by a decline in selling, general and administrative costs primarily due to branch closures and personnel reductions, and other cost reduction efforts. These declines were partially offset by a fourth quarter charge of $20 million for a provision for uncollectible trade receivables as a result of declining general economic conditions and a review of the aging trade receivable accounts and collection patterns. In addition, operating income for the market sector was negatively impacted by a restructuring charge of $18 million recorded in late fiscal 2008 for additional branch closures and consolidations and personnel reductions.
Excluding the goodwill impairment charge, operating income as a percentage of Net sales declined 360 basis points in fiscal 2008 compared to Successor 2007. The decline was primarily driven by CTI, and, to a lesser extent, Plumbing. The volume declines and pricing pressures at CTI resulted in a significant decline in gross margins that outweighed the impact of cost reductions, including the improvements resulting from personnel reductions. Gross margins at Plumbing were flat in fiscal 2008 as compared to Successor 2007; however, the reduction in monthly sales outpaced the reduction in fixed costs of the business, resulting in a decrease in operating income as a percentage of Net sales. Offsetting these declines was an improvement in operating income as a percentage of Net sales at White Cap driven by a decline in selling, general, and administrative costs as a percentage of Net sales.
Successor 2007 compared to predecessor 2007
Net sales
Net sales decreased to $1,323.5 million during Successor 2007 from $2,120.5 million during Predecessor 2007, a decrease of $797 million.
The decrease in Net sales is primarily due to five months of operations included in Successor 2007 compared to seven months of operations included in Predecessor 2007. In addition, the Predecessor 2007 period includes the majority of the spring and summer months which typically experience higher construction activity due to better weather and longer daylight hours. White Cap and Plumbing experienced volume declines in Successor 2007 as compared to Predecessor 2007 as a result of the weakening residential and commercial construction markets.
Operating income (loss)
Operating income decreased $36 million during Successor 2007 compared to Predecessor 2007, primarily due to the inclusion of five months of operations in Successor 2007 compared to seven months of operations included in Predecessor 2007. Operating income as a percentage of Net sales decreased 210 basis points in Successor 2007 as compared to Predecessor 2007.
The operating income decrease in Successor 2007 compared to Predecessor 2007 was driven by decreases of $24.0 million and $19.2 million at White Cap and Plumbing, respectively, partially offset by an increase of $7.0 million at CTI. The decline in operating income as a percentage of Net sales was driven by volume declines at White Cap and Plumbing, which adversely affected the absorption of overhead costs. Partially offsetting this decline was an increase in operating income as a percentage of Net sales at CTI, driven by a reduction in selling, general, and administrative costs as a percentage of Net sales.
Fiscal 2008 compared to pro forma 2007
Net sales
Net sales decreased to $2,460.4 million during fiscal 2008 from $3,444.0 million during pro forma 2007, a decrease of $984 million.
56
Table of Contents
Index to Financial Statements
HD SUPPLY, INC.
MANAGEMENT’S DISCUSSION AND ANALYSIS OF FINANCIAL CONDITION AND RESULTS OF OPERATIONS
(Continued)
White Cap, CTI, and Plumbing experienced declines in Net sales of $202 million, $333 million, and $448 million, respectively, in fiscal 2008 compared to pro forma 2007. The weakening of the residential and commercial construction markets was the primary driver in the decline in Net sales, having an estimated impact of approximately $800 million. In addition, Plumbing closed approximately 60 branches during fiscal 2008, having an estimated negative impact on Net sales of $210 million, and CTI experienced a negative impact due to competitive pressure on pricing. Partially offsetting these declines were pricing and sales initiatives and favorable commodity prices at White Cap and Plumbing.
Operating income (loss)
Operating income decreased $373 million during fiscal 2008 compared to pro forma 2007, primarily as a result of a goodwill impairment charge of $252 million. Excluding the goodwill impairment charge, operating income decreased $121 million in fiscal 2008. Operating income as a percentage of Net sales decreased 1,500 basis points during fiscal 2008 compared to pro forma 2007, of which 1,020 basis points were attributable to the goodwill impairment charge.
The decrease in operating income in fiscal 2008 compared to pro forma 2007 was driven by decreases of $151.4 million, $145.1 million, and $76.4 million at CTI, Plumbing, and White Cap, respectively. Excluding the goodwill impairment charges, the operating income decreases were $83.9 million, $34.4 million, and $2.3 million at CTI, Plumbing, and White Cap, respectively.
Excluding the goodwill impairment charge, the decline in operating income was primarily driven by volume declines related to the weakening of the residential and commercial construction markets and, to a lesser extent, the closure of branches at Plumbing. In addition, CTI’s operating income was negatively impacted by competitive pressure on pricing, substantially offset by improvements in pricing at White Cap. During fiscal 2008, operating income was positively impacted by a decline in selling, general and administrative costs primarily due to branch closures and personnel reductions, for a combined positive impact of approximately $160 million, and other cost reduction efforts. These declines were partially offset by a fourth quarter charge of $20 million for a provision for uncollectible trade receivables as a result of declining general economic conditions and a review of the aging trade receivable accounts and collection patterns. In addition, operating income for the market sector was negatively impacted by a restructuring charge of $18 million recorded in late fiscal 2008 for additional branch closures and consolidations and personnel reductions.
Excluding the goodwill impairment charge, operating income as a percentage of Net sales declined 480 basis points in fiscal 2008 compared to pro forma 2007. The decline was primarily driven by CTI, and, to a lesser extent, Plumbing. The volume declines and pricing pressures at CTI resulted in a significant decline in gross margins that outweighed the impact of cost reductions, including the improvements resulting from a 45% decrease in personnel. Gross margins at Plumbing were relatively flat year over year; however, the reduction in sales outpaced the reduction in fixed costs of the business, resulting in a decrease in operating income as a percentage of Net sales.
Liquidity, capital resources and financial condition
Sources and uses of cash
We had $539 million in cash and cash equivalents and $359 million of available borrowings at January 31, 2010, for a combined liquidity of approximately $900 million. During fiscal 2009, cash inflow was primarily provided by cash receipts from operations including the cash receipt of an IRS refund of $134 million and receipt of the final working capital adjustment related to the Transactions of $22 million. These inflows were offset by cash used to meet the needs of the business including, but not limited to, payment of operating expenses, funding capital expenditures, and the payment of interest on debt.
Given the recent volatility in the capital markets, the Company has invested approximately $322 million in U.S. Treasury securities to fund operations in the event that any of the financial institutions that have committed to fund the Company's Revolving Credit Facility or ABL Credit Facility are unable or unwilling to meet their commitments. Our sources of funds, primarily from operations, cash on-hand, and, to the extent necessary, from readily available external financing arrangements, are sufficient to meet all current obligations on a timely basis.
57
Table of Contents
Index to Financial Statements
HD SUPPLY, INC.
NOTES TO CONSOLIDATED AND COMBINED FINANCIAL STATEMENTS
(Continued)
We believe that these sources of funds will be sufficient to meet the operating needs of our business for at least the next twelve months.
As a result of recent tax legislation regarding net operating loss carry-back periods, we were able to file for a cash refund of approximately $220 million from the IRS for income tax previously paid. This filing occurred on April 6, 2010.
Information about the Company’s cash flows, by category, is presented in the consolidated and combined Statements of Cash Flows.
Net cash provided by (used for):
| Successor | Successor | Successor | Predecessor | |||||||
| Amounts in millions | Fiscal 2009 |
Fiscal 2008 |
Successor 2007 |
Predecessor 2007 |
||||||
| Operating activities |
$ 69 | $ 548 | $364 | $ 408 | ||||||
| Investing activities |
(41) | 37 | (8,255) | (140) | ||||||
| Financing activities |
(263) | 86 | 7,977 | (269) | ||||||
Working capital
Working capital decreased to $1,925 million as of the end of fiscal 2009 from $2,071 million as of the end of fiscal 2008. The decrease in working capital during fiscal 2009 was driven by a decrease in accounts receivable, inventory, and cash and cash equivalents, substantially offset by a decrease in accounts payable. We continue to focus on asset management initiatives that are intended to improve our working capital efficiency in the future.
Working capital increased to $2,071 million as of the end of fiscal 2008 from $2,009 million as of the end of Successor 2007. The increase in working capital during fiscal 2008 was driven by an increase in cash and cash equivalents and a decrease in accounts payable, substantially offset by a decrease in accounts receivable and inventory. We continue to focus on asset management initiatives that are intended to improve our working capital efficiency in the future.
Operating activities
Cash flow from operating activities in fiscal 2009 was $69 million compared with $548 million in fiscal 2008. The decline in cash flow during fiscal 2009 as compared to fiscal 2008 was primarily the result of the timing of payments for the purchase of inventory and a reduction in operating income due primarily to the continued deterioration in the residential and commercial construction markets during fiscal 2009, partially offset by a reduction in receivables and inventory and the cash receipt of an IRS refund.
Cash flow from operating activities in fiscal 2008 was $548 million compared with $364 million in Successor 2007 and $408 million in Predecessor 2007. Cash provided by operating activities in fiscal 2008 and Successor 2007 reflect the Net Loss less non-cash charges for depreciation, amortization, goodwill impairment, and interest expense. Also contributing to cash provided by operating activities in fiscal 2008 and Successor 2007 was a more efficient use of working capital as a result of our efforts to operate our business with less inventory on hand and to more aggressively collect receivables. The increase in cash flow in fiscal 2008 compared with Successor 2007 and Predecessor 2007 is due to fiscal 2008 containing twelve months of operations compared with Successor 2007 containing five months and Predecessor 2007 containing seven months. The decline in monthly cash flow from operating activities in fiscal 2008 and Successor 2007 as compared to Predecessor 2007 is primarily related to the cash flow support of THD during Predecessor 2007 reflected as Non-cash charges from THD in the Combined Statement of Cash Flows.
Investing activities
During fiscal 2009, cash used in investing activities was $41 million, primarily driven by $58 million of capital expenditures and the $16 million acquisition of ORCO, partially offset by the receipt of $22 million for the final working capital adjustment related to the Transactions.
58
Table of Contents
Index to Financial Statements
HD SUPPLY, INC.
MANAGEMENT’S DISCUSSION AND ANALYSIS OF FINANCIAL CONDITION AND RESULTS OF OPERATIONS
(Continued)
During fiscal 2008, cash provided by investing activities was $37 million, primarily driven by the receipt of $99 million of net proceeds from the sale of our Lumber & Building Materials business, partially offset by capital expenditures of $77 million.
During Successor 2007, cash used in investing activities was $8,255 million, driven by the $8,183 million for the Transactions and $75 million of capital expenditures. During Predecessor 2007, cash used in investing activities was $140 million driven by capital expenditures of $176 million. Capital expenditures during Successor 2007 and Predecessor 2007 were higher than fiscal 2009 and fiscal 2008 as a result of integration of acquisitions in those earlier periods and investment in infrastructure due to the separation from THD.
Financing activities
During fiscal 2009, cash used in financing activities was $263 million, as a result of debt repayments, including the repurchase of $252 million principal amount of the 13.5% Senior Subordinated Notes for $62 million.
During fiscal 2008, cash provided by financing activities totaled $86 million, driven by $75 million of net borrowings on our long-term debt and $10 million of equity contributions.
During Successor 2007, cash provided by financing activities was $7,977 million driven by the issuance of $6,041 million in debt and $2,275 million of equity contributions to finance the Transactions. Partially offsetting these positive cash flows was $244 million of net payments made on revolving debt and $95 million of debt issuance costs. During Predecessor 2007, cash used in financing activities was $269 million driven by net payments to THD.
External financing
Since the Transactions, we are highly leveraged. As of January 31, 2010, we have an aggregate principal amount of $5.8 billion of outstanding debt and $359 million of available borrowings under our ABL Credit Facility (after giving effect to the borrowing base limitations). In order to fund the Transactions, we entered into several debt agreements as described below.
Senior Secured Credit Facility
On August 30, 2007, the Company entered into a senior secured credit facility (the “Senior Secured Credit Facility”) comprised of a $1 billion term loan (the “Term Loan”) and a $300 million revolving credit facility (the “Revolving Credit Facility”). The Term Loan has required quarterly principal payments of $2.5 million beginning December 31, 2007 with the balance due August 30, 2012. Additionally, beginning in fiscal 2009, the Company is required to pay down the Term Loan in an amount equal to 50% of Excess Cash Flow from the preceding fiscal year, as defined in the Term Loan agreement; such percentage is reduced to 0% depending on the attainment of certain leverage ratio targets. Under the Excess Cash Flow provisions of the Senior Secured Credit Facility, we are not required to make any repayments of the Term Loan during fiscal 2010 and were not required make any repayments of the Term Loan during fiscal 2009. At January 31, 2010 and February 1, 2009, the Term Loan principal outstanding was $978 million and $987 million, respectively.
The Term Loan is guaranteed by Home Depot and bears interest at Prime plus 0.25% or LIBOR plus 1.25% at the Company’s election. At January 31, 2010 and February 1, 2009, the Term Loan interest rate was 1.48% and 1.72%, respectively. Interest on the Term Loan is due at the end of each calendar quarter with respect to Prime rate draws or at the maturity of each LIBOR draw (unless said draw is for a six-, nine-, or twelve-month period, then interest shall be paid quarterly). The guarantee by Home Depot was valued at $106 million and is being amortized to interest expense over the five-year life of the Term Loan on a straight-line basis which approximates the effective interest method. During fiscal 2009, fiscal 2008, and the period from August 30, 2007 to February 3, 2008, the Company recorded amortization of the guarantee of $21 million, $21 million and $9 million, respectively. The Senior Secured Credit Facility is further collateralized by all of the capital stock of HD Supply, Inc. and its subsidiary guarantors and by 65% of the capital stock of its foreign subsidiaries as well as by other tangible and intangible assets owned by the Company subject to the priority of liens described in the guarantee and collateral agreement dated as of August 30, 2007. The Senior Secured Credit Facility contains various restrictive covenants including limitations on additional indebtedness and dividend payments and stipulations
59
Table of Contents
Index to Financial Statements
HD SUPPLY, INC.
MANAGEMENT’S DISCUSSION AND ANALYSIS OF FINANCIAL CONDITION AND RESULTS OF OPERATIONS
(Continued)
regarding the use of proceeds from asset dispositions. The Company is in compliance with all such covenants. The Senior Secured Credit Facility is subject to an acceleration clause under an Event of Default, as defined in the Senior Secured Credit Facility agreement. Management believes the likelihood of such acceleration to be remote.
The Revolving Credit Facility is due August 30, 2013 and bears interest at Prime plus 3.0% or LIBOR plus 4.0% at the Company’s election. The Revolving Credit Facility also has a 0.5% unused commitment fee and a Letter of Credit fee of 4.0% per annum. The Company had an outstanding balance of $300 million as of both January 31, 2010 and February 1, 2009, at an interest rate of 4.23% and 4.39%, respectively. As of January 31, 2010 and February 1, 2009, there were no outstanding Letters of Credit under the Revolving Credit Facility. Interest on the Revolving Credit Facility is due at the end of each calendar quarter with respect to Prime rate draws or at the maturity of each LIBOR draw (unless said draw is for a six-, nine-, or twelve-month period, then interest shall be paid quarterly). The Senior Secured Credit Facility can be repaid at any time without penalty or premium.
Asset Based Lending Credit Agreement
On August 30, 2007, the Company entered into a $2.1 billion Asset Based Lending Credit Agreement (the “ABL Credit Facility”) subject to borrowing base limitations. The ABL Credit Facility matures on August 30, 2012 and bears interest at Prime plus 0.5% or LIBOR plus 1.5% per annum at the Company’s election. At January 31, 2010 and February 1, 2009, the ABL Credit Facility interest rate was 2.062% and 2.039%, respectively. The ABL Credit Facility also contains an unused commitment fee of 0.25%. As of January 31, 2010 and February 1, 2009, the ABL Credit Facility had an outstanding balance of $596 million and $786 million, respectively. As of January 31, 2010, the Company has available borrowings under the ABL Credit Facility of $359 million, after giving effect to the borrowing base limitations. The Company can use up to $400 million of its available borrowing under the ABL Credit Facility for Letters of Credit which are charged a fee of 1.5% per annum. As of January 31, 2010 and February 1, 2009, there were $65 million and $60 million, respectively, of Letters of Credit outstanding under the ABL Credit Facility. The ABL Credit Facility can be repaid at any time without penalty or premium. The ABL Credit Facility contains various restrictive covenants including a limitation on the amount of dividends to be paid. In addition, if our availability under the ABL Credit Facility falls below $210 million (a “Liquidity Event”), we will be required to maintain a Fixed Charge Coverage Ratio of at least 1.0:1.0. The Company is in compliance with all such covenants. The ABL Credit Facility is collateralized by all of the capital stock of HD Supply, Inc. and its subsidiary guarantors and by 65% of the capital stock of its foreign subsidiaries as well as by other tangible and intangible assets owned by the Company subject to the priority of liens described in the guarantee and collateral agreement dated as of August 30, 2007. The ABL Credit Facility is subject to an acceleration clause in a Liquidity Event or an Event of Default, as defined in the ABL Credit Facility agreement. Under such acceleration, the administrative agent can direct payments from the Company’s depository accounts to directly pay down the outstanding balance under the ABL Credit Facility. Management believes the likelihood of such acceleration to be remote.
Lehman Brothers
On September 15, 2008, the parent company of Lehman Brothers, Lehman Brothers Holdings Inc., filed a petition under Chapter 11 of the U.S. Bankruptcy Code with the United States Bankruptcy Court for the Southern District of New York. Lehman Brothers is committed to fund $100 million of the Company’s $300 million available Revolving Credit Facility and up to $95 million of the Company’s $2.1 billion ABL Credit Facility. During September 2008, the Company drew down the entire $300 million Revolving Credit Facility and invested the proceeds in U.S. Treasury securities. Lehman Brothers funded their $100 million commitment of the Revolving Credit Facility but has failed to fund a portion of their ABL Credit Facility commitment. As of January 31, 2010, outstanding borrowings under the ABL Credit Facility from Lehman Brothers are approximately $10 million. In addition, the Administrative Agent of the ABL Credit Facility holds $15 million in escrow funds, which are available to honor Lehman’s pro rata portion of any ABL Credit Facility draw. The combined available unfunded commitment from Lehman Brothers as of January 31, 2010 (prior to the ABL Credit Facility borrowing base limitations) was approximately $70 million.
60
Table of Contents
Index to Financial Statements
HD SUPPLY, INC.
MANAGEMENT’S DISCUSSION AND ANALYSIS OF FINANCIAL CONDITION AND RESULTS OF OPERATIONS
(Continued)
Senior Notes
On August 30, 2007, the Company issued $2.5 billion of Senior Notes bearing interest at a rate of 12.0% (the “12.0% Senior Notes”). Interest payments are due each March and September 1st through maturity. The 12.0% Senior Notes mature on September 1, 2014 and can be redeemed by the Company as follows:
| Redemption Period | Redemption Price | |||
| Sept. 1, 2011 – August 31, 2012 |
106% plus accrued interest | |||
| Sept. 1, 2012 – August 31, 2013 |
103% plus accrued interest | |||
| Sept. 1, 2013 – Thereafter |
100% plus accrued interest | |||
The Company may also redeem all or a portion of the 12.0% Senior Notes under certain conditions and for the price as described in the agreement prior to September 1, 2011. The 12.0% Senior Notes contain various restrictive covenants including limitations on additional indebtedness and dividend payments and stipulations regarding the use of proceeds from asset dispositions. The Company is in compliance with all such covenants.
Senior Subordinated Notes
On August 30, 2007, the Company issued $1.3 billion of Senior Subordinated PIK Notes bearing interest at a rate of 13.5% (the “13.5% Senior Subordinated Notes”). Interest payments are due each March and September 1st through maturity except that the first eight payment periods through September 2011 shall be paid in kind (“PIK”) and therefore increase the balance of the outstanding indebtedness rather than be paid in cash. During fiscal 2009, the Company repurchased $252 million principal amount, plus accrued interest of $15 million, of the 13.5% Senior Subordinated Notes. As a result of PIK interest capitalizations and the extinguishment of a portion of the principal, as of January 31, 2010, the outstanding principal balance of the 13.5% Senior Subordinated Notes was $1.4 billion. The 13.5% Senior Subordinated Notes mature on September 1, 2015 and can be redeemed by the Company as follows:
| Redemption Period | Redemption Price | |||
| Sept. 1, 2011 – August 31, 2012 |
106.75% plus accrued interest | |||
| Sept. 1, 2012 – August 31, 2013 |
103.375% plus accrued interest | |||
| Sept. 1, 2013 – Thereafter |
100% plus accrued interest | |||
The Company may also redeem all or a portion of the 13.5% Senior Subordinated Notes under certain conditions and for the price as described in the agreement prior to September 1, 2011. The 13.5% Senior Subordinated Notes contain various restrictive covenants including limitations on additional indebtedness and dividend payments and stipulations regarding the use of proceeds from asset dispositions. The Company is in compliance with all such covenants.
The Company and its affiliates may from time to time repurchase or otherwise retire the Company’s debt and take other steps to reduce the Company’s debt or otherwise improve the Company’s balance sheet. These actions may include open market repurchases, negotiated repurchases and other retirements of outstanding debt. The amount of debt that may be repurchased or otherwise retired, if any, will depend on market conditions, trading levels of the Company’s debt from time to time, the Company’s cash position and other considerations.
Credit Agreement Amendments and The Home Depot, Inc. Consent
On March 19, 2010, the Company entered into Amendment No. 3 (the “Cash Flow Amendment”) to its $1.3 billion Senior Secured Credit Facility, dated as of August 30, 2007, by and among the Company, Merrill Lynch Capital Corporation, as administrative agent and collateral agent, and the other lenders and financial institutions from time to time party thereto. The Cash Flow Amendment extended the maturity date from August 30, 2012 to April 1, 2014 of approximately $873 million in principal amount of outstanding Term Loans under the Senior Secured Credit Facility. THD, which guarantees payment of the Term Loans under the Senior Secured Credit Facility, consented to the Cash Flow Amendment. Concurrently, THD and the Company entered into an agreement pursuant to which THD consented to any later amendment to the Senior Secured Credit Facility, as amended, (similar in form and substance to the Cash Flow Amendment) that would extend the maturity of the
61
Table of Contents
Index to Financial Statements
HD SUPPLY, INC.
MANAGEMENT’S DISCUSSION AND ANALYSIS OF FINANCIAL CONDITION AND RESULTS OF OPERATIONS
(Continued)
remaining approximately $104 million of outstanding Term Loans to a date that is not later than the maturity date in effect from time to time under the Cash Flow Amendment. In addition, the Company entered into a letter agreement with THD, pursuant to which the Company agreed that, while the THD guarantee is outstanding, the Company would not voluntarily repurchase 12.0% Senior Notes or any 13.5% Senior Subordinated Notes, directly or indirectly, without THD’s prior written consent, subject to certain exceptions, including debt repurchases with equity or permitted refinancings. The Company also agreed to prepay $30 million in aggregate principal amount of non-extending Term Loans under the Senior Secured Credit Facility. The maturity date of the extended outstanding Term Loans may be further extended to a date not later than June 1, 2014, without further consent by the lenders, if THD provides a notice electing to extend its guarantee of the Term Loans to such later date. However, THD is under no obligation to provide such notice or make such election to further extend its guarantee, and the Company cannot provide any assurance that THD will provide such notice or make such election or on what terms it might do so. The remaining outstanding nonextended Term Loans will mature on the original maturity date of such loans, i.e. August 30, 2012. All Terms Loans outstanding under the Senior Secured Credit Facility, as amended, amortize in nominal quarterly installments equal to 0.25% of the original aggregate principal amount of the Term Loans. The Cash Flow Amendment also increased the borrowing margins applicable to the extended portion of the Term Loans by 150 basis points.
On March 19, 2010, the Company also entered into the Limited Consent and Amendment No. 3 (the “ABL Amendment”) to its $2.1 billion Asset Based Lending Credit Agreement (“ABL Credit Facility”), dated as of August 30, 2007, by and among the Company, certain subsidiaries of the Company, GE Business Financial Services Inc. (formerly known as Merrill Lynch Business Financial Services Inc.), as administrative agent and collateral agent, GE Canada Finance Holding Company, as Canadian administrative agent and Canadian collateral agent, and the several lenders and financial institutions from time to time parties thereto. Pursuant to the ABL Amendment, the Company (i) converted approximately $214 million of commitments under the ABL Credit Facility into a term loan (the “ABL Term Loan”), (ii) extended the maturity date of approximately $1,537 million of the commitments under the ABL Revolving Credit Facility from August 30, 2012 to the later of April 1, 2014 and the maturity date of the extended term loans under the Cash Flow Amendment, and (iii) reduced the total commitments under the ABL Credit Facility by approximately $45 million. The ABL Term Loan does not amortize and the entire principal amount thereof is due and payable on the later of April 1, 2014 and the maturity date of the extended Term Loans under the Senior Secured Credit Facility, as amended. The remaining approximately $304 million of commitments under the ABL Credit Facility matures on the original maturity date of such commitments, i.e. August 30, 2012. In addition, the ABL Amendment provided for a borrowing rate of Prime plus 225 basis points or LIBOR plus 325 basis points applicable to the ABL Term Loan and increased the borrowing margins applicable to the extended portion of the ABL Revolving Credit Facility by 175 basis points and the commitment fee applicable to such portion by 50 basis points.
The table below summarizes amounts outstanding as of March 28, 2010 under our Senior Secured Credit Facility and ABL Credit Facility, and the maturity dates of such indebtedness, giving effect to the Cash Flow Amendment and ABL Amendment (amounts in millions).
| August 30,
2012 |
August 30,
2013 |
April 1,
2014 | ||||
| Senior Secured Credit Facility |
||||||
| Term Loan |
$74 | $ – | $874 | |||
| Revolving Credit Facility |
– | 300 | – | |||
| ABL Credit Facility |
||||||
| ABL Term Loan |
– | – | 214 | |||
| ABL Revolving Credit Facility |
60 | – | 315 |
Rating agency actions
During the third quarter of fiscal 2009, Standard & Poor's Ratings Services reaffirmed our B rating, but lowered its outlook on the Company to negative and Moody’s Investors Service lowered the Company’s rating to CAA1, with a stable outlook, from B3. Both agencies cited the Company’s exposure to the ongoing weakness in U.S. construction as well as high leverage levels as the primary pressures on the ratings.
62
Table of Contents
Index to Financial Statements
HD SUPPLY, INC.
MANAGEMENT’S DISCUSSION AND ANALYSIS OF FINANCIAL CONDITION AND RESULTS OF OPERATIONS
(Continued)
Registration statement
On July 27, 2009, HD Supply, Inc. filed a registration statement on Form S-4/A with the U.S. Securities and Exchange Commission in accordance with the registration rights agreements relating to the 12.0% Senior Notes and 13.5% Senior Subordinated Notes. On July 28, 2009, the registration statement was declared effective by the SEC and the offer to exchange outstanding 12.0% Senior Notes with registered 12.0% Senior Notes and outstanding 13.5% Senior Subordinated Notes with registered 13.5% Senior Subordinated Notes was executed. The exchange offer closed on August 25, 2009 with all of the notes held by eligible participants in the exchange offer tendered.
Interest rate swaps
We maintain interest rate swap agreements to exchange fixed and variable rate interest payment obligations without the exchange of the underlying principal amounts. Our swaps commit us to pay fixed interest and receive variable interest, effectively converting $400 million of floating-rate debt to fixed rate debt. During fiscal 2009, we paid a weighted average fixed rate of 3.8% and received a weighted average floating rate of 0.3% on the combined notional value of $400 million. During fiscal 2008, we paid a weighted average fixed rate of 3.8% and received a weighted average floating rate of 2.4% on the combined notional value of $400 million. In January 2010, swaps with a combined $200 million notional value matured. The remaining swaps, having a combined $200 million notional value, mature in January 2011. As of January 31, 2010, the swaps have a weighted average fixed pay rate of 3.9% and a weighted average floating receive rate of 0.2% on the combined notional value of $200 million.
Commodity and interest rate risk
Commodity risk
We are aware of the potentially unfavorable effects inflationary pressures may create through higher asset replacement costs and related depreciation, higher interest rates and higher material costs. In addition, our operating performance is affected by price fluctuations in steel, nickel, copper, aluminum, PVC and other commodities. We seek to minimize the effects of inflation and changing prices through economies of purchasing and inventory management resulting in cost reductions and productivity improvements as well as price increases to maintain reasonable gross margins.
As discussed above, our results of operations were favorably or negatively impacted by fluctuating commodity prices based on our ability or inability to pass increases in the prices of certain commodity-based products to our customers. Such commodity price fluctuations have from time to time produced volatility in our financial performance and could continue to do so in the future.
Interest rate risk related to debt
We are subject to interest rate risk associated with our Senior Secured Credit Facility and our ABL Credit Facility.
As of January 31, 2010, the Senior Secured Credit Facility was comprised of the following:
| — | A $1.0 billion Term Loan due August 30, 2012, with an outstanding balance of $978 million. The Term Loan is guaranteed by THD and bears interest at Prime plus 0.25% or LIBOR plus 1.25% at the Company’s election. At January 31, 2010 the Term Loan interest rate was 1.48%. |
| — | A $300 million Revolving Credit Facility due August 30, 2013 that bears interest at Prime plus 3.0% or LIBOR plus 4.0% at the Company’s election. The Revolving Credit Facility also has a 0.5% unused commitment fee and a Letter of Credit fee of 4.0% per annum. As of January 31, 2010, the Company had an outstanding balance of $300 million, at an interest rate of 4.23%, and no outstanding Letters of Credit under the Revolving Credit Facility. |
As of January 31, 2010, the ABL Credit Facility was comprised of the following:
| — | A $2.1 billion ABL Revolving Credit Facility due August 30, 2012 that bears interest at Prime plus 0.5% or LIBOR plus 1.5% per annum at the Company’s election. At January 31, 2010 the ABL Revolving |
63
Table of Contents
Index to Financial Statements
HD SUPPLY, INC.
MANAGEMENT’S DISCUSSION AND ANALYSIS OF FINANCIAL CONDITION AND RESULTS OF OPERATIONS
(Continued)
| Credit Facility interest rate was 2.062%. As of January 31, 2010, the ABL Revolving Credit Facility had an outstanding balance of $596 million. As of January 31, 2010, the Company could use up to $400 million of its available borrowing under the ABL Credit Facility for Letters of Credit which are charged a fee of 1.5% per annum. As of January 31, 2010, there were $65 million of Letters of Credit outstanding under the ABL Credit Facility. |
While changes in interest rates impact the fair value of the fixed rate debt, there is no impact to earnings and cash flow. Alternatively, while changes in interest rates do not affect the fair value of our variable-interest rate debt, they do affect future earnings and cash flows. A 1% increase in interest rates on our variable-rate debt would increase our annual forecasted interest expense by approximately $17 million, net of the impact of our interest rate swaps (based on our borrowings on our credit facilities as of January 31, 2010).
Interest rate risk related to derivatives
We are also subject to interest rate risk on our interest rate swap agreements to exchange fixed and variable rate interest payment obligations without the exchange of the underlying principal amounts. The Company pays fixed interest and receives variable interest, effectively converting $200 million of floating-rate debt to fixed rate debt. As of January 31, 2010, the swaps have a weighted average fixed pay rate of 3.9% and a weighted average floating receive rate of 0.2%. The weighted average floating receive rate cannot fall below zero; therefore our interest rate risk for the remainder of fiscal 2010 is limited to the $200 million notional value at 0.2%, or less than $1 million.
Off-balance sheet arrangements
In accordance with generally accepted accounting principles, operating leases for a portion of our real estate and other assets are not reflected in our Consolidated Balance Sheets.
Contractual obligations
The following table discloses aggregate information about our contractual obligations as of January 31, 2010 and the periods in which payments are due (amounts in millions):
| Payments due by period | |||||||||||||||
| Total | Fiscal 2010 |
Fiscal 2011-2012 |
Fiscal 2013-2014 |
Fiscal years after 2014 | |||||||||||
| Long-term debt (1) |
$ | 6,193 | $ | 10 | $ | 1,563 | $ | 2,800 | $ | 1,820 | |||||
| Interest on long-term debt(2) |
2,620 | 344 | 922 | 1,108 | 246 | ||||||||||
| Operating leases |
652 | 170 | 244 | 126 | 112 | ||||||||||
| Unconditional purchase obligations ( 3) |
279 | 279 | – | – | – | ||||||||||
| Interest rate swaps ( 4) |
7 | 7 | – | – | – | ||||||||||
| Total contractual cash obligations ( 5) |
$ | 9,751 | $ | 810 | $ | 2,729 | $ | 4,034 | $ | 2,178 | |||||
| (1) | The long-term debt amount above includes $418 million in the “Fiscal years after 2014” column for interest that will be paid in kind through 2012, increasing the balance of the indebtedness outstanding rather than be paid in cash. As disclosed above in “Liquidity, capital resources and financial condition – External financing – Credit Agreement Amendments and The Home Depot, Inc. Consent,” we amended our Senior Secured Credit Facility and our ABL Credit Facility subsequent to the end of fiscal 2009. Giving effect to these amendments would increase the long-term debt included in the “Fiscal 2010” column by $30 million, reduce the long-term debt included in the “Fiscal 2011-2012” column by $1,472 million, and increase the long-term debt included in the “Fiscal 2013-2014” column by $1,442 million. |
| (2) | As disclosed above in “Liquidity, capital resources and financial condition – External financing – Credit Agreement Amendments and The Home Depot, Inc. Consent,” we amended our Senior Secured Credit Facility and our ABL Credit Facility subsequent to the end of fiscal 2009. Giving effect to these amendments referenced above would increase the interest expense on long-term debt in the “Fiscal 2010” column, the “Fiscal 2011-2012” column, and the “Fiscal 2013-2014” column by $30 million, $69 million, and $74 million, respectively. |
| (3) | Unconditional purchase obligations include various commitments with vendors to purchase inventory. |
| (4) | The amounts due for the interest rate swaps are based on market valuations at January 31, 2010. Actual payments, if any, may differ at settlement date. |
64
Table of Contents
Index to Financial Statements
HD SUPPLY, INC.
MANAGEMENT’S DISCUSSION AND ANALYSIS OF FINANCIAL CONDITION AND RESULTS OF OPERATIONS
(Continued)
| (5) | The contractual obligations table does not include capital lease obligations due to their immateriality. In addition, the table excludes $190 million of unrecognized tax benefits due to uncertainty regarding the timing of future cash payments, if any, related to the liabilities recorded in accordance with the U.S. GAAP guidance for uncertain tax positions (previously known as FASB Interpretation No. 48, “Accounting for Uncertainty in Income Taxes — an interpretation of FASB Statement No. 109”). |
Recent accounting pronouncements
FASB codification – In June 2009, the FASB issued Statement of Financial Accounting Standard (“SFAS”) No. 168, “The FASB Accounting Standards Codification and the Hierarchy of Generally Accepted Accounting Principles, a replacement of FASB Statement No. 162” (“SFAS 168”). SFAS 168 establishes the FASB Accounting Standards Codification™ (“Codification” or “ASC”) as the single source of authoritative U.S. GAAP recognized by the FASB to be applied by nongovernmental entities. Rules and interpretive releases of the SEC under authority of federal securities laws are also sources of authoritative U.S. GAAP for SEC registrants. The Codification supersedes all existing non-SEC accounting and reporting standards. All other nongrandfathered, non-SEC accounting literature not included in the Codification will become nonauthoritative. U.S. GAAP is not intended to be changed as a result of the FASB's Codification project, but it does change the way the guidance is organized and presented.
The Codification is effective for interim and annual periods ending after September 15, 2009. HD Supply adopted the Codification in the third quarter of fiscal 2009. As a result, references to accounting standards within these financial statements have been updated to reflect the Accounting Standards Codification references. The adoption did not impact the Company’s financial position or results of operations.
Multiple-deliverable revenue arrangements – In October 2009, the FASB issued Accounting Standards Update No. 2009-13, “Multiple-Deliverable Revenue Arrangements — a consensus of the FASB Emerging Issues Task Force” (“ASU 2009-13”). This ASU addresses how to separate deliverables under multiple-deliverable arrangements and how to measure and allocate arrangement consideration to one or more units of accounting. In addition, ASU 2009-13 expands the disclosures related to a company’s multiple-deliverable revenue arrangements. The ASU is effective prospectively for revenue arrangements entered into or materially modified in fiscal years beginning on or after June 15, 2010. The impact on the Company of adopting ASU 2009-13 will depend on the nature, terms and size of multiple-deliverable revenue arrangements entered into or materially modified after the effective date. The Company does not expect the adoption of ASU 2009-13 to have a material impact on the Company’s financial position or results of operations.
Fair value measurements – In February 2008, the FASB deferred the effective date of certain fair value measurement accounting principles (codified within ASC 820, Fair Value Measurements and Disclosures) for all nonfinancial assets and liabilities, except those that are recognized or disclosed in the financial statements at fair value at least annually, to fiscal years beginning after November 15, 2008. The accounting principles deferred address the measurement of fair value by companies when they are required to use a fair value measure for recognition or disclosure purposes under U.S. GAAP and, accordingly, do not require any new fair value measurements. Effective February 2, 2009, HD Supply adopted these fair value measurement accounting principles for all nonfinancial assets and liabilities that are measured at fair value on a non-recurring basis, such as goodwill and identifiable intangible assets. The adoption did not impact the Company’s financial position or results of operations.
In April 2009, the FASB issued a new accounting standard that requires disclosure of fair value for any financial instruments not currently reflected at fair value on the balance sheet for all interim periods (codified within ASC 825, Financial Instruments). This standard is effective for interim and annual periods ending after June 15, 2009. HD Supply adopted the new standard in the second quarter of fiscal 2009. See Notes to the Consolidated and Combined Financial Statements for disclosures required by this new pronouncement.
In April 2009, the FASB issued a new accounting standard that provides guidance in determining fair values when there is no active market or where the price inputs being used represent distressed sales (codified within ASC 820, Fair Value Measurements and Disclosures). Specifically, it reaffirms the need to use judgment to ascertain if a formerly active market has become inactive and in determining fair values when markets have become inactive. The new standard is effective for interim and annual periods ending after June 15, 2009. HD
65
Table of Contents
Index to Financial Statements
HD SUPPLY, INC.
MANAGEMENT’S DISCUSSION AND ANALYSIS OF FINANCIAL CONDITION AND RESULTS OF OPERATIONS
(Continued)
Supply adopted the new standard in the second quarter of fiscal 2009. The adoption did not have an impact on the consolidated financial statements and results of operations.
Business combinations – In December 2007, the FASB issued a new accounting standard for business combinations (codified within ASC 805, Business Combinations) which requires that the acquisition method of accounting be used in all business combinations and for an acquirer to be identified for each business combination. The standard defines the acquirer as the entity that obtains control of one or more businesses in the business combination and establishes the acquisition date as the date that the acquirer achieves control. It requires an acquirer to recognize the assets acquired, the liabilities assumed, and any noncontrolling interest in the acquiree at the acquisition date, measured at their fair values as of that date. The Company adopted the provisions of this new standard on February 2, 2009. The new standard is effective for business combinations for which the acquisition date is on or after the adoption date. The impact on the Company of adopting the new standard will depend on the nature, terms and size of the business combinations completed after the adoption date.
Noncontrolling interests – In December 2007, the FASB issued a new accounting standard which establishes accounting and reporting standards for the noncontrolling interest in a subsidiary and for the deconsolidation of a subsidiary (codified within ASC 810, Consolidation). It clarifies that a noncontrolling interest in a subsidiary is an ownership interest in the consolidated entity that should be reported as equity in the consolidated financial statements. The Company adopted the provisions of this new standard on February 2, 2009. The Company currently does not have a noncontrolling interest in a subsidiary; therefore, the adoption did not have an impact on the Company’s consolidated financial statements and results of operations.
Derivative instruments – In March 2008, the FASB issued a new accounting standard which expands disclosure requirements for derivatives (codified within ASC 815, Derivatives and Hedging) to provide an enhanced understanding of (1) how and why an entity uses derivative instruments, (2) how derivative instruments and related hedged items are accounted for, and (3) how derivative instruments affect an entity’s financial position, financial performance, and cash flows. The Company adopted the provisions this new standard on February 2, 2009. See Notes to the Consolidated and Combined Financial Statements for disclosures required by this new pronouncement.
Intangible assets – In April 2008, the FASB issued a new accounting standard which amends the factors that should be considered in developing renewal or extension assumptions used in determining the useful life of a recognized intangible asset (codified within ASC 275, Risks and Uncertainties, and ASC 350, Intangibles – Goodwill and Other). The Company adopted the provisions of this new standard on February 2, 2009. The adoption did not impact the Company’s consolidated financial statements and results of operations.
Subsequent events – In May 2009 and clarified in February 2010, the FASB issued a new accounting standard which establishes general standards of accounting for and disclosure of events or transactions occurring after the balance sheet date (codified within ASC 855, Subsequent Events). The Company adopted this new accounting standard as of June 30, 2009, which was the required effective date. The adoption did not impact the Company’s consolidated financial statements, results of operations, or disclosures.
Critical accounting policies
Our critical accounting policies include:
Revenue recognition
We recognize revenue when persuasive evidence of an agreement exists, delivery has occurred or services have been rendered, price to the buyer is fixed and determinable and collectability is reasonably assured. We ship products to customers predominantly by internal fleet and to a lesser extent by third party carriers. Revenues, net of sales tax and allowances for returns and discounts, are recognized from product sales when title to the products is passed to the customer, which generally occurs at the point of destination for products shipped by internal fleet and at the point of shipping for products shipped by third party carriers.
66
Table of Contents
Index to Financial Statements
HD SUPPLY, INC.
MANAGEMENT’S DISCUSSION AND ANALYSIS OF FINANCIAL CONDITION AND RESULTS OF OPERATIONS
(Continued)
Allowance for doubtful accounts
We evaluate the collectability of accounts receivable based on numerous factors, including past transaction history with customers, their credit worthiness and an assessment of our lien and bond rights. Initially, we estimate an allowance for doubtful accounts as a percentage of aged receivables. This estimate is periodically adjusted when we become aware of a specific customer’s inability to meet its financial obligations (e.g., bankruptcy filing) or as a result of changes in our historical collection patterns. While we have a large customer base that is geographically dispersed, a slowdown in the markets in which we operate may result in higher than expected uncollectible accounts, and therefore, the need to revise estimates for bad debts. To the extent historical credit experience is not indicative of future performance or other assumptions used by management do not prevail, the allowance for doubtful accounts could differ significantly, resulting in either higher or lower future provisions for doubtful accounts.
Inventories
Inventories are carried at the lower of cost or market. The cost of substantially all of our inventories is determined by the moving or weighted average cost method. We evaluate our inventory value at the end of each quarter to ensure that it is carried at the lower of cost or market. This evaluation includes an analysis of historical physical inventory results, a review of potential excess and obsolete inventories based on inventory aging and anticipated future demand. Periodically, each branch’s perpetual inventory records are adjusted to reflect any declines in net realizable value below inventory carrying cost. To the extent historical physical inventory results are not indicative of future results and if future events impact, either favorably or unfavorably, the saleability of our products or our relationship with certain key vendors, our inventory reserves could differ significantly, resulting in either higher or lower future inventory provisions.
Consideration received from vendors
At the beginning of each calendar year, we enter into agreements with many of our vendors providing for inventory purchase rebates (“vendor rebates”) upon achievement of specified volume purchasing levels. We accrue the receipt of vendor rebates as part of our cost of sales for products sold based on progress towards earning the vendor rebates, taking into consideration cumulative purchases of inventory to date and projected purchases through the end of the year. An estimate of unearned vendor rebates is included in the carrying value of inventory at each period end for vendor rebates to be received on products not yet sold. While we believe we will continue to receive consideration from vendors in fiscal 2010 and thereafter, there can be no assurance that vendors will continue to provide comparable amounts of vendor rebates in the future.
Impairment of long-lived assets
Long-lived assets, including property and equipment, are reviewed for possible impairment whenever events or circumstances indicate that the carrying amount of an asset may not be recoverable. To analyze recoverability, we project undiscounted future cash flows over the remaining life of the asset. If these projected cash flows are less than the carrying amount, an impairment loss is recognized based on the fair value of the asset less any costs of disposition. Our judgment regarding the existence of impairment indicators are based on market and operational performance. Future events could cause us to conclude that impairment indicators exist and that assets are impaired. Evaluating the impairment also requires us to estimate future operating results and cash flows that require judgment by management. If different estimates were used, the amount and timing of asset impairments could be affected.
Goodwill
Goodwill represents the excess of the purchase price paid over the fair value of the net assets acquired in connection with business acquisitions. Accounting Standards Codification (“ASC”) 350, Intangibles – Goodwill and Other, requires entities to periodically assess the carrying value of goodwill by reviewing the fair value of the net assets underlying all acquisition-related goodwill on a reporting unit basis, as defined by ASC 350. We assess the recoverability of goodwill in the third quarter of each fiscal year. We also use judgment in assessing whether we need to test goodwill more frequently for impairment than annually given factors such as unexpected adverse
67
Table of Contents
Index to Financial Statements
HD SUPPLY, INC.
MANAGEMENT’S DISCUSSION AND ANALYSIS OF FINANCIAL CONDITION AND RESULTS OF OPERATIONS
(Continued)
economic conditions, competition, product changes and other external events. If the carrying amount of a reporting unit that contains goodwill exceeds fair value, a possible impairment would be indicated.
We determine the fair value of a reporting unit using a discounted cash flow (“DCF”) analysis and a market comparable method, with each method being equally weighted in the calculation. This is a departure from our fiscal 2008 goodwill impairment test. In fiscal 2008, the Company relied entirely on the DCF analysis due to the extreme volatility in the financial markets during the second half of 2008. The market comparable method was calculated during that period as a validation that the fair value derived from the DCF analysis was comparable to its market peers.
Determining fair value requires the exercise of significant judgment, including judgment about appropriate discount rates, perpetual growth rates, the amount and timing of expected future cash flows, as well as relevant comparable company earnings multiples for the market comparable approach. The cash flows employed in the DCF analyses are based on the Company’s most recent five-year budget and, for years beyond the budget, the Company’s estimates, which are based on estimated exit multiples ranging from five to seven times the final budgeted year earnings before interest, taxes, depreciation and amortization. The discount rates used in the DCF analyses are intended to reflect the risks inherent in the future cash flows of the respective reporting units and range from 12.5% to 15.0%. For the market comparable approach, the Company evaluated comparable company public trading values, using multiples that ranged from five to nine times earnings before interest, taxes, depreciation and amortization. During fiscal 2009 and fiscal 2008, as a result of our goodwill impairment testing, we recorded goodwill impairment charges of $224 million and $1,053 million, respectively.
The Company’s discounted cash flow model is based on HD Supply’s expectation of future market conditions for each of the reporting units, as well as discount rates that would be used by market participants in an arms-length transaction. Future events could cause the Company to conclude that market conditions have declined or discount rates have increased to the extent that the Company’s goodwill could be further impaired. It is not possible at this time to determine if any such future impairment charge would result.
In order to evaluate the sensitivity of the fair value calculations on the goodwill impairment test, the Company applied a hypothetical 100 basis point increase in the risk adjusted discount rate of each reporting unit. Such an increase would have resulted in an additional impairment charge of $41 million during fiscal 2009. The Company also measured the impact of applying a hypothetical 1x decline to the exit multiples used for the years beyond the Company’s five-year budget. Such a decrease would have resulted in an additional impairment charge of $123 million during fiscal 2009 at the following reporting units: Waterworks, Utilities, White Cap, and Repair & Remodel.
Income Taxes
Income taxes are determined under the liability method as required by ASC 740, Income Taxes. Income tax expense or benefit is based on pre-tax financial accounting income. Deferred tax assets and liabilities are recognized for the expected tax consequences of temporary differences between the tax bases of assets and liabilities and their reported amounts. Deferred tax assets and liabilities are measured using enacted tax rates expected to apply to taxable income in the years in which those temporary differences are expected to be recovered or settled. This measurement is reduced, if necessary, by a valuation allowance based on the amount of tax benefits that, based on available evidence, are not more likely than not to be realized. An increase in the amount of future deferred tax assets or lower than expected future earnings could require us to establish a valuation allowance on our deferred taxes.
In addition, we have foreign and domestic net operating losses (“NOLs”) that expire at various dates beginning in 2012. At this time, we believe that, based on a number of factors, it is more likely than not that these losses will be utilized before they expire, and thus no valuation allowance has been established except on certain specific state NOLs. Lower than expected future earnings or certain ownership changes could impair or eliminate the value of the NOLs recorded.
Effective January 29, 2007, we adopted the provisions of FASB Interpretation No. 48 (“FIN 48,” now codified within ASC 740), which clarifies the accounting for uncertainty in income taxes. FIN 48 prescribes guidance related to the financial statement recognition and measurement of tax positions taken or expected to be taken in a
68
Table of Contents
Index to Financial Statements
HD SUPPLY, INC.
MANAGEMENT’S DISCUSSION AND ANALYSIS OF FINANCIAL CONDITION AND RESULTS OF OPERATIONS
(Continued)
tax return. The interpretation prescribes the minimum recognition threshold that a tax position is required to meet before being recognized in the financial statements. FIN 48 also provides guidance on derecognition, classification, interest and penalties, accounting in interim periods and disclosure. Initial recognition, derecognition and measurement is based on management’s judgment given the facts, circumstances and information available at the reporting date. If these judgments are not accurate then future income tax expense or benefit could be different.
Self-insurance
We have a high deductible insurance program for most losses related to general liability, product liability, environmental liability, automobile liability, workers’ compensation, and are self-insured for medical claims and certain legal claims. The expected ultimate cost for claims incurred as of the balance sheet date is not discounted and is recognized as a liability. Self-insurance losses for claims filed and claims incurred but not reported are accrued based upon estimates of the aggregate liability for uninsured claims using loss development factors and actuarial assumptions followed in the insurance industry and historical loss development experience.
To the extent the projected future development of the losses resulting from workers’ compensation, automobile, general and product liability claims incurred as of January 31, 2010 differs from the actual development of such losses in future periods, our insurance reserves could differ significantly, resulting in either higher or lower future insurance expense.
Management estimates
Management believes the assumptions and other considerations used to estimate amounts reflected in our combined financial statements are appropriate. However, if actual experience differs from the assumptions and other considerations used in estimating amounts reflected in our combined financial statements, the resulting changes could have a material adverse effect on our combined results of operations, and in certain situations, could have a material adverse effect on our financial condition.
ITEM 7A. QUANTITATIVE AND QUALITATIVE DISCLOSURES ABOUT MARKET RISK
The information required by this Item is included under “Item 7. Management’s Discussion and Analysis of Financial Condition and Results of Operations.”
69
Table of Contents
Index to Financial Statements
ITEM 8. FINANCIAL STATEMENTS AND SUPPLEMENTARY DATA
| Page | ||
| 71 | ||
| 73 | ||
| 73 | ||
| Consolidated balance sheets as of January 31, 2010 and February 1, 2009 (Successor Periods) |
74 | |
| 75 | ||
| 75 | ||
| 76 | ||
| 76 | ||
| 77 | ||
70
Table of Contents
Index to Financial Statements
Report of Independent Registered Public Accounting Firm
To The Board of Directors and Shareholders of HD Supply, Inc.:
In our opinion, the accompanying consolidated balance sheets and the related consolidated statements of operations, stockholders’ equity and comprehensive income (loss) and cash flows present fairly, in all material respects, the financial position of HD Supply, Inc. and its subsidiaries (“the Company”) at January 31, 2010 and February 1, 2009, and the results of their operations and their cash flows for the years then ended in conformity with accounting principles generally accepted in the United States of America. In addition, in our opinion, the financial statement schedule for the years ended January 31, 2010 and February 1, 2009 listed in the index appearing under Item 15(c) presents fairly, in all material respects, the information set forth therein when read in conjunction with the related consolidated financial statements. These financial statements and financial statement schedule are the responsibility of the Company’s management. Our responsibility is to express an opinion on these financial statements and financial statement schedule based on our audits. We conducted our audits of these statements in accordance with the standards of the Public Company Accounting Oversight Board (United States). Those standards require that we plan and perform the audit to obtain reasonable assurance about whether the financial statements are free of material misstatement. An audit includes examining, on a test basis, evidence supporting the amounts and disclosures in the financial statements, assessing the accounting principles used and significant estimates made by management, and evaluating the overall financial statement presentation. We believe that our audits provide a reasonable basis for our opinion.
We also have audited the adjustments to the financial statement disclosures of the period from August 30, 2007 to February 3, 2008 (Successor Company) and the period from January 29, 2007 to August 29, 2007 (Predecessor Company), which were applied to retrospectively reflect the change in the composition of reportable segments as discussed in Note 17. In our opinion, such adjustments are appropriate and have been properly applied. We were not engaged to audit, review, or apply any procedures to the financial statements of the period from August 30, 2007 to February 3, 2008 (Successor Company) and the period from January 29, 2007 to August 29, 2007 (Predecessor Company) other than with respect to the adjustments and, accordingly, we do not express an opinion or any other form of assurance on those financial statements taken as a whole.
/s/ PricewaterhouseCoopers LLP
Atlanta, Georgia
April 13, 2010
71
Table of Contents
Index to Financial Statements
Report of Independent Registered Public Accounting Firm
The Board of Directors and Stockholders
HD Supply, Inc.:
We have audited, before the effect of the adjustment to retrospectively apply the change in accounting related to the Creative Touch Interiors segment described in Note 17, the consolidated statements of operations of HD Supply Inc. and subsidiaries (Successor Company) and the related consolidated statements of stockholders’ equity and comprehensive income (loss), and cash flows for the period August 30, 2007 to February 3, 2008, and the combined statements of operations of HD Supply, Inc. and HD Supply Canada Inc. wholly owned subsidiaries of The Home Depot, Inc. (Predecessor Company) and the related combined statements of owner’s equity and cash flows for the period January 29, 2007 to August 29, 2007. The financial statements before the effects of the adjustment discussed in Note 17 are not presented herein. The consolidated financial statements are the responsibility of the Company’s management. Our responsibility is to express an opinion on these consolidated financial statements based on our audits.
We conducted our audits in accordance with the standards of the Public Company Accounting Oversight Board (United States). Those standards require that we plan and perform the audit to obtain reasonable assurance about whether the financial statements are free of material misstatement. An audit includes examining, on a test basis, evidence supporting the amounts and disclosures in the financial statements. An audit also includes assessing the accounting principles used and significant estimates made by management, as well as evaluating the overall financial statement presentation. We believe that our audits provide a reasonable basis for our opinion.
In our opinion, the financial statements, before the effect of the adjustment to retrospectively apply the change in accounting related to the Creative Touch Interiors segment described in Note 17, present fairly, in all material respects, the results of operations of HD Supply, Inc. and subsidiaries and the related cash flows for the period August 30, 2007 to February 3, 2008 and the results of operations of HD Supply, Inc. and HD Supply Canada Inc. wholly owned subsidiaries of The Home Depot, Inc. and the related cash flows for the period January 29, 2007 to August 29, 2007 in conformity with U.S. generally accepted accounting principles.
We were not engaged to audit, review, or apply any procedures to the adjustment to retrospectively apply the change in accounting described in Note 17 and, accordingly, we do not express an opinion or any other form of assurance about whether such adjustment was appropriate and has been properly applied. That adjustment was audited by a successor auditor.
/s/ KPMG LLP
May 9, 2008
Orlando, FL
Certified Public Accountants
72
Table of Contents
Index to Financial Statements
CONSOLIDATED AND COMBINED STATEMENTS OF OPERATIONS
Amounts in millions
| Successor | Predecessor | |||||||||
| Fiscal Year Ended January 31, 2010 |
Fiscal Year Ended February 1, 2009 |
Period from August 30, 2007 to February 3, 2008 |
Period from January 29, 2007 to August 29, 2007 | |||||||
| Net Sales |
$ 7,418 | $ 9,768 | $ 4,599 | $ 7,121 | ||||||
| Cost of sales |
5,422 | 7,134 | 3,372 | 5,220 | ||||||
| Gross Profit |
1,996 | 2,634 | 1,227 | 1,901 | ||||||
| Operating expenses: |
||||||||||
| Selling, general and administrative |
1,680 | 2,063 | 1,001 | 1,424 | ||||||
| Depreciation and amortization |
386 | 403 | 168 | 115 | ||||||
| Restructuring |
28 | 34 | – | – | ||||||
| Goodwill impairment |
224 | 1,053 | – | – | ||||||
| Total operating expenses |
2,318 | 3,553 | 1,169 | 1,539 | ||||||
| Operating Income (Loss) |
(322) | (919) | 58 | 362 | ||||||
| Interest expense |
602 | 644 | 289 | 221 | ||||||
| Interest (income) |
– | (2) | – | – | ||||||
| Other (income) expense, net |
(208) | 11 | – | – | ||||||
| Income (Loss) from Continuing Operations Before Provision (Benefit) for Income Taxes |
(716) | (1,572) | (231) | 141 | ||||||
| Provision (benefit) for income taxes |
(211) | (318) | (83) | 58 | ||||||
| Income (Loss) from Continuing Operations |
(505) | (1,254) | (148) | 83 | ||||||
| Loss from discontinued operations, net of tax |
(9) | (1) | (15) | (27) | ||||||
| Net Income (Loss) |
$ (514) | $ (1,255) | $ (163) | $ 56 | ||||||
The accompanying notes are an integral part of these financial statements.
73
Table of Contents
Index to Financial Statements
CONSOLIDATED BALANCE SHEETS
Amounts in millions, except share data
| Successor | ||||
| January 31, 2010 |
February 1, 2009 | |||
| ASSETS |
||||
| Current assets: |
||||
| Cash and cash equivalents |
$ 539 | $ 771 | ||
| Receivables, less allowance for doubtful accounts of $56 and $95 |
846 | 1,123 | ||
| Inventories |
1,018 | 1,218 | ||
| Deferred tax asset |
169 | 154 | ||
| Other current assets |
230 | 147 | ||
| Total current assets |
2,802 | 3,413 | ||
| Property and equipment, net |
453 | 545 | ||
| Goodwill |
3,149 | 3,368 | ||
| Intangible assets, net |
1,253 | 1,511 | ||
| Other assets |
188 | 251 | ||
| Total assets |
$7,845 | $ 9,088 | ||
| LIABILITIES AND STOCKHOLDERS’ EQUITY |
||||
| Current liabilities: |
||||
| Accounts payable |
$484 | $ 870 | ||
| Accrued compensation and benefits |
84 | 119 | ||
| Current installments of long-term debt |
10 | 10 | ||
| Other accrued expenses |
299 | 343 | ||
| Total current liabilities |
877 | 1,342 | ||
| Long-term debt, excluding current installments |
5,765 | 6,046 | ||
| Deferred tax liabilities |
203 | 194 | ||
| Other long-term liabilities |
312 | 331 | ||
| Total liabilities |
7,157 | 7,913 | ||
| Stockholders’ equity: |
||||
| Common stock, par value $0.01; authorized 1,000 shares; issued 1,000 shares at January 31, 2010 and February 1, 2009 |
– | – | ||
| Paid-in capital |
2,643 | 2,625 | ||
| Accumulated deficit |
(1,944) | (1,418) | ||
| Accumulated other comprehensive loss |
(11) | (32) | ||
| Total stockholders’ equity |
688 | 1,175 | ||
| Total liabilities and stockholders’ equity |
$ 7,845 | $ 9,088 | ||
The accompanying notes are an integral part of these financial statements.
74
Table of Contents
Index to Financial Statements
CONSOLIDATED AND COMBINED STATEMENTS OF STOCKHOLDERS’ AND
OWNER’S EQUITY AND COMPREHENSIVE INCOME (LOSS)
Amounts in millions
| PREDECESSOR | Period from January 29, 2007 to August 29, 2007 | |
| Owner’s equity balance at beginning of period |
$ 2,970 | |
| Net income |
56 | |
| Other comprehensive income (loss): |
||
| Foreign currency translation adjustment |
15 | |
| Total comprehensive income (loss) |
71 | |
| Net investment by THD |
877 | |
| Owner’s equity balance at end of period |
$ 3,918 | |
| SUCCESSOR
|
Common Stock |
Paid-in Capital |
Accumulated Deficit |
Accumulated Other Comprehensive Income (Loss) |
Total Equity | |||||
| Balance at August 30, 2007 |
$ – | $ – | $ – | $ – | $ – | |||||
| Equity contribution |
2,600 | 2,600 | ||||||||
| Net loss |
(163) | (163) | ||||||||
| Other comprehensive income (loss): |
||||||||||
| Unrealized losses on derivatives, net of tax of $4 |
(6) | (6) | ||||||||
| Foreign currency translation adjustment |
1 | 1 | ||||||||
| Total comprehensive income (loss) |
(168) | |||||||||
| Stock-based compensation |
1 | 1 | ||||||||
| Balance at February 3, 2008 |
$ – | $ 2,601 | $ (163) | $ (5) | $ 2,433 | |||||
| Equity contribution |
10 | 10 | ||||||||
| Net loss |
(1,255) | (1,255) | ||||||||
| Other comprehensive income (loss): |
||||||||||
| Unrealized gains on derivatives, net of tax of $(2) |
3 | 3 | ||||||||
| Foreign currency translation adjustment, net of tax of $2 |
(30) | (30) | ||||||||
| Total comprehensive income (loss) |
(1,282) | |||||||||
| Stock-based compensation |
14 | 14 | ||||||||
| Balance at February 1, 2009 |
$ – | $ 2,625 | $ (1,418) | $ (32) | $ 1,175 | |||||
| Net loss |
(514) | (514) | ||||||||
| Other comprehensive income (loss): |
||||||||||
| Unrealized gains on derivatives, net of tax of $(1) |
2 | 2 | ||||||||
| Foreign currency translation adjustment, net of tax of $1 |
19 | 19 | ||||||||
| Total comprehensive income (loss) |
(493) | |||||||||
| Stock-based compensation |
18 | 18 | ||||||||
| Change in fiscal year end of subsidiary |
(13) | (13) | ||||||||
| Other |
1 | 1 | ||||||||
| Balance at January 31, 2010 |
$ – | $ 2,643 | $ (1,944) | $ (11) | $ 688 | |||||
The accompanying notes are an integral part of these financial statements.
75
Table of Contents
Index to Financial Statements
CONSOLIDATED AND COMBINED STATEMENTS OF CASH FLOWS
Amounts in millions
| Successor | Predecessor | |||||||||||||
| Fiscal Year Ended January 31, 2010 |
Fiscal Year Ended February 1, 2009 |
Period from August 30, 2007 to February 3, 2008 |
Period from January 29, 2007 to August 29, 2007 | |||||||||||
| CASH FLOWS FROM OPERATING ACTIVITIES: |
||||||||||||||
| Net income (loss) |
$ | (514) | $ | (1,255) | $ | (163) | $ | 56 | ||||||
| Reconciliation of net income (loss) to net cash provided by operating activities: |
||||||||||||||
| Depreciation and amortization |
392 | 411 | 175 | 127 | ||||||||||
| Provision for uncollectibles |
23 | 61 | 31 | - | ||||||||||
| Non-cash interest expense |
239 | 247 | 98 | - | ||||||||||
| Non-cash charges from THD |
- | - | - | 431 | ||||||||||
| Stock-based compensation expense |
18 | 14 | 1 | 33 | ||||||||||
| Deferred income taxes |
(221) | (245) | (97) | (104) | ||||||||||
| Unrealized derivative (gain) loss |
(11) | 11 | - | - | ||||||||||
| Goodwill and other asset impairments |
256 | 1,059 | 3 | - | ||||||||||
| Gain on extinguishment of debt |
(200) | - | - | - | ||||||||||
| Other |
2 | 2 | (2) | (20) | ||||||||||
| Changes in assets and liabilities, net of the effects of acquisitions: |
||||||||||||||
| (Increase) decrease in receivables |
221 | 302 | 381 | (55) | ||||||||||
| (Increase) decrease in inventories |
186 | 212 | 139 | (180) | ||||||||||
| (Increase) decrease in other current assets |
147 | 2 | (15) | 187 | ||||||||||
| (Increase) decrease in other assets |
1 | 4 | (13) | – | ||||||||||
| Increase (decrease) in accounts payable and accrued liabilities |
(481) | (267) | (174) | (67) | ||||||||||
| Increase (decrease) in other long-term liabilities |
11 | (10) | - | - | ||||||||||
| Net cash provided by operating activities |
69 | 548 | 364 | 408 | ||||||||||
| CASH FLOWS FROM INVESTING ACTIVITIES: |
||||||||||||||
| Capital expenditures |
(58) | (77) | (75) | (176) | ||||||||||
| Refunds (payments) for businesses acquired, net of cash acquired |
6 | (3) | (8,183) | (29) | ||||||||||
| Proceeds from sales of property and equipment |
8 | 18 | 2 | 60 | ||||||||||
| Proceeds from sale of a business |
3 | 99 | - | - | ||||||||||
| Other |
- | - | 1 | 5 | ||||||||||
| Net cash provided by (used in) investing activities |
(41) | 37 | (8,255) | (140) | ||||||||||
| CASH FLOWS FROM FINANCING ACTIVITIES: |
||||||||||||||
| Equity contribution |
- | 10 | 2,275 | - | ||||||||||
| Proceeds from issuance of debt to fund the Transactions |
- | - | 6,041 | - | ||||||||||
| Repayments of long-term debt |
(72) | (11) | (3) | - | ||||||||||
| Borrowings on long-term revolver debt |
5 | 1,464 | 2,125 | - | ||||||||||
| Repayments on long-term revolver debt |
(196) | (1,378) | (2,366) | - | ||||||||||
| Debt issuance costs |
- | 1 | (95) | - | ||||||||||
| Proceeds from long-term borrowing with THD |
- | - | - | 24 | ||||||||||
| Net repayments to THD |
- | - | - | (299) | ||||||||||
| Bank overdrafts and other financing activities |
- | - | - | 6 | ||||||||||
| Net cash provided by (used in) financing activities |
(263) | 86 | 7,977 | (269) | ||||||||||
| Increase (decrease) in cash and cash equivalents |
(235) | 671 | 86 | (1) | ||||||||||
| Effect of exchange rates on cash and cash equivalents |
3 | (8) | - | 1 | ||||||||||
| Cash and cash equivalents at beginning of period |
771 | 108 | 22 | 22 | ||||||||||
| Cash and cash equivalents at end of period |
$ | 539 | $ | 771 | $ | 108 | $ | 22 | ||||||
The accompanying notes are an integral part of these financial statements.
76
Table of Contents
Index to Financial Statements
NOTES TO CONSOLIDATED AND COMBINED FINANCIAL STATEMENTS
NOTE 1 – NATURE OF BUSINESS AND SUMMARY OF SIGNIFICANT ACCOUNTING POLICIES
Basis of Presentation
On August 30, 2007, investment funds associated with Clayton, Dubilier & Rice, Inc., The Carlyle Group and Bain Capital Partners, LLC (collectively the “Equity Sponsors”) formed HDS Investment Holding, Inc. (“HDS Holding”) and entered into a stock purchase agreement with The Home Depot, Inc. (“Home Depot” or “THD”) pursuant to which Home Depot agreed to sell to HDS Holding or to a wholly owned subsidiary of HDS Holding certain intellectual properties and all the outstanding common stock of HD Supply, Inc. and the Canadian subsidiary CND Holdings, Inc. (collectively “HD Supply”). On August 30, 2007, through a series of transactions, HDS Holding’s direct wholly owned subsidiary, HDS Holding Corporation, acquired direct control of HD Supply through the merger of its wholly owned subsidiary, HDS Acquisition Corp., with and into HD Supply (the “Company”). Through these transactions (the “Transactions”), Home Depot was paid cash of $8.2 billion and 12.5% of HDS Holding’s common stock worth $325 million for certain intellectual properties and all of the outstanding common stock of HD Supply, Inc. and CND Holdings, Inc. including all dividends and interest payable associated with those shares.
The accompanying consolidated and combined financial statements are presented for two periods: Predecessor and Successor, which relate to the period preceding the Transactions and the period succeeding the Transactions, respectively. The Predecessor financial statements represent the combined operations of HD Supply, Inc. and CND Holdings, Inc. The Successor financial statements represent the consolidated operations of HD Supply, Inc. and its subsidiaries. The Company refers to the operations of HD Supply for both the Predecessor and Successor periods. Prior to the Transaction, HD Supply was a wholly-owned subsidiary of Home Depot.
The Transactions were accounted for under the purchase method of accounting in accordance with the business combination principles of accounting principles generally accepted in the United States of America (“U.S. GAAP”), specifically the guidance codified into Financial Accounting Standards Board (“FASB”) Accounting Standards Codification™ (“ASC”) 805, Business Combinations, which resulted in a new basis of accounting. Pursuant to that guidance, the 12.5% continuing ownership of Home Depot is reflected at fair value, together with the remainder of the purchase price for the Transactions related to new ownership, and such fair value is allocated to the tangible and intangible assets and liabilities based on estimates of fair value in accordance with U.S. GAAP. The Predecessor and Successor financial statements are not comparable as a result of applying a new basis of accounting.
The preparation of the Predecessor financial statements includes the use of “push down” accounting procedures wherein certain assets, liabilities and expenses historically recorded or incurred at the THD level, which related to or were incurred on behalf of HD Supply, have been identified and allocated or pushed down as appropriate to reflect the stand-alone financial results of HD Supply for the periods presented. Allocations were made primarily based on specific identification. Management believes the methodology applied in the allocation of these costs is reasonable. No debt has been allocated to HD Supply from THD. Interest expense included in the Predecessor financial statements reflects the terms of the intercompany debt agreements between THD and HD Supply. These terms may not be indicative of terms reached on a third-party basis. The Predecessor financial statements may not necessarily be indicative of the cost structure or results of operations that would have existed if HD Supply operated as a stand-alone, independent business.
The Company has revised the consolidated financial statements as of and for the fiscal year ending February 1, 2009 in accordance with U.S. Securities and Exchange Commission (“SEC”) Staff Accounting Bulletin No. 108, “Considering the Effects of Prior Year Misstatements when Quantifying Misstatements in Current Year Financial Statements” (“SAB 108”), to include an adjustment related to the fourth quarter 2008 goodwill impairment charge. See Note 6, Goodwill & Intangible Assets, for further details.
Certain amounts in prior-period financial statements have been reclassified to conform to the current period’s presentation.
77
Table of Contents
Index to Financial Statements
HD SUPPLY, INC.
NOTES TO CONSOLIDATED AND COMBINED FINANCIAL STATEMENTS
(Continued)
Nature of Business
HD Supply is one of the nation’s largest diversified wholesale distributors of construction, infrastructure, maintenance and repair & remodel related products. It distributes products to professional customers such as contractors, home builders, maintenance professionals, government entities and industrial businesses through approximately 800 branches located in 43 U.S. states and 9 Canadian provinces. HD Supply is managed primarily on a product line basis and reports results of operations in seven reportable segments. The seven reportable segments are Waterworks, Facilities Maintenance, White Cap, Utilities, Industrial Pipe, Valves and Fittings (“IPVF”), Plumbing, and Creative Touch Interiors (“CTI”). In addition to these seven reportable segments, the consolidated and combined financial statements include an “Other” category, which includes Electrical, Crown Bolt, Repair & Remodel, and International, Corporate, which includes enterprise-wide functional departments, and eliminations of intercompany balances and transactions.
Principles of Consolidation
The consolidated and combined financial statements present the results of operations, financial position and cash flows of HD Supply. All material intercompany balances and transactions are eliminated. Results of operations of companies acquired are included from their respective dates of acquisition. Prior to February 2, 2009, CTI’s results were reported using a December year-end and therefore were consolidated one month in arrears into the consolidated financial statements of HD Supply, Inc. Effective February 2, 2009, CTI’s results are being consolidated on a January fiscal year-end, eliminating the lag period. The effect of eliminating the lag period for CTI’s results of operations was recorded directly to beginning Accumulated Deficit in the Statement of Stockholders’ Equity as of February 2, 2009. Prior periods have not been retrospectively adjusted as management determined that it was impracticable to do so because, among other reasons, certain accounting estimates such as allowance for doubtful accounts and inventory valuation reserves have historically been analyzed and adjusted on a quarterly basis only.
Fiscal Year
HD Supply’s fiscal year is a 52- or 53-week period ending on the Sunday nearest to January 31. Fiscal years ended January 31, 2010 (“fiscal 2009”) and February 1, 2009 (“fiscal 2008”) both include 52 weeks. The Successor period from August 30, 2007 to February 3, 2008 includes 22 weeks and 4 days. The Predecessor period from January 29, 2007 to August 29, 2007 includes 30 weeks and 3 days. The period from August 30, 2007 to February 3, 2008 and the period from January 29, 2007 to August 29, 2007 are collectively referred to as “fiscal 2007.” The fiscal year ending January 30, 2011 (“fiscal 2010”) includes 52 weeks.
Estimates
Management has made a number of estimates and assumptions relating to the reporting of assets and liabilities, the disclosure of contingent assets and liabilities, and reported amounts of revenues and expenses in preparing these consolidated and combined financial statements in conformity with U.S. GAAP. Actual results could differ from these estimates.
Cash and Cash Equivalents
HD Supply considers all highly liquid investments with maturities of three months or less when purchased to be cash equivalents.
Allowance for Doubtful Accounts
Accounts receivable are evaluated for collectability based on numerous factors, including past transaction history with customers, their credit worthiness, and an assessment of lien and bond rights. An allowance for doubtful accounts is estimated as a percentage of aged receivables. This estimate is periodically adjusted when management becomes aware of a specific customer’s inability to meet its financial obligations (e.g., bankruptcy filing) or as a result of changes in historical collection patterns.
78
Table of Contents
Index to Financial Statements
HD SUPPLY, INC.
NOTES TO CONSOLIDATED AND COMBINED FINANCIAL STATEMENTS
(Continued)
Inventories
Inventories are carried at the lower of cost or market. The cost of substantially all inventories is determined by the moving or weighted average cost method. Inventory value is evaluated at each balance sheet date to ensure that it is carried at the lower of cost or market. This evaluation includes an analysis of historical physical inventory results, a review of excess and obsolete inventories based on inventory aging, and anticipated future demand. Periodically, perpetual inventory records are adjusted to reflect declines in net realizable value below inventory carrying cost.
Consideration Received From Vendors
At the beginning of each calendar year, HD Supply enters into agreements with many of its vendors providing for inventory purchase rebates (“vendor rebates”) upon achievement of specified volume purchasing levels. Vendor rebates are accrued as part of cost of sales for products sold based on progress towards earning the vendor rebates, taking into consideration cumulative purchases of inventory to date and projected purchases through the end of the year. An estimate of unearned vendor rebates is included in the carrying value of inventory at each period end for vendor rebates received on products not yet sold. At January 31, 2010 and February 1, 2009, vendor rebates due to HD Supply were $50 million and $72 million, respectively. These receivables are included in Receivables in the accompanying Consolidated Balance Sheets.
Property and Equipment
Property and equipment are recorded at cost and depreciated using the straight-line method based on the following estimated useful lives of the assets:
| Buildings and improvements |
5 – 45 years | |
| Transportation equipment |
5 – 7 years | |
| Furniture, fixtures and equipment |
2 – 10 years |
Capitalized Software Costs
HD Supply capitalizes certain software costs, which are being amortized on a straight-line basis over the estimated useful lives of the software, ranging from 3 to 6 years. At January 31, 2010 and February 1, 2009, capitalized software costs totaled $97 million and $70 million, respectively, net of accumulated amortization of $69 million and $35 million, respectively. Amortization of capitalized software costs totaled $30 million, $32 million, $12 million, and $13 million in fiscal 2009, fiscal 2008, in the period from August 30, 2007 to February 3, 2008, and in the period from January 29, 2007 to August 29, 2007, respectively.
Goodwill
Goodwill represents the excess of purchase price over fair value of net assets acquired. HD Supply does not amortize goodwill, but does assess the recoverability of goodwill in the third quarter of each fiscal year or whenever events or circumstances indicate that goodwill might be impaired by determining whether the fair value of each reporting unit supports its carrying value. For the fiscal 2009 annual impairment test, the fair values of HD Supply’s identified reporting units were estimated using a discounted cash flow (“DCF”) analysis and a market comparable method, with each method being equally weighted in the calculation. HD Supply recorded $224 million and $1,053 million in non-cash goodwill impairment charges during fiscal 2009 and fiscal 2008, respectively. See Note 6, Goodwill & Intangible Assets, for a complete description of the impairment charges. No impairment charges were recorded for the periods from August 30, 2007 to February 3, 2008 or January 29, 2007 to August 29, 2007.
Impairment of Long-Lived Assets
Long-lived assets, including property and equipment, are reviewed for possible impairment whenever events or circumstances indicate that the carrying amount of an asset may not be recoverable. To analyze recoverability, undiscounted future cash flows over the remaining life of the asset are projected. If these projected cash flows are less than the carrying amount, an impairment loss is recognized to the extent the fair value of the asset less any costs of disposition is less than the carrying amount of the asset. Judgments regarding the existence of
79
Table of Contents
Index to Financial Statements
HD SUPPLY, INC.
NOTES TO CONSOLIDATED AND COMBINED FINANCIAL STATEMENTS
(Continued)
impairment indicators are based on market and operational performance. Evaluating potential impairment also requires estimates of future operating results and cash flows.
Self-Insurance
HD Supply has a high deductible insurance program for most losses related to general liability, product liability, environmental liability, automobile liability, workers’ compensation, and is self-insured for medical claims and certain legal claims. The expected ultimate cost for claims incurred as of the balance sheet date is not discounted and is recognized as a liability. Self-insurance losses for claims filed and claims incurred but not reported are accrued based upon estimates of the aggregate liability for uninsured claims using loss development factors and actuarial assumptions followed in the insurance industry and historical loss development experience. At January 31, 2010 and February 1, 2009, reserves totaled $105 million and $107 million, respectively.
Fair Value of Financial Instruments
The carrying amounts of cash and cash equivalents, accounts receivable and accounts payable, accrued compensation and benefits and other current liabilities approximate fair value due to the short-term nature of these financial instruments. The Company’s long-term financial assets and liabilities are recorded at historical costs. See Note 9, Fair Value Measures, for information on the fair value of long-term financial instruments.
Revenue Recognition
HD Supply recognizes revenue when persuasive evidence of an agreement exists, delivery has occurred or services have been rendered, price to the buyer is fixed and determinable and collectability is reasonably assured.
HD Supply ships products to customers predominantly by internal fleet and to a lesser extent by third party carriers. Revenues, net of sales tax and allowances for returns and discounts, are recognized from product sales when title to the products is passed to the customer, which generally occurs at the point of destination for products shipped by internal fleet and at the point of shipping for products shipped by third party carriers. Revenues related to services are recognized in the period the services are performed and totaled $69 million, $86 million, $64 million, and $84 million, in fiscal 2009, in fiscal 2008, in the period from August 30, 2007 to February 3, 2008, and in the period from January 29, 2007 to August 29, 2007, respectively.
Shipping and Handling Fees and Costs
HD Supply includes shipping and handling fees billed to customers in Net sales. Shipping and handling costs associated with inbound freight are capitalized to inventories and relieved through Cost of sales as inventories are sold. Shipping and handling costs associated with outbound freight are included in Selling, general and administrative expenses and totaled $97 million, $125 million, $62 million, and $87 million in fiscal 2009, in fiscal 2008, in the period from August 30, 2007 to February 3, 2008, and in the period from January 29, 2007 to August 29, 2007, respectively.
Concentration of Credit Risk
The majority of HD Supply’s sales are credit sales which are made primarily to customers whose ability to pay is dependent, in part, upon the economic strength of the construction industry in the areas where they operate. Concentration of credit risk with respect to trade accounts receivable is limited by the large number of customers comprising HD Supply’s customer base. HD Supply performs ongoing credit evaluations of its customers.
Leases
Leases are reviewed for capital or operating classification at their inception under the guidance of ASC 840, Leases. The Company uses its incremental borrowing rate in the assessment of lease classification and assumes the initial lease term includes renewal options that are reasonably assured. HD Supply conducts operations primarily under operating leases. For leases classified as operating leases, the Company records rent expense on a straight-line basis, over the lease term beginning with the date the Company has access to the property which in some cases is prior to commencement of lease payments. Accordingly, the amount of rental expense recognized in excess of lease payments is recorded as a deferred rent liability and is amortized to rental expense over the remaining term of the lease. Capital leases currently in effect are not significant.
80
Table of Contents
Index to Financial Statements
HD SUPPLY, INC.
NOTES TO CONSOLIDATED AND COMBINED FINANCIAL STATEMENTS
(Continued)
Advertising
Advertising costs are charged to expense as incurred except for the costs of producing and distributing certain direct response sales catalogs, which are capitalized and charged to expense over the life of the related catalog. Advertising expenses were approximately $21 million, $28 million, $11 million, and $16 million in fiscal 2009, in fiscal 2008, in the period from August 30, 2007 to February 3, 2008, and in the period from January 29, 2007 to August 29, 2007, respectively. Capitalized advertising costs related to direct response advertising were not material.
Income Taxes
HD Supply provides for federal, state and foreign income taxes currently payable, as well as for those deferred due to temporary differences between reporting income and expenses for financial statement purposes versus tax purposes. Federal, state and foreign tax benefits are recorded as a reduction of income taxes. Deferred tax assets and liabilities are recognized for the future tax consequences attributable to temporary differences between the financial statement carrying amounts of existing assets and liabilities and their respective tax bases. Deferred tax assets and liabilities are measured using enacted income tax rates expected to apply to taxable income in the years in which those temporary differences are expected to be recovered or settled. The effect of a change in income tax rates is recognized as income or expense in the period that includes the enactment date.
HD Supply consists of corporations, limited liability companies and partnerships. For the Predecessor periods, these entities filed their own separate state and Canadian income tax returns but were included in THD’s consolidated U.S. federal income tax return. For these periods HD Supply’s tax expense (benefit) for federal, state and Canadian income taxes has been determined on a separate group basis. All income tax expense (benefit) of HD Supply is recorded in the accompanying Consolidated and Combined Statements of Operations with the offset recorded through HD Supply’s current tax accounts, deferred tax accounts, or stockholders’ equity account as appropriate. For the short-taxable year ended February 3, 2008 all federal, state and Canadian income taxes have been determined as a separate stand-alone group.
Comprehensive Income (Loss)
Comprehensive Income (Loss) includes Net income (loss) adjusted for certain revenues, expenses, gains and losses that are excluded from net income under U.S. GAAP. Adjustments to net income are for foreign currency translation adjustments and unrealized gains or losses on derivatives, to the extent they are accounted for as an effective hedge under ASC 815, Derivatives and Hedging.
Foreign Currency Translation
Assets and liabilities of foreign subsidiaries with a functional currency of Canadian dollars are translated into U.S. dollars at the current rate of exchange on the last day of the reporting period. Revenues and expenses are translated at a monthly average exchange rate and equity transactions are translated using either the actual exchange rate on the day of the transaction or a monthly average exchange rate.
Derivative Financial Instruments
The Company generally enters into derivative financial instruments for hedging purposes. In hedging the exposure to variable cash flows on forecasted transactions, deferral accounting is applied when the derivative reduces the risk of the underlying hedged item effectively as a result of high inverse correlation with the value of the underlying exposure. If a derivative instrument either initially fails or later ceases to meet the criteria for deferral accounting, any subsequent gains or losses are recognized currently in income. Cash flows resulting from derivative financial instruments are classified in the same category as the cash flows from the items being hedged.
Stock-Based Compensation
Effective December 4, 2007, HDS Holding established an Incentive Stock Plan (the “HDS Plan”) for associates of HD Supply, a wholly-owned subsidiary. The HDS Plan provides for the award of non-qualified stock options and deferred share units of the common stock of HDS Holding. The maximum number of shares of common stock that may be issued under the HDS Plan may not exceed 49.4 million, of which a maximum of 24.7 million shares may be issued in respect of options granted under the HDS Plan. HDS Holding will issue new shares of common
81
Table of Contents
Index to Financial Statements
HD SUPPLY, INC.
NOTES TO CONSOLIDATED AND COMBINED FINANCIAL STATEMENTS
(Continued)
stock to satisfy options exercised. The HDS Plan is accounted for under ASC 718, Compensation – Stock Compensation, which requires the recognition of share-based compensation costs in the financial statements.
Prior to the Transactions, associates of HD Supply participated in the Employee Stock Plans of THD. The plans provided that incentive, non-qualified stock options, stock appreciation rights, restricted shares, performance shares, performance units and deferred shares may be issued to selected associates, officers and directors of THD, including HD Supply. All outstanding THD options and restricted stock awards granted prior to January 1, 2007 vested upon the closing of the Transactions and vested options remained exercisable for a 90-day period thereafter. As a result of the accelerated vesting, the Company recognized a charge of $22 million in the period from January 29, 2007 to August 29, 2007. All outstanding THD options and restricted stock awards granted subsequent to January 1, 2007 were forfeited upon the closing of the Transactions. As a result, the Company recognized a credit of $5 million in the period from January 29, 2007 to August 29, 2007. The Employee Stock Plans of THD were accounted for under ASC 718, Compensation – Stock Compensation, which requires the recognition of share-based compensation costs in the financial statements, for all periods presented.
Recent Accounting Pronouncements
FASB codification – In June 2009, the FASB issued Statement of Financial Accounting Standard (“SFAS”) No. 168, “The FASB Accounting Standards Codification and the Hierarchy of Generally Accepted Accounting Principles, a replacement of FASB Statement No. 162” (“SFAS 168”). SFAS 168 establishes the FASB Accounting Standards Codification™ (“Codification” or “ASC”) as the single source of authoritative U.S. GAAP recognized by the FASB to be applied by nongovernmental entities. Rules and interpretive releases of the SEC under authority of federal securities laws are also sources of authoritative U.S. GAAP for SEC registrants. The Codification supersedes all existing non-SEC accounting and reporting standards. All other nongrandfathered, non-SEC accounting literature not included in the Codification will become nonauthoritative. U.S. GAAP is not intended to be changed as a result of the FASB’s Codification project, but it does change the way the guidance is organized and presented.
The Codification is effective for interim and annual periods ending after September 15, 2009. HD Supply adopted the Codification in the third quarter of fiscal 2009. As a result, references to accounting standards within these financial statements have been updated to reflect the Accounting Standards Codification references. The adoption did not impact the Company’s financial position or results of operations.
Multiple-deliverable revenue arrangements – In October 2009, the FASB issued Accounting Standards Update No. 2009-13, “Multiple-Deliverable Revenue Arrangements – a consensus of the FASB Emerging Issues Task Force” (“ASU 2009-13”). This ASU addresses how to separate deliverables under multiple-deliverable arrangements and how to measure and allocate arrangement consideration to one or more units of accounting. In addition, ASU 2009-13 expands the disclosures related to a company’s multiple-deliverable revenue arrangements. The ASU is effective prospectively for revenue arrangements entered into or materially modified in fiscal years beginning on or after June 15, 2010. The impact on the Company of adopting ASU 2009-13 will depend on the nature, terms and size of multiple-deliverable revenue arrangements entered into or materially modified after the effective date. The Company does not expect the adoption of ASU 2009-13 to have a material impact on the Company’s financial position or results of operations.
Fair value measurements – In February 2008, the FASB deferred the effective date of certain fair value measurement accounting principles (codified within ASC 820, Fair Value Measurements and Disclosures) for all nonfinancial assets and liabilities, except those that are recognized or disclosed in the financial statements at fair value at least annually, to fiscal years beginning after November 15, 2008. The accounting principles deferred address the measurement of fair value by companies when they are required to use a fair value measure for recognition or disclosure purposes under U.S. GAAP and, accordingly, do not require any new fair value measurements. Effective February 2, 2009, HD Supply adopted these fair value measurement accounting principles for all nonfinancial assets and liabilities that are measured at fair value on a non-recurring basis, such as goodwill and identifiable intangible assets. The adoption did not impact the Company’s financial position or results of operations.
In April 2009, the FASB issued a new accounting standard that requires disclosure of fair value for any financial instruments not currently reflected at fair value on the balance sheet for all interim periods (codified within ASC
82
Table of Contents
Index to Financial Statements
HD SUPPLY, INC.
NOTES TO CONSOLIDATED AND COMBINED FINANCIAL STATEMENTS
(Continued)
825, Financial Instruments). This standard is effective for interim and annual periods ending after June 15, 2009. HD Supply adopted the new standard in the second quarter of fiscal 2009. See Note 9, Fair Value Measurements, for the required disclosures.
In April 2009, the FASB issued a new accounting standard that provides guidance in determining fair values when there is no active market or where the price inputs being used represent distressed sales (codified within ASC 820, Fair Value Measurements and Disclosures). Specifically, it reaffirms the need to use judgment to ascertain if a formerly active market has become inactive and in determining fair values when markets have become inactive. The new standard is effective for interim and annual periods ending after June 15, 2009. HD Supply adopted the new standard in the second quarter of fiscal 2009. The adoption did not have an impact on the consolidated financial statements and results of operations.
In January 2010, the FASB issued ASU No. 2010-06, “Improving Disclosures about Fair Value Measurements” (“ASU 2010-06”) which will require new disclosures about recurring or nonrecurring fair-value measurements including significant transfers into and out of Level 1 and Level 2 fair value measurements and information on purchases, sales, issuances, and settlements on a gross basis in the reconciliation of Level 3 fair value measurements. ASU 2010-06 is effective for interim and fiscal periods beginning after December 15, 2009. The Company will incorporate the disclosure requirements of ASU No. 2010-06 in the first quarter of fiscal 2010.
Business combinations – In December 2007, the FASB issued a new accounting standard for business combinations (codified within ASC 805, Business Combinations) which requires that the acquisition method of accounting be used in all business combinations and for an acquirer to be identified for each business combination. The standard defines the acquirer as the entity that obtains control of one or more businesses in the business combination and establishes the acquisition date as the date that the acquirer achieves control. It requires an acquirer to recognize the assets acquired, the liabilities assumed, and any noncontrolling interest in the acquiree at the acquisition date, measured at their fair values as of that date. The Company adopted the provisions of this new standard on February 2, 2009. The new standard is effective for business combinations for which the acquisition date is on or after the adoption date. The impact on the Company of adopting the new standard will depend on the nature, terms and size of the business combinations completed after the adoption date.
Noncontrolling interests – In December 2007, the FASB issued a new accounting standard which establishes accounting and reporting standards for the noncontrolling interest in a subsidiary and for the deconsolidation of a subsidiary (codified within ASC 810, Consolidation). It clarifies that a noncontrolling interest in a subsidiary is an ownership interest in the consolidated entity that should be reported as equity in the consolidated financial statements. The Company adopted the provisions of this new standard on February 2, 2009. The Company currently does not have a noncontrolling interest in a subsidiary; therefore, the adoption did not have an impact on the Company’s consolidated financial statements and results of operations.
Derivative instruments – In March 2008, the FASB issued a new accounting standard which expands disclosure requirements for derivatives (codified within ASC 815, Derivatives and Hedging) to provide an enhanced understanding of (1) how and why an entity uses derivative instruments, (2) how derivative instruments and related hedged items are accounted for, and (3) how derivative instruments affect an entity’s financial position, financial performance, and cash flows. The Company adopted the provisions of this new standard on February 2, 2009. The required disclosures are included in Note 8, Derivatives, to the consolidated and combined financial statements.
Intangible assets – In April 2008, the FASB issued a new accounting standard which amends the factors that should be considered in developing renewal or extension assumptions used in determining the useful life of a recognized intangible asset (codified within ASC 275, Risks and Uncertainties, and ASC 350, Intangibles – Goodwill and Other). The Company adopted the provisions of this new standard on February 2, 2009. The adoption did not impact the Company’s consolidated financial statements and results of operations.
Subsequent events – In May 2009 and clarified in February 2010, the FASB issued a new accounting standard which establishes general standards of accounting for and disclosure of events or transactions occurring after the balance sheet date (codified within ASC 855, Subsequent Events). The Company adopted this new accounting
83
Table of Contents
Index to Financial Statements
HD SUPPLY, INC.
NOTES TO CONSOLIDATED AND COMBINED FINANCIAL STATEMENTS
(Continued)
standard as of June 30, 2009, which was the required effective date. The adoption did not impact the Company’s consolidated financial statements, results of operations, or disclosures.
NOTE 2 – ACQUISITION OF HD SUPPLY
As discussed in Note 1, the Transactions were completed on August 30, 2007 and were financed by a combination of borrowings under the Company’s Senior Secured Credit Facility, the issuance of 12.0% Senior Notes due 2014 and 13.5% Senior Subordinated Notes due 2015, the funding under the Company’s Asset Based Lending Credit Facility, and equity investment.
The Transactions were accounted for as a purchase in accordance with ASC 805, Business Combinations, which resulted in a new basis of accounting. Pursuant to that guidance, the 12.5% continuing ownership of Home Depot is reflected at fair value, together with the remainder of the purchase price for the Transactions related to new ownership, and such fair value is allocated to the tangible and intangible assets and liabilities based on estimates of fair value in accordance with purchase accounting principles under ASC 805. The excess purchase price over the fair value of the net assets acquired is recorded as goodwill.
The following table summarizes the estimated fair values of the assets acquired and liabilities assumed at the date of the Transactions (amounts in millions):
| Cash |
$ | 22 | |
| Receivables |
1,980 | ||
| Inventory |
1,621 | ||
| Property & equipment |
700 | ||
| Intangible assets |
1,892 | ||
| Goodwill |
4,427 | ||
| Other assets |
517 | ||
| Total assets acquired |
11,159 | ||
| Current liabilities |
1,876 | ||
| Other liabilities |
891 | ||
| Total liabilities assumed |
2,767 | ||
| Net assets acquired |
$ | 8,392 | |
During the fourth quarter of fiscal 2008, the Company finalized the working capital adjustment with THD and other amounts to be reimbursed by THD. During the first quarter of fiscal 2009, the Company received $22 million from Home Depot for these finalizations.
Unaudited pro forma operating results of operations for fiscal 2007, assuming all fiscal 2007 acquisitions had been completed as of the beginning of fiscal 2007, are as follows (amounts in millions):
| (unaudited) |
Fiscal 2007 | |||
| Revenue |
$ | 11,720 | ||
| Net loss |
$ | (246 | ) | |
NOTE 3 – DISCONTINUED OPERATIONS
On February 3, 2008, the Company closed on an agreement with ProBuild Holdings, selling all of its interests in the Lumber and Building Materials operations, which distributed lumber, trusses, siding, roofing, millwork, windows, doors, and related building materials to the construction industry in Georgia and Florida. Cash proceeds of $105 million, less $2.5 million remaining in escrow and $2 million of professional service fees, were received on February 4, 2008. In April 2009, the Company received the remaining $2.5 million cash proceeds from escrow. Based on the net book value of net assets sold and the net proceeds, no gain or loss on the sale was recorded.
As a condition of the agreement, HD Supply retained certain facilities that have been shut down. The Company is actively marketing the owned properties for sale. These facilities are recorded at fair value less costs to sell for
84
Table of Contents
Index to Financial Statements
HD SUPPLY, INC.
NOTES TO CONSOLIDATED AND COMBINED FINANCIAL STATEMENTS
(Continued)
a net value of $9 million as of January 31, 2010 and are presented within Other current assets in the Consolidated Balance Sheets. During fiscal 2009, due to continued deterioration in the commercial real estate markets, the Company recognized an $8 million pre-tax impairment charge for the decline in fair value of these facilities. In addition, the net present value of on-going lease liabilities and other occupancy costs, net of expected sublease income, have been accrued and are presented as Other accrued expenses and Other long-term liabilities in the Consolidated Balance Sheets. The Company regularly reviews the assumptions used to estimate the net present value of these lease liabilities. During fiscal 2009, as a result of continued deterioration in the commercial real estate markets, the Company recognized a $7 million pre-tax charge to increase these liabilities, primarily due to expected sublease income differing from the original assumptions.
Summary Financial Information
In accordance with U.S. GAAP (ASC 360, Property, Plant, and Equipment), the results of the Lumber and Building Materials segment are classified as discontinued operations. U.S. GAAP (ASC 205-20, Presentation of Financial Statements – Discontinued Operations) requires the presentation of discontinued operations to include revenues and expenses, net of tax, of the Lumber and Building Materials operations as one line item on the Consolidated and Combined Statements of Operations. Additional detail related to the results of operations of the discontinued operations follows (amounts in millions):
| Successor | Predecessor | |||||||||||||
| Fiscal Year Ended January 31, 2010 |
Fiscal Year Ended February 1, 2009 |
Period from August 30, 2007 to February 3, 2008 |
Period from January 29, 2007 to August 29, 2007 | |||||||||||
| Net sales |
$ | - | $ | - | $ | 179 | $ | 381 | ||||||
| Loss before provision (benefit) for income taxes |
(15) | (2) | (25) | (47) | ||||||||||
| Provision (benefit) for income taxes |
(6) | (1) | (10) | (20) | ||||||||||
| Loss from discontinued operations, net of tax |
$ | (9) | $ | (1) | $ | (15) | $ | (27) | ||||||
NOTE 4 – OTHER ACQUISITIONS
HD Supply enters into strategic acquisitions to expand into new markets, new platforms, and new geographies in an effort to better service existing customers and attract new ones. The following acquisitions completed by HD Supply were all accounted for under the purchase method of accounting and, accordingly, their results of operations have been consolidated or combined in HD Supply’s financial statements since the respective dates of acquisition.
On June 1, 2009, HD Supply acquired substantially all of the assets of ORCO Construction Supply, a former competitor of the White Cap business, out of bankruptcy, for approximately $16 million. The total estimated fair value of the net assets acquired, net of liabilities assumed, at the date of the acquisition was $18 million, resulting in a $2 million bargain purchase gain, which is included in Other (income) expense, net in the Consolidated Statements of Operations.
On March 31, 2008, HD Supply acquired D&M Fabricator, Inc., a fire protection fabrication shop located in Lodi, California. The purchase price for the acquisition was $3 million.
On February 26, 2007, HD Supply acquired GSI General Materials, a distributor of concrete accessories, forming systems and fabricated rebar. Additionally, on February 12, 2007, HD Supply acquired Ohio Water & Waste Supply Company, a distributor of waterworks products. The aggregate purchase price for these acquisitions was $25 million.
NOTE 5 – RELATED PARTIES
Transactions with THD
Sales and Purchases – HD Supply derived revenue from the sale of products to THD of $290 million, $301 million, $138 million, and $185 million, in fiscal 2009, in fiscal 2008, in the period from August 30, 2007 to February 3, 2008,
85
Table of Contents
Index to Financial Statements
HD SUPPLY, INC.
NOTES TO CONSOLIDATED AND COMBINED FINANCIAL STATEMENTS
(Continued)
and in the period from January 29, 2007 to August 29, 2007, respectively. The revenue was recorded at an amount that generally approximates fair value. The revenue recorded may not necessarily represent a price an unrelated third party would pay. Accounts receivable from these transactions with THD were $27 million and $33 million at January 31, 2010 and February 1, 2009, respectively, and are included within Receivables in the accompanying Consolidated Balance Sheets. In addition to sales, HD Supply purchased product from THD of approximately less than $1 million, $1 million, $1 million, and $8 million, in fiscal 2009, in fiscal 2008, in the period from August 30, 2007 to February 3, 2008, and in the period from January 29, 2007 to August 29, 2007, respectively. All purchases were recorded in Cost of sales when the inventory was sold.
Strategic Agreement – On the date of the Transactions, THD entered into a strategic purchase agreement with Crown Bolt, HD Supply’s distribution services line of business. This agreement provides a guaranteed revenue stream to Crown Bolt through January 31, 2015 by specifying minimum annual purchase requirements from THD. The minimum annual purchase requirements range from $257 million to $401 million.
Other Transactions – Prior to the Transactions, THD provided various support services to HD Supply including human resources, tax, accounting, information technology, legal, internal audit, operations and marketing. Cost for these services (the “THD Management Fee”) was charged to HD Supply based on specific identification of the services. HD Supply was charged a $4 million THD Management Fee in the period from January 29, 2007 to August 29, 2007, which is included within the Selling, general and administrative expenses in the accompanying Combined Statement of Operations. Subsequent to the Transactions, THD continued to provide certain administrative services, primarily related to Human Resources and Information Technology. HD Supply incurred costs of less than $1 million in fiscal 2008 and $1 million during the period August 30, 2007 through February 3, 2008 for such services.
Advances From and To THD – Prior to the Transactions, THD maintained loan and deposit agreements with HD Supply entities. These agreements included debt funding as well as cash sweep arrangements. The interest rates, when there were amounts due to THD, were the 90 day LIBOR rate plus a range from 100 to 250 basis points. When amounts were due from THD, the rate was the 90 day LIBOR rate less 12.5 basis points. Original maturity terms were ten years and maturity dates ranged from 2010 to 2016. These agreements included auto-renewal clauses that extended the maturity dates annually subsequent to the initial maturity date absent notice by THD. The net interest earned on the loan and deposit agreements is reflected as Interest expense in the accompanying Combined Statement of Operations. In conjunction with the Transactions, the loan and deposit agreements, along with any outstanding balances, were contributed by THD to HD Supply.
Prior to the Transactions, THD also charged other costs directly to HD Supply such as payroll and related benefits, workers’ compensation and general liability self insurance costs, stock compensation, and general and administrative costs. These costs are recorded within the Selling, general and administrative expenses in the accompanying Combined Statement of Operations and totaled $177 million in the period from January 29, 2007 to August 29, 2007. The Company did not reimburse THD for a portion of these costs or for a portion of net interest charges earned from the advances to THD. To the extent that these costs were not reimbursed, they are reflected in the accompanying Combined Statement of Cash Flow as non-cash charges from THD.
In conjunction with the Transactions, THD reimbursed HD Supply for approximately $55 million of compensation related to retention awards. This was accounted for as a reduction in the purchase price of the Company.
Subsequent to the Transactions, HD Supply employees continued to participate in the THD Health and Welfare benefit plans during a transition period that ended on December 31, 2007. During the period from August 30, 2007 to December 31, 2007 HD Supply was charged and paid approximately $41 million to THD for the Health and Welfare benefit plans.
During the Predecessor period, HD Supply sold a Repair and Remodel location to THD for $14 million, which represents the estimated fair value. The net book value of the location immediately prior to the sale was $9 million, resulting in a gain of $5 million in the Predecessor period from January 29, 2007 to August 29, 2007.
Owner’s Net Investment – Owner’s net investment during the Predecessor period contains THD’s capital contributions to HD Supply, cumulative net earnings of HD Supply, certain operational billings and receipts
86
Table of Contents
Index to Financial Statements
HD SUPPLY, INC.
NOTES TO CONSOLIDATED AND COMBINED FINANCIAL STATEMENTS
(Continued)
between HD Supply and THD, and tax allocations from THD. The average annual balance of owner’s net investment in the period from January 29, 2007 to August 29, 2007 was $3.4 billion.
Equity Sponsors
In conjunction with the closing of the Transactions, the Company entered into a management agreement whereby the Company will pay the Equity Sponsors a $5 million annual aggregate management fee (“Sponsor Management Fee”) and related expenses. During fiscal 2009, fiscal 2008 and the period from August 30, 2007 to February 3, 2008, the Company recorded $5 million, $6 million and $2 million, respectively, of the Sponsor Management Fee and related expenses, which are included in Selling, general and administrative expense in the Consolidated Statements of Operations.
Management of the Company has been informed that, as of January 31, 2010, affiliates of certain of the Equity Sponsors beneficially owned approximately $833 million aggregate principal amount of the Company’s 12.0% Senior Notes due 2014 and $549 million aggregate principal amount of the Company’s 13.5% Senior Subordinated Notes due 2015.
Transactions with Other Related Parties
HD Supply leases several buildings and properties from certain related parties, including an HD Supply executive officer. The leases generally provide that all expenses related to the properties are to be paid by HD Supply. Rents paid under these leases totaled $1 million in fiscal 2009 and less than $1 million in both fiscal 2008 and fiscal 2007.
HD Supply purchased product from affiliates of the Equity Sponsors for approximately $66 million, $59 million, and $8 million in fiscal 2009, in fiscal 2008, and in the period from August 30, 2007 to February 3, 2008, respectively. In addition, HD Supply sold product to affiliates of the Equity Sponsors for approximately $3 million in fiscal 2009 and $7 million in fiscal 2008. There were no sales to affiliates of the Equity Sponsors in the period from August 30, 2007 to February 3, 2008. Management believes these transactions were conducted at prices an unrelated third party would pay.
NOTE 6 – GOODWILL AND INTANGIBLE ASSETS
Intangible Assets
HD Supply’s intangible assets consisted of the following (amounts in millions):
| January 31, 2010 | February 1, 2009 | |||||||||||
| Gross Intangible |
Accumulated Amortization |
Net Intangible |
Gross Intangible |
Accumulated Amortization |
Net Intangible | |||||||
| Customer relationships |
$ 1,548 | $ (547) | $ 1,001 | $ 1,546 | $ (322) | $ 1,224 | ||||||
| Strategic purchase agreement |
166 | (54) | 112 | 166 | (32) | 134 | ||||||
| Trade names |
150 | (18) | 132 | 150 | (12) | 138 | ||||||
| Non-compete agreements |
12 | (12) | - | 12 | (9) | 3 | ||||||
| Other |
18 | (10) | 8 | 18 | (6) | 12 | ||||||
| Total |
$ 1,894 | $ (641) | $ 1,253 | $ 1,892 | $ (381) | $ 1,511 | ||||||
During fiscal 2009, the Company recorded $2 million of customer relationship intangibles as a result of business acquisitions, primarily the transaction to purchase substantially all of the assets of ORCO Construction Supply out of bankruptcy. These intangibles will be amortized over five to seven years.
On the date of the Transactions, THD entered into a strategic purchase agreement with Crown Bolt. This agreement provides a guaranteed revenue stream to Crown Bolt through January 31, 2015 by specifying minimum annual purchase requirements from THD.
87
Table of Contents
Index to Financial Statements
HD SUPPLY, INC.
NOTES TO CONSOLIDATED AND COMBINED FINANCIAL STATEMENTS
(Continued)
The intangible assets as of January 31, 2010 and February 1, 2009 are being amortized over the following estimated useful lives:
| Weighted Average Amortization Period | ||
| Customer relationships |
7.3 years | |
| Strategic purchase agreement |
7.4 years | |
| Trade names |
20.0 years | |
| Non-compete agreements |
1.8 years | |
| Other |
4.3 years |
Amortization expense related to intangible assets was $260 million, $268 million, $113 million, and $50 million in fiscal 2009, in fiscal 2008, in the period from August 30, 2007 to February 3, 2008, and in the period from January 29, 2007 to August 29, 2007, respectively. Estimated future amortization expense for intangible assets recorded as of January 31, 2010 is $261 million, $260 million, $253 million, $157 million and $127 million for fiscal years 2010 through fiscal 2014, respectively.
Goodwill
The carrying amount of goodwill by reportable segment and in total as of January 31, 2010 and February 1, 2009 is as follows (amounts in millions):
| January 31, 2010 | February 1, 2009 | |||||||||||
| Gross Goodwill |
Accumulated Impairments |
Net Goodwill |
Gross Goodwill |
Accumulated Impairments |
Net Goodwill | |||||||
| Waterworks |
$ 1,855 | $ (815) | $ 1,040 | $ 1,855 | $ (681) | $ 1,174 | ||||||
| Facilities Maintenance |
1,474 | - | 1,474 | 1,474 | - | 1,474 | ||||||
| White Cap |
183 | (74) | 109 | 183 | (74) | 109 | ||||||
| Utilities |
294 | (98) | 196 | 289 | (44) | 245 | ||||||
| IPVF |
82 | (82) | - | 82 | (76) | 6 | ||||||
| Plumbing |
111 | (111) | - | 111 | (111) | - | ||||||
| CTI |
67 | (67) | - | 67 | (67) | - | ||||||
| Other |
361 | (31) | 330 | 360 | - | 360 | ||||||
| Total goodwill |
$ 4,427 | $ (1,278) | $ 3,149 | $ 4,421 | $ (1,053) | $ 3,368 | ||||||
Goodwill represents the excess of purchase price over fair value of net assets acquired. HD Supply does not amortize goodwill, but does assess the recoverability of goodwill in the third quarter of each fiscal year or whenever events or circumstances indicate that goodwill might be impaired. Goodwill impairment testing is performed at the reporting unit level. There are ten reporting units within the Company to which goodwill was assigned. They are Waterworks, Facilities Maintenance, White Cap, Utilities, IPVF, Plumbing, CTI, Electrical, Crown Bolt, and Repair & Remodel.
Under U.S. GAAP (ASC 350, Intangibles – Goodwill and Other), goodwill impairment analysis is a two-step test. The first step, used to identify potential impairment, involves comparing each reporting unit’s fair value to its carrying value including goodwill. If the fair value of a reporting unit exceeds its carrying value, applicable goodwill is considered not to be impaired. If the carrying value exceeds fair value, there is an indication of impairment and the second step is performed to measure the amount of impairment.
The second step involves calculating an implied fair value of goodwill for each reporting unit for which the first step indicated impairment. The implied fair value of goodwill is determined in the same manner as the amount of goodwill recognized in a business combination, which is the excess of the fair value of the reporting unit, as determined in the first step, over the aggregate fair values of the individual assets, liabilities and identifiable intangibles as if the reporting unit was being acquired in a business combination. If the implied fair value of goodwill in the “pro forma” business combination accounting as described above, exceeds the goodwill assigned to the reporting unit, there is no impairment. If the goodwill assigned to a reporting unit exceeds the implied fair value of the goodwill, an impairment charge is recorded for the excess. An impairment loss recognized cannot
88
Table of Contents
Index to Financial Statements
HD SUPPLY, INC.
NOTES TO CONSOLIDATED AND COMBINED FINANCIAL STATEMENTS
(Continued)
exceed the amount of goodwill assigned to a reporting unit, and the loss establishes a new basis in the goodwill. Subsequent reversal of goodwill impairment losses is not permitted under U.S. GAAP.
HD Supply performed the annual goodwill impairment testing during the third quarter of fiscal 2009 for the eight reporting units with goodwill balances (goodwill balances at two reporting units were zero prior to the annual testing). The Company determines the fair value of a reporting unit using a discounted cash flow (“DCF”) analysis and a market comparable method, with each method being equally weighted in the calculation. This is a departure from the fiscal 2008 goodwill impairment test. In fiscal 2008, the Company relied entirely on the DCF analysis due to the extreme volatility in the financial markets during the second half of 2008. The market comparable method was calculated during that period as a validation that the fair value derived from the DCF analysis was comparable to its market peers.
Determining fair value requires the exercise of significant judgment, including judgment about appropriate discount rates, perpetual growth rates, the amount and timing of expected future cash flows, as well as relevant comparable company earnings multiples for the market comparable approach. The cash flows employed in the DCF analyses are based on the Company’s most recent five-year budget and, for years beyond the budget, the Company’s estimates, which are based on estimated exit multiples ranging from five to seven times the final budgeted year earnings before interest, taxes, depreciation and amortization. The discount rates used in the DCF analyses are intended to reflect the risks inherent in the future cash flows of the respective reporting units and range from 12.5% to 15.0%. For the market comparable approach, the Company evaluated comparable company public trading values, using multiples that ranged from five to nine times earnings before interest, taxes, depreciation and amortization.
There was an indication of impairment in four of the Company’s reporting units during the third quarter fiscal 2009 testing and accordingly, the second step was performed for these reporting units. Based on the results of the second step, HD Supply recorded a $224 million non-cash goodwill impairment charge in the third quarter of fiscal 2009 on four reporting units. The annual goodwill impairment testing during the third quarter of fiscal 2008 also resulted in a non-cash goodwill impairment charge of $48 million at two of the Company’s ten reporting units. As a result of significant declines in economic conditions during the fourth quarter of fiscal 2008, HD Supply performed an additional goodwill impairment testing for seven reporting units in which the economic declines were considered a triggering event. Total non-cash goodwill impairment charges for fiscal years ended January 31, 2010 and February 1, 2009 are as follows (amounts in millions):
| Fiscal Year Ended January 31, 2010 |
Fiscal Year Ended February 1, 2009 | |||||||||||
| Assigned Goodwill |
Impairment Charge |
Remaining Goodwill |
Assigned Goodwill |
Impairment Charge |
Remaining Goodwill | |||||||
| Waterworks |
$ 1,174 | $ (134) | $ 1,040 | $ 1,855 | $ (681) | $ 1,174 | ||||||
| Utilities |
250 | (54) | 196 | 289 | (44) | 245 | ||||||
| IPVF |
6 | (6) | - | 82 | (76) | 6 | ||||||
| Repair & Remodel |
125 | (30) | 95 | 125 | - | 125 | ||||||
| White Cap |
109 | - | 109 | 183 | (74) | 109 | ||||||
| Plumbing |
- | - | - | 111 | (111) | - | ||||||
| CTI |
- | - | - | 67 | (67) | - | ||||||
| All other reporting units |
1,709 | - | 1,709 | 1,709 | - | 1,709 | ||||||
| Total goodwill |
$ 3,373 | $ (224) | $ 3,149 | $ 4,421 | $ (1,053) | $ 3,368 | ||||||
The primary cause of impairment of the goodwill in the reporting units for both fiscal 2009 and fiscal 2008 was a reduction in expected future cash flows for these businesses as a result of the decline in the residential and commercial construction markets. For the reporting units where an impairment charge was recorded, the carrying value of goodwill approximates the implied fair value.
89
Table of Contents
Index to Financial Statements
HD SUPPLY, INC.
NOTES TO CONSOLIDATED AND COMBINED FINANCIAL STATEMENTS
(Continued)
The following table presents the changes in goodwill for the fiscal years ended January 31, 2010 and February 1, 2009 (amounts in millions).
| Fiscal 2009 | Fiscal 2008 | |||||
| Beginning Balance |
$ | 3,368 | $ | 4,304 | ||
| Purchase Accounting Adjustments |
- | 122 | ||||
| Acquisitions |
- | 3 | ||||
| Impairment |
(224) | (1,053) | ||||
| Translation adjustment |
5 | (8) | ||||
| Ending Balance |
$ | 3,149 | $ | 3,368 | ||
The Company’s discounted cash flow model is based on HD Supply’s expectation of future market conditions for each of the reporting units, as well as discount rates that would be used by market participants in an arms-length transaction. Future events could cause the Company to conclude that market conditions have declined or discount rates have increased to the extent that the Company’s goodwill could be further impaired. It is not possible at this time to determine if any such future impairment charge would result.
In order to evaluate the sensitivity of the fair value calculations on the goodwill impairment test, the Company applied a hypothetical 100 basis point increase in the risk adjusted discount rate of each reporting unit. Such an increase would result in an additional impairment charge of $41 million during third quarter fiscal 2009. The Company also measured the impact of applying a hypothetical 1x decline to the exit multiples used for the years beyond the Company’s five-year budget. Such a decrease would result in an additional impairment charge of $123 million during third quarter fiscal 2009.
During the quarter ended November 1, 2009, the Company noted that the goodwill impairment calculation for fourth quarter fiscal 2008 did not include an adjustment for the tax impact of hypothetically impairing the fair value of customer intangibles in step two of the impairment testing. The fourth quarter fiscal 2008 goodwill impairment testing resulted in an impairment charge of $875 million. Had the tax adjustment been included in the calculation, the goodwill impairment charge for the fourth quarter of fiscal 2008 would have been $1,005 million, a difference of $130 million. This revised impairment charge and the related tax benefit would have resulted in an additional $113 million net loss for the fiscal year ended February 1, 2009. The Company assessed the materiality of the effect of this misstatement on the fiscal year ended February 1, 2009 and both the first and second quarters of fiscal 2009 in accordance with the SEC’s SAB No. 99, “Materiality,” and SAB 108 and concluded that the impact was not material to any such periods. However, the Company also concluded that the effect of correcting the misstatement in fiscal 2009 would have been material to both the interim and annual financial statements for fiscal 2009. Pursuant to SAB 108, the Company may correct immaterial prior year misstatements by revising prior year financial statements the next time they are presented. In accordance with SAB 108, the Company corrected its fiscal 2008 financial statements herein and will correct its first and second quarter fiscal 2009 financial statements the next time those financial statements are issued. The Company’s financial statements as of and for the year ended February 1, 2009 included herein have been revised consistent with SAB 108 to reflect the impact of the correction described above.
The following tables summarize the impact of the correction on the Company’s financial statements for fiscal 2008 as well as for the first and second quarter fiscal 2009 Consolidated Balance Sheets (amounts in millions). The correction has no impact on the first or second quarter of fiscal 2009 Consolidated Statements of Operations.
| As of February 1, 2009 | |||||||||
| As Reported | Adjustment | As Revised | |||||||
| Goodwill |
$ | 3,498 | $ | (130) | $ | 3,368 | |||
| Deferred tax liabilities |
211 | (17) | 194 | ||||||
| Accumulated deficit |
(1,305) | (113) | (1,418) | ||||||
| Total stockholders’ equity |
1,288 | (113) | 1,175 | ||||||
90
Table of Contents
Index to Financial Statements
HD SUPPLY, INC.
NOTES TO CONSOLIDATED AND COMBINED FINANCIAL STATEMENTS
(Continued)
| Fiscal year ended February 1, 2009 | ||||||
| As Reported | Adjustment | As Revised | ||||
| Net Sales |
$ 9,768 | $ – | $ 9,768 | |||
| Cost of sales |
7,134 | – | 7,134 | |||
| Gross Profit |
2,634 | – | 2,634 | |||
| Operating expenses: |
||||||
| Selling, general and administrative |
2,063 | – | 2,063 | |||
| Depreciation and amortization |
403 | – | 403 | |||
| Restructuring |
34 | – | 34 | |||
| Goodwill impairment |
923 | 130 | 1,053 | |||
| Total operating expenses |
3,423 | 130 | 3,553 | |||
| Operating Income (Loss) |
(789) | (130) | (919) | |||
| Interest expense |
644 | – | 644 | |||
| Interest (income) |
(2) | – | (2) | |||
| Other (income) expense, net |
11 | – | 11 | |||
| Income (Loss) from Continuing Operations Before Provision (Benefit) for Income Taxes |
(1,442) | (130) | (1,572) | |||
| Provision (benefit) for income taxes |
(301) | (17) | (318) | |||
| Income (Loss) from Continuing Operations |
(1,141) | (113) | (1,254) | |||
| Loss from discontinued operations, net of tax benefit |
(1) | – | (1) | |||
| Net Income (Loss) |
$ (1,142) | $ (113) | $ (1,255) | |||
| As of May 3, 2009 (Unaudited) | As of August 2, 2009 (Unaudited) | |||||||||||
| As Reported |
Adjustment | As Revised |
As Reported |
Adjustment | As Revised | |||||||
| Goodwill |
$ 3,499 | $ (130) | $ 3,369 | $ 3,503 | $ (130) | $ 3,373 | ||||||
| Deferred tax liabilities |
321 | (17) | 304 | 289 | (17) | 272 | ||||||
| Accumulated deficit |
(1,308) | (113) | (1,421) | (1,397) | (113) | (1,510) | ||||||
| Total stockholders’ equity |
1,294 | (113) | 1,181 | 1,224 | (113) | 1,111 | ||||||
NOTE 7 – DEBT
The Company’s long-term debt as of January 31, 2010 and February 1, 2009 consisted of the following (amounts in millions):
| January 31, 2010 |
February 1, 2009 | |||
| Term Loan due August 30, 2012 |
$ 978 | $ 987 | ||
| Revolving Credit Facility due August 30, 2013 |
300 | 300 | ||
| ABL Credit Facility due August 30, 2012 |
596 | 786 | ||
| 12.0% Senior Notes due September 1, 2014 |
2,500 | 2,500 | ||
| 13.5% Senior Subordinated Notes due September 1, 2015 |
1,401 | 1,482 | ||
| Capital lease obligations, payable in various installments |
– | 1 | ||
| Total long-term debt |
5,775 | 6,056 | ||
| Less current installments |
(10) | (10) | ||
| Long-term debt, excluding current installments |
$ 5,765 | $ 6,046 | ||
During the first quarter of fiscal 2009, the Company repurchased $252 million principal amount, plus accrued interest of $15 million, of the 13.5% Senior Subordinated Notes due 2015 for $62 million. As a result, the Company recognized a $200 million pre-tax gain for the extinguishment of this portion of the 13.5% Senior Subordinated Notes, net of the write-off of unamortized deferred debt issuance costs. The pre-tax gain is reflected in Other (income) expense, net in the Consolidated Statement of Operations.
91
Table of Contents
Index to Financial Statements
HD SUPPLY, INC.
NOTES TO CONSOLIDATED AND COMBINED FINANCIAL STATEMENTS
(Continued)
Senior Secured Credit Facility
On August 30, 2007, the Company entered into a senior secured credit facility (the “Senior Secured Credit Facility”) comprised of a $1 billion term loan (the “Term Loan”) and a $300 million revolving credit facility (the “Revolving Credit Facility”). The Term Loan has required quarterly principal payments of $2.5 million beginning December 31, 2007 with the balance due August 30, 2012. Additionally, beginning in fiscal 2009, the Company is required to pay down the Term Loan in an amount equal to 50% of Excess Cash Flow from the preceding fiscal year, as defined in the Term Loan agreement, such percentage is reduced to 0% depending on the attainment of certain leverage ratio targets. Under the Excess Cash Flow provisions of the Senior Secured Credit Facility, the Company is not required to repay a portion of the Term Loan during fiscal 2010 and was not required to repay a portion of the Term Loan during fiscal 2009.
The Term Loan is guaranteed by Home Depot and bears interest at Prime plus 0.25% or LIBOR plus 1.25% at the Company’s election. At January 31, 2010 and February 1, 2009, the Term Loan interest rate was 1.48% and 1.72%, respectively. Interest on the Term Loan is due at the end of each calendar quarter with respect to Prime rate draws or at the maturity of each LIBOR draw (unless said draw is for a six-, nine-, or twelve-month period, then interest shall be paid quarterly). The guarantee by Home Depot was valued at $106 million and is being amortized to interest expense over the five-year life of the Term Loan on a straight-line basis which approximates the effective interest method. During fiscal 2009, fiscal 2008, and the period from August 30, 2007 to February 3, 2008, the Company recorded amortization of the guarantee of $21 million, $21 million and $9 million, respectively. The Senior Secured Credit Facility is further collateralized by all of the capital stock of HD Supply, Inc. and its subsidiary guarantors and by 65% of the capital stock of its foreign subsidiaries as well as by other tangible and intangible assets owned by the Company subject to the priority of liens described in the guarantee and collateral agreement dated as of August 30, 2007. The Senior Secured Credit Facility contains various restrictive covenants including limitations on additional indebtedness and dividend payments and stipulations regarding the use of proceeds from asset dispositions. The Company is in compliance with all such covenants. The Senior Secured Credit Facility is subject to an acceleration clause under an Event of Default, as defined in the Senior Secured Credit Facility agreement. Management believes the likelihood of such acceleration to be remote.
The Revolving Credit Facility is due August 30, 2013 and bears interest at Prime plus 3.0% or LIBOR plus 4.0% at the Company’s election. The Revolving Credit Facility also has a 0.5% unused commitment fee and a Letter of Credit fee of 4.0% per annum. The Company had an outstanding balance of $300 million as of both January 31, 2010 and February 1, 2009, at an interest rate of 4.23% and 4.39%, respectively. As of January 31, 2010 and February 1, 2009, there were no outstanding Letters of Credit under the Revolving Credit Facility. Interest on the Revolving Credit Facility is due at the end of each calendar quarter with respect to Prime rate draws or at the maturity of each LIBOR draw (unless said draw is for a six-, nine-, or twelve-month period, then interest shall be paid quarterly). The Senior Secured Credit Facility can be repaid at any time without penalty or premium.
Asset Based Lending Credit Agreement
On August 30, 2007, the Company entered into a $2.1 billion Asset Based Lending Credit Agreement (the “ABL Credit Facility”) subject to borrowing base limitations. The ABL Credit Facility matures on August 30, 2012 and bears interest at Prime plus 0.5% or LIBOR plus 1.5% per annum at the Company’s election. At January 31, 2010 and February 1, 2009, the ABL Credit Facility interest rate was 2.062% and 2.039%, respectively. The ABL Credit Facility also contains an unused commitment fee of 0.25%. As of January 31, 2010 and February 1, 2009, the ABL Credit Facility had an outstanding balance of $596 million and $786 million, respectively. As of January 31, 2010, the Company has available borrowings under the ABL Credit Facility of $359 million, after giving effect to the borrowing base limitations. The Company can use up to $400 million of its available borrowing under the ABL Credit Facility for Letters of Credit which are charged a fee of 1.5% per annum. As of January 31, 2010 and February 1, 2009, there were $65 million and $60 million, respectively, of Letters of Credit outstanding under the ABL Credit Facility. The ABL Credit Facility can be repaid at any time without penalty or premium. The ABL Credit Facility contains various restrictive covenants including a limitation on the amount of dividends to be paid. In addition, if the Company’s availability under the ABL Credit Facility falls below $210 million (a “Liquidity Event”), the Company will be required to maintain a Fixed Charge Coverage Ratio of at least 1.0:1.0. The Company is in compliance with all such covenants. The ABL Credit Facility is collateralized by all of the
92
Table of Contents
Index to Financial Statements
HD SUPPLY, INC.
NOTES TO CONSOLIDATED AND COMBINED FINANCIAL STATEMENTS
(Continued)
capital stock of HD Supply, Inc. and its subsidiary guarantors and by 65% of the capital stock of its foreign subsidiaries as well as by other tangible and intangible assets owned by the Company subject to the priority of liens described in the guarantee and collateral agreement dated as of August 30, 2007. The ABL Credit Facility is subject to an acceleration clause in a Liquidity Event or an Event of Default, as defined in the ABL Credit Facility agreement. Under such acceleration, the administrative agent can direct payments from the Company’s depository accounts to directly pay down the outstanding balance under the ABL Credit Facility. Management believes the likelihood of such acceleration to be remote.
Lehman Brothers
On September 15, 2008, the parent company of Lehman Brothers, Lehman Brothers Holdings Inc., filed a petition under Chapter 11 of the U.S. Bankruptcy Code with the United States Bankruptcy Court for the Southern District of New York. Lehman Brothers is committed to fund $100 million of the Company’s $300 million available Revolving Credit Facility and up to $95 million of the Company’s $2.1 billion ABL Credit Facility. During September 2008, the Company drew down the entire $300 million Revolving Credit Facility and invested the proceeds in U.S. Treasury securities. Lehman Brothers funded their $100 million commitment of the Revolving Credit Facility but has failed to fund a portion of their ABL Credit Facility commitment. As of January 31, 2010, outstanding borrowings under the ABL Credit Facility from Lehman Brothers are approximately $10 million. In addition, the Administrative Agent of the ABL Credit Facility holds $15 million in escrow funds, which are available to honor Lehman’s pro rata portion of any ABL Credit Facility draw. The combined available unfunded commitment from Lehman Brothers as of January 31, 2010 (prior to the ABL Credit Facility borrowing base limitations) was approximately $70 million.
12.0% Senior Notes
On August 30, 2007, the Company issued $2.5 billion of Senior Notes bearing interest at a rate of 12.0% (the “12.0% Senior Notes”). Interest payments are due each March and September 1st through maturity. The 12.0% Senior Notes mature on September 1, 2014 and can be redeemed by the Company as follows:
| Redemption Period |
Redemption Price | |
| Sept. 1, 2011 – August 31, 2012 | 106% plus accrued interest | |
| Sept. 1, 2012 – August 31, 2013 | 103% plus accrued interest | |
| Sept. 1, 2013 – Thereafter | 100% plus accrued interest |
The Company may also redeem all or a portion of the 12.0% Senior Notes under certain conditions and for the price as described in the agreement prior to September 1, 2011. The 12.0% Senior Notes contain various restrictive covenants including limitations on additional indebtedness and dividend payments and stipulations regarding the use of proceeds from asset dispositions. The Company is in compliance with all such covenants.
13.5% Senior Subordinated Notes
On August 30, 2007, the Company issued $1.3 billion of Senior Subordinated PIK Notes bearing interest at a rate of 13.5% (the “13.5% Senior Subordinated Notes”). Interest payments are due each March and September 1st through maturity except that the first eight payment periods through September 2011 shall be paid in kind (“PIK”) and therefore increase the balance of the outstanding indebtedness rather than be paid in cash. During fiscal 2009, the Company repurchased $252 million principal amount, plus accrued interest of $15 million, of the 13.5% Senior Subordinated Notes. As a result of PIK interest capitalizations and the extinguishment of a portion of the principal, as of January 31, 2010, the outstanding principal balance of the 13.5% Senior Subordinated Notes was $1.4 billion. The 13.5% Senior Subordinated Notes mature on September 1, 2015 and can be redeemed by the Company as follows:
| Redemption Period |
Redemption Price | |
| Sept. 1, 2011 – August 31, 2012 |
106.75% plus accrued interest | |
| Sept. 1, 2012 – August 31, 2013 |
103.375% plus accrued interest | |
| Sept. 1, 2013 – Thereafter |
100% plus accrued interest |
93
Table of Contents
Index to Financial Statements
HD SUPPLY, INC.
NOTES TO CONSOLIDATED AND COMBINED FINANCIAL STATEMENTS
(Continued)
The Company may also redeem all or a portion of the 13.5% Senior Subordinated Notes under certain conditions and for the price as described in the agreement prior to September 1, 2011. The 13.5% Senior Subordinated Notes contain various restrictive covenants including limitations on additional indebtedness and dividend payments and stipulations regarding the use of proceeds from asset dispositions. The Company is in compliance with all such covenants.
On July 27, 2009, HD Supply, Inc. filed a registration statement on Form S-4/A with the U.S. Securities and Exchange Commission in accordance with the registration rights agreements relating to the 12.0% Senior Notes and 13.5% Senior Subordinated Notes. On July 28, 2009, the registration statement was declared effective by the SEC and the offer to exchange outstanding 12.0% Senior Notes with registered 12.0% Senior Notes and outstanding 13.5% Senior Subordinated Notes with registered 13.5% Senior Subordinated Notes was executed. The exchange offer closed on August 25, 2009 with all of the notes held by eligible participants in the exchange offer tendered.
Debt Maturities
Maturities of long-term debt outstanding, in principal amounts, at January 31, 2010 are summarized below (amounts in millions):
| Fiscal Year |
Maturities | |||||||
| 2010 |
$ 10 | |||||||
| 2011 |
10 | |||||||
| 2012 |
1,554 | |||||||
| 2013 |
300 | |||||||
| 2014 |
2,500 | |||||||
| Thereafter |
1,401 | |||||||
| Total |
$ 5,775 | |||||||
For information about the Company’s credit agreement amendments entered into subsequent to fiscal 2009, see Note 20, Subsequent Events.
NOTE 8 – DERIVATIVE INSTRUMENTS
The Company maintains interest rate swap agreements to exchange fixed and variable rate interest payment obligations without the exchange of the underlying principal amounts. At execution, the swaps were designated as hedging the exposure to variable cash flows of a forecasted transaction, whereby the Company pays fixed interest and receives variable interest, effectively converting $400 million of floating-rate debt to fixed rate debt. The swaps outstanding as of January 31, 2010, having a combined $200 million notional value, mature in January 2011. The following tables summarize the weighted average rates and notional amounts of these agreements (dollars in millions).
| Fiscal Year Ended | ||||
| January 31, 2010 | February 1, 2009 | |||
| Weighted average notional value outstanding |
$ 400 | $ 400 | ||
| Weighted average fixed rate paid |
3.8% | 3.8% | ||
| Weighted average floating rate received |
0.3% | 2.4% | ||
| As of | ||||
| January 31, 2010 |
February 1, 2009 | |||
| Weighted average notional value outstanding |
$ 200 | $ 400 | ||
| Weighted average fixed pay rate |
3.9% | 3.8% | ||
| Weighted average floating receive rate |
0.2% | 0.4% | ||
A subsidiary of Lehman Brothers Holdings Inc. is the counterparty to these swap agreements. During September 2008, the expected and ultimate filing of bankruptcy by Lehman Brothers caused HD Supply to review the counterparty risk associated with these interest rate swaps. As a result of the review, the Company concluded on September 12, 2008 (the “date of de-designation”), that the likelihood of the obligor not defaulting was no longer
94
Table of Contents
Index to Financial Statements
HD SUPPLY, INC.
NOTES TO CONSOLIDATED AND COMBINED FINANCIAL STATEMENTS
(Continued)
probable. Therefore, on September 12, 2008, HD Supply removed the designation of the swaps as cash flow hedges and discontinued hedge accounting.
On the date of de-designation, the aggregate fair value of the swaps was a liability of $6 million. In accordance with the derivatives and hedging principles of U.S. GAAP (ASC 815, Derivatives and Hedging), the net loss was retained in accumulated other comprehensive income (loss) (“OCI”) and is being reclassified into earnings in the same periods in which the original hedged forecasted transactions affect earnings. Changes in the fair value of the swaps following the date of de-designation are recognized currently in earnings.
As of January 31, 2010 and February 1, 2009, the aggregate fair value of the swaps was a liability of $7 million and $17 million, respectively. The Company expects to reclassify $1 million in unrealized losses from OCI into Interest expense during the next twelve months.
The following tables summarize the location and amounts of the fair values and gains or losses related to derivatives included in HD Supply’s financial statements as of January 31, 2010 and February 1, 2009 and for fiscal 2009, fiscal 2008, and the period from August 30, 2007 to February 3, 2008 (amounts in millions):
| As of | ||||||||
| Interest rate swaps | Location of fair value in balance sheet |
January 31, 2010 |
February 1, 2009 |
|||||
| Economic hedges |
Other accrued expenses | $ 7 | $ 12 | |||||
| Other non-current liabilities | – | 5 | ||||||
| Interest rate swaps |
Location of gain (loss) in |
Fiscal 2009 | Fiscal 2008 | Period from August 30, 2007 to February 3, 2008 | ||||
| Cash flow hedges |
||||||||
| Effective portion recorded in OCI |
Other comprehensive income (loss) |
$ – | $ 3 | $ (10) | ||||
| Settlements |
Interest (expense) |
– | (3) | – | ||||
| Economic hedges |
||||||||
| Changes in fair value |
Other income (expense), net |
11 | (11) | – | ||||
| Amortization of net loss remaining in OCI at de-designation |
Interest (expense) |
(3) | (1) | – | ||||
| Settlements |
Interest (expense) |
(14) | (3) | – | ||||
On June 16, 2009, Lehman assigned the counterparty position on the two interest rate swaps maturing in January 2011 to Wells Fargo Foothill, LLC.
NOTE 9 – FAIR VALUE MEASUREMENTS
The fair value measurements and disclosure principles of U.S. GAAP (ASC 820, Fair Value Measurements and Disclosures) define fair value, establish a framework for measuring fair value and provide disclosure requirements about fair value measurements. These principles define a three-tier fair value hierarchy, which prioritizes the inputs used in measuring fair value as follows:
| Level 1 | – | Quoted prices (unadjusted) in active markets for identical assets or liabilities; | ||||
| Level 2 | – | Quoted prices for similar assets or liabilities in active markets, quoted prices for identical or similar assets or liabilities in markets that are not active, and inputs (other than quoted prices) that are observable for the asset or liability, either directly or indirectly; | ||||
| Level 3 | – | Unobservable inputs in which little or no market activity exists. | ||||
95
Table of Contents
Index to Financial Statements
HD SUPPLY, INC.
NOTES TO CONSOLIDATED AND COMBINED FINANCIAL STATEMENTS
(Continued)
The Company’s financial assets and liabilities measured at fair value on a recurring basis at January 31, 2010 and February 1, 2009 were as follows (amounts in millions):
| Quoted Prices in Active Markets for Identical Assets (Level 1) |
Significant Other Observable Inputs (Level 2) |
Significant Unobservable Inputs (Level 3) |
Total | |||||||
| At January 31, 2010: |
||||||||||
| Cash Equivalents |
$ 322 | $ – | $ – | $ 322 | ||||||
| Interest Rate Swap Contracts |
– | (7 | ) | – | (7 | ) | ||||
| At February 1, 2009: |
||||||||||
| Cash Equivalents |
$ 648 | $ – | $ – | $ 648 | ||||||
| Interest Rate Swap Contracts |
– | (17 | ) | – | (17 | ) |
The Company’s financial instruments that are not reflected at fair value on the balance sheet were as follows as of January 31, 2010 (amounts in millions):
| As of January 31, 2010 | As of February 1, 2009 | |||||||
| Recorded Amount(1) |
Estimated Fair Value |
Recorded Amount(1) |
Estimated Fair Value | |||||
| Term Loan due August 30, 2012 |
$ 978 | $ 929 | $ 987 | $ 815 | ||||
| Revolving Credit Facility due August 30, 2013 |
300 | 246 | 300 | 201 | ||||
| ABL Credit Facility due August 30, 2012 |
596 | 515 | 786 | 715 | ||||
| 12.0% Senior Notes due September 1, 2014 |
2,500 | 1,775 | 2,500 | 1,250 | ||||
| 13.5% Senior Subordinated Notes due September 1, 2015 |
1,401 | 715 | 1,482 | 345 | ||||
| Capital lease obligations, payable in various installments |
– | – | 1 | 1 | ||||
| Total |
$ 5,775 | $ 4,180 | $ 6,056 | $ 3,327 | ||||
(1) These amounts do not include accrued interest; accrued interest is classified as Other accrued expenses in the accompanying Consolidated Balance Sheets.
The Company utilized Level 2 inputs, as defined in the fair value hierarchy, to measure the fair value of the long-term debt, excluding capital lease obligations, which have an estimated fair value equal to recorded value.
The Term Loan is guaranteed by Home Depot. Based on a review of the fair value of debt issued by companies with similar credit ratings as Home Depot, Management estimates that the fair value of the Term Loan is approximately 93-97% of the principal value, or $929 million as of January 31, 2010.
The Company’s fair value estimates for the Revolving Credit Facility, ABL Credit Facility, 12.0% Senior Notes, and 13.5% Senior Subordinated Notes were based on recent similar credit facilities initiated by companies with like credit quality in similar industries, quoted prices for similar instruments, and inquiries with certain investment communities. Based on this data, Management estimates that as of January 31, 2010, the fair value of the Revolving Credit Facility is approximately 77-87% of the principal value, or $246 million, the fair value of the ABL Credit Facility is approximately 83-90% of the principal value, or $515 million, the fair value of the 12.0% Senior Notes is approximately 60-82% of the principal value, or $1,775 million, and the fair value of the 13.5% Senior Subordinated Notes is approximately 40-62% of principal value, or $715 million.
96
Table of Contents
Index to Financial Statements
HD SUPPLY, INC.
NOTES TO CONSOLIDATED AND COMBINED FINANCIAL STATEMENTS
(Continued)
NOTE 10 – INCOME TAXES
The components of Income (Loss) from Continuing Operations before Provision (Benefit) for Income Taxes are as follows (amounts in millions):
| Successor | Predecessor | |||||||||
| Fiscal Year Ended January 31, 2010 |
Fiscal Year Ended February 1, 2009 |
Period from August 30, 2007 to February 3, 2008 |
Period from January 29, 2007 to August 29, 2007 | |||||||
| United States |
$ (715) | $ (1,572) | $ (235) | $ 131 | ||||||
| Foreign |
(1) | – | 4 | 10 | ||||||
| Total |
$ (716) | $ (1,572) | $ (231) | $ 141 | ||||||
The Provision (Benefit) for Income Taxes consisted of the following (amounts in millions):
| Successor | Predecessor | |||||||||
| Fiscal Year Ended January 31, 2010 |
Fiscal Year Ended February 1, 2009 |
Period from August 30, 2007 to February 3, 2008 |
Period from January 29, 2007 to August 29, 2007 | |||||||
| Current: |
||||||||||
| Federal |
$ – | $ (77) | $ – | $ 133 | ||||||
| State |
4 | 2 | 4 | 25 | ||||||
| Foreign |
– | – | – | – | ||||||
| 4 | (75) | 4 | 158 | |||||||
| Deferred: |
||||||||||
| Federal |
(193) | (207) | (78) | (89) | ||||||
| State |
(22) | (36) | (11) | (11) | ||||||
| Foreign |
– | – | 2 | – | ||||||
| (215) | (243) | (87) | (100) | |||||||
| Total |
$ (211) | $ (318) | $ (83) | $ 58 | ||||||
HD Supply’s combined federal, state and foreign effective tax rate for fiscal 2009, fiscal 2008, the period from August 30, 2007 to February 3, 2008, and the period from January 29, 2007 to August 29, 2007, was approximately 29.5%, 20.2%, 35.9%, and 41.1%, respectively.
HD Supply’s effective tax rate will vary based on a variety of factors, including overall profitability, the geographical mix of income before taxes and the related tax rates in the jurisdictions where it operates, restructuring and other one-time charges, as well as discrete events, such as settlements of future audits. HD Supply’s fiscal 2009 and fiscal 2008 effective tax rates were significantly impacted by financial goodwill impairments.
The reconciliation of the provision (benefit) for income taxes at the federal statutory rate of 35% to the actual tax provision (benefit) for fiscal 2009, fiscal 2008, the period from August 30, 2007 to February 3, 2008, and the period from January 29, 2007 to August 29, 2007 is as follows (amounts in millions):
| Successor | Predecessor | |||||||||
| Fiscal Year Ended January 31, 2010 |
Fiscal Year Ended February 1, 2009 |
Period from 2008 |
Period from 2007 | |||||||
| Income taxes at federal statutory rate |
$ (250) | $ (550) | $ (81) | $ 49 | ||||||
| State income taxes, net of federal income tax benefit |
(20) | (27) | (4) | 4 | ||||||
| Non-deductible goodwill impairment |
43 | 246 | – | – | ||||||
| Other, net |
16 | 13 | 2 | 5 | ||||||
| Total provision (benefit) |
$ (211) | $ (318) | $ (83) | $ 58 | ||||||
97
Table of Contents
Index to Financial Statements
HD SUPPLY, INC.
NOTES TO CONSOLIDATED AND COMBINED FINANCIAL STATEMENTS
(Continued)
The tax effects of temporary differences that give rise to significant portions of the deferred tax assets and deferred tax liabilities as of January 31, 2010 and February 1, 2009 were as follows (amounts in millions):
| January 31, 2010 |
February 1, 2009 | |||
| Current: |
||||
| Deferred Tax Assets: |
||||
| Allowance for doubtful accounts |
$ 17 | $ 40 | ||
| Inventory |
63 | 73 | ||
| Accrued compensation |
3 | 8 | ||
| Accrued self-insurance liabilities |
21 | 22 | ||
| Restructuring liabilities |
42 | 29 | ||
| Other accrued liabilities |
23 | 28 | ||
| Net operating loss |
1 | 3 | ||
| Current deferred tax assets |
170 | 203 | ||
| Deferred Tax Liabilities: |
||||
| Prepaid expense & deferred revenue |
$ (1) | $ (49) | ||
| Current deferred tax liabilities |
(1) | (49) | ||
| Noncurrent: |
||||
| Deferred Tax Assets: |
||||
| Interest |
$ 121 | $ 82 | ||
| Accrued compensation |
12 | 6 | ||
| Other accrued liabilities |
7 | 2 | ||
| Deferred revenue |
8 | – | ||
| Restructuring liabilities |
– | 27 | ||
| Net operating loss |
148 | 191 | ||
| Fixed assets |
7 | – | ||
| Other |
17 | 26 | ||
| Valuation allowance |
(9) | (3) | ||
| Noncurrent deferred tax assets |
311 | 331 | ||
| Deferred Tax Liabilities: |
||||
| Software costs |
$ (22) | $ (9) | ||
| Fixed assets |
– | (6) | ||
| Intangible assets |
(415) | (509) | ||
| Income from discharge of indebtedness |
(77) | – | ||
| Noncurrent deferred tax liabilities |
(514) | (524) | ||
| Deferred tax liabilities, net |
$ (34) | $ (39) | ||
HD Supply has net operating loss carryovers of $376 million, prior to any valuation allowances or reclassification required pursuant to the income taxes principles of U.S. GAAP (ASC 740, Income Taxes), for federal, state and foreign jurisdictions which expire between 2012 and 2029. HD Supply is required to assess the realization of its net deferred tax assets and the need for any valuation allowance. This assessment requires management to make judgments about the benefits that could be realized from future taxable income, as well as other positive and negative factors influencing the realization of deferred tax assets. A valuation allowance of $9 million was provided for fiscal 2009 for certain state net operating losses for which it is not more likely than not that the Company will be able to fully realize the related deferred tax asset. Management believes that it is more likely than not that HD Supply will have sufficient taxable income from future operations to fully realize all other deferred tax assets. However, it is reasonably possible that a material adjustment of the valuation allowance could occur within one year.
The amount of income tax benefit included in discontinued operations was $6 million, $1 million, $10 million and $20 million in fiscal 2009, in fiscal 2008, in the period from August 30, 2007 to February 3, 2008, and in the period from January 29, 2007 to August 29, 2007, respectively.
Federal and state income taxes receivable total $161 million and $87 million for fiscal 2009 and fiscal 2008, respectively, and are included in Other current assets in the Consolidated Balance Sheets.
98
Table of Contents
Index to Financial Statements
HD SUPPLY, INC.
NOTES TO CONSOLIDATED AND COMBINED FINANCIAL STATEMENTS
(Continued)
Accounting for uncertain tax positions
On January 29, 2007, the Company adopted the U.S. GAAP guidance for uncertain tax positions (previously known as FASB Interpretation No. 48, “Accounting for Uncertainty in Income Taxes—an interpretation of FASB Statement No. 109”). Among other things, this guidance requires application of a “more likely than not” threshold to the recognition and de-recognition of tax positions. It further requires that a change in judgment related to prior years’ tax positions be recognized in the quarter of such change. The January 29, 2007 adoption of this guidance reduced the Company’s Owner’s Equity by approximately $2 million. As a result of the implementation, the Company’s unrecognized tax benefit totaled $27 million and its opening accrual for interest and penalties was $7 million.
A reconciliation of the beginning and ending amount of unrecognized tax benefits for continuing operations for the Predecessor period from January 29, 2007 to August 29, 2007 is as follows (amounts in millions):
| Unrecognized Tax Benefits as of January 29, 2007 |
$ 27 | |
| Gross increases for tax positions in current period |
6 | |
| Gross increases for tax positions in prior period |
– | |
| Gross decreases for tax positions in prior period |
– | |
| Settlements |
– | |
| Lapse of statutes |
– | |
| Unrecognized Tax Benefits as of August 29, 2007 |
$ 33 | |
A reconciliation of the beginning and ending amount of unrecognized tax benefits for continuing operations for the Successor period from August 30, 2007 to February 3, 2008, fiscal 2008, and fiscal 2009 is as follows (amounts in millions):
| Unrecognized Tax Benefits as of August 30, 2007 |
$ 54 | |
| Gross increases for tax positions in current period |
20 | |
| Gross increases for tax positions in prior period |
– | |
| Gross decreases for tax positions in prior period |
– | |
| Settlements |
– | |
| Lapse of statutes |
(1) | |
| Unrecognized Tax Benefits as of February 3, 2008 |
$ 73 | |
| Gross increases for tax positions in current period |
28 | |
| Gross increases for tax positions in prior period |
105 | |
| Gross decreases for tax positions in prior period |
– | |
| Settlements |
– | |
| Lapse of statutes |
– | |
| Unrecognized Tax Benefits as of February 1, 2009 |
$ 206 | |
| Gross increases for tax positions in current period |
1 | |
| Gross increases for tax positions in prior period |
– | |
| Gross decreases for tax positions in prior period |
(16) | |
| Settlements |
– | |
| Lapse of statutes |
(1) | |
| Unrecognized Tax Benefits as of January 31, 2010 |
$ 190 | |
There are $140 million, $158 million, $54 million, $4 million, and $4 million of unrecognized tax benefits included in the balance at January 31, 2010, February 1, 2009, February 3, 2008, August 29, 2007, and January 29, 2007, respectively, whose resolution would affect the annual effective income tax rate.
HD Supply accrued $3 million and $3 million of net interest and penalties related to unrecognized tax benefits for fiscal 2009 and fiscal 2008, respectively. The Company’s ending net accrual for interest and penalties related to unrecognized tax benefits at January 31, 2010, February 1, 2009, February 3, 2008 and August 29, 2007 was $12 million, $9 million, $7 million, and $7 million, respectively. HD Supply’s accounting policy is to classify interest and penalties as components of income tax expense. Accrued interest and penalties from unrecognized tax benefits are included as a component of Other long-term liabilities on HD Supply’s Consolidated Balance Sheet.
HD Supply is subject to audits and examinations of its tax returns by tax authorities in various jurisdictions, including the Internal Revenue Service. These audits include questions regarding its tax filing positions,
99
Table of Contents
Index to Financial Statements
HD SUPPLY, INC.
NOTES TO CONSOLIDATED AND COMBINED FINANCIAL STATEMENTS
(Continued)
including the timing and amount of deductions and the allocation of income among various tax jurisdictions. Management regularly assesses the likelihood of adverse outcomes resulting from these examinations to determine the adequacy of provisions for income taxes. Certain of HD Supply’s tax years 2006 and forward remain open for audit by the IRS and various state governments. The Company anticipates that few of these audits will be fully resolved during 2010. The Company does not anticipate that the resolution of these matters will result in a material change to its consolidated financial condition or results of operations. The Company does not anticipate any significant changes in its unrecognized tax benefits over the next twelve months.
NOTE 11 – STOCK-BASED COMPENSATION AND EMPLOYEE BENEFIT PLANS
Stock-Based Compensation Plans
HDS Holding Plan
Effective December 4, 2007, HDS Holding established an Incentive Stock Plan (the “HDS Plan”) for associates of HD Supply, a wholly-owned subsidiary. The HDS Plan provides for the award of non-qualified stock options and deferred share units of the common stock of HDS Holding. The maximum number of shares of common stock that may be issued under the HDS Plan may not exceed 49.4 million, of which a maximum of 24.7 million shares may be issued in respect of options granted under the HDS Plan. HDS Holding will issue new shares of common stock to satisfy options exercised.
Under the HDS Plan, as of January 31, 2010 and February 1, 2009, associates of HD Supply were granted non-qualified stock options for 20.9 million shares and 22.0 million shares, respectively of HDS Holding common stock, net of cancellations, 7.5 million and 4.3 million of which are exercisable as of January 31, 2010 and February 1, 2009, respectively. Under the terms of the HDS Plan, non-qualified stock options are to carry exercise prices at or above the fair market value of HDS Holding’s stock on the date of the grant. Since HDS Holding common stock is not publicly traded, the fair market value of the stock is determined by the Board of Directors of HDS Holding based on such factors as it deems appropriate, including but not limited to the earnings and other financial and operating information of the Company in recent periods, the potential value of the Company as a whole, the future prospects of the Company and the industries in which it competes, the history and management of the Company, the general condition of the securities markets, the fair market value of securities of companies engaged in businesses similar to those of the Company, and any recent valuation of the common stock of HDS Holding that shall have been performed by an independent valuation firm (although the Board of Directors of HDS Holding is not obligated to obtain such a valuation). The non-qualified stock options generally vest at the rate of 20% per year commencing on the first anniversary date of the grant and expire on the tenth anniversary date of the grant.
A summary of option activity under the HDS Plan is presented below (shares in thousands):
| Number of Shares |
Weighted Option Price | |||
| Granted |
21,138 | $ 13.13 | ||
| Exercised |
– | – | ||
| Canceled |
(468) | 13.13 | ||
| Outstanding at February 3, 2008 |
20,670 | $ 13.13 | ||
| Granted |
2,175 | 13.13 | ||
| Exercised |
– | – | ||
| Canceled |
(796) | 13.13 | ||
| Outstanding at February 1, 2009 |
22,049 | $ 13.13 | ||
| Granted |
1,582 | 13.13 | ||
| Exercised |
– | – | ||
| Canceled |
(2,732) | 13.13 | ||
| Outstanding at January 31, 2010 |
20,899 | $ 13.13 | ||
As of January 31, 2010, there were approximately 20.9 million stock options outstanding with a weighted average remaining life of 8 years.
100
Table of Contents
Index to Financial Statements
HD SUPPLY, INC.
NOTES TO CONSOLIDATED AND COMBINED FINANCIAL STATEMENTS
(Continued)
The estimated fair value of the options when granted is amortized to expense over the options’ vesting or required service period. The fair value for these options was estimated, using a third-party valuation specialist, at the date of grant based on the expected life of the option and historical exercise experience, using a Black-Scholes option pricing model with the following weighted-average assumptions:
| Fiscal Year Ended | ||||||
| January 31, 2010 |
February 1, 2009 |
February 3, 2008 | ||||
| Risk-free interest rate |
2.9% | 3.6% | 3.5% | |||
| Dividend yield |
0.0% | 0.0% | 0.0% | |||
| Expected volatility factor |
50.5% | 43.2% | 36.3% | |||
| Expected option life in years |
7.3 | 6.8 | 6.9 | |||
The risk free interest rate was determined based on an analysis of U.S. Treasury zero-coupon market yields as of the date of the option grant for issues having expiration lives similar to the expected option life. The expected volatility was based on an analysis of the historical volatility of HD Supply’s competitors over the expected life of the HD Supply options. These volatilities were weighted by the respective HD Supply segment against which they compete, resulting in an overall industry-based volatility for HD Supply. As insufficient data exists to determine the historical life of options issued under the HDS Plan, the expected option life was determined based on the vesting schedule of the options and their contractual life taking into consideration the expected time in which the share price of HDS Holding would exceed the exercise price of the option. The weighted-average fair value of each option granted during fiscal 2009, fiscal 2008 and the period from August 30, 2007 to February 3, 2008 was $1.63, $4.08, and $3.71, respectively. HD Supply recognized $18 million, $14 million and $1 million of stock-based compensation expense related to stock options, included in Selling, general and administrative expense in the Consolidated Statements of Operations, during fiscal 2009, fiscal 2008, and in the period from August 30, 2007 to February 3, 2008, respectively. As of January 31, 2010 the unamortized compensation expense related to stock options was $37 million and was expected to be recognized over a period of 5 years.
Option Exchange Program
On January 15, 2010, the Company initiated a one-time stock option exchange program (“Option Exchange Program”). Under the Option Exchange Program, all current employees of the Company were offered the opportunity to exchange their outstanding options (the “Eligible Options”) to purchase shares of Holding’s common stock (the “Common Stock”) granted under the HDS Plan for a lesser number of new options (as determined in accordance with the exchange ratios below) under the HDS Plan.
The Option Exchange Program covers all options that are outstanding under the HDS Plan, including vested and unvested options. Eligible Options that have an exercise price greater than $10.00 per share will be exchanged based on the exchange ratio below for a lesser number of options with a new exercise price equal to the greater of (i) $4.15 per share and (ii) the fair market value of the Common Stock on the Grant Date (the “Repriced Options”). Options that have an exercise price equal to $10.00 per share will be exchanged for an equal number of options with an exercise price equal to $10.00 per share (the “New $10.00 Options”, and together with the Repriced Options, the “New Options”). For every three Eligible Options with an exercise price greater than $10.00 per share, an eligible employee will receive two new Repriced Options. For every one Eligible Option with an exercise price equal to $10.00 per share, an eligible employee will receive one New $10.00 Option.
Regardless of the vesting status of the Eligible Options, the New Options will have a five-year vesting period, with 20% of the New Options vesting on each anniversary of the Grant Date and an expiration date that is 10 years from the Grant Date. All of the New Options will be subject to the terms and conditions of the HDS Plan and the eligible employee’s new stock option agreement.
The offering period for the Option Exchange Program commenced on January 15, 2010 and expires on February 2, 2010. Participation in the Option Exchange Program is voluntary. However, once an eligible employee elects to participate, all of his or her Eligible Options must be exchanged. Once the offer to exchange expires, all Eligible Options that were surrendered for exchange will be cancelled and the New Options will be granted. For information on the options exchanged and issued as a result of the Option Exchange Program, see Note 20, Subsequent Events.
101
Table of Contents
Index to Financial Statements
HD SUPPLY, INC.
NOTES TO CONSOLIDATED AND COMBINED FINANCIAL STATEMENTS
(Continued)
THD Plans
Prior to the Transactions, associates of HD Supply participated in the Employee Stock Plans of THD. The Home Depot, Inc. 2005 Omnibus Stock Incentive Plan (“2005 Plan”) and The Home Depot, Inc. 1997 Omnibus Stock Incentive Plan (“1997 Plan”) (collectively “the THD Plans”) provided that incentive, non-qualified stock options, stock appreciation rights, restricted shares, performance shares, performance units and deferred shares of THD stock may be issued to selected associates, officers and directors of THD, including HD Supply. All outstanding THD options and restricted stock awards granted prior to January 1, 2007 vested upon the closing of the Transactions and vested options remained exercisable for a 90-day period thereafter. As a result of the accelerated vesting, the Company recognized a charge of $22 million in the period from January 29, 2007 to August 29, 2007. All outstanding THD options and restricted stock awards granted subsequent to January 1, 2007 were forfeited upon the closing of the Transactions. As a result, the Company recognized a credit of $5 million in the period from January 29, 2007 to August 29, 2007.
THD maintains two Employee Stock Purchase Plans (“ESPPs”) (U.S. and non-U.S. plans) in which associates of HD Supply could participate prior to the Transactions. The plan for U.S. associates is a tax-qualified plan under Section 423 of the Internal Revenue Code. The non-U.S. plan is not a Section 423 plan. The ESPPs allow THD associates, including associates of HD Supply, to purchase up to 152 million shares of THD common stock, of which 120 million shares have been purchased from inception of the plans. The purchase price of shares under the ESPPs is equal to 85% of the stock’s fair market value on the last day of the purchase period.
In total, HD Supply recorded stock-based compensation expense, including the expense of stock options, ESPPs and restricted stock, of $33 million in the period from January 29, 2007 to August 29, 2007.
The following table summarizes stock options in THD common stock held by HD Supply associates outstanding at February 3, 2008 and changes during the fiscal year ended on this date (shares in thousands):
| Number of Shares |
Weighted Average Option Price | |||
| Outstanding at January 28, 2007 |
4,021 | $36.71 | ||
| Granted |
286 | 38.75 | ||
| Exercised |
(1,120) | 29.31 | ||
| Canceled |
(3,187) | 39.56 | ||
| Outstanding at February 3, 2008 |
– | $ – | ||
The total intrinsic value of stock options exercised during the period from August 30, 2007 to February 3, 2008 and in the period from January 29, 2007 to August 29, 2007 was $3 million and $4 million, respectively.
The following table summarizes restricted THD stock held by HD Supply associates outstanding at August 29, 2007 (shares in thousands):
| Number of Shares |
Weighted Average Grant Date Fair Value | |||
| Outstanding at January 28, 2007 |
1,115 | $40.09 | ||
| Granted |
1,117 | 38.74 | ||
| Restrictions lapsed |
(1,280) | 39.87 | ||
| Canceled |
(952) | 38.80 | ||
| Outstanding at August 29, 2007 |
– | $ – | ||
Employee Benefit Plans
HD Supply Benefit Plans
Effective January 1, 2008, HD Supply established a comprehensive Health & Welfare Benefits Program which allows employees who satisfy certain eligibility requirements to choose among different levels and types of coverage. The Health & Welfare Benefits program provides employees healthcare coverage in which the employer and employee share costs. In addition, the Program offers employees the opportunity to participate in various voluntary coverages, including flexible spending accounts.
102
Table of Contents
Index to Financial Statements
HD SUPPLY, INC.
NOTES TO CONSOLIDATED AND COMBINED FINANCIAL STATEMENTS
(Continued)
Effective January 1, 2008, HD Supply established a 401(k) defined contribution plan that is qualified under Sections 401(a) and 501(a) of the Internal Revenue Code. Employees who satisfy the plan’s eligibility requirements may elect to contribute a portion of their compensation to the plan on a pre-tax basis. HD Supply may match a percentage of the employees’ contributions to the plan based on approval from the Board of Directors. Matching contributions are generally made shortly after the end of each pay period. HD Supply paid $3 million, $22 million, and $2 million in matching contributions during fiscal 2009, fiscal 2008 and the period from January 1, 2008 to February 3, 2008, respectively.
THD Benefit Plans
Some of HD Supply’s employees participated in THD’s defined contribution retirement plans for its employees (“the THD Benefit Plans”). Upon the closing of the Transactions, HD Supply entered into an Employee Benefits Transition Agreement with THD, under which HD Supply employees continued to participate in specified THD employee benefits plans for a transition period ending December 31, 2007.
Prior to the conclusion of the transition period, all associates satisfying certain service requirements were eligible to participate in the THD Benefit Plans. HD Supply made cash contributions each payroll period up to specified percentages of associates’ contributions as approved by the THD Board of Directors. THD also maintained a restoration plan in which some of HD Supply’s employees participated. The restoration plan provided certain associates deferred compensation that they would have received under the THD Benefit Plans as a matching contribution if not for the maximum compensation limits under the Internal Revenue Code. THD funded the restoration plan through contributions made to a grantor trust, which are then used to purchase shares of the THD’s common stock in the open market. HD Supply’s contributions to the THD Benefit Plans and the restoration plan were $11 million for the period from January 29, 2007 to August 29, 2007. There were no payments to the THD Benefit Plans and restoration plan subsequent to August 29, 2007.
NOTE 12 – STOCKHOLDERS’ EQUITY
Common Stock
The Company is authorized to issue 1,000 shares of common stock, par value $0.01 per share. As of January 31, 2010 and February 1, 2009, 1,000 shares were issued and outstanding.
Accumulated Other Comprehensive Income (Loss)
Accumulated other comprehensive income (loss) is comprised of the following components (amounts in millions):
| January 31, 2010 |
February 1, 2009 | |||
| Cumulative foreign currency translation adjustment, net |
$ (10) | $ (29) | ||
| Unrealized losses on derivatives, net |
(1) | (3) | ||
| Total accumulated other comprehensive income (loss) |
$ (11) | $ (32) | ||
103
Table of Contents
Index to Financial Statements
HD SUPPLY, INC.
NOTES TO CONSOLIDATED AND COMBINED FINANCIAL STATEMENTS
(Continued)
NOTE 13 – SUPPLEMENTAL BALANCE SHEET AND CASH FLOW INFORMATION
Property and Equipment
Property and equipment at January 31, 2010 and February 1, 2009 consisted of the following (amounts in millions):
| January 31, 2010 | February 1, 2009 | |||
| Land |
$ 46 | $ 46 | ||
| Buildings and improvements |
211 | 220 | ||
| Transportation equipment |
21 | 22 | ||
| Furniture, fixtures and equipment |
289 | 302 | ||
| Capitalized software |
166 | 105 | ||
| Construction in progress |
13 | 36 | ||
| 746 | 731 | |||
| Less accumulated depreciation & amortization |
(293) | (186) | ||
| Property and equipment, net |
$ 453 | $ 545 | ||
Other Accrued Expenses
Other accrued expenses at January 31, 2010 and February 1, 2009 consisted of the following (amounts in millions):
| January 31, 2010 | February 1, 2009 | |||
| Accrued interest |
$ 129 | $ 133 | ||
| Accrued non-income taxes |
28 | 31 | ||
| Branch closure & consolidation reserves |
30 | 35 | ||
| Other |
112 | 144 | ||
| Total other accrued expenses |
$ 299 | $ 343 | ||
Significant Non-Cash Transactions
Interest payments on the 13.5% Senior Subordinated Notes are due each March and September 1st through maturity except that the first eight payment periods through September 2011 shall be paid in kind (“PIK”) and therefore increase the balance of the outstanding indebtedness rather than be paid in cash. The Company made PIK interest payments during fiscal 2009 and fiscal 2008 of $172 million and $182 million, respectively, increasing the outstanding balance of the 13.5% Senior Subordinated Notes.
As part of the Transactions discussed in Note 1, THD was provided 12.5% of HDS Holdings common stock worth $325 million, reflecting THD’s continuing interest in HD Supply. In addition, THD paid $100 million of debt issuance costs on behalf of HD Supply. This was accounted for as a reduction in the purchase price of the Company.
Supplemental Cash Flow Information
Cash paid for interest in fiscal 2009, in fiscal 2008, and in the period from August 30, 2007 to February 3, 2008 was approximately $366 million, $397 million, and $65 million, respectively. Cash paid for income taxes, net of refunds, in fiscal 2009, in fiscal 2008, and in the period from August 30, 2007 to February 3, 2008 was approximately $127 million net refund, $9 million, and $7 million, respectively.
NOTE 14 – BRANCH CLOSURE AND CONSOLIDATION ACTIVITIES
Fiscal 2009 Plan
In the third quarter of fiscal 2009, the Company initiated a plan to further restructure its businesses which included evaluating opportunities to consolidate branches, further reduce costs, more efficiently employ working capital and streamline activities. As a result, during fiscal 2009, the Company recognized $30 million in charges for liquidation of excess inventory and branch closure and consolidation charges, of which $9 million is included in Cost of sales for inventory liquidation charges and $21 million is included in Restructuring charges for severance, occupancy costs, fixed asset impairments and other reorganization costs. Under this plan, management expects to close or consolidate approximately 25 branches and reduce workforce personnel by
104
Table of Contents
Index to Financial Statements
HD SUPPLY, INC.
NOTES TO CONSOLIDATED AND COMBINED FINANCIAL STATEMENTS
(Continued)
approximately 400 employees. As of January 31, 2010, the Company has completed the closure of 15 branches and approximately 230 headcount reductions. The Company expects to incur a total of approximately $45 million in charges for this plan, which should be complete by the end of the first half of fiscal 2010.
The following table presents the activity for the liability balance, included in Other accrued expenses and Other long-term liabilities in the Consolidated Balance Sheets, related to closure and consolidation activities under the Fiscal 2009 plan (amounts in millions):
| Severance | Occupancy Costs |
Other | Total | |||||
| Additions for restructuring charges |
$ 5 | $ 7 | $ 2 | $ 14 | ||||
| Cash payments |
(2) | - | - | (2) | ||||
| Ending balance - January 31, 2010 |
$ 3 | $ 7 | $ 2 | $ 12 | ||||
Transactions & Acquisition Integration
Concurrent with the Transactions and acquisition integration, management evaluated the operations and performance of individual branches and identified branches for closure or consolidation. During the period from August 30, 2007 to February 3, 2008, accruals of approximately $60 million were recorded as part of the net assets acquired in the Transaction related to the closure of 80 branches, including the termination of approximately 2,000 employees. During fiscal 2008, finalization of branch closure plans under purchase accounting resulted in the identification of approximately 95 additional branches for closure and 800 additional employees for termination. As a result, additional accruals of $86 million were recorded.
In addition, during the fourth quarter of fiscal 2008, as a result of continued acquisition integration efforts, the decline in the residential construction market, and the general decline in economic conditions, management evaluated the operations and performance of individual branches and identified branches for closure or consolidation and a reduction in workforce. As a result, the Company identified an additional 32 branches for closure and 1,600 additional employees for termination. During the fourth quarter of fiscal 2008, the Company recorded a restructuring charge of $36 million. This charge included $30 million for severance, occupancy, and other cash charges, $2 million for inventory liquidation, and $4 million for other non-cash charges. During the first quarter of fiscal 2009, the Company incurred additional restructuring charges under these plans of $9 million, primarily related to severance. The inventory liquidation charges were recorded to Cost of sales and all other cash and non-cash restructuring charges were recorded to Selling, general and administrative expenses in the Consolidated Statements of Operations.
Under these plans, management closed or consolidated approximately 210 branches and reduced workforce personnel by approximately 4,500 employees. The Company does not expect to incur additional restructuring charges under these plans.
The following table presents the activity for the liability balance, included in Other accrued expenses and Other long-term liabilities, related to closure and consolidation activities (amounts in millions):
| Severance | Occupancy Costs |
Other | Total | |||||
| Purchase accounting accrual adjustments |
$ 16 | $ 29 | $ 15 | $ 60 | ||||
| Cash payments |
(3) | (2) | (4) | (9) | ||||
| Ending balance - February 3, 2008 |
$ 13 | $ 27 | $ 11 | $ 51 | ||||
| Purchase accounting accrual adjustments |
14 | 65 | 7 | 86 | ||||
| Additions for restructuring charges |
6 | 27 | (3) | 30 | ||||
| Cash payments |
(28) | (25) | (7) | (60) | ||||
| Effects of exchange rates |
- | (2) | - | (2) | ||||
| Ending balance - February 1, 2009 |
$ 5 | $ 92 | $ 8 | $ 105 | ||||
| Additions for restructuring charges, net of reductions |
7 | (3) | 1 | 5 | ||||
| Cash payments |
(12) | (28) | (4) | (44) | ||||
| Effects of exchange rates |
- | 1 | - | 1 | ||||
| Other |
- | (8) | - | (8) | ||||
| Ending balance - January 31, 2010 |
$ - | $ 54 | $ 5 | $ 59 | ||||
105
Table of Contents
Index to Financial Statements
HD SUPPLY, INC.
NOTES TO CONSOLIDATED AND COMBINED FINANCIAL STATEMENTS
(Continued)
The Company regularly reviews the assumptions used to estimate the net present value of the on-going lease liabilities and other occupancy costs, net of expected sublease income. During the fourth quarter of fiscal 2009, management’s review resulted in a reduction to the lease liabilities due to several favorable lease dispositions, resulting in a reduction to Restructuring expense of $4 million related to previously incurred restructuring charges and a reduction to Selling, general and administrative expense of $8 million related to the lease reserves established under purchase accounting.
As of January 31, 2010, approximately $30 million of the liability balances for all branch closure and consolidation activities is classified as a current liability on the Company’s Consolidated Balance Sheet. Payments for severance are expected to be completed during fiscal 2010. Payments for occupancy costs, which represent the net present value of future lease obligations, including rent, taxes, utilities, etc., less estimated sublease income of the closed branches, and for other costs, which relate primarily to equipment and vehicle leases, are expected to be substantially complete over the next five years, with certain property lease obligations extending out as far as fourteen years. The Company continues to actively pursue buyout options or subleasing tenants for the leased properties. The timing of cash payments related to the branch closure and consolidation activities could change depending on the success and timing of entering into these types of agreements.
NOTE 15 – COMMITMENTS
Lease Commitments
HD Supply occupies certain facilities and operates certain equipment and vehicles under leases that expire at various dates through the year 2026. In addition to minimum rentals, there are certain executory costs such as real estate taxes, insurance, and common area maintenance on most of its facility leases. Expense under these leases totaled $181 million, $196 million, $84 million, and $121 million, in fiscal 2009, in fiscal 2008, in the period from August 30, 2007 to February 3, 2008, and in the period from January 29, 2007 to August 29, 2007, respectively. Capital leases currently in effect are not material. Future minimum aggregate rental payments under non-cancelable operating leases as of January 31, 2010 are as follows (amounts in millions):
| Fiscal Year |
Operating Leases |
|||
| 2010 |
$ 170 | |||
| 2011 |
138 | |||
| 2012 |
106 | |||
| 2013 |
75 | |||
| 2014 |
51 | |||
| Thereafter |
112 | |||
| Total |
$ 652 | |||
HD Supply subleases certain leased facilities to third parties. Total future minimum rentals to be received under non-cancelable subleases as of January 31, 2010 are approximately $18 million. These subleases expire at various dates through the year 2016.
Purchase Obligations
As of January 31, 2010, the Company has agreements in place with various vendors to purchase inventory in the aggregate amount of $279 million. Payment is due during fiscal 2010 for these obligations.
NOTE 16 – LEGAL MATTERS
HD Supply is involved in various legal proceedings arising in the normal course of its business. In management’s opinion, none of the proceedings are material in relation to the consolidated and combined operations, cash flows, or financial position of HD Supply and the Company has adequate reserves to cover its estimated probable loss exposure.
NOTE 17 – SEGMENT INFORMATION
HD Supply’s operating segments are based on management structure and internal reporting. Each segment offers different products and services to the end customer, except for Corporate, which provides general
106
Table of Contents
Index to Financial Statements
HD SUPPLY, INC.
NOTES TO CONSOLIDATED AND COMBINED FINANCIAL STATEMENTS
(Continued)
corporate overhead support and HD Supply Canada (included in Other), which is organized based on geographic location. The Company determines the reportable segments in accordance with the principles of segment reporting within U.S. GAAP (ASC 280, Segment Reporting). For purposes of evaluation under these segment reporting principles, the Chief Operating Decision Maker for HD Supply assesses HD Supply’s ongoing performance, based on the periodic review and evaluation of Net sales, operating income before restructuring charges and goodwill impairments, and certain other measures for each of the operating segments. Based on the segment analysis performed in fiscal 2009, the Plumbing and Creative Touch Interiors operating segments have been included as reportable segments for all periods presented herein. Plumbing was not included as a reportable segment in fiscal 2008 and CTI was not included as a reportable segment in fiscal 2007. As a result, prior period disclosures reflect the change in reportable segments.
HD Supply has seven reportable segments, each of which is presented below:
| • | Waterworks – Distributes complete lines of water and wastewater transmission products, serving contractors and municipalities in all aspects of the water and wastewater industries. |
| • | Facilities Maintenance – Supplies MRO products and upgrade and renovation services largely to the multifamily, healthcare, hospitality, and institutional markets. |
| • | White Cap – Distributes specialized hardware, tools and building materials to professional contractors. |
| • | Utilities – Distributes electrical transmission and distribution products, power plant MRO supplies and smart-grid technologies and provides materials management and procurement outsourcing arrangements to investor-owned utilities, municipal and provincial power authorities, rural electric cooperatives and utility contractors. |
| • | Industrial Pipe, Valves and Fittings (“IPVF”) – Distributes stainless steel and special alloy pipe, plate, sheet, flanges and fittings as well as high performance valves, actuation services and high-density polyethylene pipes and fittings for use in the oil and gas, petrochemical, power, food and beverage, pulp and paper, mining, and marine industries; in addition, IPVF serves pharmaceutical customers, industrial and mechanical contractors, fabricators, wholesale distributors, exporters and original equipment manufacturers. |
| • | Plumbing – Distributes plumbing fixtures, faucets and finishes, HVAC equipment, pipes, valves, fittings and water heaters, as well as related services, to residential and commercial contractors. |
| • | Creative Touch Interiors (“CTI”) – Offers turnkey flooring installation services and countertop, cabinet and window covering installation services for the interior finish of residential and non-residential construction projects. |
In addition to the reportable segments, the Company’s consolidated financial results include an Other category, Corporate, & Eliminations. Other primarily consists of Electrical, offering electrical products such as wire and cable, switch gear supplies, lighting conduit to residential and commercial contractors; Repair & Remodel, offering light remodeling and construction supplies primarily to small remodeling contractors and tradesmen; Crown Bolt, a retail distribution operator, providing program and packaging solutions, sourcing, distribution, and in-store service, primarily serving Home Depot; and HD Supply Canada, comprised of HD Supply’s Canadian operations (other than Grafton, which is included in the Utilities segment, and Commercial Direct, which is included in the Facilities Maintenance segment). Corporate has enterprise management responsibility and centralized support functions for some of the segments, information technology, human resources, sourcing and support services. Eliminations remove intersegment transactions.
107
Table of Contents
Index to Financial Statements
HD SUPPLY, INC.
NOTES TO CONSOLIDATED AND COMBINED FINANCIAL STATEMENTS
(Continued)
HD Supply evaluates performance of each segment based on operating income before restructuring charges and goodwill impairments. The following tables present Net sales, operating income before charges, and other financial measures by segment for the periods indicated (amounts in millions):
| Successor | Fiscal Year 2009 | |||||||||||
| Net Sales |
Operating Income |
Depreciation / Amortization |
Total Assets |
Capital Expenditures | ||||||||
| Waterworks |
$ 1,652 | $ (2) | $ 100 | $ 1,695 | $ 2 | |||||||
| Facilities Maintenance |
1,609 | 182 | 97 | 2,341 | 28 | |||||||
| White Cap |
872 | (76) | 45 | 487 | 4 | |||||||
| Utilities |
995 | 28 | 20 | 592 | 1 | |||||||
| IPVF |
637 | 27 | 17 | 488 | 2 | |||||||
| Plumbing |
436 | (38) | 11 | 135 | 1 | |||||||
| CTI |
224 | (53) | 16 | 104 | 2 | |||||||
| Other, Corporate, & Eliminations |
993 | (128) | 86 | 2,003 | 18 | |||||||
| Total continuing operations before charges |
$ | 7,418 | (60) | 392 | $ | 7,845 | 58 | |||||
| Restructuring charge(1) |
38 | |||||||||||
| Goodwill impairment |
224 | |||||||||||
| Total operating income from continuing operations |
(322) | |||||||||||
| Interest, net |
602 | |||||||||||
| Other (income) expense, net |
(208) | |||||||||||
| Losses from continuing operations before provision for income taxes |
$ (716) | |||||||||||
| Discontinued operations |
– | – | ||||||||||
| Total |
$ 392 | $ 58 | ||||||||||
| (1) Includes | $10 million of inventory liquidation charges reflected as Cost of sales in the Consolidated Statement of Operations. |
| Successor | Fiscal Year 2008 | |||||||||||
| Net Sales |
Operating Income |
Depreciation / Amortization |
Total Assets |
Capital Expenditures | ||||||||
| Waterworks |
$ 2,359 | $ 87 | $ 102 | $ 2,020 | $ 4 | |||||||
| Facilities Maintenance |
1,635 | 159 | 102 | 2,375 | 23 | |||||||
| White Cap |
1,369 | 4 | 48 | 597 | 7 | |||||||
| Utilities |
1,214 | 42 | 22 | 689 | 4 | |||||||
| IPVF |
811 | 117 | 17 | 582 | 7 | |||||||
| Plumbing |
716 | (20) | 12 | 207 | 2 | |||||||
| CTI |
376 | (78) | 17 | 170 | 2 | |||||||
| Other, Corporate, & Eliminations |
1,288 | (141) | 91 | 2,448 | 28 | |||||||
| Total continuing operations before charges |
$ | 9,768 | 170 | 411 | $ | 9,088 | 77 | |||||
| Restructuring charge(2) |
36 | |||||||||||
| Goodwill impairment |
1,053 | |||||||||||
| Total operating income from continuing operations |
(919) | |||||||||||
| Interest, net |
642 | |||||||||||
| Other (income) expense, net |
11 | |||||||||||
| Losses from continuing operations before provision for income taxes |
$ (1,572) | |||||||||||
| Discontinued operations |
– | – | ||||||||||
| Total |
$ 411 | $ 77 | ||||||||||
| (2) | Includes $2 million of inventory liquidation charges reflected as Cost of sales in the Consolidated Statement of Operations. |
108
Table of Contents
Index to Financial Statements
HD SUPPLY, INC.
NOTES TO CONSOLIDATED AND COMBINED FINANCIAL STATEMENTS
(Continued)
| Successor | August 30, 2007 to February 3, 2008 | |||||||||
| Net Sales |
Operating Income |
Depreciation / Amortization |
Total Assets |
Capital Expenditures | ||||||
| Waterworks |
$ 1,125 | $ 65 | $ 42 | $ 2,981 | $ 2 | |||||
| Facilities Maintenance |
650 | 53 | 44 | 2,496 | 20 | |||||
| White Cap |
606 | (10) | 20 | 808 | 7 | |||||
| Utilities |
562 | 22 | 9 | 796 | 6 | |||||
| IPVF |
312 | 48 | 7 | 690 | 3 | |||||
| Plumbing |
426 | (4) | 5 | 406 | 3 | |||||
| CTI |
292 | 2 | 8 | 268 | 4 | |||||
| Other, Corporate, & Eliminations |
626 | (118) | 37 | 2,148 | 29 | |||||
| Total continuing operations |
$ 4,599 | 58 | $ 172 | $ 10,593 | $ 74 | |||||
| Interest, net |
289 | |||||||||
| Losses from continuing operations before provision for income taxes |
$ (231) | |||||||||
| Discontinued operations |
3 | 1 | ||||||||
| Total |
$ 175 | $ 75 | ||||||||
| Predecessor | January 29, 2007 to August 29, 2007 | |||||||||
| Net Sales |
Operating Income |
Depreciation / Amortization |
Capital Expenditures |
Business Acquisitions | ||||||
| Waterworks |
$ 1,865 | $ 147 | $ 29 | 5 | $ 10 | |||||
| Facilities Maintenance |
952 | 115 | 17 | 30 | – | |||||
| White Cap |
965 | 14 | 22 | 18 | 15 | |||||
| Utilities |
815 | 43 | 8 | 3 | – | |||||
| IPVF |
445 | 87 | 6 | 4 | – | |||||
| Plumbing |
738 | 15 | 4 | 4 | – | |||||
| CTI |
417 | (5) | 8 | 14 | – | |||||
| Other, Corporate, & Eliminations |
924 | (54) | 25 | 89 | 4 | |||||
| Total continuing operations |
$ 7,121 | 362 | $ 119 | $ 167 | $ 29 | |||||
| Interest, net |
221 | |||||||||
| Earnings from continuing operations before provision for income taxes |
$ 141 | |||||||||
| Discontinued operations |
8 | 9 | – | |||||||
| Total |
$ 127 | $ 176 | $ 29 | |||||||
Net sales for HD Supply outside the United States were $460 million, $469 million, $225 million, and $282 million in fiscal 2009, in fiscal 2008, in the period from August 30, 2007 to February 3, 2008, and in the period from January 29, 2007 to August 29, 2007, respectively. Long-lived assets of HD Supply outside the United States were $30 million and $45 million as of January 31, 2010 and February 1, 2009, respectively.
NOTE 18 – SUBSIDIARY GUARANTORS
The Company has issued 12.0% Senior Notes and 13.5% Senior Subordinated Notes (collectively the “Notes”) guaranteed by certain of its subsidiaries (the “Guarantor Subsidiaries”). The Guarantor Subsidiaries are direct or indirect wholly-owned domestic subsidiaries of the Company. The guarantees are full and unconditional, to the extent allowed by law, and joint and several. The subsidiaries of the Company that do not guarantee the Notes (“Non-guarantor Subsidiaries”) are direct or indirect wholly-owned subsidiaries of the Company and are made up of the Company’s operations in Canada and a subsidiary in the United States.
The following supplemental financial information sets forth, on a consolidating basis, the condensed statements of operations, the condensed balance sheets, and the condensed statements of cash flows for the parent company issuer of the Notes (the “Parent Issuer”), for the Guarantor Subsidiaries and for the Non-guarantor Subsidiaries and total consolidated HD Supply, Inc. and subsidiaries (amounts in millions):
109
Table of Contents
Index to Financial Statements
HD SUPPLY, INC.
NOTES TO CONSOLIDATED AND COMBINED FINANCIAL STATEMENTS
(Continued)
CONDENSED CONSOLIDATING INCOME STATEMENTS
| SUCCESSOR | Fiscal Year Ended January 31, 2010 | |||||||||
| Parent Issuer |
Guarantor Subsidiaries |
Non- Guarantor |
Eliminations | Total | ||||||
| Net Sales |
$ – | $ 7,040 | $ 378 | $ – | $ 7,418 | |||||
| Cost of sales |
– | 5,136 | 286 | – | 5,422 | |||||
| Gross Profit |
– | 1,904 | 92 | – | 1,996 | |||||
| Operating expenses: |
||||||||||
| Selling, general and administrative |
87 | 1,516 | 77 | – | 1,680 | |||||
| Depreciation and amortization |
22 | 361 | 3 | – | 386 | |||||
| Restructuring |
– | 29 | (1) | – | 28 | |||||
| Goodwill impairment |
– | 201 | 23 | – | 224 | |||||
| Total operating expenses |
109 | 2,107 | 102 | – | 2,318 | |||||
| Operating Income (Loss) |
(109) | (203) | (10) | – | (322) | |||||
| Interest expense |
679 | 348 | – | (425) | 602 | |||||
| Interest (income) |
(346) | (13) | (66) | 425 | – | |||||
| Other (income) expense, net |
(206) | 7 | (9) | – | (208) | |||||
| Net loss of equity affiliates |
348 | – | – | (348) | – | |||||
| Income (Loss) from Continuing Operations Before Provision (Benefit) for Income Taxes |
(584) | (545) | 65 | 348 | (716) | |||||
| Provision (benefit) for income taxes |
(70) | (160) | 19 | – | (211) | |||||
| Income (Loss) from Continuing Operations |
(514) | (385) | 46 | 348 | (505) | |||||
| Loss from discontinued operations, net of tax |
– | (9) | – | – | (9) | |||||
| Net Income (Loss) |
$ (514) | $ (394) | $ 46 | $ 348 | $ (514) | |||||
| SUCCESSOR | Fiscal Year Ended February 1, 2009 | |||||||||
| Parent Issuer |
Guarantor Subsidiaries |
Non- Guarantor |
Eliminations | Total | ||||||
| Net Sales |
$ – | $ 9,380 | $ 388 | $ – | $ 9,768 | |||||
| Cost of sales |
– | 6,835 | 299 | – | 7,134 | |||||
| Gross Profit |
– | 2,545 | 89 | – | 2,634 | |||||
| Operating expenses: |
||||||||||
| Selling, general and administrative |
103 | 1,878 | 82 | – | 2,063 | |||||
| Depreciation and amortization |
26 | 374 | 3 | – | 403 | |||||
| Restructuring |
1 | 29 | 4 | – | 34 | |||||
| Goodwill impairment |
– | 1,053 | – | – | 1,053 | |||||
| Total operating expenses |
130 | 3,334 | 89 | – | 3,553 | |||||
| Operating Income (Loss) |
(130) | (789) | – | – | (919) | |||||
| Interest expense |
655 | 348 | – | (359) | 644 | |||||
| Interest (income) |
(349) | (12) | – | 359 | (2) | |||||
| Other (income) expense, net |
11 | – | – | – | 11 | |||||
| Net loss of equity affiliates |
901 | – | – | (901) | – | |||||
| Income (Loss) from Continuing Operations Before Provision (Benefit) for Income Taxes |
(1,348) | (1,125) | – | 901 | (1,572) | |||||
| Provision (benefit) for income taxes |
(93) | (225) | – | – | (318) | |||||
| Income (Loss) from Continuing Operations |
(1,255) | (900) | – | 901 | (1,254) | |||||
| Loss from discontinued operations, net of tax |
– | (1) | – | – | (1) | |||||
| Net Income (Loss) |
$ (1,255) | $ (901) | $ – | $ 901 | $ (1,255) | |||||
110
Table of Contents
Index to Financial Statements
HD SUPPLY, INC.
NOTES TO CONSOLIDATED AND COMBINED FINANCIAL STATEMENTS
(Continued)
| SUCCESSOR | Period from August 30, 2007 to February 3, 2008 | |||||||||
| Parent Issuer |
Guarantor Subsidiaries |
Non- Guarantor |
Eliminations | Total | ||||||
| Net Sales |
$ – | $ 4,406 | $ 193 | $ – | $ 4,599 | |||||
| Cost of sales |
– | 3,225 | 147 | – | 3,372 | |||||
| Gross Profit |
– | 1,181 | 46 | – | 1,227 | |||||
| Operating expenses: |
||||||||||
| Selling, general and administrative |
52 | 909 | 40 | – | 1,001 | |||||
| Depreciation and amortization |
3 | 164 | 1 | – | 168 | |||||
| Restructuring |
– | – | – | – | – | |||||
| Goodwill impairment |
– | – | – | – | – | |||||
| Total operating expenses |
55 | 1,073 | 41 | – | 1,169 | |||||
| Operating Income (Loss) |
(55) | 108 | 5 | – | 58 | |||||
| Interest expense |
312 | 38 | – | (61) | 289 | |||||
| Interest (income) |
(37) | (24) | – | 61 | – | |||||
| Other (income) expense, net |
– | – | – | – | – | |||||
| Net (earnings) of equity affiliates |
(47) | – | – | 47 | – | |||||
| Income (Loss) from Continuing Operations Before Provision (Benefit) for Income Taxes |
(283) | 94 | 5 | (47) | (231) | |||||
| Provision (benefit) for income taxes |
(120) | 35 | 2 | – | (83) | |||||
| Income (Loss) from Continuing Operations |
(163) | 59 | 3 | (47) | (148) | |||||
| Loss from discontinued operations, net of tax |
– | (15) | – | – | (15) | |||||
| Net Income (Loss) |
$ (163) | $ 44 | $ 3 | $ (47) | $ (163) | |||||
| PREDECESSOR | Period from January 29, 2007 to August 29, 2007 | |||||||||
| Parent Issuer |
Guarantor Subsidiaries |
Non- Guarantor |
Eliminations | Total | ||||||
| Net Sales |
$ – | $ 6,867 | $ 254 | $ – | $ 7,121 | |||||
| Cost of sales |
– | 5,020 | 200 | – | 5,220 | |||||
| Gross Profit |
– | 1,847 | 54 | – | 1,901 | |||||
| Operating expenses: |
||||||||||
| Selling, general and administrative |
91 | 1,279 | 54 | – | 1,424 | |||||
| Depreciation and amortization |
11 | 98 | 6 | – | 115 | |||||
| Restructuring |
– | – | – | – | – | |||||
| Goodwill impairment |
– | – | – | – | – | |||||
| Total operating expenses |
102 | 1,377 | 60 | – | 1,539 | |||||
| Operating Income (Loss) |
(102) | 470 | (6) | – | 362 | |||||
| Interest expense |
142 | 75 | 4 | – | 221 | |||||
| Interest (income) |
– | – | – | – | – | |||||
| Other (income) expense, net |
– | – | – | – | – | |||||
| Net (earnings) of equity affiliates |
(201) | – | – | 201 | – | |||||
| Income (Loss) from Continuing Operations Before Provision (Benefit) for Income Taxes |
(43) | 395 | (10) | (201) | 141 | |||||
| Provision (benefit) for income taxes |
(99) | 162 | (5) | – | 58 | |||||
| Income (Loss) from Continuing Operations |
56 | 233 | (5) | (201) | 83 | |||||
| Loss from discontinued operations, net of tax |
– | (27) | – | – | (27) | |||||
| Net Income (Loss) |
$ 56 | $ 206 | $ (5) | $ (201) | $ 56 | |||||
111
Table of Contents
Index to Financial Statements
HD SUPPLY, INC.
NOTES TO CONSOLIDATED AND COMBINED FINANCIAL STATEMENTS
(Continued)
CONDENSED CONSOLIDATING BALANCE SHEETS
| January 31, 2010 | ||||||||||
| Parent Issuer |
Guarantor Subsidiaries |
Non- Guarantor |
Eliminations | Total | ||||||
| ASSETS |
||||||||||
| Current assets: |
||||||||||
| Cash and cash equivalents |
$ 479 | $ 8 | $ 52 | $ – | $ 539 | |||||
| Receivables, net |
1 | 785 | 60 | – | 846 | |||||
| Inventories |
– | 959 | 59 | – | 1,018 | |||||
| Deferred tax asset |
50 | 115 | 4 | – | 169 | |||||
| Intercompany receivable |
– | 2 | – | (2) | – | |||||
| Other current assets |
169 | 60 | 1 | – | 230 | |||||
| Total current assets |
699 | 1,929 | 176 | (2) | 2,802 | |||||
| Property and equipment, net |
72 | 373 | 8 | – | 453 | |||||
| Goodwill |
– | 3,132 | 17 | – | 3,149 | |||||
| Intangible assets, net |
– | 1,250 | 3 | – | 1,253 | |||||
| Deferred tax asset |
113 | – | 2 | (115) | – | |||||
| Investment in subsidiaries |
3,413 | – | – | (3,413) | – | |||||
| Intercompany notes receivable |
2,937 | 369 | – | (3,306) | – | |||||
| Other assets |
183 | 4 | 129 | (128) | 188 | |||||
| Total assets |
$ 7,417 | $ 7,057 | $ 335 | $ (6,964) | $ 7,845 | |||||
| LIABILITIES AND STOCKHOLDERS’ EQUITY |
||||||||||
| Current liabilities: |
||||||||||
| Accounts payable |
$ 18 | $ 427 | $ 39 | $ – | $ 484 | |||||
| Accrued compensation and benefits |
14 | 64 | 6 | – | 84 | |||||
| Current installments of long-term debt |
10 | – | – | – | 10 | |||||
| Intercompany payables |
– | – | 2 | (2) | – | |||||
| Other accrued expenses |
170 | 119 | 10 | – | 299 | |||||
| Total current liabilities |
212 | 610 | 57 | (2) | 877 | |||||
| Long-term debt, excluding current installments |
5,877 | – | – | (112) | 5,765 | |||||
| Deferred tax liabilities |
– | 318 | – | (115) | 203 | |||||
| Intercompany notes payable |
369 | 2,937 | – | (3,306) | – | |||||
| Other long-term liabilities |
271 | 53 | 4 | (16) | 312 | |||||
| Total liabilities |
6,729 | 3,918 | 61 | (3,551) | 7,157 | |||||
| Stockholders’ equity |
688 | 3,139 | 274 | (3,413) | 688 | |||||
| Total liabilities and stockholders’ equity |
$ 7,417 | $ 7,057 | $ 335 | $ (6,964) | $ 7,845 | |||||
112
Table of Contents
Index to Financial Statements
HD SUPPLY, INC.
NOTES TO CONSOLIDATED AND COMBINED FINANCIAL STATEMENTS
(Continued)
| February 1, 2009 | |||||||||||||||
| Parent Issuer |
Guarantor Subsidiaries |
Non-Guarantor Subsidiaries |
Eliminations | Total | |||||||||||
| ASSETS |
|||||||||||||||
| Current assets: |
|||||||||||||||
| Cash and cash equivalents |
$ | 698 | $ | 17 | $ | 56 | $ | – | $ | 771 | |||||
| Receivables, net |
35 | 1,034 | 54 | – | 1,123 | ||||||||||
| Inventories |
– | 1,171 | 47 | – | 1,218 | ||||||||||
| Deferred tax asset |
96 | 53 | 5 | – | 154 | ||||||||||
| Intercompany receivable |
– | 1 | – | (1) | – | ||||||||||
| Other current assets |
97 | 49 | 1 | – | 147 | ||||||||||
| Total current assets |
926 | 2,325 | 163 | (1) | 3,413 | ||||||||||
| Property and equipment, net |
90 | 447 | 8 | – | 545 | ||||||||||
| Goodwill |
– | 3,333 | 35 | – | 3,368 | ||||||||||
| Intangible assets, net |
– | 1,511 | – | – | 1,511 | ||||||||||
| Deferred tax asset |
224 | – | – | (224) | – | ||||||||||
| Investment in subsidiaries |
3,673 | – | – | (3,673) | – | ||||||||||
| Intercompany notes receivable |
2,949 | 408 | – | (3,357) | – | ||||||||||
| Other assets |
241 | 10 | – | – | 251 | ||||||||||
| Total assets |
$ | 8,103 | $ | 8,034 | $ | 206 | $ | (7,255) | $ | 9,088 | |||||
| LIABILITIES AND STOCKHOLDERS’ EQUITY |
|||||||||||||||
| Current liabilities: |
|||||||||||||||
| Accounts payable |
$ | 19 | $ | 804 | $ | 47 | $ | – | $ | 870 | |||||
| Accrued compensation and benefits |
17 | 97 | 5 | – | 119 | ||||||||||
| Current installments of long-term debt |
10 | – | – | – | 10 | ||||||||||
| Intercompany payables |
– | – | 1 | (1) | – | ||||||||||
| Other accrued expenses |
122 | 203 | 18 | – | 343 | ||||||||||
| Total current liabilities |
168 | 1,104 | 71 | (1) | 1,342 | ||||||||||
| Long-term debt, excluding current installments |
6,045 | 1 | – | – | 6,046 | ||||||||||
| Deferred tax liabilities |
– | 418 | – | (224) | 194 | ||||||||||
| Intercompany notes payable |
408 | 2,949 | – | (3,357) | – | ||||||||||
| Other long-term liabilities |
307 | 24 | – | – | 331 | ||||||||||
| Total liabilities |
6,928 | 4,496 | 71 | (3,582) | 7,913 | ||||||||||
| Stockholders’ equity |
1,175 | 3,538 | 135 | (3,673) | 1,175 | ||||||||||
| Total liabilities and stockholders’ equity |
$ | 8,103 | $ | 8,034 | $ | 206 | $ | (7,255) | $ | 9,088 | |||||
113
Table of Contents
Index to Financial Statements
HD SUPPLY, INC.
NOTES TO CONSOLIDATED AND COMBINED FINANCIAL STATEMENTS
(Continued)
CONDENSED CONSOLIDATING CASH FLOW STATEMENTS
| SUCCESSOR | Fiscal Year Ended January 31, 2010 | |||||||||
| Parent Issuer |
Guarantor Subsidiaries |
Non- Guarantor |
Eliminations | Total | ||||||
| Net cash flows from operating activities |
$ 51 | $ 16 | $ 13 | $ (11) | $ 69 | |||||
| Cash flows from investing activities |
||||||||||
| (Payments for) proceeds from debt & other investments |
– | 5 | (67) | 62 | – | |||||
| Investments in equity affiliates |
(62) | – | – | 62 | – | |||||
| Proceeds from (payments of) intercompany notes |
12 | 39 | – | (51) | – | |||||
| Other investing activities |
20 | (57) | (4) | – | (41) | |||||
| Net cash flows from investing activities |
(30) | (13) | (71) | 73 | (41) | |||||
| Cash flows from financing activities |
||||||||||
| Equity contribution |
– | – | 51 | (51) | – | |||||
| Borrowings (repayments) of intercompany notes |
(39) | (12) | – | 51 | – | |||||
| Repayments of long-term debt |
(10) | – | – | (62) | (72) | |||||
| Borrowings on long-term revolver |
5 | – | – | – | 5 | |||||
| Repayments of long-term revolver |
(196) | – | – | – | (196) | |||||
| Other financing activities |
– | – | – | – | – | |||||
| Net cash flows from financing activities |
(240) | (12) | 51 | (62) | (263) | |||||
| Effect of exchange rates on cash |
– | – | 3 | – | 3 | |||||
| Net increase (decrease) in cash & cash equivalents |
$ (219) | $ (9) | $ (4) | $ – | $ (232) | |||||
| SUCCESSOR | Fiscal Year Ended February 1, 2009 | |||||||||
| Parent Issuer |
Guarantor Subsidiaries |
Non- Guarantor |
Eliminations | Total | ||||||
| Net cash flows from operating activities |
$ 251 | $ 256 | $ 41 | $ – | $ 548 | |||||
| Cash flows from investing activities |
||||||||||
| Proceeds from sale of a business |
99 | – | – | – | 99 | |||||
| Proceeds from (payments of) intercompany notes |
49 | (146) | – | 97 | – | |||||
| Other investing activities |
(11) | (48) | (3) | – | (62) | |||||
| Net cash flows from investing activities |
137 | (194) | (3) | 97 | 37 | |||||
| Cash flows from financing activities |
||||||||||
| Equity contribution |
10 | – | – | – | 10 | |||||
| Borrowings (repayments) of intercompany notes |
146 | (49) | – | (97) | – | |||||
| Repayments of long-term debt |
(10) | (1) | – | – | (11) | |||||
| Borrowings on long-term revolver |
1,464 | – | – | – | 1,464 | |||||
| Repayments of long-term revolver |
(1,378) | – | – | – | (1,378) | |||||
| Other financing activities |
1 | – | – | – | 1 | |||||
| Net cash flows from financing activities |
233 | (50) | – | (97) | 86 | |||||
| Effect of exchange rates on cash |
– | – | (8) | – | (8) | |||||
| Net increase (decrease) in cash & cash equivalents |
$ 621 | $ 12 | $ 30 | $ – | $ 663 | |||||
114
Table of Contents
Index to Financial Statements
HD SUPPLY, INC.
NOTES TO CONSOLIDATED AND COMBINED FINANCIAL STATEMENTS
(Continued)
| SUCCESSOR | Period from August 30, 2007 to February 3, 2008 | |||||||||
| Parent Issuer |
Guarantor Subsidiaries |
Non- Guarantor |
Eliminations | Total | ||||||
| Net cash flows from operating activities |
$ 84 | $ 259 | $ 21 | $ – | $ 364 | |||||
| Cash flows from investing activities |
||||||||||
| Payments for businesses acquired, net of cash |
(8,183) | – | – | – | (8,183) | |||||
| Proceeds from (payments of) intercompany notes |
278 | 86 | – | (364) | – | |||||
| Other investing activities |
(8) | (63) | (1) | – | (72) | |||||
| Net cash flows from investing activities |
(7,913) | 23 | (1) | (364) | (8,255) | |||||
| Cash flows from financing activities |
||||||||||
| Equity contribution |
2,275 | – | – | – | 2,275 | |||||
| Borrowings (repayments) of intercompany notes |
(86) | (278) | – | 364 | – | |||||
| Proceeds from issuance of debt to fund the Transactions |
6,041 | – | – | – | 6,041 | |||||
| Repayments of long-term debt |
(3) | – | – | – | (3) | |||||
| Borrowings on long-term revolver |
2,125 | – | – | – | 2,125 | |||||
| Repayments of long-term revolver |
(2,366) | – | – | – | (2,366) | |||||
| Other financing activities |
(95) | – | – | – | (95) | |||||
| Net cash flows from financing activities |
7,891 | (278) | – | 364 | 7,977 | |||||
| Effect of exchange rates on cash |
– | – | – | – | – | |||||
| Net increase (decrease) in cash & cash equivalents |
$ 62 | $ 4 | $ 20 | $ – | $ 86 | |||||
| PREDECESSOR | Period from January 29, 2007 to August 29, 2007 | |||||||||
| Parent Issuer |
Guarantor Subsidiaries |
Non- Guarantor |
Eliminations | Total | ||||||
| Net cash flows from operating activities |
$ 554 | $ (140) | $ (6) | $ – | $ 408 | |||||
| Cash flows from investing activities |
||||||||||
| Payments for businesses acquired, net of cash |
– | (25) | (4) | – | (29) | |||||
| Proceeds from (payments of) intercompany notes |
– | 228 | – | (228) | – | |||||
| Other investing activities |
(32) | (75) | (4) | – | (111) | |||||
| Net cash flows from investing activities |
(32) | 128 | (8) | (228) | (140) | |||||
| Cash flows from financing activities |
||||||||||
| Proceeds from long-term borrowing with THD |
24 | – | – | – | 24 | |||||
| Net repayments to THD |
(303) | – | 4 | – | (299) | |||||
| Borrowings (repayments) of intercompany notes |
(228) | – | – | 228 | – | |||||
| Other financing activities |
– | 6 | – | – | 6 | |||||
| Net cash flows from financing activities |
(507) | 6 | 4 | 228 | (269) | |||||
| Effect of exchange rates on cash |
– | – | 1 | – | 1 | |||||
| Net increase (decrease) in cash & cash equivalents |
$ 15 | $ (6) | $ (9) | $ – | $ – | |||||
NOTE 19 – QUARTERLY FINANCIAL DATA (UNAUDITED)
The following is a summary of the quarterly consolidated results of operations from continuing operations for the fiscal years ended January 31, 2010 and February 1, 2009 (amounts in millions):
| Net Sales | Gross Profit | Net Income (Loss) | ||||
| Fiscal Year Ended January 31, 2010: |
||||||
| First Quarter |
$ 1,921 | $ 512 | $ 10 | |||
| Second Quarter |
1,973 | 543 | (89) | |||
| Third Quarter |
1,932 | 515 | (267) | |||
| Fourth Quarter |
1,592 | 426 | (168) | |||
| Fiscal Year 2009 |
$ 7,418 | $ 1,996 | $ (514) | |||
115
Table of Contents
Index to Financial Statements
HD SUPPLY, INC.
NOTES TO CONSOLIDATED AND COMBINED FINANCIAL STATEMENTS
(Continued)
| Net Sales | Gross Profit | Net Income (Loss) | ||||
| Fiscal Year Ended February 1, 2009: |
||||||
| First Quarter |
$ 2,536 | $ 696 | $ (76) | |||
| Second Quarter |
2,744 | 747 | (22) | |||
| Third Quarter |
2,573 | 702 | (91) | |||
| Fourth Quarter |
1,915 | 489 | (1,066) | |||
| Fiscal Year 2008 |
$ 9,768 | $ 2,634 | $ (1,255) | |||
NOTE 20 – SUBSEQUENT EVENTS
Stock based compensation exchange program
The Company’s Option Exchange Program, as described in Note 11, Stock Based Compensation and Employee Benefit Plans, expired on February 2, 2010. On February 3, 2010, as a result of employee elections under the Exchange Program, the Company exchanged and issued the following options:
| Number of Eligible Options Exchanged |
20,484,001 | |
| Number of Repriced Options issued in the Exchange Program |
6,828,025 | |
| Number of New $10.00 Options issued in the Exchange Program |
10,242,002 |
As a result of the exchange, the Company expects to incur incremental stock-based compensation charges of approximately $1 million per year over the next five years. As a result of the Option Exchange Program, the maximum number of shares of common stock that may be issued under the HDS Plan may not exceed 45.3 million, of which a maximum of 20.6 million shares may be issued in respect of options granted under the HDS Plan.
Credit Agreement Amendments and The Home Depot, Inc. Consent
On March 19, 2010, the Company entered into Amendment No. 3 (the “Cash Flow Amendment”) to its $1.3 billion Senior Secured Credit Facility, dated as of August 30, 2007, by and among the Company, Merrill Lynch Capital Corporation, as administrative agent and collateral agent, and the other lenders and financial institutions from time to time party thereto. The Cash Flow Amendment extended the maturity date from August 30, 2012 to April 1, 2014 of approximately $873 million in principal amount of outstanding Term Loans under the Senior Secured Credit Facility. THD, which guarantees payment of the Term Loans under the Senior Secured Credit Facility, consented to the Cash Flow Amendment. Concurrently, THD and the Company entered into an agreement pursuant to which THD consented to any later amendment to the Senior Secured Credit Facility, as amended, (similar in form and substance to the Cash Flow Amendment) that would extend the maturity of the remaining approximately $104 million of outstanding Term Loans to a date that is not later than the maturity date in effect from time to time under the Cash Flow Amendment. In addition, the Company entered into a letter agreement with THD, pursuant to which the Company agreed that, while the THD guarantee is outstanding, the Company would not voluntarily repurchase 12.0% Senior Notes or any 13.5% Senior Subordinated Notes, directly or indirectly, without THD’s prior written consent, subject to certain exceptions, including debt repurchases with equity or permitted refinancings. The Company also agreed to prepay $30 million in aggregate principal amount of non-extending Term Loans under the Senior Secured Credit Facility. The maturity date of the extended outstanding Term Loans may be further extended to a date not later than June 1, 2014, without further consent by the lenders, if THD provides a notice electing to extend its guarantee of the Term Loans to such later date. However, THD is under no obligation to provide such notice or make such election to further extend its guarantee, and the Company cannot provide any assurance that THD will provide such notice or make such election or on what terms it might do so. The remaining outstanding nonextended Term Loans will mature on the original maturity date of such loans, i.e. August 30, 2012. All Terms Loans outstanding under the Senior Secured Credit Facility, as amended, amortize in nominal quarterly installments equal to 0.25% of the original aggregate principal amount of the Term Loans. The Cash Flow Amendment also increased the borrowing margins applicable to the extended portion of the Term Loans by 150 basis points.
On March 19, 2010, the Company also entered into the Limited Consent and Amendment No. 3 (the “ABL Amendment”) to its $2.1 billion Asset Based Lending Credit Agreement (“ABL Credit Facility”), dated as of August 30, 2007, by and among the Company, certain subsidiaries of the Company, GE Business Financial
116
Table of Contents
Index to Financial Statements
HD SUPPLY, INC.
NOTES TO CONSOLIDATED AND COMBINED FINANCIAL STATEMENTS
(Continued)
Services Inc. (formerly known as Merrill Lynch Business Financial Services Inc.), as administrative agent and collateral agent, GE Canada Finance Holding Company, as Canadian administrative agent and Canadian collateral agent, and the several lenders and financial institutions from time to time parties thereto. Pursuant to the ABL Amendment, the Company (i) converted approximately $214 million of commitments under the ABL Credit Facility into a term loan (the “ABL Term Loan”), (ii) extended the maturity date of approximately $1,537 million of the commitments under the ABL Revolving Credit Facility from August 30, 2012 to the later of April 1, 2014 and the maturity date of the extended term loans under the Cash Flow Amendment, and (iii) reduced the total commitments under the ABL Credit Facility by approximately $45 million. The ABL Term Loan does not amortize and the entire principal amount thereof is due and payable on the later of April 1, 2014 and the maturity date of the extended Term Loans under the Senior Secured Credit Facility, as amended. The remaining approximately $304 million of commitments under the ABL Credit Facility matures on the original maturity date of such commitments, i.e. August 30, 2012. In addition, the ABL Amendment provided for a borrowing rate of Prime plus 225 basis points or LIBOR plus 325 basis points applicable to the ABL Term Loan and increased the borrowing margins applicable to the extended portion of the ABL Revolving Credit Facility by 175 basis points and the commitment fee applicable to such portion by 50 basis points.
In connection with the amendments, the Company incurred financing fees of approximately $34 million, of which approximately $32 million will be deferred and amortized into interest expense over the term of the amended facilities.
117
Table of Contents
Index to Financial Statements
ITEM 9A(T). CONTROLS AND PROCEDURES
Disclosure Controls and Procedures
The Company, under the supervision and with the participation of its management, including the Chief Executive Officer and the Chief Financial Officer, evaluated the effectiveness of the design and operation of the Company’s “disclosure controls and procedures” (as defined in Rule 13a-15(e) under the Securities Exchange Act of 1934, as amended (the “Exchange Act”)) as of the end of the period covered by this report. Based on that evaluation, the Chief Executive Officer and the Chief Financial Officer concluded that the Company’s disclosure controls and procedures were effective as of January 31, 2010.
Internal Control over Financial Reporting
There have been changes in the Company’s internal control over financial reporting, as defined in Rules 13a-15(f) and 15(d)-15)f) of the Exchange Act, identified in connection with the evaluation that occurred during the fourth quarter of fiscal 2009 that has materially affected our internal control over financial reporting.
| • | During November 2009, Facilities Maintenance implemented a new system in connection with the implementation of its SAP software platform. The November launch encompasses order entry, customer relationship management, sales, receiving, returns, billing, inventory payables, business intelligence, and purchasing management processes. |
| • | During November 2009, IPVF implemented a new ERP system, Infor SX.e, at its Sunbelt division. Infor SX.e enables Sunbelt to standardize business processes, provide tighter inventory management capabilities, and offer eCommerce services to customers. |
These implementations were not undertaken in response to any identified deficiency or weakness to our internal controls over financial reporting. The new systems, which have undergone rigorous review and testing, have helped strengthen our internal control over financial reporting.
With the exception of the implementations noted above, there were no changes to internal controls in the fourth quarter that have materially affected, or are reasonably likely to materially affect, the Company’s internal control over financial reporting.
This annual report does not include a report on management’s assessment regarding internal control over financial reporting or an attestation report of the Company’s registered public accounting firm due to a transition period established by rules of the SEC for newly public companies. Our management and independent registered public accounting firm did not perform an evaluation of our internal control over financial reporting as of January 31, 2010 in accordance with the provisions of the Sarbanes-Oxley Act of 2002. Had we and our independent registered public accounting firm performed an evaluation of our control over financial reporting in accordance with the provisions of the Sarbanes-Oxley Act of 2002, additional control deficiencies may have been identified by management or our independent registered public accounting firm and those control deficiencies could have also represented one or more material weaknesses.
118
Table of Contents
Index to Financial Statements
PART III
ITEM 10. DIRECTORS, EXECUTIVE OFFICERS AND CORPORATE GOVERNANCE
The following table sets forth the executive officers and directors of HD Supply. The respective age of each individual in the table below is as of April 13, 2010.
| Name |
Age | Position | ||
| Joseph J. DeAngelo |
48 | Chief Executive Officer, Director of Holding and HD Supply | ||
| Mark Jamieson |
56 | Senior Vice President and Chief Financial Officer | ||
| Ricardo Nunez |
45 | Senior Vice President, General Counsel and Corporate Secretary | ||
| Vidya Chauhan |
53 | Senior Vice President, Strategic Business Development | ||
| Michele M. Markham |
47 | Senior Vice President and Chief Information Officer | ||
| Margaret Newman |
41 | Senior Vice President, Human Resources, Marketing & Communications | ||
| Jerry Webb |
52 | President, HD Supply Waterworks | ||
| Anesa Chaibi |
43 | President, HD Supply Facilities Maintenance | ||
| Thomas S. Lazzaro |
46 | President, HD Supply White Cap | ||
| Rick J. McClure |
51 | President, HD Supply Utilities | ||
| Michael L. Stanwood |
57 | President, HD Supply IPVF | ||
| Steven Margolius* |
51 | President, HD Supply Electrical and President, HD Supply Plumbing/HVAC | ||
| Richard Fiechter |
59 | President, HD Supply Repair & Remodel | ||
| Jon Michael Adinolfi |
34 | President, Crown Bolt | ||
| Vasken Altounian |
50 | President, HD Supply Canada | ||
| Andrew J. Liebert |
40 | President, Creative Touch Interiors | ||
| James G. Berges |
62 | Chairman of the Board of Directors of Holding and HD Supply | ||
| Daniel A. Pryor |
42 | Director of Holding and HD Supply | ||
| Stephen M. Zide |
50 | Director of Holding and HD Supply | ||
| David A. Novak |
41 | Director of Holding and HD Supply | ||
| Paul B. Edgerley |
54 | Director of Holding and HD Supply | ||
| Mitchell Jacobson |
59 | Director of Holding and HD Supply | ||
| Todd Newnam |
39 | Director of Holding and HD Supply | ||
| Allan M. Holt |
58 | Director of Holding and HD Supply | ||
| Lew Klessel |
42 | Director of Holding and HD Supply |
* Resigned from his position subsequent to the end of fiscal 2009.
Joseph J. DeAngelo has been Chief Executive Officer since January 2005 and has been a director of Holding and HD Supply since August 30, 2007. Mr. DeAngelo served as Executive Vice President and Chief Operating Officer of Home Depot from January 2007 through August 30, 2007. From August 2005 to December 2006, he served as Senior Vice President—HD Supply. From January 2005 to August 2005, Mr. DeAngelo served as Senior Vice President—Home Depot Supply, Pro Business and Tool Rental and from April 2004 through January 2005, he served as Senior Vice President—Pro Business and Tool Rental. Mr. DeAngelo previously served as Executive Vice President of The Stanley Works, a tool manufacturing company, from March 2003 through April 2004. From 1986 until April 2003, Mr. DeAngelo held various positions with General Electric Company. His final position with GE was as President and Chief Executive Officer of GE TIP/Modular Space, a division of GE Capital. Mr. DeAngelo holds a bachelor’s degree in Accounting and Economics from the State University of New York at Albany.
Mark Jamieson was appointed Senior Vice President and Chief Financial Officer of HD Supply effective October 29, 2007. Prior to joining HD Supply, Mr. Jamieson worked for Ryder Systems as Executive Vice President and Chief Financial Officer from March 2006 to October 2007. Mr. Jamieson served as Chief Financial Officer for Sammons Enterprises in 2005 through March 2006. From 1979 until his employment with Sammons Enterprises, Mr. Jamieson held several positions in General Electric Company, including President and Chief Executive Officer of GE Electric Insurance from 2004 to 2005, VP Finance–GE Industrial Systems from 1998 to 2004, CFO–GE Electrical Distribution & Control from 1995-1998 and CEO GE Lighting Europe from 1993 to 1995. Mr. Jamieson received a B.S. in Business Administration from Cleveland State University.
119
Table of Contents
Index to Financial Statements
Ricardo Nunez has served as Senior Vice President, General Counsel and Corporate Secretary since August 2007, and is responsible for managing our Legal, Real Estate, Loss Prevention, Corporate Security, Business Continuity, and Environmental, Health and Safety operations. Mr. Nunez served as Vice President of Legal Operations of The Home Depot, Inc. from August 2005 to August 2007. Previously, he held leadership positions at General Electric (GE) Energy, which included lead legal counsel responsible for global manufacturing and sourcing, global compliance, and sales of products and services. Prior to joining GE Energy, Mr. Nunez served as counsel at Esso Inter-America Inc., the Exxon affiliate, responsible for downstream operations throughout Latin America and the Caribbean. Mr. Nunez also spent four years at Steel, Hector & Davis, a law firm based in Florida, where he practiced real estate and land use law primarily. He is active in various civic and charitable organizations and currently sits on the board of directors of several of those organizations. Mr. Nunez holds a bachelor’s degree in Economics from the Wharton School at the University of Pennsylvania and a J.D. from Columbia Law School.
Vidya Chauhan has served as Senior Vice President, Strategic Business Development since July 2005. Prior to that, he worked as a consultant to Home Depot from October 2004 to July 2005. Mr. Chauhan pursued personal and other interests between December 2000 and October 2004. Prior to working with Home Depot and HD Supply, he worked at General Electric Company for 18 years, most recently in the position of Vice President and Chief Risk Officer for GE Auto Financial, between 1998 and 2000. Mr. Chauhan has also held several business development and leadership roles within GE Capital Services, Corporate Audit Staff and the Aerospace division between 1982 and 1998. Before commencing his corporate career, Mr. Chauhan was a Lieutenant with the U.S. Navy Submarine Force, where he served for five years as a Nuclear Engineer. He is a graduate of the University of Pennsylvania with a degree in Mathematics and Physics.
Michele M. Markham has served as Senior Vice President and Chief Information Officer since she joined HD Supply in November 2005. Prior to joining HD Supply, Ms. Markham worked for General Electric Infrastructure as Global Indirect Sourcing Manager from June 2004 until November 2005. Ms. Markham was appointed Senior Vice President and Chief Information Officer at GE Capital–TIP/Modular Space from May 2002 until June 2004. From May 1995 until May 2002, she worked at GE Appliances in various Finance and Information Technology leadership roles. From March 1987 until May 1995, Ms. Markham worked at GE Plastics holding Finance, Sales and Information Technology positions. Ms. Markham holds an M.B.A., with a Finance concentration from Union College and holds a B.S. in Computer Science from Siena College.
Margaret Newman has served as Senior Vice President of Human Resources, Marketing and Communications since July 2008, after having joined HD Supply in April 2007. Prior to joining HD Supply, Ms. Newman held senior HR leadership roles at Conseco Insurance Group, from August 2005 to April 2007, and at Sears Roebuck and Company, from September 1997 to August 2005. She has over 19 years of business experience in the manufacturing industry, building her expertise in organizational effectiveness, acquisition and integration, benefits design, talent acquisition and management, leadership development, and employee engagement. Ms. Newman holds a bachelor’s degree in Psychology from Coe College and master’s degree in Sociology from the University of Wisconsin.
Jerry Webb has served as President, HD Supply Waterworks since March 2007. Mr. Webb joined the HD Supply team in connection with the acquisition of National Waterworks Holdings, Inc., by HD Supply in August 2005. Mr. Webb previously served as Vice President of the Southeast Region of National Waterworks and, subsequent to our acquisition of National Waterworks, of HD Supply Waterworks from November 2002 through March 2007. Mr. Webb started his career as a sales representative with Davis Water and Waste Industries from 1986 until 1988, and worked as a Branch Manager from 1988 until 1995. He then served as National Sales Manager of Davis Water between 1995 and 1996. Following the acquisition of Davis by U.S. Filter, Mr. Webb served as Vice President for the Southeast Region of U.S. Filter from 1996 until 2002. Mr. Webb received a B.B.A. degree in Accounting from Valdosta State University.
Anesa Chaibi has served as President, HD Supply Facilities Maintenance since September 2005. Ms. Chaibi served as General Manager of Global Quality and Commercial Operations for GE Water & Process Technologies in 2005. From 2003 until 2005, Ms. Chaibi was General Manager, Global Sourcing at GE Water & Process Technologies, and in 2004, became the General Manager, Global Sourcing for GE Infrastructure. In 2001, Ms. Chaibi joined GE Power Systems as General Manager, Product Management and Operations for the Digital Energy business unit, and in January 2002, she was appointed General Manager for the Advanced Power Systems
120
Table of Contents
Index to Financial Statements
division, a position she held through April 2003. Ms. Chaibi started her career with General Electric in 1989 in the Technical Leadership Program, and held roles of increasing responsibility throughout GE Silicones and GE Plastics until 1995. After receiving her M.B.A. at Duke University in 1997, she returned to General Electric as a manager for Corporate Initiatives in 1998, having worked as a consultant for the CSC Index from 1997 to 1998. Ms. Chaibi received her undergraduate degree in Chemical Engineering from West Virginia University.
Thomas S. Lazzaro was appointed President, HD Supply White Cap effective October 26, 2007. Mr. Lazzaro served as the President of Creative Touch Interiors from August 2006 until March 2009. Prior to joining HD Supply, Mr. Lazzaro held various positions at General Electric Company for over 20 years, most recently as General Manager of Global Sourcing for GE Consumer and Industrial from January 2002 to August 2006. Prior to this role, Mr. Lazzaro served as General Manager for eBusiness at GE Appliances from November 1999 to January 2002. Having successfully completed the GE Financial Management Program and the Experienced Financial Leadership Program, Mr. Lazzaro held additional leadership roles in sales, finance and Six Sigma for various GE Business Units. Mr. Lazzaro holds an M.B.A. with a Finance concentration from Rensselaer Polytechnic Institute and a B.A. in Political Science with a minor in Economics from Colgate University.
Rick J. McClure has served as President, HD Supply Utilities since March 2006. He served in the same position at Hughes Supply from March 2004, and was Vice President of Utilities at Hughes Supply from August 2002 until March 2004. Mr. McClure was President and Chief Executive Officer of Utiliserve from 1997 to August 2002, and spent almost 20 years in leadership roles within Operations Management and Sales & Operations Management at Utiliserve between 1978 and 2002. Mr. McClure holds a degree in Electrical Engineering from the University of Colorado.
Michael L. Stanwood has served as President, HD Supply IPVF since our acquisition of Hughes Supply in March 2006. Prior to March 2006, Mr. Stanwood served as President IPVF for Hughes Supply. Prior to joining Hughes Supply, Mr. Stanwood was President and Owner of Southwest Stainless based in Houston, Texas. Mr. Stanwood led Southwest Stainless for 21 years until its acquisition by Hughes Supply in 1996.
Steven Margolius served as President, HD Supply Electrical from April 2006 to March 2010 and as President, HD Supply Plumbing/HVAC from July 2009 to March 2010. Prior to joining the Company, Mr. Margolius served for five years as Vice President of Finance and Support Services for Arrow Electronics, North American Components Division. In addition to his financial role at Arrow, he led the Logistics organization and served as the leader for the Global Lean Sigma initiative. Mr. Margolius spent 15 years with General Electric Company, most recently serving as the General Manager for Pricing at GE Appliances. While with GE, he held multiple financial leadership roles in the areas of Global Financial Planning and Analysis, Sales and Marketing, and Manufacturing. His GE assignments have been in Europe and the U.S. and spanned the Power Systems, Plastics, Silicones, and Appliances businesses as well as the Corporate Audit Staff. Mr. Margolius is a graduate of the State University of New York and has received additional executive education at the Harvard Business School and the Stanford Business School. Mr. Margolius resigned from his position with the Company effective March 26, 2010, subsequent to the end of fiscal 2009.
Richard Fiechter has served as President, HD Supply, Repair & Remodel since June 2005. During his 26-year tenure with HD Supply and its predecessor companies, Mr. Fiechter has held various positions from Regional Manager to President, including serving as Vice President, General Manager of Contractors’ Warehouse from April 1997 to June 2005. Prior to HD Supply, Mr. Fiechter was employed for 10 years by Payless Cashways, a home improvement products chain in the Midwest. Before Payless, Mr. Fiechter was a protégé of Ron Carver, owner of Carver Lumber, for over four years. Mr. Fiechter completed military service in 1976 as a Drill Sergeant in the United States Army. Mr. Fiechter serves as a director of Satori Academy.
Jon Michael Adinolfi has served as President, Crown Bolt since May 2008. Mr. Adinolfi served as Chief Financial Officer of HD Supply White Cap from October 2006 to April 2008. From May 2005 to October 2006, he held several roles in the Company, including Chief Financial Officer of HD Supply Repair & Remodel, Chief Financial Officer of Crown Bolt, and Director of Sourcing Finance for HD Supply. Prior to joining HD Supply, Mr. Adinolfi held various finance leadership roles with The Stanley Works, a tool manufacturing company, including serving as Leader of Price Realization. Prior to joining The Stanley Works, he was a Senior Auditor at Arthur Andersen. Mr. Adinolfi holds a bachelor’s degree in Accounting from the University of Connecticut and is also a C.P.A.
121
Table of Contents
Index to Financial Statements
Vasken Altounian has served as President, HD Supply Canada since January 2008. Prior to joining the Company, Mr. Altounian was Chief Executive Officer of Rtica Corp., a development stage company in the insulation industry, from March 2007 to December 2007. Prior to joining Rtica Corp., Mr. Altounian spent 24 years with Delta Faucet Company, a division of Masco Corp., where he served as Executive Vice President of Sales and Marketing, globally at Delta Faucet in Indianapolis, from May 2005 to February 2007 and served as President of Delta Faucet Canada from April 1999 to May 2005. Mr. Altounian has a B.E. in Mechanical Engineering from the American University of Beirut, an M.S. in Industrial Engineering from Columbia University and an M.B.A. from Indiana University.
Andrew J. Liebert has served as President of Creative Touch Interiors (“CTI”) since June 2009, following his service as Vice President of CTI beginning in September 2008. Mr. Liebert served as Vice President of Sales for CTI from May 2008 to September 2008, Region Vice President from September 2006 to May 2008, and joined CTI in June 2006 as Director of Sales and Marketing. Prior to joining HD Supply, Mr. Liebert worked for GE Equipment Services where he was Division Vice President from October 2004 to June 2006 and Regional Sales Manager from September 2002 to October 2004. Prior to that, Mr. Liebert worked for GE Appliances where he served as Region Sales Manager from 2000 to 2002 and was a Six Sigma Master Black Belt from 1999 to 2000. Mr. Liebert holds a bachelor’s degree in Organizational Leadership from Purdue University.
David A. Novak became a director of Holding and HD Supply on June 18, 2007. Mr. Novak has served as a financial principal at Clayton, Dubilier, & Rice, Inc. (“CD&R”) since 1997, and partner since 2005. Prior to joining CD&R he worked in the Private Equity and Investment Banking divisions of Morgan Stanley & Co., Inc. and for the Central European Development Corporation, a private equity firm. Mr. Novak holds an M.B.A. from Harvard Business School and is a graduate of Amherst College. He serves as a director of Rexel S.A., BCA and Italtel Holding S.p.A.
Daniel A. Pryor became a director of Holding and HD Supply on June 18, 2007. Mr. Pryor has been a Managing Director of The Carlyle Group, where he is focused on U.S. buyout opportunities in the industrial sector, since 2005. From 1994 to 2005, Mr. Pryor served in various general management, marketing and corporate development positions with Danaher Corporation, most recently as Corporate Vice President. Mr. Pryor received an M.B.A. from Harvard Business School and a B.A. magna cum laude from Williams College. Mr. Pryor serves on the board of several Carlyle portfolio companies.
Stephen M. Zide became a director of Holding and HD Supply on June 18, 2007. Mr. Zide has been a Managing Director of Bain Capital since 2001 and joined the firm in 1997. From 1998 to 2000, Mr. Zide was a Managing Director of Pacific Equity Partners, a strategic partner of Bain Capital in Sydney, Australia. Prior to joining Bain Capital, Mr. Zide was a partner of the law firm of Kirkland & Ellis LLP, where he was a founding member of the New York office and specialized in representing private equity and venture capital firms. Mr. Zide received an M.B.A. from Harvard Business School, a J.D. from Boston University School of Law and a B.A. from the University of Rochester. He serves as a director of Keystone Automotive Operations, Inc., Sensata Technologies B.V. and Innophos Holdings, Inc. Mr. Zide served as a director of Broder Bros., Co. from July 2003 until he resigned in May 2009.
James G. Berges has been the Chairman of the Board of Directors of Holding since August 30, 2007 and of HD Supply since November 19, 2009. Mr. Berges has been an operating partner of Clayton, Dubilier & Rice, Inc. since 2005. Mr. Berges was President of Emerson Electric Co. from 1999 and served as director of Emerson Electric Co. since 1997 until his retirement in 2005. Emerson Electric Co. is a global manufacturer of products, systems and services for industrial automation, process control, HVAC, electronics and communications, and appliances and tools. Mr. Berges holds a B.S. in Electrical Engineering from the University of Notre Dame. He is a director of PPG Industries, Inc., NCI Building Systems, Inc. and Diversey Inc. and chairman of the board of Sally Beauty Holdings, Inc. He also served as director of MKS Instruments, Inc. from February 2002 to May 2007.
Paul B. Edgerley became a director of Holding on August 30, 2007 and of HD Supply on November 19, 2009. Mr. Edgerley is a Managing Director of Bain Capital, where he has worked since 1988. Prior to joining Bain Capital, Mr. Edgerley spent five years at Bain & Company where he worked as a consultant and a manager in the healthcare, information services, retail and automobile industries. Previously he worked at Peat Marwick Mitchell & Company. Mr. Edgerley received an M.B.A., with Distinction, from Harvard Business School and is a Certified Public Accountant. He received a B.S. from Kansas State University. Mr. Edgerley serves as a director of Keystone Automotive Operations, Inc., Sensata Technologies B.V. and Steel Dynamics, Inc.
122
Table of Contents
Index to Financial Statements
Mitchell Jacobson became a director of Holding on October 15, 2007 and of HD Supply on November 19, 2009. Mr. Jacobson has served as Chairman of the Board of Directors of MSC Industrial Direct Co., Inc. (“MSC”) since January 1998. Mr. Jacobson also served as President of MSC from December 1995 until November 2003 and as Chief Executive Officer from December 1995 until November 2005. Mr. Jacobson served as President and Chief Executive Officer of Sid Tool Co., Inc., a wholly-owned subsidiary of MSC, from June 1982 to November 2003, continuing as Chief Executive Officer until November 2005. Mr. Jacobson currently serves on the Board of Directors of Wolfgang Puck Worldwide. In addition, he serves on the Board of Trustees for New York University and the Board of Trustees for New York University School of Law, and is the Chair of the New York University School of Law Foundation Investment Committee. He serves as a Trustee for New York Presbyterian Hospital, as the Chair for New York Presbyterian Hospital Hedge Fund Sub-Committee, and as the Vice Chair of the Committee on Patient Centered Care and Service Quality. Mr. Jacobson is a graduate of Brandeis University and the New York University School of Law.
Todd Newnam became a director of Holding on May 28, 2008 and of HD Supply on November 19, 2009. Mr. Newnam is a Managing Director of The Carlyle Group and in 2008 was named head of the Industrial Buyout Team. From 2000 to 2005, Mr. Newnam worked as a member of Carlyle’s Aerospace and Defense Buyout team and in 2005 helped to establish the Technology Buyout team. Prior to joining The Carlyle Group, Mr. Newnam served as a Vice President in the First Union Securities Inc. M&A Group (formerly Bowles Hollowell Conner & Co.), focusing on the Defense, Aerospace and Technical Services industries. Prior to his position at First Union, Mr. Newnam worked as a financial analyst in the corporate finance department of Salomon Brothers Inc. and for the mergers and acquisitions department of Paine Webber, Inc. in New York. Mr. Newnam earned a B.A. degree in Political Science from Davidson College and received his M.B.A with distinction from Harvard Business School. Mr. Newnam serves on the board of several Carlyle portfolio companies. He also served as director and a member of the Audit Committee of SS&C Technologies Inc. from 2005 to 2008 and a director and a member of the Audit Committee of Jazz Semiconductor, Inc. from 2001 to 2006.
Allan M. Holt became a director of Holding and of HD Supply on June 18, 2007. Mr. Holt, a Partner and Managing Director of The Carlyle Group, is currently the head of the U.S. Buyout team focusing on opportunities in the Aerospace/Defense/Government Services, Automotive & Transportation, Consumer, Healthcare, Industrial, Technology and Telecom/Media sectors. Mr. Holt is a graduate of Rutgers University and received his M.B.A. from the University of California, Berkeley. He serves on the boards of directors of Fairchild Imaging, Inc., HCR Manor Care, Inc., Sequa Corporation, SS&C Technologies, Inc., and Vought Aircraft, Inc., as well as on the non-profit boards of directors of The Barker Foundation Endowment Fund, The Hillside Foundation, Inc., The National Children’s Museum and The Smithsonian National Air and Space Museum. Mr. Holt also served as a director of Aviall, Inc. from December 2001 to September 2006, Loews Cineplex Entertainment Corp. from July 2004 to January 2006 and Standard Aero Holdings, Inc. from August 2004 to August 2007.
Lew Klessel became a director of Holding on October 15, 2007 and of HD Supply on November 19, 2009. Mr. Klessel is an operating partner at Bain Capital where he has worked since 2005. Prior to joining Bain Capital, Mr. Klessel held a variety of operating and strategy leadership positions from 1997 to 2005 at Home Depot, most recently as President of HD Supply Facilities Maintenance. He has also been a strategy consultant with McKinsey & Company and a C.P.A. with Ernst & Young. Mr. Klessel received an M.B.A. from Harvard Business School where he was a Baker Scholar. He received a B.S. from the Wharton School at the University of Pennsylvania and is a Certified Public Accountant. He also serves as a director for Michaels Stores, Inc.
All of the directors of Holding were appointed by the Equity Sponsors pursuant to the Stockholder’s Agreement of Holding dated August 30, 2007, as subsequently amended. Each of the Equity Sponsors is also an affiliate of the Company. On November 19, 2009, Holding and HD Supply took certain corporate actions to align the membership of the two boards of directors.
Our business and affairs are managed under the direction of our Boards of Directors. We currently have ten directors. Our directors hold office until their successors have been elected and qualified or until the earlier of their resignation or removal.
We are a closely held corporation, and there is currently no established public trading market for our common stock.
123
Table of Contents
Index to Financial Statements
As a result of the Transactions, Holding entered into a stockholders agreement with its stockholders which provides that the Equity Sponsors are entitled to elect (or cause to be elected) nine out of ten of Holding’s directors, which includes three designees of each Equity Sponsor. One of the directors designated by the Equity Sponsor associated with Clayton, Dubilier & Rice, Inc. serves as the chairman. Pursuant to an agreement between Clayton, Dubilier & Rice Fund VII, L.P. and Mitchell Jacobson, the fund appointed Mr. Jacobson to serve as a director of Holding for so long as Mr. Jacobson and his immediate family continue to hold certain minimum investments in Holding and certain other conditions are met. See “Item 13. Certain Relationships and Related Transactions, and Director Independence.” As discussed above, the composition of the Board of Directors of Holding mirrors that of HD Supply. There were no material changes in 2009 to the procedures by which security holders may recommend nominees to our Boards of Directors.
When considering whether directors and nominees have the experience, qualifications, attributes or skills, taken as a whole, to enable the Boards of Directors to satisfy its oversight responsibilities effectively in light of our business and structure, the Boards of Directors focused primarily on each person’s background and experience as reflected in the information discussed in each of the directors’ individual biographies set forth immediately above. We believe that our directors provide an appropriate mix of experience and skills relevant to the size and nature of our business. In particular, the members of the Boards of Directors considered the following important characteristics:
| • | Messrs. Berges and Novak are representatives appointed by Clayton, Dubilier & Rice, Inc. and have significant financial and investment experience from their involvement in Clayton’s investment in numerous portfolio companies and have played active roles in overseeing those businesses; |
| • | Mr. Jacobson, our independent director who was also appointed by CD&R, has extensive experience in our industry, including service as Chairman of the Board, Chief Executive Officer and in various other executive positions of a large publicly traded industrial supply company; |
| • | Messrs. Pryor, Newnam and Holt are representatives appointed by The Carlyle Group, and have significant financial and investment experience from their involvement in The Carlyle Group’s investment in numerous portfolio companies and have played active roles in overseeing those businesses; |
| • | Messrs. Zide, Edgerley and Klessel are representatives appointed by Bain Capital Partners LLC (“Bain”), and have significant financial and investment experience from their involvement in Bain’s investment in numerous portfolio companies and have played active roles in overseeing those businesses; and |
| • | Our Chief Executive Officer has extensive experience in our industry, including as a senior executive of the Company and its predecessor since 2004, as well as leadership experience with other leading companies, including General Electric Company. |
In addition, we believe Mr. Berges’ experience in the manufacturing industry, Mr. Pryor’s experience in the general industrial industry, and Mr. Klessel’s experience in the home improvement industry are valuable to our Board of Directors. In addition to private equity, several of the directors representing our Equity Sponsors also have backgrounds in other fields that bring a diversity of experience to our Board, including law -- Mr. Zide, investment banking -- Mr. Newnam, strategy consulting -- Mr. Klessel, and accounting -- Mr. Edgerley. We also value the experience that our directors bring from their other boards. All of our directors serve on the boards of other public companies, including numerous portfolio companies.
Board Structure and Leadership
The composition of the Board of Directors for HD Supply and Holding is the same. The Boards consist of ten directors who have diverse backgrounds and experience and are chaired by James G. Berges.
Committees of the Board of Directors
The Boards of Directors of both Holding and HD Supply have an Audit Committee, Compensation Committee and Executive Committee, the composition of which is the same for each of Holding and HD Supply. The Audit Committees have the responsibility for, among other things, assisting the Board of Directors of HD Supply in reviewing: our financial reporting and other internal control processes; our financial statements; the independent auditors’ qualifications and independence; the performance of our internal audit function and independent auditors; and our compliance with legal and regulatory requirements and our code of business conduct and
124
Table of Contents
Index to Financial Statements
ethics. The Compensation Committees have the responsibility for reviewing and approving the compensation and benefits of our employees, directors and consultants, administering our employee benefits plans, authorizing and ratifying stock option grants and other incentive arrangements and authorizing employment and related agreements. The Executive Committees meet between meetings of the Boards and have the power to exercise all the powers and authority of the Boards with respect to matters delegated to the Committees by the Boards, except for the limitations under Section 144(c) of the Delaware General Corporation Law, and/or applicable limitations under the companies’ organizational documents.
Code of Conduct and Guidelines for Ethical Behavior
Our Boards maintain a Code of Ethics for Senior Financial Officers that applies to our senior financial officers including our principal executive officer, principal financial officer, principal accounting officer, or persons performing similar functions. A copy of the Code of Ethics for Senior Financial Officers is available on our website at www.hdsupply.com/about/CorporateGovernance.asp. We will promptly disclose any future amendments to this code on our website as well as any waivers from this code for executive officers and directors. Copies of this code are also available in print from our Corporate Secretary upon request. We also maintain a Code of Business Conduct and Ethics that governs all of our employees.
Audit Committee and Financial Experts
Our Board of Directors has a separately-designated standing Audit Committee. Messrs. Jacobson, Klessel, and Newnam are the members of the Audit Committee. Mr. Jacobson, an independent director, has been identified as an “audit committee financial expert” as that term is defined in the rules and regulations of the SEC.
ITEM 11. EXECUTIVE COMPENSATION
Overview
The following Compensation Discussion and Analysis provides information regarding the material elements of our fiscal 2009 compensation program for our “named executive officers,” also referred to as the “NEOs.” The NEOs for fiscal 2009 are HD Supply’s principal executive officer, principal financial officer, and the three most-highly compensated executive officers other than the principal executive and financial officers. The Compensation Committees of Holding’s and HD Supply’s Boards (collectively, the “Committee”), pursuant to their charters, are responsible for establishing, implementing and reviewing on an annual basis both our compensation programs and actual compensation paid to our NEOs, except for our Chief Executive Officer, with respect to whom the Committee’s decisions are subject to the review and final approval of Holding’s Board.
Executive Summary
Given continued economic weakness affecting many of our core businesses, the Company’s overall financial performance for fiscal 2009 was below expectations. This performance result impacted executive compensation in the following primary ways:
| • | No salary increases were approved for NEOs in fiscal 2009. |
| • | Because we did not attain company-wide performance goals, neither Mr. DeAngelo nor Mr. Jamieson earned an award under our annual cash incentive program, the Management Incentive Plan (MIP). Ms. Chaibi earned 100% of her target award based on the performance of her line of business. Mr. Stanwood and Mr. Fiechter earned awards under the line of business specific profit sharing plans in which they participate. |
| • | All stock option grants were “underwater” due to the exercise prices for all options exceeding the value of our common stock. |
To recognize key accomplishments during a challenging fiscal 2009 and to restore long-term performance and retention incentives, the Committee took the following actions that affected compensation opportunities of the NEOs:
| • | A minimal level of discretionary bonuses was awarded, including a discretionary bonus of $78,750 to our Chief Financial Officer in recognition of his efforts in a difficult financial environment and $25,000 to Ms. Chaibi in recognition of her overall performance in a down market. |
125
Table of Contents
Index to Financial Statements
| • | A voluntary stock option exchange program was offered beginning in late fiscal 2009 whereby participants (including the NEOs) could elect to exchange outstanding underwater stock options for a lesser number of new stock options at the then current fair market value of our common stock and with a new 5-year vesting schedule and a new 10-year life. |
Determining Executive Compensation
At HD Supply, our Human Resources team drives the design and implementation of all executive compensation programs. Our finance team heavily supports the process by providing financial analytic expertise and input and review of program design. Except with respect to his own compensation, our Chief Executive Officer has final management-level review of any compensation program before it is sent to the Committee for consideration and approval. The Committee has the task of evaluating and approving our material compensation programs, including our equity compensation program. We frequently consult with the Committee during the design process to obtain their direction and feedback on how the design of our executive compensation programs supports the overall strategy of the Company. As described below, data from outside consultants are also used during the design process to obtain further insight into the features of our compensation program.
Philosophy and objectives
Our company is built on the philosophy of “One Team, Driving Customer Success and Value Creation,” a philosophy we believe is best embodied by our SPIRIT values:
| Service: | Help our customers succeed by delivering exceptional service and the best total value experience | |
| Performance: | Exceed our commitments everyday to our team, customers, sponsors and communities | |
| Integrity: | Treat team members the way you would like you and your family to be treated | |
| Respect: | Always do the right thing and always take the high road | |
| Innovation: | Seek new ways to build a reliable, effective and efficient chain of execution for our customers | |
| Teamwork: | Win together by creating an environment where every individual puts the team first | |
The Committee and our management believe that fostering these values requires a performance culture geared toward customer success and sustainable, long-term profitability. The Company’s compensation programs are designed to reward satisfaction of these goals, thereby attracting and retaining talent that will contribute to such a culture. In particular, our executive compensation programs are intended to meet the following objectives:
| • | To balance commitment, long-term financial success, short-term operational excellence and achievement of short-term goals. This balance includes but is not limited to driving profitable growth while aligning our executives’ long term interests with shareholders’ interests. |
| • | To attract, retain and motivate our top executive talent. |
| • | To differentiate rewards based on outstanding individual performance so as to promote a high performance culture. |
In addition, we intend that our compensation programs will be aligned with:
| • | Our business strategy: Our compensation programs link pay to our strategy by rewarding profitability, long-term growth, excellence in achievement of short-term operational and financial goals and by reinforcing the “One Team” philosophy. |
| • | Our shareholders’ interests: Through the strategic use of equity-based compensation, the total compensation of our executives is directly proportional to the sustained value they create for our shareholders. |
126
Table of Contents
Index to Financial Statements
| • | Retention of key talent: To retain the best executive talent, the total compensation opportunity is designed to provide attractive levels of compensation if performance targets are met and upside opportunity when performance targets are exceeded. |
Compensation Consultants and Use of Comparator Data
In fiscal 2009, the Company engaged Pearl Meyer & Partners to provide more comprehensive input with respect to our executive compensation programs including a market review of the competitiveness of total compensation of our executives and a review of our equity program. In the case of our equity program review, the consultant worked directly with our Committee. Beginning in June, Pearl Meyer & Partners began attending Committee meetings.
In general, neither the Company nor the Committee has conclusively relied on any of the data received or obtained specific advice from a consulting firm as to the amount of any particular item of compensation. The consultant provides input which the Company and Committee take into consideration, as the case may be, on the particular element of compensation under consideration.
Comparator Data
The Committee reviews compensation levels and practices at comparator companies in setting the compensation of our NEOs and when reviewing the establishment of the Company’s compensation programs for other associates. The information gathered is used to help the Committee better understand the competitive market and how executives are compensated at other companies similar in size or industry, and companies with whom we compete for talent.
Our unique portfolio model makes finding direct comparators difficult. We seek comparators that share a similar wholesale distribution model or are a direct competitor to a specific line of business within our portfolio.
Companies are therefore included in the comparator group because they (1) operate in the same business as the Company or one of our portfolio companies (wholesale distribution of building supplies), (2) operate in a similar business (distribution of any product), or (3) operate in a similar business model (business to business). The comparator group was developed by management and the Committee and has been used to provide input into both value of total compensation for executives as well as the relative value of each component of compensation. We do not rely on percentile rankings of compensation within the comparator group to determine specific compensation amounts for the NEOs; rather, the comparator group is used to identify programs and levels of pay, which management and the Committee consider when evaluating our own programs and value of those programs.
In fiscal 2009, we used the following comparator group:
| Reason included in the comparator group | ||||||||
| Name of company |
Same business |
Similar business |
Similar business model | |||||
| Arrow Electronics Inc. |
X | |||||||
| Coca-Cola Enterprises |
X | |||||||
| Conagra Foods |
X | |||||||
| Genuine Parts |
X | |||||||
| Interline Brands Inc. |
X | |||||||
| Masco Corp. |
X | |||||||
| Office Depot |
X | |||||||
| Owens & Minor |
X | |||||||
| Pepsi Bottling Group |
X | |||||||
| Staples, Inc. |
X | |||||||
| WESCO International, Inc. |
X | |||||||
| W.W. Grainger, Inc. |
X | |||||||
The comparator group is not intended to be comprehensive and is reviewed and updated each year as appropriate.
127
Table of Contents
Index to Financial Statements
Components of compensation
The Company believes that the compensation programs it maintains are an important key in achieving the compensation goals described above. For fiscal 2009, the principal components of compensation for the named executive officers were:
| • | base salary; |
| • | annual cash incentives and discretionary bonuses; |
| • | equity incentive compensation and; |
| • | benefits and perquisites. |
Except with respect to Mr. Stanwood, each of our NEOs received employment offer letters from us which contain certain employment and severance arrangements. These severance arrangements are discussed more fully below under “Potential Payments on Termination or Change in Control.”
The design of each component of compensation fits into the overall executive pay program and supports the philosophy and objectives previously discussed in the following manner:
| Pay component |
Objective of pay component |
Key measures | ||
| • Base salary |
• Provides reasonable levels of fixed compensation compared with the comparator group |
• Individual performance and contribution
• Scope of responsibilities
• Experience | ||
| • Annual cash incentives and discretionary bonuses |
• Focuses on short-term operational metrics that drive and support our long-term strategy
• Where applicable, creates incentives for performance based on performance of individual NEOs’ businesses
• To reward an executive for superior individual performance against non-financial goals |
• Achievement of agreed to operating plan goals in profitability and cash flow
• Achievement of non-financial goals | ||
| • Equity awards granted in the form of stock options |
• Aligns executive interests to shareholders by rewarding long-term focus on profitability and value creation for the enterprise
• Assists in the retention of key talent
• Creates an “ownership culture” |
• Growth in stock value
• Continued employment through the five year vesting period of the stock options | ||
| • Benefits and Perquisites |
• Benefits provide a safety net of protection in the case of illness, disability or death.
• Perquisites generally enable the executive to perform their duties efficiently and minimize distractions. |
• Benefits are provided to executives on the same basis as provided to our salaried employees.
• Perquisites are valued by our executives at minimal cost to the Company. | ||
A discussion of each of the components of compensation for the NEOs is below, including a discussion of the factors considered in determining the applicable amount payable or achievable under each component.
128
Table of Contents
Index to Financial Statements
Base salary
Base salaries are set to attract and retain top executive talent while managing fixed costs at an appropriate level. The determination of any particular executive’s base salary is based on personal performance and contribution, experience in the role, changes to the scope of responsibilities, market rates of pay and internal equity. Each year, the Chief Executive Officer, with input from Human Resources, proposes base salary increases for all NEOs, excluding himself, based on performance and the Company’s merit increase budget. His proposal is reviewed and approved (with or without modifications) or disapproved by the Committee. Changes to Mr. DeAngelo’s base rate of pay are initiated and approved by the Committee directly, subject to the review and final approval of Holding’s Board.
In fiscal 2009, based on business conditions, management proposed and the Committee approved no merit increases to the base salaries of named executive officers during the annual review process in March 2009. NEO pay except for Ms. Chaibi will be frozen again in fiscal 2010 based on management’s recommendation and Committee approval in early 2010. Ms. Chaibi will receive a 3.9% increase in pay from $385,000 to $400,000. The Committee approved this increase because Ms. Chaibi leads one of our largest and highest-performing businesses and the increase recognized her performance.
Annual cash incentives
Annual cash incentives are designed to focus NEOs to produce superior results against key financial metrics relevant to the Company as a whole or to the individual businesses that the NEO leads. By tying a significant portion of the executive’s total annual cash compensation to annual variable pay, we reinforce our “pay for performance” culture and focus our executives on critical short-term financial and operational objectives which also support our long-term financial goals.
Management Incentive Plan
With the exception of Mr. Stanwood and Mr. Fiechter, all of our NEOs participate in the Management Incentive Plan (“MIP”), which provides cash-based incentives dependent on short-term results against the key financial metrics described below. Under the MIP, a committee, which includes Human Resources personnel, the CFO and the Controller (the “MIP Committee”), is responsible for monitoring the MIP to ensure compliance with its intent and terms and to periodically review and make certain recommendations to the Committee, as discussed below.
MIP target payouts to our NEOs are expressed as a percentage of base salary. Annually, these percentage targets are reviewed against comparator data and adjusted, if necessary, based on the Committee’s estimation of what level of targeted payouts is necessary to retain and motivate our executives. In fiscal 2009, management recommended and the Committee approved no changes to the percentage of base pay targets of any NEO.
For fiscal 2009 as well as 2008, MIP performance targets were based on adjusted EBITDA and cash flow goals. For purposes of the MIP, management fees and related expenses paid to the Equity Sponsors and stock-based compensation costs for stock options are excluded from EBITDA, both as to the targets and as to EBITDA as ultimately determined. In addition, in accordance with the MIP, from time to time throughout the year, the MIP Committee may request that the Committee exclude from the EBITDA calculation certain non-recurring items, certain items which are beyond the control of management or certain items which may adversely affect current results but contribute to long-term profitability improvement. For purposes of the MIP, cash flow is adjusted to eliminate the effects of taxes and Company indebtedness, both as to the targets and as to cash flow as ultimately determined.
For fiscal year 2009, we viewed EBITDA and cash flow as the key operating metrics that would drive the value of the business because they drive the related goals of profitability, efficient use of working capital and generation of cash to pay down debt. The EBITDA and cash flow goals are weighted evenly. The MIP provides a threshold level (at which 25% of the target percentage of base salary is earned), a target (or “plan”) level (at which 100% of the target percentage of base salary is earned), and a maximum level for superior results (at which an additional 50% of the target percentage of base salary may be earned). The threshold for cash flow and EBITDA is set at 80% of our operating plan, as year-over-year performance can vary based on the strategy of the business unit and volatility of the markets in which our businesses operate.
129
Table of Contents
Index to Financial Statements
| EBITDA 50% Weighting |
Cash Flow 50% Weighting | |||||||
| Performance Required |
Payout % Earned |
Performance Required |
Payout % Earned | |||||
| Threshold |
Achieve 80% of Plan |
25% | Achieve 80% of Plan |
25% | ||||
| Plan |
Achieve 100% of Plan |
100% | Achieve 100% of Plan |
100% | ||||
| Maximum |
Achieve 125% of Plan |
150% | Achieve 125% of Plan |
150% | ||||
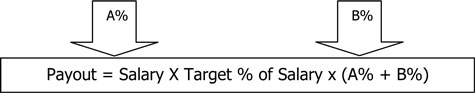
For fiscal 2009, the operating plan goals for the Company as a whole were $540 million with respect to EBITDA and $700 million with respect to cash flow. The Committee, in approving these plan goals in February 2009, viewed these levels as aggressive in light of the continued challenges in the economy and the volatility in both the residential and commercial construction markets.
We did not reach company-wide threshold levels of performance against either metric in fiscal 2009. Because Mr. DeAngelo and Mr. Jamieson earn an incentive award based on the performance of the company as a whole, neither earned a payout for fiscal 2009. Ms. Chaibi earned a payout under the MIP because, as President of a business, her payout was based on the performance of her individual business (Facilities Maintenance) rather than on the Company as a whole. For 2009, Facilities Maintenance financial goals were $289 million with respect to EBITDA and $258 million with respect to cash flow. Performance against those targets was 96.5% of EBITDA goal and 107% of Cash Flow goal.
Fiscal 2009 performance resulted in the following payments being made to our NEOs who participate in the MIP:
| Target % (expressed as a % of base salary) |
EBITDA payout % earned |
Cash flow payout % earned |
Aggregate MIP payment | ||||||
| Joseph J. DeAngelo |
125% | 0% | 0% | $ | 0 | ||||
| Mark Jamieson |
75% | 0% | 0% | $ | 0 | ||||
| Anesa Chaibi |
60% | 87% | 114% | $ | 231,000 | ||||
2010 MIP Award
In 2010, the MIP will have two changes. First, cash flow will be removed as a metric and EBITDA will be used as the sole performance measure. This is to ensure singular focus on the metric that drives company value most directly. Though removed as a metric, cash flow will still be taken into consideration through the addition of a cash gap days metric (the number of days between when cash is paid by the Company for inventory and when cash comes into the Company from a purchaser of that inventory) as an award modifier.
A cash gap days target will be set based on the greater of 2010 fiscal year operating plan or 2009 actual cash gap days. As long as performance is better than this target, no modification will be made to the incentive payout earned. However, should cash gap days actual performance be greater than the target value, final payout will be reduced up to 100% should cash gap days increase 150% over target.
IPVF Annual Incentive Compensation Plans
Mr. Stanwood participates in two annual incentive plans specific to his business, IPVF. The first is the IPVF Annual Incentive Compensation Plan. Under this plan, Mr. Stanwood receives 0.8577% of the EBITA earned by IPVF. Mr. Stanwood also participates in the Additional Incentive Compensation Plan, a quarterly incentive
130
Table of Contents
Index to Financial Statements
program that rewards the accomplishment of short-term growth initiatives. This quarterly incentive program pools 2% of IPVF EBITA each month. At the end of each quarter, Mr. Stanwood receives 10.3% of the pool created. These plans are a cultural fixture of IPVF and reflect the compensation philosophy of that business (i.e. lower than market base salary rates with higher than market annual variable compensation). This structure allows this business to maintain jobs while keeping its fixed costs low even in times of significant turbulence in the commodities markets. Only select IPVF associates participate in the same plan as Mr. Stanwood.
Repair & Remodel Annual Incentive Plan
Mr. Fiechter participates in one annual incentive plan specific to his business, Repair & Remodel. Under the Repair & Remodel Profit Sharing Plan, 6% of EBITDA is contributed to the pool up to 10% of invested capital plus 9% of EBITDA exceeding 10% of invested capital. Unprofitable and/or non-operating stores are excluded from the pool calculation to encourage growth of the business. Management of Repair & Remodel share the pool created based on pre-determined pool percentages. Mr. Fiechter receives 22.5% of the total pool. Extraordinary charges beyond the control of Repair & Remodel Management may also be excluded with the approval of the Committee.
Discretionary Bonus
The Committee believes it is appropriate to reward exemplary employee efforts despite the fact that we did not achieve our budgeted financial performance for the year. To determine when a discretionary bonus is appropriate and the amount of the bonus, the CEO reviews annual accomplishments, determines difficulty of achievement and impact to the business and presents his recommendations to the Committee. Based on this review, the CEO recommended and the Committee approved a $78,750 discretionary bonus to Mr. Jamieson (20% of his target payout) and $25,000 to Ms. Chaibi.
Equity Incentive Compensation
Our NEOs participate in Holding’s Stock Incentive Plan (the “Stock Plan”). The Stock Plan was adopted by Holding’s Board of Directors shortly following our divestiture from Home Depot. Holding established the Stock Plan because it viewed the awards under the Stock Plan as the most effective way to align executive performance to our key goal of increasing value for Holding’s shareholders. The view of the Holding Board of Directors was that, assuming that our management is successful in increasing the value of the Company, awards under the Stock Plan will have the highest potential value for all participants as a percentage of total compensation. Under the Stock Plan, our NEOs were granted options to purchase shares of Holding common stock and were also offered the opportunity to purchase additional Holding common shares. The program makes “founding owners” of our NEOs and is intended to motivate them to increase the value of the Company, and therefore Holding’s share price, over time. These one-time upfront grants to our NEOs were made on December 21, 2007.
The Holding Board of Directors believed the best way to accomplish these goals was to provide one up-front grant of stock options with a significant vesting period and, at the same time, the opportunity to purchase Holding shares. The vesting component was intended to maximize the retentive effect of the Stock Plan. The up-front nature of the option grants was intended to position our executives for the highest possible return (because, if the share value of Holding increases over time, annual or other periodic grants would have higher strike prices and, therefore, less intrinsic value to our executives).
The Committee does not intend to make routine annual grants to any of our NEOs or other employees. The Committee will consider making grants in the case of new hires or promotions.
2010 Option Exchange Program
Given the significant decline in the value of our common stock, all stock options outstanding were underwater during fiscal 2009. As a result, the options were providing limited performance or retention value.
To address this, on January 15, 2010, the Committee approved a voluntary Option Exchange Program to provide each option holder (including NEOs) the opportunity to exchange their existing options for a new option grant. Under the terms of the option exchange program, options with a strike price greater than $10 could be exchanged 3:2 for options with a strike price of $4.15, the fair market value of our stock at the time of grant. The new options have a new 5-year vesting period from the grant date and expire after 10 years. To participate, the option holder also had to agree to exchange options with a $10 strike price for the same number of options at the same
131
Table of Contents
Index to Financial Statements
strike price ($10) but with a new 5-year vesting period from the grant date and a 10-year term. The program was completed in early fiscal 2010 and new grants under this program were made on February 3, 2010. Additional information regarding the Stock Plan and this option exchange can be found in the information accompanying the Summary Compensation Table and related tables below.
Benefits and Perquisites
With the exception of the perquisites described below, benefits provided to our NEOs are the same as those generally provided to our other salaried employees and include medical, vision and dental insurance, basic life insurance and accidental death and dismemberment insurance, short and long term disability insurance and a 401k plan.
Our executives participate in a limited number of perquisite programs. We maintain these programs because they are valued by our NEOs but impose relatively little cost on the Company.
All of the NEOs participate in the Company’s Executive Death Benefit Plan. Under this plan, the beneficiary of a participant who dies while employed by the Company is entitled to a lump sum payment of $500,000. The Company has purchased and owns life insurance contracts on each of the NEOs for the purpose of funding this benefit.
The NEOs are also offered Supplemental Term Life Insurance. This plan provides participants with 20-year level premium term life insurance, with coverage in $500,000 increments up to $5,000,000. The participant owns the policy, and the Company pays the premium on his or her behalf. The value of the premium is fully taxable. At the end of the year, each participant receives an additional payment equal to the gross amount of taxes paid on the benefit. This additional payment is also fully taxable and is not grossed up. Of the NEOs, only Mr. Fiechter participates in this benefit.
Other benefits provided to our NEOs include company cars, executive physicals and reimbursement for financial services. The value of providing company cars is fully taxable and is fully grossed up. Reimbursement for financial services is also fully taxable, and an additional payment is made to cover a portion of the associated taxes, in the same manner as described above with respect to term life insurance.
Tax and accounting considerations
While the accounting and tax treatment of compensation generally has not been a consideration in determining the amounts of compensation for our executive officers, the Committee and management have taken into account the accounting and tax impact of various program designs to balance the potential cost to the Company with the value to the executive.
The expenses associated with executive compensation issued to our executive officers and other key associates are reflected in our financial statements. The Company accounts for stock-based programs in accordance with the requirements of ASC 718, which requires companies to recognize in the income statement the grant date value of equity-based compensation issued to associates.
Compensation committee interlocks and insider participation
The Compensation Committee for each of Holding and HD Supply currently consists of Steven Zide (Chairman), Todd Newnam and David Novak. All committee members are representatives from the equity owners of HD Supply. Mr. Zide is an executive of Bain Capital, Mr. Newnam is an executive of The Carlyle Group and Mr. Novak is an executive of Clayton Dubilier & Rice, Inc.
Executive compensation
Summary Compensation Table for Fiscal 2009
The following table sets forth the compensation of our Chief Executive Officer, Chief Financial Officer and the three other most highly compensated executive officers for services rendered with respect to the Company in all capacities for fiscal 2009 and 2008.
132
Table of Contents
Index to Financial Statements
| Name and Principal Position |
Year | Salary
$ |
Bonus $(1) |
Option Awards $(2) |
Non-Equity Incentive Plan Compensation $(3) |
All
Other Compensation $(4) |
Total
$ | |||||||
| Joseph J. DeAngelo |
2009 | 875,000 | 0 | 0 | 0 | 22,590 | 897,590 | |||||||
| Chief Executive Officer |
2008 | 875,000 | 0 | 0 | 546,875 | 3,899,272 | 5,321,147 | |||||||
| Mark Jamieson |
2009 | 525,000 | 78,750 | 0 | 0 | 29,278 | 633,028 | |||||||
| Senior Vice President and Chief Financial Officer |
2008 | 525,000 | 71,125 | 0 | 196,875 | 67,255 | 860,255 | |||||||
| Michael L. Stanwood |
2009 | 300,000 | 0 | 0 | 1,213,067 | 2,224 | 1,515,291 | |||||||
| President – IPVF |
2008 | 300,000 | 0 | 0 | 1,756,189 | 2,475 | 2,058,664 | |||||||
| Anesa Chaibi |
2009 | 414,600 | 25,000 | 0 | 231,000 | 37,208 | 707,808 | |||||||
| President – Facilities Maintenance |
2008 | 357,300 | 162,500 | 0 | 249,480 | 481,146 | 1,250,426 | |||||||
| Richard Fiechter |
2009 | 242,200 | 0 | 0 | 286,555 | 49,466 | 578,221 | |||||||
| President – Repair & Remodel |
2008 | 249,600 | 0 | 0 | 354,247 | 234,399 | 838,246 | |||||||
| (1) | Bonus amount includes: (a) discretionary bonuses of $78,750 and $71,125 paid to Mr. Jamieson for fiscal years 2009 and 2008 respectively; (b) a discretionary bonus of $25,000 paid to Ms. Chaibi for fiscal year 2009; (c) a retention payment of $162,500 paid in March 2008 to Ms. Chaibi pursuant to a retention agreement with Home Depot following an acquisition by Home Depot in March 2006. See “Compensation Discussion and Analysis – Components of compensation – Annual cash incentives” for a discussion of the fiscal 2009 discretionary bonus to Mr. Jamieson. |
| (2) | A one time option grant was made in December 2007 pursuant to the Stock Incentive Plan in connection with the Transactions. No options were granted to the NEOs in fiscal years 2008 or 2009. |
| (3) | Non-equity incentive plan compensation reflects amount paid under the MIP for all NEOs except Mr. Stanwood who participates in the IPVF plan and Mr. Fiechter who participates in the Repair & Remodel plan. Mr. Stanwood’s 2008 non-equity incentive plan compensation has been revised to reflect all amounts earned under the IPVF Additional Incentive Compensation Plan for fiscal 2008 performance. See “Compensation Discussion and Analysis – Components of compensation – Annual cash incentives” for a discussion of the incentive compensation plans in fiscal 2009. |
| (4) | The All other compensation column is made up of the following amounts for fiscal 2009: |
| All Other Compensation | ||||||||||||||
| Name |
Partial tax gross up for taxes owed on perquisites |
Use of a company car |
Supplemental term life insurance premium |
Financial Planning Assistance |
Credit for spousal medical insurance premiums |
Benefits Premium Subsidy |
Total | |||||||
| Joseph J. DeAngelo |
- | 21,390 | - | - | 1,200 | - | 22,590 | |||||||
| Mark Jamieson |
- | 28,078 | - | - | 1,200 | - | 29,278 | |||||||
| Michael L. Stanwood |
- | 2,224 | - | - | - | - | 2,224 | |||||||
| Anesa Chaibi |
2,965 | 25,043 | - | 8,000 | 1,200 | - | 37,208 | |||||||
| Richard Fiechter |
8,311 | 20,933 | 18,235 | - | 1,200 | 787 | 49,466 | |||||||
133
Table of Contents
Index to Financial Statements
Grants of Plan Based Awards for Fiscal Year 2009
The following table complements the Summary Compensation Table disclosure by providing information concerning non-equity awards granted to the NEOs in the last fiscal year under any plan. No equity awards were granted in the last fiscal year.
| Estimated Possible Payouts
Under Non-Equity Incentive Plan Awards(1) | |||||||||
| Name | Name of Plan | Threshold $ |
Target $ |
Maximum $ | |||||
| Joseph J. DeAngelo |
MIP | 273,438 | 1,093,750 | 1,640,625 | |||||
| Mark Jamieson |
MIP | 98,438 | 393,750 | 590,625 | |||||
| Anesa Chaibi |
MIP | 57,750 | 231,000 | 346,500 | |||||
| Michael L. Stanwood |
IPVF | - | 1,756,189 | (2) | - | ||||
| Richard Fiechter |
Repair & Remodel | - | 354,247 | (3) | - | ||||
| (1) | The MIP plan sets the threshold payout at 25% of the target payout and the maximum payout at 150% of the target payout. A discussion of the MIP in fiscal 2009 is included in the Compensation Discussion and Analysis. |
| (2) | As described in the Compensation Discussion and Analysis, Mr. Stanwood’s incentive plan award is a percentage of EBITA determined by a mathematical calculation. We have included as a target amount what Mr. Stanwood earned under the IPVF plan in the previous fiscal year. |
| (3) | As described in the Compensation Discussion and Analysis, Mr. Fiechter’s incentive plan award is a percentage of EBITDA determined by a mathematical calculation. We have included as a target amount what Mr. Fiechter earned under the Repair & Remodel plan in the previous fiscal year. |
Narrative disclosure to summary compensation table and grant plan based awards table
Stock Plan
Under the Stock Plan in 2007, Holding offered key associates, including the named executive officers, the opportunity to purchase shares of common stock for cash. Holding also made grants of options to purchase shares of common stock.
The options granted to the NEOs in 2007 are shown in the Outstanding Equity Awards at Fiscal Year-End 2009 table below. The Stock Plan and an Associate Stock Option Agreement govern each option award and provide, among other things, that the options vest in equal installments over the first five years of the ten-year option term. Option grants to each participant were divided into five tranches with escalating exercise prices. The first tranche of options, representing 50% of each participant’s total award, has a $10.00 exercise price, and the remaining tranches, each representing 20% of each participant’s total award, have exercise prices of $12.50, $15.00, $17.50 and $20.00, respectively. Prior to the exercise of an option, the holder has no rights as a stockholder with respect to the shares subject to such option, including voting rights and the right to receive dividends or dividend equivalents. See “Potential payments upon termination or change in control” for information regarding the cancellation or acceleration of vesting of stock options upon an option holder’s termination of employment or a change in control of the Company.
As described in the Compensation Discussion and Analysis, the NEOs participated in an option exchange program in which they exchanged the options they received in 2007 for replacement options. The replacement stock options were granted on February 3, 2010. For information about the surrendered options and the replacement option grants to the named executive officers, see Outstanding Equity Awards at Fiscal Year-End 2009.
134
Table of Contents
Index to Financial Statements
Employment Agreement
Except for Mr. Stanwood, each of our named executive officers received employment offer letters. See “Potential Payments on Termination or Change in Control” for a summary of the material provisions of these letter agreements with the Company.
Outstanding Equity Awards at Fiscal Year-End 2009
The following table sets forth the unexercised and unvested stock options held by named executive officers at fiscal year end. Each equity grant is shown separately for each named executive officer. All options held by the named executive officers were granted on December 21, 2007 and based on the terms of the grant, vest and become exercisable in equal annual installments on the first five anniversaries of the closing of the Transactions. No named executive officers hold any stock awards.
As described in the Compensation Discussion and Analysis, we completed an option exchange on February 3, 2010. Information about stock options held subsequent to the option exchange is provided below the table.
| Option Awards | |||||||||
| Name |
Number of Securities Underlying Unexercised Options (#) Exercisable |
Number of Securities Underlying Unexercised Options (#) Unexercisable |
Option Exercise
Price $ |
Option Expiration Date | |||||
| Joseph J. DeAngelo |
741,000 | 1,111,500 | $ | 10.00 | 12/21/2017 | ||||
| 185,250 | 277,875 | $ | 12.50 | 12/21/2017 | |||||
| 185,250 | 277,875 | $ | 15.00 | 12/21/2017 | |||||
| 185,250 | 277,875 | $ | 17.50 | 12/21/2017 | |||||
| 185,250 | 277,875 | $ | 20.00 | 12/21/2017 | |||||
| 1,482,000 | 2,223,000 | ||||||||
| Mark Jamieson |
185,250 | 277,875 | $ | 10.00 | 12/21/2017 | ||||
| 46,313 | 69,469 | $ | 12.50 | 12/21/2017 | |||||
| 46,313 | 69,469 | $ | 15.00 | 12/21/2017 | |||||
| 46,313 | 69,469 | $ | 17.50 | 12/21/2017 | |||||
| 46,313 | 69,469 | $ | 20.00 | 12/21/2017 | |||||
| 370,500 | 555,750 | ||||||||
| Michael L. Stanwood |
135,850 | 203,775 | $ | 10.00 | 12/21/2017 | ||||
| 33,963 | 50,944 | $ | 12.50 | 12/21/2017 | |||||
| 33,963 | 50,944 | $ | 15.00 | 12/21/2017 | |||||
| 33,963 | 50,944 | $ | 17.50 | 12/21/2017 | |||||
| 33,963 | 50,944 | $ | 20.00 | 12/21/2017 | |||||
| 271,700 | 407,550 | ||||||||
| Anesa Chaibi |
160,550 | 240,825 | $ | 10.00 | 12/21/2017 | ||||
| 40,138 | 60,206 | $ | 12.50 | 12/21/2017 | |||||
| 40,138 | 60,206 | $ | 15.00 | 12/21/2017 | |||||
| 40,138 | 60,206 | $ | 17.50 | 12/21/2017 | |||||
| 40,138 | 60,206 | $ | 20.00 | 12/21/2017 | |||||
| 321,100 | 481,650 | ||||||||
| Richard Fiechter |
74,100 | 111,150 | $ | 10.00 | 12/21/2017 | ||||
| 18,525 | 27,788 | $ | 12.50 | 12/21/2017 | |||||
| 18,525 | 27,788 | $ | 15.00 | 12/21/2017 | |||||
| 18,525 | 27,788 | $ | 17.50 | 12/21/2017 | |||||
| 18,525 | 27,788 | $ | 20.00 | 12/21/2017 | |||||
| 148,200 | 222,300 | ||||||||
135
Table of Contents
Index to Financial Statements
As described in the Compensation Discussion and Analysis, participants in the Stock Incentive Plan were offered the opportunity to exchange existing stock options for replacement options. All named executive officers chose to participate in the option exchange program. The table below sets forth the change in options held by the named executive officers as a result of the option exchange program. All replacement stock options were granted on February 3, 2010 and based on the terms of the grant, vest and become exercisable in equal annual installments on the first five anniversaries of the grant date.
| Eligible Options | Replacement Options | |||||||||||||
| Number of Options Eligible for Exchange # |
Option Exercise Price $ |
Option Expiration Date |
Number of Options Received as a Result of Exchange # |
Option Exercise Price $ |
Option Expiration Date | |||||||||
| Joseph J. DeAngelo |
1,852,500 | $ | 10.00 | 12/21/2017 | 1,852,500 | $ | 10.00 | 2/3/2020 | ||||||
| 463,125 | $ | 12.50 | 12/21/2017 | 1,235,000 | $ | 4.15 | 2/3/2020 | |||||||
| 463,125 | $ | 15.00 | 12/21/2017 | - | $ | - | - | |||||||
| 463,125 | $ | 17.50 | 12/21/2017 | - | $ | - | - | |||||||
| 463,125 | $ | 20.00 | 12/21/2017 | - | $ | - | - | |||||||
| 3,705,000 | 3,087,500 | |||||||||||||
| Mark Jamieson |
463,125 | $ | 10.00 | 12/21/2017 | 463,125 | $ | 10.00 | 2/3/2020 | ||||||
| 115,782 | $ | 12.50 | 12/21/2017 | 308,750 | $ | 4.15 | 2/3/2020 | |||||||
| 115,781 | $ | 15.00 | 12/21/2017 | - | $ | - | - | |||||||
| 115,781 | $ | 17.50 | 12/21/2017 | - | $ | - | - | |||||||
| 115,781 | $ | 20.00 | 12/21/2017 | - | $ | - | - | |||||||
| 926,250 | 771,875 | |||||||||||||
| Michael L. Stanwood |
339,625 | $ | 10.00 | 12/21/2017 | 339,625 | $ | 10.00 | 2/3/2020 | ||||||
| 84,907 | $ | 12.50 | 12/21/2017 | 226,417 | $ | 4.15 | 2/3/2020 | |||||||
| 84,906 | $ | 15.00 | 12/21/2017 | - | $ | - | - | |||||||
| 84,906 | $ | 17.50 | 12/21/2017 | - | $ | - | - | |||||||
| 84,906 | $ | 20.00 | 12/21/2017 | - | $ | - | - | |||||||
| 679,250 | 566,042 | |||||||||||||
| Anesa Chaibi |
401,375 | $ | 10.00 | 12/21/2017 | 401,375 | $ | 10.00 | 2/3/2020 | ||||||
| 100,344 | $ | 12.50 | 12/21/2017 | 267,584 | $ | 4.15 | 2/3/2020 | |||||||
| 100,344 | $ | 15.00 | 12/21/2017 | - | $ | - | - | |||||||
| 100,344 | $ | 17.50 | 12/21/2017 | - | $ | - | - | |||||||
| 100,343 | $ | 20.00 | 12/21/2017 | - | $ | - | - | |||||||
| 802,750 | 668,959 | |||||||||||||
| Richard Fiechter |
185,250 | $ | 10.00 | 12/21/2017 | 185,250 | $ | 10.00 | 2/3/2020 | ||||||
| 46,313 | $ | 12.50 | 12/21/2017 | 123,500 | $ | 4.15 | 2/3/2020 | |||||||
| 46,313 | $ | 15.00 | 12/21/2017 | - | $ | - | - | |||||||
| 46,312 | $ | 17.50 | 12/21/2017 | - | $ | - | - | |||||||
| 46,312 | $ | 20.00 | 12/21/2017 | - | $ | - | - | |||||||
| 370,500 | 308,750 | |||||||||||||
Option Exercises and Stock Vested for Fiscal 2009
None of our named executive officers exercised any of their stock options during fiscal 2009. No stock awards have been granted to our named executive officers.
Pension Benefits and Nonqualified Deferred Compensation for Fiscal 2009
We do not provide any defined benefit plans or nonqualified defined contribution plans to our named executive officers.
136
Table of Contents
Index to Financial Statements
Potential Payments on Termination or Change in Control
Pursuant to their employment arrangements entered into in connection with the Transactions, in the event of termination without cause, (1) Mr. Fiechter and Ms. Chaibi would be entitled to not less than 12 months of base pay continuation at a rate of pay not less than their rate of pay on June 5, 2007 and (2) Mr. DeAngelo would be entitled to not less than 24 months of base pay continuation at a rate of pay not less than his rate of pay on May 24, 2007.
Pursuant to his letter agreement, if Mr. Jamieson had been terminated by the Company without Cause (as defined in his letter agreement) on January 31, 2010, he would have been entitled to two years of base pay continuation on HD Supply’s regular payroll cycle.
If the organization experiences a change in control, the vesting of unvested stock options will be accelerated (as defined in the Stock Plan). No NEO would have received a payment or a benefit under any Company compensation or benefit plan if a change in control had occurred on January 31, 2010 because the value of our common stock on such date did not exceed the strike price of the options held by the named executive officers.
Separation payments
Effective October 29, 2007, the Company entered into a letter agreement with Mr. Jamieson which provides for (1) a specified base salary of not less than $525,000, (2) an annual target bonus of 75% of base salary, (3) a signing bonus of $750,000 (subject to a prorated clawback if Mr. Jamieson would have voluntarily resigned prior to October 29, 2009), (4) the right to participate in such other employee or fringe benefit programs for senior executives, including the Stock Plan, and (5) base pay continuation on HD Supply’s regular payroll cycle for 24 months if Mr. Jamieson is terminated involuntarily without Cause (as defined in his letter agreement). The agreement also contains customary confidentiality, non-competition and non-solicitation provisions.
Stock Plan
Under the Stock Plan, an executive’s unvested stock options are canceled upon the termination of his or her employment, except for terminations due to death or disability. Upon death or disability, unvested stock options vest and remain exercisable. In the case of a termination for “cause” (as defined in the Stock Plan), the executive’s unvested and vested stock options are canceled as of the effective date of the termination. Following a termination of employment other than for “cause”, vested options are canceled unless the executive exercises them within 90 days (180 days if the termination was due to death, disability or retirement) or, if sooner, prior to the options’ normal expiration date.
If the termination of employment occurs prior to a public offering, the Company and the Equity Sponsors have the right to purchase any shares of Company common stock that the executive acquired upon the exercise of options. Upon a termination other than for cause (as defined in the Stock Plan), the purchase price share is equal to the fair market value (as defined in the Stock Plan) of the shares on the later of the date (i) the executive’s employment terminated and (ii) that is six months and one day after the shares were purchased by the executive. Upon termination for cause, the purchase price is equal to the lesser of fair market value and the cost of the shares to the executive.
If the Company experiences a change in control (as defined in the Stock Plan), stock options will generally accelerate and be canceled in exchange for a cash payments equal to the change in control price per share minus the exercise price of the applicable option, unless the Board of Directors of Holding elects to provide for alternative awards in lieu of acceleration and payment. The Board of Directors of Holding also has the discretion to accelerate the vesting of options at any time and from time to time.
Under the Stock Plan a “change in control” is the occurrence of:
| • | the acquisition by any person, entity or “group” (as defined in Section 13(d) of the Securities Exchange Act of 1934, as amended) of 50% or more of the combined voting power of the Company’s then outstanding voting securities, other than any such acquisition by the Company, any of its subsidiaries, any associate benefit plan of the Company or any of its subsidiaries, or by the sponsors, or any affiliates of any of the foregoing; |
| • | the merger, consolidation or other similar transaction involving the Company, as a result of which persons who were stockholders of the Company immediately prior to such merger, consolidation, or other similar |
137
Table of Contents
Index to Financial Statements
| transaction do not, immediately thereafter, own, directly or indirectly, more than 50% of the combined voting power entitled to vote generally in the election of directors of the merged or consolidated Company; or |
| • | the sale, transfer or other disposition of all or substantially all of the assets of the Company to one or more persons or entities that are not, immediately prior to such sale, transfer or other disposition, affiliates of the Company. |
A public offering of the Company’s common shares does not constitute a change in control.
ITEM 12. SECURITY OWNERSHIP OF CERTAIN BENEFICIAL OWNERS AND MANAGEMENT
Equity Compensation Plan Information
| Plan category |
Number of securities to be issued upon exercise of outstanding options, warrants and rights |
Weighted-average ($) |
Number of securities remaining available for future issuance under equity compensation plans (excluding securities reflected in column (a)) | |||
| (a) | (b) | (c) | ||||
| Equity compensation plans approved by security holders |
----- | ----- | ----- | |||
| Equity compensation plans not approved by security holders |
||||||
| Stock options granted under the HDS Investment Holding, Inc. Stock Incentive Plan (1) |
20,899,001 | 13.12 | 3,816,788 (1) | |||
| Common stock sold or granted to participants under the HDS Investment Holding, Inc. Stock Incentive Plan (1) |
971,250 | N/A | 27,561,327 (1) | |||
| Deferred Share Units granted to participants under the HDS Investment Holding, Inc. Stock Incentive Plan (1) |
----- | N/A | 27,561,327 (1) | |||
| Total |
21,870,251 | N/A | 27,561,327 (1) | |||
| (1) | Pursuant to the HDS Investment Holding, Inc. Stock Incentive Plan, the board of directors of Holdings is authorized grant or sell, as the case may be, stock options common stock and deferred share units up to a total of 49,431,578 shares of common stock, of which 24,715,789 may be issued in the form of stock options. Accordingly, the amounts set forth in column (c) reflect the maximum number of shares of common stock issuable within each category. However, the maximum number of shares remaining available for future issuance in any combination cannot exceed 27,561,327. See “Item 8. Financial Statements and Supplementary Data – Notes to Consolidated and Combined Financial Statements – Note 11, Stock-based Compensation and Employee Benefit Plans” for a description of the Stock Incentive Plan. |
Security Ownership of Certain Beneficial Owners and Management
HDS Holding Corporation owns all of our outstanding common stock and HDS Investment Holding, Inc. (or “Holding”) owns all of the outstanding common stock of HDS Holding Corporation. As of March 5, 2010, there were 260,971,250 shares of common stock of Holding outstanding. The following table sets forth information as of March 5, 2010 with respect to the ownership of the common stock of Holding by:
| • | each person known to own beneficially more than 5% of the common stock of Holding; |
| • | each director of Holding; |
| • | each of the named executive officers in the Summary Compensation Table above; and |
| • | all executive officers and directors of HD Supply as a group. |
138
Table of Contents
Index to Financial Statements
The amounts and percentages of shares beneficially owned are reported on the basis of SEC regulations governing the determination of beneficial ownership of securities. Under SEC rules, a person is deemed to be a “beneficial owner” of a security if that person has or shares voting power or investment power, which includes the power to dispose of or to direct the disposition of such security. A person is also deemed to be a beneficial owner of any securities of which that person has a right to acquire beneficial ownership within 60 days. Securities that can be so acquired are deemed to be outstanding for purposes of computing such person’s ownership percentage, but not for purposes of computing any other person’s percentage. Under these rules, more than one person may be deemed to be a beneficial owner of the same securities and a person may be deemed to be a beneficial owner of securities as to which such person has no economic interest.
Except as otherwise indicated in the footnotes to this table, each of the beneficial owners listed has, to our knowledge, sole voting and investment power with respect to the indicated shares of common stock. Unless otherwise indicated, the address for each individual listed below is c/o HD Supply, Inc., 3100 Cumberland Boulevard, Suite 1480, Atlanta, Georgia 30339.
| Name and address of beneficial owner |
Number | Percent | ||
| Bain Capital Integral Investors 2006, LLC(1) |
72,943,750 | 27.95 | ||
| Carlyle Partners V, L.P. and related funds(2) |
72,943,750 | 27.95 | ||
| Clayton, Dubilier & Rice Fund VII, L.P. and related funds(3) |
72,923,750 | 27.94 | ||
| THD Holdings, LLC |
32,500,000 | 12.45 | ||
| James G. Berges(6) |
0 | 0 | ||
| Joseph J. DeAngelo(4) |
400,000 | * | ||
| Paul B. Edgerley(5) |
0 | 0 | ||
| Allan M. Holt(7) |
0 | 0 | ||
| Mitchell Jacobson(8) |
8,618,750 | 3.30 | ||
| Lew Klessel(5) |
0 | 0 | ||
| Todd Newnam(7) |
0 | 0 | ||
| David A. Novak(6) |
0 | 0 | ||
| Daniel A. Pryor(7) |
0 | 0 | ||
| Stephen M. Zide(5) |
0 | 0 | ||
| Mark Jamieson(4) |
50,000 | * | ||
| Anesa Chaibi(4) |
20,000 | * | ||
| Michael L. Stanwood(4) |
21,000 | * | ||
| Richard Fiechter(4) |
5,000 | * | ||
| All executive officers of HD Supply and directors of Holding as a group (26 persons) |
11,868,800 | 3.54 |
| * | Less than 1% |
| (1) | Each of Paul Edgerley and Stephen Zide is a Managing Director of BCI and by virtue of this relationship may be deemed to own the shares of Holding held by Bain Capital Integral. Each of Messrs. Edgerley and Zide disclaims beneficial ownership of the shares held by Bain Capital Integral except to the extent of their pecuniary interest therein. The address of Bain Capital Integral is c/o Bain Capital Investors, LLC, 111 Huntington Avenue, Boston, MA 02199. |
| (2) | Represents shares held by the following investment funds associated with The Carlyle Group: Carlyle Partners V, L.P., Carlyle Partners V-A, L.P., CP V Coinvestment A, L.P., and CP V Coinvestment B, L.P., which are together referred to as the “Carlyle Funds.” Carlyle Partners, V, L.P. holds 68,580,768 shares, Carlyle Partners V-A, L.P. holds 1,379,063 shares, CP V Coinvestment A, L.P. holds 2,630,594 shares, and CP V Coinvestment B, L.P. holds 353,325 shares. Investment discretion and control over the shares held by each of the Carlyle Funds is exercised by TCG Holdings, L.L.C. through its indirect subsidiary, TC Group V, L.P., which is the sole general partner of each of the Carlyle Funds. TCG Holdings, L.L.C. is the managing member of TC Group, L.L.C. TC Group, L.L.C. is the sole managing member of TC Group V Managing GP, L.L.C. TC Group V Managing GP, L.L.C is the sole general partner of TC Group V, L.P. TCG Holdings, L.L.C. is managed by a three person managing board, and all board action relating to the voting or disposition of these shares requires approval of a majority of the board. William E. Conway, Jr., Daniel A. D’Aniello and David M. Rubenstein, as the managing members of TCG Holdings, L.L.C., may be deemed to share beneficial |
139
Table of Contents
Index to Financial Statements
| ownership of the shares beneficially owned by TCG Holdings, L.L.C. Such persons disclaim such beneficial ownership. The Carlyle Group’s address is 1001 Pennsylvania Avenue, N.W., Suite 220 South, Washington, D.C. 20004. |
| (3) | Represents shares held by the following group of investment funds associated with or designated by Clayton, Dubilier & Rice, Inc.: (i) 60,000,000 shares of common stock held by Clayton, Dubilier & Rice Fund VII, L.P., whose general partner is CD&R Associates VII, Ltd., whose sole stockholder is CD&R Associates VII, L.P., whose general partner is CD&R Investment Associates VII, Ltd.; (ii) 427,208 shares of common stock held by CD&R Parallel Fund VII, L.P., whose general partner is CD&R Parallel Fund Associates VII, Ltd.; and (iii) 12,496,542 shares of common stock held by Clayton, Dubilier & Rice Fund VII (Co-Investment), L.P., whose general partner is CD&R Associates VII (Co-Investment), Ltd., whose sole stockholder is CD&R Associates VII, L.P., whose general partner is CD&R Investment Associates VII, Ltd. Each of CD&R Investment Associates VII, Ltd. and CD&R Parallel Fund Associates VII, Ltd. is managed by a three-person board of directors, and all board action relating to the voting or disposition of these shares requires approval of a majority of the board. Joseph L. Rice, Donald J. Gogel and Kevin J. Conway, as the directors of CD&R Investment Associates VII, Ltd. and CD&R Parallel Fund Associates VII., Ltd., may be deemed to share beneficial ownership of the shares shown as beneficially owned by the funds associated with Clayton, Dubilier & Rice, Inc. Such persons disclaim such beneficial ownership. |
Each of CD&R Associates VII, Ltd., CD&R Associates VII, L.P. and CD&R Investment Associates VII, Ltd. expressly disclaims beneficial ownership of the shares held by Clayton, Dubilier & Rice Fund VII, L.P., as well as of the shares held by each of Clayton, Dubilier & Rice Fund VII (Co-Investment) L.P. and CD&R Parallel Fund VII, L.P. CD&R Parallel Fund Associates VII, Ltd. expressly disclaims beneficial ownership of the shares held by each of CD&R Parallel Fund VII, L.P., Clayton, Dubilier & Rice Fund VII, L.P. and Clayton, Dubilier & Rice Fund VII (Co-Investment) L.P.
The address for each of Clayton Dubilier & Rice Fund VII, L.P., CD&R Parallel Fund VII, L.P., Clayton, Dubilier & Rice Fund VII (Co-Investment), L.P., CD&R Associates VII (Co-Investment), Ltd., CD&R Associates VII, Ltd., CD&R Associates VII, L.P., CD&R Parallel Fund Associates VII, Ltd. and CD&R Investment Associates VII, Ltd. is c/o Maples Corporate Services Limited, P.O. Box 309, Ugland House, Grand Cayman, KY1-1104, Cayman Islands. The address for Clayton, Dubilier & Rice, Inc. is 375 Park Avenue, 18th Floor, New York, NY 10152.
| (4) | Includes, with respect to: (i) Joseph DeAngelo, 400,000 shares of common stock only; (ii) Mark Jamieson, 50,000 shares of common stock only; (iii) Anesa Chaibi, 20,000 shares of common stock only; (iv) Michael Stanwood, 21,000 shares of common stock only; and (v) Richard Fiechter, 5,000 shares of common stock only. Stock options held by each are not vested (or vesting within 60 days of March 5, 2010). |
| (5) | Does not include 72,943,750 shares of common stock held by Bain Capital Integral. Messrs. Edgerley and Zide are Managing Directors of BCI, which is the managing member of Bain Capital Integral. By virtue of these relationships, each of Messrs. Edgerley and Zide may be deemed to own the shares of Holding held by Bain Capital Integral. Each of Messrs. Edgerley and Zide disclaims beneficial ownership of the shares held by Bain Capital Integral except to the extent of their pecuniary interest therein. |
| (6) | Does not include 72,923,750 shares of common stock held by investment funds associated with or designated by Clayton, Dubilier & Rice, Inc. Messrs. Berges and Novak are directors of Holding and executives of Clayton, Dubilier & Rice, Inc. They disclaim any beneficial ownership of the shares held by investment funds associated with or designated by Clayton, Dubilier & Rice, Inc. |
| (7) | Does not include 72,943,750 shares of common stock held by investment funds associated with or designated by The Carlyle Group. Messrs. Holt, Newnam and Pryor are directors of Holding and executives of The Carlyle Group. They disclaim any beneficial ownership of the shares held by investment funds associated with or designated by The Carlyle Group. |
| (8) | Includes (i) 8,515,000 shares of common stock held by JFI-HDS, LLC; Mr. Jacobson is the managing member of JFI-HDS Partner, LLC which is the managing member of JFI-HDS, LLC, and (ii) 103,750 shares held by JFI-HDS Affiliates, LLC; Mr. Jacobson is the managing member of JFI-HDS Partner, LLC which is the managing member of JFI-HDS Affiliates, LLC. |
140
Table of Contents
Index to Financial Statements
ITEM 13. CERTAIN RELATIONSHIPS AND RELATED TRANSACTIONS, AND DIRECTOR INDEPENDENCE
Under the rules of the SEC, public issuers, such as HD Supply, must disclose certain “Related Person Transactions.” These are transactions in which the Company is a participant where the amount involved exceeds $120,000, and a Director, executive officer or holder of more than 5% of our common stock has a direct or indirect material interest.
Stockholders agreement and stockholder arrangements
In connection with the closing of the Transactions, Holding, the Equity Sponsors and their affiliates and other stockholders of Holding entered into a stockholders agreement that contains, among other things, provisions relating to Holding’s governance, transfer restrictions, tag-along rights, drag-along rights, preemptive rights and certain unanimous approval rights. This stockholders agreement provides that affiliates of the Equity Sponsors who are stockholders of Holding are entitled to elect (or cause to be elected) all of Holding’s directors, which will include three designees of each Equity Sponsor. Our Chief Executive Officer also serves as a director of Holding. One of the directors designated by the Equity Sponsor associated with CD&R serves as the chairman.
Pursuant to an agreement between Clayton, Dubilier & Rice Fund VII, L.P. and Mitchell Jacobson, the fund appointed Mr. Jacobson to serve as a director of Holding for so long as Mr. Jacobson and his immediate family continue to hold certain minimum investments in Holding and certain other conditions are met.
Consulting agreements
In connection with the closing of the Transactions, Holding and we entered into consulting agreements with the Equity Sponsors (or their respective affiliates), pursuant to which the Equity Sponsors provide Holding, us and our subsidiaries with financial advisory and management consulting services. Pursuant to the consulting agreements, we pay the Equity Sponsors an aggregate annual fee of $4.5 million for such services, subject to adjustments from time to time, and we pay to the Equity Sponsors an aggregate fee equal to a specified percentage of the transaction value of certain types of transactions that Holding or we complete, in each case, plus out-of-pocket expenses and subject to approval by the Equity Sponsors, their permitted transferees or their designated affiliates who are shareholders of Holding.
Prior to the Transactions, Clayton, Dubilier & Rice, Inc. entered into a consulting agreement with Mitchell Jacobson for consulting services in connection with the Transactions. Pursuant to an assumption and termination agreement among us, Clayton, Dubilier & Rice, Inc. and Mitchell Jacobson, we assumed responsibility for, among other things, the indemnification of Mitchell Jacobson for his services to CD&R as a consultant under that agreement.
Indemnification agreements
In connection with the Transactions, we entered into indemnification agreements with Holding and the Equity Sponsors pursuant to which, following the completion of the Transactions, Holding and we will indemnify the Equity Sponsors, their respective managers, administrative members and the administrative members or general partners of any other investment vehicle that is our stockholder and is managed by such manager or its affiliates and their respective successors and assigns, and the respective directors, officers, shareholders, partners, members, employees, agents, advisors, consultants, representatives and controlling persons of each of them, or of their partners, shareholders or members in their capacity as such, against certain liabilities arising out of performance of the Transactions, the performance of the consulting agreement, securities offerings by us and certain other claims and liabilities. We and Holding also entered into a similar indemnification agreement with The Home Depot, Inc. providing for indemnification of The Home Depot, Inc., its affiliates, directors, officers, shareholders, partners, members, employees, agents, representatives and controlling persons against certain liabilities arising from securities offerings by us (including this offering).
141
Table of Contents
Index to Financial Statements
Registration rights agreements
Holding entered into a registration rights agreement with the Equity Sponsors and Holding’s minority investors, that grants them certain registration rights and includes customary indemnification provisions. This agreement was substantially performed in 2009 in connection with the registered exchange offer for our 12% Senior Notes and our 13.5% Senior Subordinated Notes completed on August 25, 2009.
Tax sharing agreement
HD Supply is not responsible for the payment or indemnification of any consolidated U.S. federal income taxes while it was a member of the Home Depot federal consolidated group. However, HD Supply is responsible for all U.S. federal income taxes for each member of its current federal consolidated group for any period before such member was part of the Home Depot federal consolidated group. In addition, HD Supply is responsible for all prior-year state and international income taxes of each member of its current consolidated group.
Agreements with Home Depot
Upon the closing of the Transactions, we entered into the following agreements with Home Depot and/or its affiliates:
| • | a Strategic Purchase Agreement, pursuant to which the parties agree to terms relating to (i) the purchase by Home Depot U.S.A., Inc. and its affiliates of certain products from HD Supply Distribution Services, LLC (“Supplier”), a subsidiary of HD Supply, for a term to end no later than January 31, 2015, (ii) related intellectual property matters and (iii) the provision of related services; |
| • | a Supplier Buying Agreement, pursuant to which the parties agree to certain terms and conditions relating to (i) the purchase by Home Depot U.S.A., Inc. and its affiliates of products from Supplier pursuant to the Strategic Purchase Agreement and (ii) the provision of related in-store services and displays; |
| • | a Trademark License granting Supplier the royalty-free right to use a number of trademarks in connection with its activities under the Strategic Purchase Agreement; and |
| • | a Private Label Products License Agreement, pursuant to which a subsidiary of Home Depot grants to HD Supply a license for the use of specified trademarks on the terms set forth in such agreement and for a period that expired on the first anniversary of the Transactions. |
In addition, certain guarantees, surety bonds and letters of credit that Home Depot and/or its affiliates (other than HD Supply, HD Supply Canada, Inc. and their respective affiliates) entered into prior to the closing of the Transactions relate to our and our subsidiaries’ obligations to landlords, customers and suppliers, and remained in place immediately after the closing. Holding agreed in the purchase and sale agreement to fully indemnify Home Depot and its affiliates from any losses that arise out of these obligations. Holding also agreed to use its reasonable best efforts to cause itself and/or one or more of HD Supply and CND Holdings to be substituted for Home Depot and/or its affiliates and to have Home Depot and its affiliates released in respect of certain such obligations.
Debt Securities of the Company
Management of the Company has been informed that, as of January 31, 2010, affiliates of certain of the Equity Sponsors beneficially owned approximately $833 million aggregate principal amount of the Company’s 12.0% Senior Notes due 2014 and $549 million aggregate principal amount of the Company’s 13.5% Senior Subordinated Notes due 2015.
Transactions with Other Related Parties
HD Supply leases several buildings and properties from certain related parties, including an HD Supply executive officer. The leases generally provide that all expenses related to the properties are to be paid by HD Supply. Rents paid under these leases totaled $1 million in fiscal 2009 and less than $1 million in both fiscal 2008 and fiscal 2007.
HD Supply purchased product from affiliates of the Equity Sponsors for approximately $66 million, $59 million, and $8 million in fiscal 2009, in fiscal 2008, and in the period from August 30, 2007 to February 3, 2008,
142
Table of Contents
Index to Financial Statements
respectively. In addition, HD Supply sold product to affiliates of the Equity Sponsors for approximately $3 million in fiscal 2009 and $7 million in fiscal 2008. There were no sales to affiliates of the Equity Sponsors in the period from August 30, 2007 to February 3, 2008. Management believes these transactions were conducted at prices an unrelated third party would pay.
Additional information with respect to transactions with related persons, if any, is contained in “Item 8. Financial Statements and Supplementary Data – Notes to Consolidated and Combined Financial Statements – Note 5, Related Parties.”
Review, Approval or Ratification of Transactions with Related Persons. We have not adopted a formal written policy for the review, approval and ratification of related-person transactions because we are not a listed issuer whose related-person transactions would require such policies. As a Delaware corporation, we are subject to Section 144 of the Delaware General Corporation Law, which provides procedures for the approval of interested director transactions, and all such transactions will be reviewed by our Board on an as-needed basis in accordance with Delaware law, our Code of Business Conduct and Ethics and our Code of Ethics for Senior Executive and Financial Officers.
Promoters and Certain Control Persons. Not applicable.
Director Independence. Though not formally considered by our Board because our common stock is not listed on a national securities exchange, under the listing standards of the New York Stock Exchange, we believe that Mr. Jacobson would be considered “independent.” Mr. Jacobson serves on the Audit Committee. Except for Mr. Jacobson, none of the other directors serving on the Board or the Audit Committee, Compensation Committee and Executive Committee are independent.
ITEM 14. PRINCIPAL ACCOUNTING FEES AND SERVICES
PricewaterhouseCoopers LLP acts as HD Supply’s principal auditor and also provides certain audit-related, tax and other services. The Audit Committee has established a pre-approval policy for services to be performed by PricewaterhouseCoopers. Under this policy, the Audit Committee approves engagements when the engagements have been presented in reasonable detail to the Audit Committee before services are undertaken.
The fees for services provided by PricewaterhouseCoopers (all of which were pre-approved by the Audit Committee) to HD Supply in fiscal 2009 and fiscal 2008 were as follows:
Audit Fees
| • | Audit Fees were $2.3 million and $1.9 million for fiscal 2009 and fiscal 2008, respectively. Included in this category are fees for the annual financial statement audit, quarterly financial statement reviews, employee benefit plans, and SEC registration statements. |
Audit-Related Fees
| • | Audit-Related Fees were $0.7 million and $0.1 million for fiscal 2009 and fiscal 2008, respectively. These fees, which are for assurance and related services other than those included in Audit Fees, include charges for consultations concerning financial accounting and reporting standards and assessment and testing of and making recommendations for improvements in internal control over financial reporting. |
Tax Fees
| • | Tax Fees were $1.0 million and $0.7 million for fiscal 2009 and fiscal 2008, respectively. These fees include charges for various Federal, state, local and international tax compliance and research projects. |
All Other Fees
| • | There were no Other Fees for fiscal 2009 and fiscal 2008. |
143
Table of Contents
Index to Financial Statements
PART IV
ITEM 15. EXHIBITS AND FINANCIAL STATEMENT SCHEDULES
| (a)(1) | Financial Statements |
The following financial statements are set forth in Item 8 hereof:
| – | Report of Independent Registered Public Accounting Firms; |
| – | Consolidated Statements of Operations for (i) the fiscal year ended January 31, 2010, (ii) the fiscal year ended February 1, 2009 and (iii) the period from August 30, 2007 to February 3, 2008 (Successor Periods); |
| – | Combined Statement of Operations for the period from January 29, 2007 to August 29, 2007 (Predecessor Period); |
| – | Consolidated Balance Sheets as of January 31, 2010 and February 1, 2009 (Successor Periods); |
| – | Consolidated Statements of Stockholders’ Equity and Comprehensive Income for (i) the fiscal year ended January 31, 2010, (ii) the fiscal year ended February 1, 2009 and (iii) the period from August 30, 2007 to February 3, 2008 (Successor Periods); |
| – | Combined Statement of Owner’s Equity and Comprehensive Income for the period from January 29, 2007 to August 29, 2007 (Predecessor Period); |
| – | Consolidated Statements of Cash Flows for (i) the fiscal year ended January 31, 2010, (ii) the fiscal year ended February 1, 2009 and (iii) the period from August 30, 2007 to February 3, 2008 (Successor Periods); |
| – | Combined Statement of Cash Flows for the period from January 29, 2007 to August 29, 2007 (Predecessor Period); and |
| – | Notes to Consolidated and Combined Financial Statements. |
(b) Exhibit Index
| Exhibit |
Exhibit Description | |
| 2.1 | Purchase and Sale Agreement, dated as of June 19, 2007, by and among The Home Depot, Inc., THD Holdings, LLC, Home Depot International, Inc. and Pro Acquisition Corporation * | |
| 2.2 | Letter Agreement, dated August 14, 2007, by and among The Home Depot, Inc., THD Holdings, LLC, Home Depot International, Inc., Homer TLC, Inc. and Pro Acquisition Corporation * | |
| 2.3 | Amendment No. 3 to Purchase and Sale Agreement, dated as of August 27, 2007, by and among The Home Depot, Inc., THD Holdings, LLC, Home Depot International, Inc., Homer TLC, Inc. and Pro Acquisition Corporation * | |
| 3.1 | Certificate of Incorporation of HD Supply, Inc. * | |
| 3.2 | By-Laws of HD Supply, Inc. * | |
| 4.1 | Indenture, dated as of August 30, 2007, by and among HD Supply, Inc., as Issuer, the Subsidiary Guarantors from time to time parties thereto, and Wells Fargo Bank, National Association, as Trustee, relating to the 12.0% Senior Cash Pay Notes due 2014 * | |
| 4.2 | Merger Supplemental Indenture, dated as of August 30, 2007, by and among HD Supply, Inc. and Wells Fargo Bank, National Association, as Trustee, relating to the 12.0% Senior Cash Pay Notes due 2014 * | |
| 4.3 | Supplemental Indenture in Respect of Subsidiary Guarantee, dated as of August 30, 3007, by and among HD Supply Inc., the Subsidiary Guarantors named therein, and Wells Fargo Bank, National Association, as Trustee, relating to the 12.0% Senior Cash Pay Notes due 2014 * | |
| 4.4 | Third Supplemental Indenture, dated as of October 30, 2007, by and among HD Supply, Inc., the Subsidiary Guarantors parties named therein, and Wells Fargo Bank, National Association, as Trustee, relating to the 12.0% Senior Cash Pay Notes due 2014 * | |
144
Table of Contents
Index to Financial Statements
| Exhibit |
Exhibit Description | |
| 4.5 | Indenture, dated as of August 30, 2007, by and among HD Supply, Inc., as Issuer, the Subsidiary Guarantors from time to time parties thereto, and Wells Fargo Bank, National Association, as Trustee, relating to the 13.5% Senior Subordinated Notes due 2015 * | |
| 4.6 | Merger Supplemental Indenture, dated as of August 30, 2007, by and among HD Supply, Inc. and Wells Fargo Bank, National Association, as Trustee, relating to the 13.5% Senior Subordinated Notes due 2015 * | |
| 4.7 | Supplemental Indenture in Respect of Subsidiary Guarantee, dated as of August 30, 3007, by and among HD Supply Inc., the Subsidiary Guarantors named therein, and Wells Fargo Bank, National Association, as Trustee, relating to the 13.5% Senior Subordinated Notes dues 2015 * | |
| 4.8 | Third Supplemental Indenture, dated as of October 30, 2007, by and among HD Supply, Inc., the Subsidiary Guarantors parties named therein, and Wells Fargo Bank, National Association, as Trustee, relating to the 13.5% Senior Subordinated Notes due 2015 * | |
| 4.9 | Form of 12.0% Senior Cash Pay Note due 2014 of HD Supply, Inc. (included in Exhibit 4.1 hereto) * | |
| 4.10 | Form of 13.5% Senior Subordinated Note due 2015 of HD Supply, Inc. (included in Exhibit 4.5 hereto) * | |
| 4.11 | Exchange and Registration Rights Agreement, dated as of August 30, 2007, by and among HD Supply, Inc. (successor by merger to HDS Acquisition Subsidiary, Inc.), J.P. Morgan Securities Inc. and the other financial institutions named therein, relating to the 12.0% Senior Cash Pay Notes due 2014 * | |
| 4.12 | Exchange and Registration Rights Agreement, dated as of August 30, 2007, by and among HD Supply, Inc. (successor by merger to HDS Acquisition Subsidiary, Inc.), J.P. Morgan Securities Inc. and the other financial institutions named therein, relating to the 13.5% Senior Subordinated Notes due 2015 * | |
| 10.1 | Credit Agreement, dated as of August 30, 2007, by and among HDS Acquisition Subsidiary, Inc., to be merged with and into HD Supply, Inc., as borrower, the several lenders from time to time parties thereto, Merrill Lynch Capital Corporation, as administrative agent and collateral agent, Lehman Brothers Inc. and J.P. Morgan Securities Inc., as co-syndication agents, JPMorgan Chase Bank, N.A., as issuing lender, and Merrill Lynch, Pierce, Fenner & Smith Incorporated, Lehman Brothers Inc., and J.P. Morgan Securities Inc., as joint lead arrangers and joint bookrunning managers * | |
| 10.2 | Amendment and Waiver No. 1 to the Credit Agreement (referred to above), dated as of October 2, 2007, by and among HD Supply, Inc., as successor by merger to HDS Acquisition Subsidiary, Inc., as borrower, Merrill Lynch Capital Corporation, as administrative agent and collateral agent for the lenders and the lenders party thereto * | |
| 10.3 | Amendment No. 2 to the Credit Agreement (referred to above), dated as of November 1, 2007, by and among HD Supply, Inc., as successor by merger to HDS Acquisition Subsidiary, Inc., as borrower, Merrill Lynch Capital Corporation, as administrative agent and collateral agent for the lenders and the lenders party thereto * | |
| 10.4 | Amendment No. 3 to Credit Agreement, dated as of March 19, 2010, by and among HD Supply, Inc., as borrower, Merrill Lynch Capital Corporation, as administrative agent and collateral agent for the lenders, HDS Holding Corporation and the guarantors and the lenders party thereto | |
| 10.5 | Consent to Amendment to Credit Agreement, dated as of March 19, 2010, by and among The Home Depot, Inc. and HD Supply, Inc. | |
| 10.6 | Letter Agreement, dated as of March 19, 2010, by and among The Home Depot, Inc. and HD Supply, Inc. | |
| 10.7 | Consent, dated as of March 19, 2010, by and among The Home Depot, Inc. and HD Supply, Inc. | |
| 10.8 | ABL Credit Agreement, dated as of August 30, 2007, by and among HDS Acquisition Subsidiary, Inc., as successor by merger to HD Supply, Inc., as parent borrower, the several Canadian borrowers from time to time party thereto, the several subsidiary borrowers from time to time party thereto, the several lenders from time to time party thereto, Merrill Lynch Capital, a division of Merrill Lynch Business Financial Services, Inc., as administrative agent and U.S. ABL collateral agent, Lehman Brothers Inc. and J.P. Morgan Securities Inc., as co-syndication agents, JPMorgan Chase Bank, N.A., as issuing lender, Merrill Lynch Capital Canada Inc., as Canadian agent and Canadian collateral agent, Merrill Lunch Capital, a division of Merrill Lynch Business Financial Services Inc., J.P. Morgan Securities Inc., and Lehman Brothers Inc., as joint lead arrangers, and Merrill Lunch Capital, a division of Merrill Lynch Business Financial Services Inc., J.P. Morgan Securities Inc., and Lehman Brothers Inc., as joint bookrunning managers * | |
145
Table of Contents
Index to Financial Statements
| Exhibit |
Exhibit Description | |
| 10.9 | Amendment and Waiver No. 1 to the ABL Credit Agreement (referred to above), dated as of October 3, 2007, by and among HD Supply, Inc. (as successor by merger to HDS Acquisition Subsidiary, Inc.), as parent borrower, the other borrowers party thereto, Merrill Lynch Capital, a division of Merrill Lynch Business Financial Services Inc., as administrative agent and collateral agent for the lenders party thereto, and Merrill Lynch Capital Canada Inc., as Canadian administrative agent and Canadian collateral agent for the lenders * | |
| 10.10 | Amendment No. 2 to the ABL Credit Agreement (referred to above), dated as of November 1, 2007, by and among HD Supply, Inc. (as successor by merger to HDS Acquisition Subsidiary, Inc.), as parent borrower, the other borrowers party thereto, Merrill Lynch Capital, a division of Merrill Lynch Business Financial Services, Inc., as administrative agent and collateral agent for the lenders party thereto, and Merrill Lynch Capital Canada Inc., as Canadian administrative agent and Canadian collateral agent for the lenders * | |
| 10.11 | ABL Joinder Agreement, dated as of August 30, 2007, by and among HD Supply, Inc., as parent borrower, and certain operating subsidiaries of the parent borrower signatory thereto, and consented to by the other loan parties as defined therein, Merrill Lynch Capital, a division of Merrill Lynch Business Financial Services, Inc., as administrative agent and as collateral agent, and Merrill Lynch Capital Canada Inc., as Canadian administrative agent and as Canadian collateral agent for the banks and other financial institutions from time to time parties to the ABL Credit Agreement * | |
| 10.12 | Limited Consent and Amendment No. 3 to ABL Credit Agreement, dated as of March 19, 2010, by and among HD Supply, Inc., as parent borrower, the other borrowers party thereto, the other loan parties party thereto, the lenders party thereto, GE Business Financial Services Inc., as administrative agent, U.S. ABL collateral agent and a lender, GE Canada Finance Holding Company, as Canadian agent, Canadian collateral agent and a lender, and GE Capital Markets, Inc., JPMorgan Securities Inc., Wells Fargo Capital Finance, LLC and Bank of America Securities LLC, as joint lead arrangers and joint bookrunners | |
| 10.13 | Intercreditor Agreement, dated as of August 30, 2007, by and among Merrill Lynch Capital, a division of Merrill Lynch Business Financial Services, Inc., as administrative agent and collateral agent for the banks and other financial institutions party to the ABL Credit Agreement, and Merrill Lynch Capital Corporation, as administrative agent and collateral agent for the lenders party to the Credit Agreement * | |
| 10.14 | Amendment No. 1 to Intercreditor Agreement, dated as of November 2, 2007, by and among Merrill Lynch Capital, a division of Merrill Lynch Business Financial Services Inc., as collateral agent and administrative agent for the banks and other financial institutions party to the ABL Credit Agreement, and Merrill Lynch Capital Corporation, as collateral agent and administrative agent for the banks and other financial institutions party to the Cash Flow Credit Agreement * | |
| 10.15 | Guarantee and Reimbursement Agreement, dated as of August 30, 2007, made by The Home Depot, Inc., as guarantor and HD Supply, Inc. and the other guarantors party thereto, in favor of Merrill Lynch Capital Corporation, as administrative agent under the Credit Agreement * | |
| 10.16 | Guarantee and Collateral Agreement, dated as of August 30, 2007, made by HD Supply, Inc., and the subsidiary guarantors party thereto, in favor of Merrill Lynch Capital Corporation, as administrative agent and as collateral agent for the banks and other financial institutions party to the Credit Agreement * | |
| 10.17 | Amendment No. 1 to the Guarantee and Collateral Agreement (referred to above), dated as of November 1, 2007, by and among HD Supply, Inc., as borrower, the subsidiary guarantors party thereto, and Merrill Lynch Capital Corporation, as collateral agent and administrative agent for the banks and other financial institutions party to the Credit Agreement * | |
| 10.18 | U.S. Guarantee and Collateral Agreement, dated as of August 30, 2007, made by HD Supply, Inc., and the subsidiary guarantors party thereto, in favor of Merrill Lynch Capital, a division of Merrill Lynch Business Financial Services Inc., as collateral agent and administrative agent for the banks and other financial institutions party to the ABL Credit Agreement * | |
| 10.19 | Amendment No. 1 to the U.S. Guarantee and Collateral Agreement (referred to above), dated as of November 1, 2007, by and among HD Supply, Inc., the parent borrower, the subsidiary guarantors party thereto, and Merrill Lynch Capital, a division of Merrill Lynch Business Financial Services Inc., as collateral agent and administrative agent for the banks and other financial institutions party to the ABL Credit Agreement * | |
146
Table of Contents
Index to Financial Statements
| Exhibit |
Exhibit Description | |
| 10.20 | Canadian Guarantee and Collateral Agreement, dated as of September 5, 2007, made by HD Supply Canada Inc., as borrower, Pro Canadian Holdings I, ULC, CND Holdings, Inc., and the several subsidiary guarantors signatory thereto, in favor of Merrill Lynch Capital Canada Inc., as Canadian agent and Canadian collateral agent for the banks and other financial institutions party to the ABL Credit Agreement * | |
| 10.21 | Amendment No. 1 to the Canadian Guarantee and Collateral Agreement, dated as of November 1, 2007, by and among HD Supply Canada Inc., as borrower, Pro Canadian Holdings I, ULC, CND Holdings, Inc., the subsidiary guarantors signatory thereto, and Merrill Lynch Capital Canada, as Canadian collateral agent and Canadian agent for the banks and other financial institutions party to the ABL Credit Agreement * | |
| 10.22 | Holding Pledge Agreement, dated as of August 30, 2007, made by HDS Holding Corporation, as pledgor, in favor of Merrill Lynch Capital Corporation, as administrative agent and as collateral agent for the banks and other financial institutions party to the Credit Agreement * | |
| 10.23 | ABL Holding Pledge Agreement, dated as of August 30, 2007, made by HDS Holding Corporation, as pledgor, in favor of Merrill Lynch Capital, a division of Merrill Lynch Business Financial Services Inc., as administrative agent and as collateral agent for the banks and other financial institutions party to the ABL Credit Agreement * | |
| 10.24 | Notice of Grant of Security Interest in Patents, dated as of August 30,2007, made by subsidiaries of HD Supply, Inc. named therein in favor of Merrill Lynch Capital Corporation, as administrative agent and collateral agent for the banks and other financial institutions that are parties to the Credit Agreement * | |
| 10.25 | Grant of Security Interest in Copyrights, dated as of August 30, 2007, made by HD Supply, Inc. and the subsidiaries named therein in favor of Merrill Lynch Capital Corporation, as administrative agent and collateral agent for the banks and other financial institutions that are parties to the Credit Agreement * | |
| 10.26 | Notice of Grant of Security Interest in Trademarks, dated as of August 30, 2007, made by subsidiaries of HD Supply, Inc. named therein in favor of Merrill Lynch Capital Corporation, as administrative agent and collateral agent for the banks and other financial institutions that are parties to the Credit Agreement * | |
| 10.27 | ABL Notice of Grant of Security Interest in Patents, dated as of August 30, 2007, made by subsidiaries of HD Supply, Inc. named therein in favor of Merrill Lynch Capital, a division of Merrill Lynch Business Financial Services Inc., as administrative agent and collateral agent for the banks and other financial institutions that are parties to the ABL Credit Agreement * | |
| 10.28 | ABL Grant of Security Interest in Copyrights, dated as of August 30, 2007, made by HD Supply, Inc. and the subsidiaries named therein in favor of Merrill Lynch Capital, a division of Merrill Lynch Business Financial Services Inc., as administrative agent and collateral agent for the banks and other financial institutions that are parties to the ABL Credit Agreement * | |
| 10.29 | ABL Notice of Grant of Security Interest in Trademarks, dated as of August 30, 2007, made by subsidiaries of HD Supply, Inc. named therein in favor of Merrill Lynch Capital, a division of Merrill Lynch Business Financial Services Inc., as administrative agent and collateral agent for the banks and other financial institutions that are parties to the ABL Credit Agreement * | |
| 10.30 | ABL Notice of Grant of Security Interest in Canadian Trademarks, dated as of August 30, 2007, made by HD Supply Canada Inc. in favor of Merrill Lynch Capital Canada Inc., as Canadian agent and Canadian collateral agent for the banks and other financial institutions that are parties to the ABL Credit Agreement * | |
| 10.31 | Pledge of Bond Agreement, dated as of August 30, 2007, by and among HD Supply Canada Inc., as grantor, and Merrill Lynch Capital Canada Inc., as Canadian agent under the ABL Credit Agreement and as mandatory for the secured parties listed therein * | |
| 10.32 | Amendment No. 1 to the Pledge of Bond Agreement (referred to above), dated as of November 1, 2007, by and among HD Supply Canada Inc., as Canadian borrower, and Merrill Lynch Capital Canada Inc., as Canadian agent under the ABL Credit Agreement and mandatory * | |
| 10.33 | Deed of Hypothec and Issue of Bonds, dated as of August 30, 2007, by and among HD Supply Canada Inc., as grantor and Merrill Lynch Capital Canada Inc., as attorney * | |
| 10.34 | HD Supply Canada, Inc. Demand Bond and Endorsement * | |
| 10.35 | HD Supply Management Incentive Plan * | |
| 10.36 | Industrial PVF Bonus Plans † | |
147
Table of Contents
Index to Financial Statements
| Exhibit |
Exhibit Description | |
| 10.37 | HDS Investment Holding, Inc. Stock Incentive Plan * | |
| 10.38 | Letter Agreement with Mark Jamieson, effective October 29, 2007 * | |
| 10.39 | Home Depot Retention Agreement with Joseph DeAngelo, effective August 30, 2007 * | |
| 10.40 | Home Depot Retention Agreement with Anesa Chaibi, effective August 30, 2007 * | |
| 10.41 | Home Depot Retention Agreement with Thomas Lazzaro, effective August 30, 2007 * | |
| 10.42 | Tax Sharing Agreement, dated as of August 30, 2007, by and among HDS Investment Holding, Inc., HDS Acquisition Subsidiary, Inc. (which has been merged into HD Supply, Inc.), HDS Holding Corporation and HD Supply, Inc. * | |
| 10.43 | Strategic Purchase Agreement, dated as of August 30, 2007, by and between Home Depot U.S.A., Inc. and HD Supply Distribution Services, LLC (certain portions of this exhibit were omitted subject to a pending request for confidential treatment) * | |
| 10.44 | Consulting Agreement, dated August 30, 2007, by and among Bain Capital Partners, LLC, HDS Investment Holding, Inc. and HD Supply, Inc. * | |
| 10.45 | Consulting Agreement, dated August 30, 2007, by and among TC Group V, LLC, HDS Investment Holding, Inc. and HD Supply, Inc. * | |
| 10.46 | Consulting Agreement, dated August 30, 2007, by and among Clayton, Dubilier & Rice, Inc., HDS Investment Holding, Inc. and HD Supply, Inc. * | |
| 10.47 | Indemnification Agreement, dated as of August 30, 2007, by and among Bain Capital Integral Investors 2006, LLC, Bain Capital Partners, LLC, HDS Investment Holding, Inc. and HD Supply, Inc. * | |
| 10.48 | Indemnification Agreement, dated as of August 30, 2007, by and among Carlyle Partners V, L.P., Carlyle Partners V-A, L.P., CP V Coinvestment A, L.P., CP V Coinvestment B, L.P., TC Group V, LLC, HDS Investment Holding, Inc. and HD Supply, Inc. * | |
| 10.49 | Indemnification Agreement, dated as of August 30, 2007, by and among Clayton, Dubilier & Rice Fund VII, L.P., CD&R Parallel Fund VII, L.P., Clayton, Dubilier & Rice Fund VII (Co-Investment), L.P., HDS Investment Holding, Inc. and HD Supply, Inc. * | |
| 10.50 | Indemnification Agreement, dated as of August 30, 2007, by and among The Home Depot, Inc., HDS Investment Holding, Inc. and HD Supply, Inc. * | |
| 10.51 | Assumption and Termination Agreement, dated September 17, 2007, by and among HD Supply, Inc., Clayton, Dubilier & Rice, Inc. and Mitchell Jacobson † | |
| 10.52 | Form of Indemnification Agreement † | |
| 10.53 | Letter of Employment, dated as of March 18, 2010, by and between HD Supply, Inc. and John Stegeman | |
| 10.54 | Form of Stock Option Agreement | |
| 10.55 | Letter of Continued Employment, dated as of August 10, 2007, by Pro Acquisition Corporation in favor of Joseph J. DeAngelo | |
| 10.56 | Letter of Continued Employment, dated as of August 10, 2007, by Pro Acquisition Corporation in favor of Richard R. Fiechter | |
| 10.57 | Letter of Continued Employment, dated as of August 10, 2007, by Pro Acquisition Corporation in favor of Anesa T. Chaibi | |
| 12.1 | Computation of Ratio of Earnings to Fixed Charges | |
| 21.1 | List of Subsidiaries | |
| 23.1 | Consent of KPMG LLP | |
| 24.1 | Powers of Attorney * | |
| 31.1 | Certification of Chief Executive Officer, pursuant to Rule 13a-14(a) promulgated under the Securities Exchange Act of 1934, as amended | |
148
Table of Contents
Index to Financial Statements
| Exhibit |
Exhibit Description | |
| 31.2 | Certification of Chief Financial Officer, pursuant to Rule 13a-14(a) promulgated under the Securities Exchange Act of 1934, as amended | |
| 32.1 | Certification of Chief Executive Officer, pursuant to 18 U.S.C. Section 1350, as adopted pursuant to Section 906 of the Sarbanes-Oxley Act of 2002 | |
| 32.2 | Certification of Chief Executive Officer, pursuant to 18 U.S.C. Section 1350, as adopted pursuant to Section 906 of the Sarbanes-Oxley Act of 2002 | |
| * | Previously filed in Amendment No. 1 to Form S-4 (File No. 333-159809) filed on July 10, 2009. |
| † | Previously filed in Amendment No. 2 to Form S-4 (File No. 333-159809) filed on July 27, 2009. |
149
Table of Contents
Index to Financial Statements
(c) Financial Statement Schedules
Report and Consent of Independent Registered Public Accounting Firm
The Board of Directors
HD Supply, Inc:
The audits referred to in our report dated May 9, 2008 with respect to the consolidated statements of operations of HD Supply Inc. and subsidiaries (Successor Company) and the related statements of stockholders’ equity and comprehensive income (loss), and cash flows for the period August 30, 2007 to February 3, 2008, and the combined statements of operations of HD Supply, Inc. and HD Supply Canada Inc. wholly owned subsidiaries of The Home Depot, Inc. (Predecessor Company) and the related combined statements of owner’s equity and cash flows for the period January 29, 2007 to August 29, 2007, included the related financial statement schedule as of February 3, 2008 and the period ended August 29, 2007. This financial statement schedule is the responsibility of the Company’s management. Our responsibility is to express an opinion on this financial statement schedule based on our audit. In our opinion, such financial statement schedule, when considered in relation to the basic consolidated financial statements taken as a whole, presents fairly in all material respects the information set forth therein.
We were not engaged to audit, review, or apply any procedures to the adjustment to retrospectively apply the change in presentation regarding the Creative Touch Interiors segment described in Note 17 and, accordingly, we do not express an opinion or any other form of assurance about whether such adjustment was appropriate and has been properly applied. The adjustments were audited by a successor auditor.
We consent to the use of our report included herein.
/s/ KPMG LLP
Orlando, FL
April 13, 2010
150
Table of Contents
Index to Financial Statements
(c) Financial Statement Schedules
HD SUPPLY, INC.
SCHEDULE II – VALUATION AND QUALIFYING ACCOUNTS
(Amounts in millions)
Accounts Receivable Allowance for Doubtful Accounts:
| Balance at Beginning of Period |
Acquisition of Business or Purchase Accounting Adjustment |
Charges to Expense / (Income) |
Doubtful Accounts Written Off, Net |
Other Adjustments |
Balance at End of Period | |||||||
| Period ended: |
||||||||||||
| August 29, 2007 (Predecessor) |
$ 48 | – | 25 | (14) | – | $ 59 | ||||||
| February 3, 2008 (Successor) |
$ 59 | – | 31 | (12) | (6) | $ 72 | ||||||
| February 1, 2009 (Successor) |
$ 72 | – | 61 | (36) | (2) | $ 95 | ||||||
| January 31, 2010 (Successor) |
$ 95 | 2 | 23 | (64) | – | $ 56 | ||||||
| Inventory Valuation Reserves: | ||||||||||||
| Balance at Beginning of Period |
Acquisition of Business or Purchase Accounting Adjustment |
Charges to Expense / (Income) |
Inventory Written Off, Net |
Other Adjustments |
Balance at End of Period | |||||||
| Period ended: |
||||||||||||
| August 29, 2007 (Predecessor) |
$ 47 | 4 | 7 | (8) | (3) | $ 47 | ||||||
| February 3, 2008 (Successor) |
$ 47 | 12 | 5 | (8) | (1) | $ 55 | ||||||
| February 1, 2009 (Successor) |
$ 55 | 55 | 12 | (29) | (4) | $ 89 | ||||||
| January 31, 2010 (Successor) |
$ 89 | 2 | 10 | (31) | 5 | $ 75 | ||||||
Note – Other Adjustments in fiscal 2009 include $4 million of adjustments for the activity taken directly to Retained Earnings as part of the elimination of the lag period for consolidating CTI’s results of operations and $1 million for the effects of currency translation.
151
Table of Contents
Index to Financial Statements
Pursuant to the requirements of Section 13 or 15(d) of the Securities Exchange Act of 1934, the registrant has duly caused this report to be signed on its behalf by the undersigned, hereunto duly authorized.
| HD Supply, Inc. | ||
| By: | /s/ JOSEPH J. DEANGELO | |
| Name: Joseph J. DeAngelo | ||
| Title: Chief Executive Officer | ||
| Date: April 13, 2010 | ||
Pursuant to the requirements of the Securities Exchange Act of 1934, this report has been signed below by the following persons on behalf of the registrant and in the capacities and on the dates indicated.
| Signature |
Capacity |
Date | ||
| /s/ JOSEPH J. DEANGELO |
Chief Executive Officer and Director | April 13, 2010 | ||
| Joseph J. DeAngelo | (Principal Executive Officer) | |||
| /s/ MARK JAMIESON |
Senior Vice President and Chief Financial Officer | April 13, 2010 | ||
| Mark Jamieson | (Principal Financial Officer) | |||
| /s/ EVAN LEVITT |
Controller | April 13, 2010 | ||
| Evan Levitt | (Principal Accounting Officer) | |||
| /s/ JAMES G. BERGES |
Chairman | April 13, 2010 | ||
| James G. Berges | ||||
| /s / PAUL B. EDGERLEY |
Director | April 13, 2010 | ||
| Paul B. Edgerley | ||||
| /s/ ALLAN M. HOLT |
Director | April 13, 2010 | ||
| Allan M. Holt | ||||
| /s/ MITCHELL JACOBSON |
Director | April 13, 2010 | ||
| Mitchell Jacobson | ||||
| /s/ LEW KLESSEL |
Director | April 13, 2010 | ||
| Lew Klessel | ||||
| /s/ TODD NEWNAM |
Director | April 13, 2010 | ||
| Todd Newnam | ||||
| /s/ DAVID A. NOVAK |
Director | April 13, 2010 | ||
| David A. Novak | ||||
| /s/ DANIEL A. PRYOR |
Director | April 13, 2010 | ||
| Daniel A. Pryor | ||||
| /s/ STEPHEN M. ZIDE |
Director | April 13, 2010 | ||
| Stephen M. Zide | ||||
152