Attached files
| file | filename |
|---|---|
| EX-31.2 - CERTIFICATION - Corporate Capital Trust, Inc. | d695126dex312.htm |
| EX-31.1 - CERTIFICATION - Corporate Capital Trust, Inc. | d695126dex311.htm |
| EX-32.1 - CERTIFICATION - Corporate Capital Trust, Inc. | d695126dex321.htm |
| EX-10.34 - SELECTED DEALER AGREEMENT - Corporate Capital Trust, Inc. | d695126dex1034.htm |
Table of Contents
UNITED STATES
SECURITIES AND EXCHANGE COMMISSION
Washington, D.C. 20549
FORM 10-K
(Mark One)
| x | ANNUAL REPORT PURSUANT TO SECTION 13 OR 15(d) OF THE SECURITIES EXCHANGE ACT OF 1934 |
For the fiscal year ended: December 31, 2013
OR
| ¨ | TRANSITION REPORT PURSUANT TO SECTION 13 OR 15(d) OF THE SECURITIES EXCHANGE ACT OF 1934 |
Commission file number 814-00827
Corporate Capital Trust, Inc.
(Exact name of registrant as specified in its charter)
| Maryland | 27-2857503 | |
| (State or other jurisdiction of incorporation or organization) |
(I.R.S. Employer Identification No.) | |
| CNL Center at City Commons 450 South Orange Avenue Orlando, Florida |
32801 | |
| (Address of principal executive offices) | (Zip Code) | |
Registrant’s telephone number, including area code: (866) 745-3797
Securities registered pursuant to Section 12(b) of the Act:
| Title of each class |
Name of exchange on which registered | |
| None | Not applicable |
Securities registered pursuant to Section 12(g) of the Act:
Common Stock, $0.001 par value per share
(Title of class)
Indicate by check mark if the registrant is a well-known seasoned issuer, as defined in Rule 405 of the Securities Act. Yes ¨ No x
Indicate by check mark if the registrant is not required to file reports pursuant to Section 13 or Section 15(d) of the Act. Yes ¨ No x
Indicate by check mark whether the registrant (1) has filed all reports required to be filed by Section 13 or 15(d) of the Securities Exchange Act of 1934 during the preceding 12 months (or for such shorter period that the registrant was required to file such reports), and (2) has been subject to such filing requirements for the past 90 days. Yes x No ¨
Indicate by check mark whether the registrant has submitted electronically and posted on its corporate Web site, if any, every Interactive Data File required to be submitted and posted pursuant to Rule 405 of Regulation S-T (§232.405 of this chapter) during the preceding 12 months (or for such shorter period that the registrant was required to submit and post such files). Yes ¨ No ¨
Indicate by check mark if disclosure of delinquent filers pursuant to Item 405 of Regulation S-K (229.05 of this chapter) is not contained herein, and will not be contained, to the best of registrant’s knowledge, in definitive proxy or information statements incorporated by reference in Part III of this Form 10-K or any amendment to this Form 10-K. ¨
Indicate by check mark whether the registrant is a large accelerated filer, an accelerated filer, a non-accelerated filer, or a smaller reporting company. See definitions of “large accelerated filer”, “accelerated filer” and “smaller reporting company” in Rule 12b-2 of the Exchange Act.
| Large accelerated filer | ¨ | Accelerated filer | ¨ | |||
| Non-accelerated filer | x (Do not check if a smaller reporting company) | Smaller reporting company | ¨ | |||
Indicate by check mark whether the registrant is a shell company (as defined in Rule 12b-2 of the Act). Yes ¨ No x
There is no established market for the Registrant’s shares of common stock. The Registrant is currently conducting an ongoing public offering of its shares of common stock pursuant to a Registration Statement on Form N-2, which shares are currently being offered and sold at $11.30 per share, with discounts available for certain categories of purchasers, or at a price necessary to ensure that shares are not sold at a price, net of sales load, below net asset value per share. The number of shares held by non-affiliates as of June 30, 2013 (the last business day of the registrant’s most recently completed second fiscal quarter) was approximately 103,409,897.
As of March 18, 2014, there were 153,081,534 shares of the registrant’s common stock outstanding.
DOCUMENTS INCORPORATED BY REFERENCE
Registrant incorporates by reference portions of the Corporate Capital Trust Inc. definitive proxy statement for the 2014 Annual Meeting of Shareholders (Items 10, 11, 12, 13 and 14 of Part III) to be filed no later than April 30, 2014. Certain exhibits previously filed with the Securities and Exchange Commission are incorporated by reference into Part IV of this report.
Table of Contents
i
Table of Contents
STATEMENT REGARDING FORWARD LOOKING INFORMATION
The following information contains statements that constitute forward-looking statements, within the meaning of Section 27A of the Securities Act of 1933, as amended, and Section 21E of the Securities Exchange Act of 1934, as amended (the “Exchange Act”). These statements generally are characterized by the use of terms such as “may,” “should,” “plan,” “anticipate,” “estimate,” “intend,” “predict,” “believe” and “expect” or the negative of these terms or other comparable terminology. Although we believe that the expectations reflected in such forward-looking statements are based upon reasonable assumptions, our actual results could differ materially from those set forth in the forward-looking statements. Some factors that might cause such a difference include the following: persistent economic weakness at the global or national level, increased direct competition, changes in government regulations or accounting rules, changes in local, national and global capital market conditions, our ability to obtain credit lines or credit facilities on satisfactory terms, changes in interest rates, availability of proceeds from our offering of shares, our ability to identify suitable investments, our ability to close on identified investments, inaccuracies of our accounting estimates, our ability to locate suitable borrowers for our loans and the ability of such borrowers to make payments under their respective loans. Given these uncertainties, we caution you not to place undue reliance on such statements, which apply only as of the date hereof. We undertake no obligation to publicly release the results of any revisions to these forward-looking statements that may be made to reflect future events or circumstances or to reflect the occurrence of unanticipated events. The forward-looking statements should be read in light of the risk factors identified in the “Risk Factors” section of this report.
| Item 1. | Business |
General
Corporate Capital Trust, Inc. (which is referred to in this report as “we”, “our”, “us” and “our company”) is a non-diversified closed-end management investment company that has elected to be treated as a business development company under the Investment Company Act of 1940, as amended, or the “1940 Act.” Formed as a Maryland corporation on June 9, 2010, we are externally managed by CNL Fund Advisors Company (“CNL”) and KKR Asset Management LLC (“KKR”). CNL, which is our investment adviser, and KKR, which is our investment sub-adviser, are referred to in this report as our “Advisors.” Our Advisors are collectively responsible for sourcing potential investments, conducting due diligence on prospective investments, analyzing investment opportunities, structuring investments and monitoring our portfolio on an ongoing basis. Both Advisors are registered as investment advisers with the U.S. Securities and Exchange Commission (“SEC”). CNL also provides the administrative services necessary for our company to operate.
We are currently selling shares of our common stock pursuant to a registration statement on Form N-2 (as amended and supplemented, the “Follow-On Registration Statement”) covering our continuous public offering of up to 209 million shares of common stock for an approximate maximum offering amount of $2.3 billion (the “Follow-On Offering”). The Follow-On Registration Statement was declared effective by the SEC on November 1, 2013. Immediately prior to the commencement of the Follow-On Offering, we terminated our initial continuous public offering (the “Initial Offering”). Through the termination date of the Initial Offering, we sold approximately 141 million shares of common stock, including reinvestment of distributions, for total gross proceeds of approximately $1.5 billion. The Initial Offering and Follow-On Offering are collectively referred to as the “Offerings”. See Item 5 “Market for Registrant’s Common Equity, Related Shareholder Matters and Issuer Purchases of Equity Securities” for current information on the progress of our Follow-On Offerings.
Our investment objective is to provide our shareholders with current income and, to a lesser extent, long-term capital appreciation. We pursue our investment objective by investing primarily in the debt of privately owned U.S. companies with a focus on originated transactions sourced through the networks of our Advisors. We define originated transactions as any negotiated investment where we, through our Advisors’ direct efforts, provide funds directly to a portfolio company. These investments may include both debt and equity components. A substantial portion of our portfolio consists of senior and subordinated debt investments, which we believe offer opportunities for superior risk-adjusted returns and income generation. Our debt investments may take the form of corporate loans or bonds, may be secured or unsecured and may, in some cases, be accompanied by warrants, options or other forms of equity participation. We may separately purchase common or preferred equity interests in transactions. We may also invest in structured products such as collateralized loan obligations. Our portfolio of debt investments includes fixed and floating rate investments, the latter of which may provide lower volatility in values in a rising interest rate environment.
We are raising equity capital with the goal of capitalizing on what we believe is a compelling and sustained market opportunity. We believe the market for lending capital is currently characterized by significant and persistent demand for capital and that we will have access to considerable opportunities as a provider of capital to achieve attractive pricing and terms on our investments.
Our investment strategy is focused on creating and growing an investment portfolio that generates superior risk-adjusted returns by carefully selecting investments through rigorous due diligence, and by actively managing and monitoring our investment portfolio. Additionally, we believe that a flexible approach to investing allows us to take advantage of opportunities that offer the most
1
Table of Contents
favorable risk/reward characteristics. We seek to execute on this investment strategy through the strong investment expertise and sourcing networks of our Advisors that adhere to an investment approach that emphasizes strong fundamental credit analysis and rigorous monitoring of our individual investments and portfolio companies and our portfolio at large. Our Advisors endeavor to be disciplined in selecting investments that they perceive to offer favorable risk/reward characteristics and relative value. Throughout this report, we may refer to the issuers of our debt and equity investments as portfolio companies. When evaluating an investment in, or investment security issued by, a portfolio company, we use the resources of our Advisors to develop an investment thesis and a proprietary view of the potential portfolio company’s intrinsic value.
Our Investment Focus
While we consider each investment opportunity independently, we generally focus on portfolio companies that share the following characteristics:
| • | Size. We seek to provide capital to medium- and large-sized companies, which typically have more defensible market positions, stronger franchises and operations and better credit characteristics relative to their smaller peers. Although there are no strict lower or upper limits on the size of a company in which we may invest, we expect to focus on companies with EBITDAs earnings before interest, taxes, depreciation and amortization greater than $25 million. |
| • | Capital Structure. Our portfolio consists primarily of senior and subordinated debt, which may in some cases be accompanied by warrants, options, equity co-investments, or other forms of equity participation. We seek to invest in companies that generate free cash flow at the time of our investment and benefit from material investments from well-known equity investors. |
| • | Management Team. We seek to prioritize investing in companies with strong, existing management teams that we believe have a clear strategic vision, long-standing experience in primarily their industry and a successful operating track record. We favor companies in which management’s incentives appear to be closely aligned with the long-term performance of the business, such as through equity ownership. |
| • | Stage of Business Life Cycle. We seek mature, privately owned businesses that have long track records of stable, positive cash flow. We do not intend to invest in start-up companies or companies with speculative business plans. As a business development company, we generally must invest at least 70% of our total assets in “qualifying assets,” which, under relevant SEC rules, includes all private companies, companies whose securities are not listed on a national securities exchange, and certain public listed companies that have a market capitalization of less than $250 million. |
| • | Industry Focus. While we will consider opportunities within all industries, we seek to prioritize industries having, in our view, favorable characteristics from a lending perspective. For example, we seek companies in established industries with stable competitive and regulatory frameworks, where the main participants have enjoyed predictable, low-volatility earnings. We give less emphasis to industries that are frequently characterized by less predictable and more volatile earnings. |
| • | Geography. As a business development company under the 1940 Act, we focus on and invest at least 70% of our total assets in U.S. companies. To the extent we invest in foreign companies, we intend to do so with 1940 Act limitations and only in jurisdictions with established legal frameworks and a history of respecting creditor rights, including countries that are members of the European Union, as well as Canada, Australia and Japan. |
While we believe that the criteria listed above are important in identifying and investing in portfolio companies, we consider each investment on a case-by-case basis. It is possible that not all of these criteria will be met by each portfolio company in which we invest. There is no limit on the maturity or duration of any investment in our portfolio. We anticipate that substantially all of the investments held in our portfolio will have either a sub-investment grade rating by Moody’s Investors Service and/or Standard & Poor’s or will not be rated by any rating agency. Investment sizes will vary as our capital base changes and will ultimately be at the discretion of our Advisors subject to oversight by our board of directors.
Except as restricted by the 1940 Act or by the Internal Revenue Code of 1986, as amended (the “Code”), we deem all of our investment policies to be non-fundamental, which means that they may be changed by our board of directors without shareholder approval.
Annual Highlights
| • | Performance: Our full year shareholders earned a total of return of 11.4% in calendar year 2013, including a realized return of 8.6% from distributions. Since the start of investment operations on July 1, 2011, the Company has recorded positive returns in nine of its 10 full quarters of operations. (See “Item 7 Management’s Discussion and Analysis of Financial Condition and Results of Operations, —Results of Operations, —Net Assets, Net Asset Value per Share, Annual Investment Return and Total Return since Inception,” for more discussion on the investment returns for the Company’s shareholders.) |
| • | Shareholder Distributions: Distributions per share to full year shareholders increased to $0.83 per share in 2013, up from $0.76 per share in 2012. In 2013, the Company paid a special distribution of $0.03 per share that was fully supported by an overall increase in taxable income available for distribution in excess of the regular distribution of $0.80 for calendar year 2013. |
2
Table of Contents
| • | Originated Transactions: Given the size of the investment base, we were well positioned in 2013 to focus our investment activity on direct originated investments (approximately $700 million or 33%). (See Item 7 “Management’s Discussion and Analysis of Financial Condition and Results of Operations, — Portfolio and Investment Activity,” for a discussion of our debt origination program). |
| • | Equity Capital Base: Our equity capital increased by approximately $800 million in 2013, a direct result of our continuous offering of common stock and the closeout of our Initial Offering of 150 million shares over 28 months ending in October 2013. We then launched our Follow-On Offering of 209 million shares on November 1, 2013 that is expected to further increase our equity capital base and to extend our actively-managed investment program. |
| • | Expansion of Credit Facilities and Lender Participation: In 2013, we increased our borrowing capacity by $545 million (from $240 million in 2012 to $785 million in 2013). We added two credit facilities, including a syndicated senior secured revolving credit facility with multiple lenders, to finance our expansion into direct senior lending and mezzanine investments. |
Portfolio and Investment Activity
As of December 31, 2013, our investment program consisted of two main components. First, since the inception of our investment activities we have been engaged in the direct purchase of debt securities primarily issued by portfolio companies, and directly lending to portfolio companies. We refer to this investment component as our “Investment Portfolio” in this report. Second, beginning in November 2012, we have supplemented our economic exposure to portfolio companies by entering into total return swap, or TRS, arrangements with a commercial bank counterparty and directing the creation of a portfolio of underlying corporate bonds and loans that serve as reference assets under the TRS. We refer to this investment component as either our portfolio of TRS reference assets, or our “TRS Portfolio”. In the case of our portfolio of TRS reference assets, we receive all: (i) realized income and fees and (ii) realized capital gains generated by TRS reference assets. In return, we must pay quarterly to the TRS counterparty a payment consisting of: (i) realized capital losses and (ii) financing costs that are based on (i) a floating interest rate and (ii) the settled notional amount of TRS reference assets. The settled notional amount of TRS reference assets is the net aggregate of notional amounts where the purchase and sale of reference assets underlying total return swaps have been settled by the counterparty and serves as the basis for our payment of financing charges to the counterparty under the TRS agreements. The total notional amount of TRS reference assets includes the effect of purchases and sale of reference assets where reference asset trade settlement is pending. At the end of the TRS contract life, we will receive additional economic benefit if the net value of the portfolio of TRS reference assets appreciates relative to the settlement date TRS notional amount. Correspondingly, we will be required to pay the counterparty the amount, if any, by which the net value of the portfolio of TRS reference assets declines relative to the settlement date TRS notional amount. We do not own, or have physical custody of, the TRS reference assets. The TRS reference assets are not direct investments by us.
As of December 31, 2013, our Investment Portfolio consisted of debt and equity securities relating to 94 portfolio companies diversified across 17 industry classifications. As of December 31, 2013, the TRS Portfolio consisted of debt securities relating to 20 portfolio companies diversified across seven industry classifications.
The information presented in the table below is for further analysis of our Investment Portfolio and our TRS Portfolio. However, our investment program is not managed with any specific investment diversification or dispersion target goals. The table summarizes the composition of our Investment Portfolio and TRS Portfolio based on fair value as of December 31, 2013, excluding our short term investments.
| As of December 31, 2013 ($ in thousands) | ||||||||||||||||
| Asset Category | Investment Portfolio at Fair Value |
Percentage of Investment Portfolio |
TRS Portfolio at Fair Value |
Percentage of TRS Portfolio |
||||||||||||
| Senior debt |
||||||||||||||||
| First lien |
$ | 771,511 | 40.1 | % | $ | 38,897 | 64.7 | % | ||||||||
| Second lien |
689,630 | 35.8 | 10,045 | 16.7 | ||||||||||||
| Secured bonds |
13,351 | 0.7 | 3,640 | 6.1 | ||||||||||||
|
|
|
|
|
|
|
|
|
|||||||||
| Total senior debt |
1,474,492 | 76.6 | 52,582 | 87.5 | ||||||||||||
| Subordinated debt |
370,131 | 19.2 | 7,514 | 12.5 | ||||||||||||
| Structured products |
55,575 | 2.9 | — | — | ||||||||||||
| Equity/Other |
24,671 | 1.3 | — | — | ||||||||||||
|
|
|
|
|
|
|
|
|
|||||||||
| Total |
$ | 1,924,869 | 100.0 | % | $ | 60,096 | 100.0 | % | ||||||||
|
|
|
|
|
|
|
|
|
|||||||||
The primary investment concentrations include (i) senior debt and (ii) subordinated debt securities. The senior and subordinated debt investments in our Investment Portfolio as of December 31, 2013 were purchased at an average price of 97.4% of par or stated value, as applicable.
3
Table of Contents
For a further discussion of our investment activities and investment attributes of both our Investment Portfolio and TRS Portfolio as of December 31, 2013 and 2012, see “Item 7 Management’s Discussion and Analysis of Financial Condition and Results of Operations; Portfolio Investment Activity for the years ended December 31, 2013 and 2012.”
Competition
As a business development company with a particular focus on lending activities, we experience competition from other business development companies, commercial banks, specialty finance companies, open-end and closed-end investment companies, hedge funds, private equity funds and institutional investors, some of which generally have had greater financial resources than we do for the purposes of lending to U.S. businesses within our stated investment focus. These competitors may also have a lower cost of capital, may be subject to less regulatory oversight, and may have lower overall operating costs. The level of competition impacts both our ability to raise capital, find suitable corporate borrowers that meet our investment criteria and acquire and originate loans to these corporate borrowers.
We believe we have the following competitive advantages over other capital providers that operate in the markets we target and allow us to take advantage of the market opportunity we have identified:
| • | Proprietary Sourcing and Deal Origination. Our Advisors, through their deep industry relationships and investment teams that actively source new investments, provide us with immediate access to an established source of proprietary deal flow. CNL and KKR have built leading franchises and deep relationships with major companies, financial institutions and other investment and advisory institutions for sourcing new investments. KKR’s investment professionals are also organized into industry groups that conduct their own primary research, develop views on industry themes and trends and proactively work to identify companies in which to invest, often on an exclusive basis. We believe that our Advisors’ broad networks and the internal deal generation strategies of their investment teams create favorable opportunities to deploy capital across a broad range of originated transactions that have attractive investment characteristics. |
| • | Focusing on Preserving Capital and Minimizing Losses. We believe that protecting principal and avoiding capital losses are critical to generating an attractive total return for our shareholders. Toward that end, our investment process is designed to: (i) utilize our Advisors’ proprietary knowledge and deep industry relationships to identify attractive prospective portfolio companies, (ii) conduct rigorous due diligence to evaluate the creditworthiness of, and potential returns from, credit investments in such portfolio companies, (iii) stress test prospective investments to assess the viability of potential portfolio companies in a downside scenario and their ability to repay principal and (iv) structure investments and design covenants and other rights that anticipate and mitigate issues identified through this process. |
| • | Experienced Management and Investment Expertise. Each of our Advisors has more than 35 years of investment experience that spans a broad range of economic, market and financial conditions. By accessing their combined resources, skills and experience, we believe we benefit from CNL’s contrarian investment philosophy of focusing on underserved, undercapitalized markets and KKR’s rigorous investment approach, industry expertise and experience investing throughout a company’s capital structure. |
| • | Disciplined Credit Analysis and Portfolio Monitoring. Our Advisors provide us with immediate access to an established platform for evaluating investments, managing risk and focusing on opportunities that generate superior returns with appropriate levels of risk. Through KKR, we benefit from an investment infrastructure that currently employs more than 260 investment professionals, including more than 45 credit-focused investment professionals that currently track over 500 corporate credits. This platform should allow for intensive due diligence to filter investment opportunities and help select investments that offer the most favorable risk/reward characteristics. |
| • | Versatile Transaction Structuring and Flexible Capital. Our Advisors have experience and expertise in evaluating and structuring investments at all levels of a company’s capital structure and with varying features, providing numerous tools to manage risk while preserving opportunities for income, capital preservation and, to a lesser extent, capital appreciation. We seek to capitalize on this expertise and build our Investment Portfolio that performs in a broad range of economic conditions while meeting the unique needs of a broad range of borrowers. Although we are subject to regulation as a business development company, we are not subject to many of the regulatory limitations that govern traditional lending institutions. As a result, we believe that we can be more flexible in selecting and structuring investments and adjusting investment criteria. We believe borrowers view this flexibility as a benefit, making us an attractive financing partner. |
| • | Long-Term Investment Horizon. We believe that our flexibility to make investments with a long-term perspective provides us with the opportunity to generate favorable returns on invested capital and expands the types of investments that we may consider. The long-term nature of our capital helps us avoid disposing of assets at unfavorable prices and we believe makes us a better partner for portfolio companies. |
| • | Limited Leverage. We anticipate maintaining a relatively low level of leverage compared to traditional financial institutions and many unregulated investment funds. We believe that limiting our leverage will reduce volatility and risk in our portfolio. Furthermore, by maintaining prudent leverage levels, we believe we will be better positioned to weather market downturns. We do not foresee at any time reaching the 200% asset coverage ratio limitation for business development companies, as defined in the1940 Act. We expect to borrow funds, consisting of senior securities, at an asset coverage ratio of approximately 250%. |
4
Table of Contents
Business Development Company Requirements
Business development companies are closed-end funds that elect to be treated as business development companies under the 1940 Act. As such, business development companies are subject to only certain provisions of the 1940 Act, as well as the Exchange Act. Business development companies are provided greater flexibility under the 1940 Act than are other investment companies in dealing with their portfolio companies, issuing securities, and compensating their advisors. Business development companies can be internally or externally managed and may qualify to elect to be taxed as RICs for federal tax purposes. The 1940 Act contains prohibitions and restrictions relating to transactions between business development companies and their affiliates, principal underwriters, and affiliates of those affiliates or underwriters. The 1940 Act requires that a majority of a business development company’s directors be persons other than “interested persons,” as that term is defined in the 1940 Act. In addition, the 1940 Act provides that we may not change the nature of our business so as to cease to be, or withdraw our election as, a business development company unless approved by a majority of our outstanding voting securities. The 1940 Act defines “a majority of the outstanding voting securities” as the lesser of: (1) 67% or more of the voting securities present at a meeting if the holders of more than 50% of our outstanding voting securities are present or represented by proxy or (2) 50% of our outstanding voting securities.
We are generally unable to issue and sell our common stock at a price below net asset value per share. We may, however, sell our common stock, or warrants, options, or rights to acquire our common stock, at a price below the then-current net asset value of our common stock if our board of directors determines that such sale is in our best interests and the best interests of our shareholders, and our shareholders approve such sale. In addition, we may generally issue new shares of our common stock at a price below net asset value in rights offerings to existing shareholders, in payment of dividends, and in certain other limited circumstances.
As a business development company, we are generally not permitted to invest in any portfolio company in which our Advisors or any of their affiliates currently have an investment or to make any co-investments with our Advisors or any of their affiliates without an exemptive order from the SEC. We may, however, invest alongside our Advisors and their affiliates’ other clients in certain circumstances where doing so is consistent with applicable law and SEC staff interpretations. For example, we may invest alongside such other clients’ accounts consistent with guidance promulgated by the SEC Staff permitting us and such other clients’ accounts to purchase interests in a single class of privately placed securities so long as certain conditions are met, including that neither of our Advisors, acting on our behalf or on behalf of other clients, negotiates any term other than price. We may also invest alongside our Advisors’ respective other clients as otherwise permissible under regulatory guidance, applicable regulations and our Advisors’ allocation policies. Furthermore, on May 21, 2013, the SEC issued an order granting us exemptive relief that expands our ability to co-invest with certain of our affiliates in privately negotiated transactions (the “SEC Exemptive Order”). Subject to the conditions specified in the SEC Exemptive Order, we are permitted to co-invest with those affiliates in certain additional investment opportunities, including investments originated and directly negotiated by our Advisors.
Financial Information About Industry Segments and Geographic Areas
Our primary objectives include investing in and originating a portfolio of loans, bonds and equity investments to commercial businesses located throughout the United States. We presently do not evaluate our investments by industry segment but rather we review performance on an individual basis. Accordingly, we do not report industry or geographic area segment information.
Agreements for Investment Advisory Services, Managing Dealer Services and Administrative Services
We are party to the Investment Advisory Agreement with CNL for the overall management of our company’s investment activities. Our company and CNL have also entered into the Sub-Advisory Agreement with KKR under which KKR is responsible for the day-to-day management of our company’s Investment Portfolio. CNL compensates KKR for advisory services that it provides to our company with 50% of the fees that CNL receives under the Investment Advisory Agreement. For a further discussion of Investment Advisory and Sub-Advisory Agreements, see “Item 7 Management’s Discussion and Analysis of Financial Condition and Results of Operations Contractual Obligations — Investment Advisory Agreements.”
We are also party to an administrative services agreement with CNL (the “Administrative Services Agreement”) whereby CNL performs, and oversees the performance of various administrative services on our behalf. Administrative services generally include investor services, general ledger accounting, fund accounting, maintaining required corporate and financial records, financial reporting for us and our subsidiaries, audit services, preparation of reports to our board of directors and lenders, calculating our net asset value, filing tax returns, preparing and filing SEC reports, preparing, printing and disseminating shareholder reports and proxy statements, overseeing the payment of our expenses and distributions on common stock, oversight of service providers and the performance of administrative and professional services rendered to our company by others.
By their terms, each of the Investment Advisory Agreement, the Sub-Advisory Agreement and the Administrative Services Agreement, each of which was entered into for an initial two-year term in 2011, must be re-approved annually by our board of directors (including a majority of our independent directors), or the holders of a majority of our outstanding voting securities. On March 18, 2014, our board of directors, including our independent directors, approved the renewal of each of these agreements for an additional one-year term through March 18, 2015, subject to earlier termination in accordance with their respective terms.
5
Table of Contents
On October 8, 2013, we entered into a managing dealer agreement with CNL Securities Corp., an affiliate of CNL. CNL Securities Corp. serves as the managing dealer of the Follow-On Offering and in connection therewith receives selling commissions of up to 7% of gross offering proceeds, a marketing support fee of up to 3% of gross offering proceeds, and reimbursement of due diligence and certain other expenses incurred in connection with the Follow-On Offering. All or any portion of these fees and expense reimbursements may be re-allowed to participating brokers. We will pay a maximum sales load of 10% of gross offering proceeds for all combined selling commissions, marketing support fees and expense reimbursements.
CNL, certain CNL affiliates, and KKR receive compensation and reimbursement of expenses and personnel time in connection with (i) the performance and supervision of administrative services on our behalf, (ii) certain expenses associated with investment advisory activities and (iii) the Offerings.
Employees
Reference is made to Item 10. “Directors, Executive Officers and Corporate Governance” in our definitive proxy statement for our 2014 annual meeting of shareholders (the “2014 Proxy Statement”) for a listing of our executive officers. We have no employees. Our executive officers are compensated through CNL and/or its affiliates.
Tax Status
Beginning with our 2011 tax year, we elected to be treated for federal income tax purposes, and intend to qualify annually, as a regulated investment company, or a RIC, under the Code. As a RIC, we generally will not be subject to federal income tax on distributed taxable income to the extent we distribute annually at least 90% of our taxable income to our shareholders and meet other compliance requirements.
Corporate Information
Our executive offices are located at 450 S. Orange Ave., Orlando, FL 32801, and our telephone number is 866-650-0650.
We make available all of our annual reports on Form 10-K, quarterly reports on Form 10-Q, current reports on Form 8-K and amendments to such reports free of charge on our internet website at www.corporatecapitaltrust.com as soon as reasonably practical after such material is electronically filed with or furnished to the SEC. These reports are also available on the SEC’s internet website at www.sec.gov. The public may also read and copy paper filings that we have made with the SEC at the SEC’s Public Reference Room, located at 100 F Street, NE, Washington, D.C. 20549. Information on the operation of the Public Reference Room may be obtained by calling (800) SEC-0330.
| Item 1A. | Risk Factors |
Risks Related to Our Business
We have a limited operating history.
We are a relatively new company and are subject to all of the business risks and uncertainties associated with any business with a relatively short operating history, including the risk that we will not sustain our investment objective and that the value of our common stock could decline substantially.
The lack of liquidity in our investments may adversely affect our business.
We acquire a significant percentage of our portfolio company investments from privately held companies in directly negotiated transactions. Substantially all of these securities are subject to legal and other restrictions on resale or are otherwise less liquid than exchange-listed securities. We typically would be unable to exit these investments unless and until the portfolio company has a liquidity event such as a sale, refinancing, or initial public offering.
The illiquidity of our investments may make it difficult or impossible for us to sell such investments if the need arises. In addition, if we are required to liquidate all or a portion of our portfolio quickly, we may realize significantly less than the fair value at which we have previously recorded our investments, which could have a material adverse effect on our business, financial condition and results of operations.
Moreover, securities purchased by us that are liquid at the time of purchase may subsequently become illiquid due to events relating to the issuer of the securities, market events, economic conditions, investor perceptions, or the absence of active investment market participants.
6
Table of Contents
Price declines in the corporate leveraged loan market may adversely affect the fair value of our portfolio, reducing our net asset value through increased net unrealized depreciation and the incurrence of realized losses.
Prior to the onset of the financial crisis that began in 2007, securitized investment vehicles, hedge funds and other highly leveraged non-bank financial institutions comprised the majority of the market for purchasing and holding senior and subordinated debt. As the trading price of the loans underlying these portfolios began to deteriorate beginning in the first quarter of 2007, we believe that many institutions were forced to raise cash by selling their interests in performing assets in order to satisfy margin requirements or the equivalent of margin requirements imposed by their lenders. This resulted in a forced deleveraging cycle of price declines, compulsory sales, and further price declines, with falling underlying credit values, widespread redemption requests, and other constraints resulting from the credit crisis generating further selling pressure.
Conditions in the U.S. corporate debt market may experience similar disruption or deterioration in the future, which may cause pricing levels to similarly decline or be volatile. As a result, our net asset value could decline through an increase in unrealized depreciation and incurrence of realized losses in connection with the sale of our investments, which could have a material adverse impact on our business, financial condition and results of operations.
Our ability to achieve our investment objective depends on the Advisors’ ability to manage and support our investment process. If the Advisors were to lose a significant number of their respective key professionals, or terminate the Advisor and/or Sub-Advisory Agreement, our ability to sustain our investment objective could be significantly harmed.
We do not have employees. Additionally, we have no internal management capacity other than our appointed executive officers and are dependent upon the investment expertise, skill and network of business contacts of our Advisors to achieve our investment objective. Our Advisors evaluate, negotiate, structure, execute, monitor, and service our investments. Our success depends to a significant extent on the continued service and coordination of our Advisors, including their respective key professionals. The departure of a significant number of key professionals from KKR and CNL could have a material adverse effect on our ability to sustain our investment objective.
Our ability to sustain our investment objective also depends on the continued ability of our Advisors to identify, analyze, invest in, finance, and monitor companies that meet our investment criteria. Our Advisors’ capabilities in structuring the investment process, providing competent, attentive and efficient services to us, and facilitating access to financing on acceptable terms depend on the involvement of investment professionals in an adequate number of and adequate sophistication to match the corresponding flow of transactions. To sustain our investment objective, our Advisors may need to retain, hire, train, supervise, and manage new investment professionals to participate in our investment selection and monitoring process. Our Advisors may not be able to find qualified investment professionals in a timely manner or at all. Any failure to do so could have a material adverse effect on our business, financial condition and results of operations.
In addition, both the Investment Advisory Agreement and the Sub-Advisory Agreement have termination provisions that allow the agreements to be terminated by us on 60 days’ notice without penalty. Our Investment Advisory Agreement may be terminated at any time, without penalty, by CNL upon 120 days’ notice to us. The Sub-Advisory Agreement may be terminated at any time, without the payment of any penalty, by KKR upon 120 days’ notice and may be terminated, without the payment of penalty, by CNL upon 60 days’ notice if our board of directors or holders of a majority of our outstanding shares of common stock so direct. In addition, CNL and KKR have agreed that, in the event that one of them is removed by us other than for cause, or the advisory agreement of either of them is not renewed, the other will also terminate its agreement with us. The termination of either agreement may adversely affect the quality of our investment opportunities. In addition, in the event either agreement were terminated, it may be difficult for us to replace CNL, or for CNL to replace KKR.
The amount of any distributions we may make is uncertain. We may not be able to pay you distributions, or be able to sustain distributions at any particular level, and our distributions per share may not grow over time, and our distributions per share may be reduced.
We pay distributions out of assets legally available for distribution. However, we cannot assure you that we will achieve investment results that will allow us to sustain a consistent targeted level of cash distributions or year-to-year increases in cash distributions. Our ability to pay distributions might be adversely affected by the impact of the risks described in this report. In addition, the inability to satisfy the asset coverage test applicable to us as a business development company and certain covenants in our credit facilities can limit our ability to pay distributions. We cannot assure you that we will continue to pay distributions to our shareholders in the future.
Our distributions may exceed our earnings; therefore, portions of the distributions that we pay may represent a return of capital to you, which will lower your tax basis in your shares and reduce the amount of funds we have for investment in portfolio companies. We have not established any limit on the extent to which we may use borrowings, if any, or offering proceeds to fund distributions (which may reduce the amount of capital we ultimately invest in portfolio companies).
In the event that we encounter delays in locating suitable investment opportunities, we may pay our distributions from offering proceeds or from borrowings in anticipation of future cash flow, which may constitute a return of your capital and will lower your tax basis in your shares. Distributions from offering proceeds or from borrowings also could reduce the amount of capital we ultimately have available to invest in interests of portfolio companies.
7
Table of Contents
Because our business model depends to a significant extent upon relationships with corporations, financial institutions and investment firms, the inability of the Advisors to maintain or develop these relationships, or the failure of these relationships to generate investment opportunities, could adversely affect our business.
We expect that CNL and KKR will depend on their relationships with corporations, financial institutions and investment firms, and we rely indirectly to a significant extent upon these relationships to provide us with potential investment opportunities. If CNL or KKR fails to maintain its existing relationships or develop new relationships or sources of investment opportunities, we may not be able to grow our Investment Portfolio. In addition, individuals with whom CNL and KKR have relationships are not obligated to provide us with investment opportunities, and, therefore, there is no assurance that such relationships will generate investment opportunities for us.
We may face increasing competition for investment opportunities, which could delay further deployment of our capital, reduce returns and result in losses.
We compete for investments with other business development companies and investment funds (including registered investment companies, private equity funds and mezzanine funds), as well as traditional financial services companies such as commercial banks and other sources of funding. Moreover, alternative investment vehicles, such as hedge funds, continue to increase their investment focus in our target market of privately owned U.S. companies. Moreover, we have experienced, and may continue to experience, increased competition from commercial banks and investment vehicles who lend to the middle market, including lending activity in our target market of privately-owned U.S. companies. Additionally, the Federal Reserve Bank and U.S. banking regulators may periodically provide incentives to U.S. commercial banks to originate more loans in the middle market of private companies. As a result of these new entrants and regulatory incentives, competition for investment opportunities in privately owned U.S. companies may intensify. Many of our competitors are substantially larger and have considerably greater financial, technical, and marketing resources than we do. For example, some competitors may have a lower cost of capital and access to funding sources that are not available to us. In addition, some of our competitors may have higher risk tolerances or different risk assessments than we have. These characteristics could allow our competitors to consider a wider variety of investments, establish more relationships and offer better pricing and more flexible structuring than we are able to do.
We may lose investment opportunities if we do not match our competitors’ pricing, terms, and investment structure criteria. If we are forced to match these competitors’ investment terms criteria, we may not be able to achieve acceptable returns on our investments or may bear substantial risk of capital loss. A significant increase in the number and/or the size of our competitors in this target market could force us to accept less attractive investment terms. Furthermore, many of our competitors are not subject to the regulatory restrictions that the 1940 Act imposes on us as a business development company or the source of income, asset diversification and distribution requirements we must satisfy to maintain our RIC status. The competitive pressures we face, and the manner in which we react or adjust to these competitive pressures, may have a material adverse effect on our business, financial condition, results of operations, effective yield on investments, investment returns, leverage ratio, and cash flows. As a result of this competition, we may not be able to take advantage of attractive investment opportunities from time to time. Also we may not be able to identify and make investments that are consistent with our investment objective.
A significant portion of our Investment Portfolio is recorded at fair value as determined in good faith in accordance with procedures established by our board of directors and, as a result, there is and will be uncertainty as to the value of our portfolio investments and uncertainty as the accuracy of our net asset value.
A significant portion of our Investment Portfolio is comprised of investments that are negotiated and originated directly with portfolio companies. Such investments should be considered illiquid or requiring a lengthy time to sell. Additionally, such investments feature more uncertainty as to the precise accuracy of their fair market value since these investments are not positioned in any active securities exchange or secondary market that would otherwise enable informed market participants and dealers to submit bid prices.
Under the 1940 Act, we are required to carry our portfolio investments at market value or, if there is no readily available market value, at fair value as determined in accordance with procedures established by our board of directors. There is not a public market or active secondary market for many of the securities of the privately held companies in which we invest. The majority of our investments are not publicly traded or actively traded on a secondary market but, instead, may be traded on a privately negotiated over-the-counter secondary market for institutional investors. As a result, we value a significant portion of these securities quarterly at fair value as determined in good faith in accordance with procedures established by our board of directors.
The determination of fair value, and thus the amount of unrealized gains or losses we may recognize in any reporting quarter, is to a degree subjective, and our Advisors have a conflict of interest in making recommendations of fair value. We value these securities quarterly at fair value as determined in good faith in accordance with procedures established by our board of directors based on input from our Advisors and our audit committee. Our board of directors utilizes the services of independent third-party valuation firms to aid it in determining the fair value of certain securities. The types of factors that may be considered in determining the fair values of our investments include the nature and realizable value of any collateral, the portfolio company’s ability to make payments and its earnings, the markets in which the portfolio company does business, comparison to publicly traded companies,
8
Table of Contents
present value analysis of estimated future cash flow, current market interest rates and other relevant factors. Because such valuations, and particularly valuations of private securities and private companies, are inherently uncertain, the valuations may fluctuate significantly over short periods of time due to changes in current market conditions. The determinations of fair value in accordance with procedures established by our board of directors may differ materially from the values that would have been used if an active market and market quotations existed for these investments. Our net asset value could be adversely affected if the determinations regarding the fair value of our investments were materially higher than the values that we ultimately realize upon the disposal of such investments. Additionally, a substantial over-estimate of the fair value of our investments may result in excessive borrowing advances relative to collateral value in certain of our credit facilities and lead to remedial margin calls.
Our board of directors may change our operating policies and strategies without prior notice or shareholder approval, the effects of which may be adverse to our shareholders.
Our board of directors has the authority to modify or waive our current operating policies, investment criteria and strategies without prior notice and without shareholder approval. We cannot predict the effect any changes to our current operating policies, investment criteria and strategies would have on our business, net asset value, operating results and the value of our common stock. However, the effects might be adverse, which could negatively impact our ability to pay you distributions and cause you to lose all or part of your investment. Moreover, we will have significant flexibility in investing the net proceeds of our Follow-On Offering and may use the net proceeds from our Follow-On Offering in ways with which investors in us may not agree.
Changes in laws or regulations governing our operations may adversely affect our business or cause us to alter our business strategy.
We and our portfolio companies are subject to regulation at the local, state, and federal levels. Changes to the laws and regulations governing our permitted investments may require a change to our investment strategy. Such changes could differ materially from our strategies and plans as set forth in this report and may shift our investment focus from the areas of expertise of our Advisors. Thus, any such changes, if they occur, could have a material adverse effect on our results of operations and the value of your investment.
We may experience fluctuations in our quarterly results.
We could experience fluctuations in our quarterly operating results due to a number of factors, including our ability or inability to make investments in companies that meet our investment criteria, the interest rate payable and default rates on the debt securities we acquire, the level of our expenses, variations in and the timing of the recognition of realized and unrealized gains or losses, the degree to which we encounter competition in our markets, and general economic conditions. These occurrences could have a material adverse effect on our results of operations, the value of your investment in us and our ability to pay distributions to you and our other shareholders.
Any unrealized losses we experience on our portfolio may be an indication of future realized losses, which could reduce our income available for distribution.
As a business development company, we are required to carry our investments at market value or, if no market value is ascertainable, at the fair value as determined in good faith in accordance with procedures established by our board of directors. Decreases in the market values or fair values of our investments relative to amortized cost will be recorded as unrealized depreciation. Any unrealized losses in our loan portfolio could be an indication of a portfolio company’s inability to meet its repayment obligations to us with respect to the affected loans. This could result in realized losses in the future and ultimately in reductions of our income available for distribution in future periods. In addition, decreases in the market value or fair value of our investments will reduce our net asset value.
We are a non-diversified investment company within the meaning of the 1940 Act, and therefore we are not limited with respect to the proportion of our assets that may be invested in securities of a single issuer.
We are classified as a non-diversified investment company within the meaning of the 1940 Act, which means that we are not limited by the 1940 Act with respect to the proportion of our assets that we may invest in securities of a single issuer. To the extent that we hold large positions in the securities of a small number of issuers, or within a particular industry, our net asset value may fluctuate to a greater extent than that of a diversified investment company as a result of changes in the issuer’s financial condition or the market’s assessment of the issuer. We may also be more susceptible to any single economic or regulatory occurrence than a diversified investment company. However, we are subject to the diversification requirements applicable to RICs under Subchapter M of the Code.
If we internalize our management functions, your interest in us could be diluted, we could incur other significant costs associated with being self-managed and may not be able to retain or replace key personnel, and we may have increased exposure to litigation as a result of internalizing our management functions.
We may internalize management functions provided by our Advisors. Our board of directors may decide in the future to acquire assets and personnel from our Advisors or their affiliates for consideration that would be negotiated at that time. There can be
9
Table of Contents
no assurances that we will be successful in retaining our Advisors’ key personnel in the event of a management internalization transaction. In the event we were to acquire either of our Advisors, we cannot be sure of the form or amount of consideration or other terms relating to any such acquisition, which could take many forms, including cash payments, promissory notes and/or shares of our stock. The payment of such consideration could reduce our net investment income.
We cannot reasonably estimate the amount of fees to our Advisors that we would avoid paying, and the costs we would incur, if we acquired these entities, or acquired assets and personnel from these entities. If the expenses we assume as a result of management internalization are higher than the expenses we avoid paying to our Advisors, our net investment income would be lower than it otherwise would have been had we not acquired these entities, or acquired assets and personnel from these entities.
Additionally, if we internalize our management functions, we could have difficulty integrating these functions. Currently, the officers and associates of our administrator and related parties and contracting parties with our administrator perform general and administrative functions, including accounting and financial reporting. We may fail to properly identify the appropriate mix of personnel and capital needs to operate as a stand-alone entity. An inability to manage an internalization transaction effectively could result in our incurring additional costs and divert our management’s attention from effectively managing our portfolio or our operations.
In recent years, management internalization transactions have been the subject of shareholder litigation. Shareholder litigation can be costly and time-consuming, and there can be no assurance that any litigation expenses we might incur would not be significant or that the outcome of litigation would be favorable to us. Any amounts we are required to expend defending any such litigation will reduce our net investment income.
Our access to confidential information may restrict our ability to take action with respect to some investments, which, in turn, may negatively affect our results of operations.
We, directly or through our Advisors, may obtain confidential information about the companies in which we have invested or may invest. If we do possess confidential information about such companies, there may be restrictions on our ability to make, dispose of, increase the amount of, or otherwise take action with respect to, an investment in those companies. The impact of these restrictions on our ability to take action with respect to our investments could have an adverse effect on our results of operations.
Risks Related to our Advisors and their Respective Affiliates
The Advisors have limited experience managing a business development company.
Our Advisors have only two years of experience managing a vehicle regulated as a business development company and may not be able to continue to operate our business successfully or achieve our investment objective. As a result, an investment in our shares of common stock may entail more risk than the shares of common stock of a comparable company with a substantial operating history.
The 1940 Act and the Code impose numerous constraints on the operations of business development companies and RICs that do not apply to the other types of investment vehicles previously managed by the Advisors. For example, under the 1940 Act, business development companies are generally required to invest at least 70% of their total assets primarily in securities of qualifying U.S. private or thinly traded companies. Moreover, qualification for RIC tax treatment under subchapter M of the Code requires satisfaction of source-of-income, asset diversification and other requirements. The failure to comply with these provisions in a timely manner could prevent us from qualifying as a business development company or RIC or could force us to pay unexpected taxes and penalties, which could be material. The Advisors’ lack of experience in managing a portfolio of assets under such constraints may hinder their ability to take advantage of attractive investment opportunities and, as a result, achieve our investment objective.
The Advisors and their respective affiliates, including our officers and some of our directors, may face conflicts of interest caused by compensation arrangements with us and our affiliates, which could result in increased risk-taking by us.
The Advisors and their respective affiliates will receive substantial fees from us in return for their services, including certain incentive fees based on the amount of appreciation of our investments. These fees could influence the advice provided to us. Generally, the more equity we sell in public offerings and the greater the risk assumed by us with respect to our investments, the greater the potential for growth in our assets and profits (and, correlatively, the fees payable by us to the Managing Dealer and the Advisors). These compensation arrangements could affect our Advisors’ or their respective affiliates’ judgment with respect to public offerings of equity and investments made by us, which allow the Managing Dealer to earn additional marketing support fees and the Advisors to earn increased asset management fees.
The time and resources that individuals associated with the Advisors devote to us may be diverted, and we may face additional competition due to the fact that neither CNL nor KKR is prohibited from raising money for or managing another entity that makes the same types of investments that we target.
The Advisors currently manage other investment entities and are not prohibited from raising money for and managing future investment entities that make the same types of investments as those we target. As a result, the time and resources that our Advisors devote to us may be diverted, and during times of intense activity in other programs they may devote less time and resources to our business than is necessary or appropriate. In addition, we may compete with any such investment entity for the same investors and investment opportunities.
10
Table of Contents
The Advisors will experience conflicts of interest in connection with the management of our business affairs.
Our Advisors will experience conflicts of interest in connection with the management of our business affairs, including relating to the allocation of investment opportunities by the Advisors and their respective affiliates; compensation to the Advisors; services that may be provided by the Advisors and their respective affiliates to issuers in which we invest; investments by us and other clients of the Advisors, subject to the limitations of the 1940 Act; the formation of additional investment funds by the Advisors; differing recommendations given by the Advisors to us versus other clients; the Advisors’ use of information gained from issuers in our portfolio for investments by other clients, subject to applicable law; and restrictions on the Advisors’ use of “inside information” with respect to potential investments by us.
The Advisors have incentives to favor their respective other accounts and clients over us, which may result in conflicts of interest that could be harmful to us.
Because our Advisors manage assets for other investment companies, pooled investment vehicles and/or other accounts (including institutional clients, pension plans and certain high net worth individuals), certain conflicts of interest are present. For instance, an Advisor may receive fees from certain accounts that are higher than the fees received by the Advisor from us, or receive a performance-based fee on certain accounts. In those instances, a portfolio manager for the Advisor has an incentive to favor the higher fee and/or performance-based fee accounts over us. In addition, a conflict of interest exists to the extent an Advisor has proprietary investments in certain accounts, where its portfolio managers or other employees have personal investments in certain accounts, or when certain accounts are investment options in the Advisor’s employee benefit plans. The Advisors have an incentive to favor these accounts over us. Our board of directors monitors these conflicts.
An Advisor’s actions on behalf of its other accounts and clients may be adverse to us and our investments and harmful to us.
Each of our Advisors manages assets for accounts other than us, including private funds (for purposes of this section, “Advisor Funds”). Actions taken by an Advisor on behalf of its Advisor Funds may be adverse to us and our investments, which could harm our performance. For example, we may invest in the same credit obligations as other Advisor Funds, although, to the extent permitted under the 1940 Act, our investments may include different obligations of the same issuer. Decisions made with respect to the securities held by one Advisor Fund may cause (or have the potential to cause) harm to the different class of securities of the issuer held by other Advisor Funds (including us). As a further example, an Advisor may manage accounts that engage in short sales of (or otherwise take short positions in) securities or other instruments of the type in which we invest, which could harm our performance for the benefit of the accounts taking short positions, if such short positions cause the market value of the securities to fall.
Our Advisors will face restrictions on their use of inside information about existing or potential investments that they acquire through their relationships with other advisory clients, and those restrictions may limit the freedom of our Advisors to enter into or exit from investments for us, which could have an adverse effect on our results of operations.
In the course of their respective duties, the members, officers, directors, employees, principals or affiliates of our Advisors may come into possession of material, non-public information. The possession of such information may, to our detriment, limit the ability of our Advisors to buy or sell a security or otherwise to participate in an investment opportunity for us. In certain circumstances, employees of our Advisors may serve as board members or in other capacities for portfolio or potential portfolio companies, which could restrict our ability to trade in the securities of such companies. For example, if personnel of an Advisor come into possession of material non-public information with respect to our investments, such personnel will be restricted by our Advisor’s information-sharing policies and procedures or by law or contract from sharing such information with our management team, even where the disclosure of such information would be in our best interests or would otherwise influence decisions taken by the members of the management team with respect to that investment. This conflict and these procedures and practices may limit the freedom of our Advisors to enter into or exit from potentially profitable investments for us which could have an adverse effect on our results of operations. Accordingly, there can be no assurance that we will be able to fully leverage the resources and industry expertise of our Advisors’ other businesses. Additionally, there may be circumstances in which one or more individuals associated with an Advisor will be precluded from providing services to us because of certain confidential information available to those individuals or to other parts of the Advisor.
We may be obligated to pay our Advisors incentive fees even if we incur a net loss due to a decline in the value of our portfolio and even if our earned interest income is not payable in cash.
Our Investment Advisory Agreement entitles CNL to receive an incentive fee based on our pre-incentive fee net investment income regardless of any capital losses. In such case, we may be required to pay CNL an incentive fee for a fiscal quarter even if there is a decline in the value of our portfolio or if we incur a net loss for that quarter. CNL will pay 50% of any such incentive fee to KKR.
Any incentive fee payable by us that relates to our pre-incentive fee net investment income may be computed and paid on income that may include interest that has been accrued but not yet received, or interest in the form of securities received rather than
11
Table of Contents
cash (“payment-in-kind”, or “PIK”, income). If a portfolio company defaults on a loan that is structured to provide accrued interest income, it is possible that accrued interest income previously included in the calculation of the incentive fee will become uncollectible. Our Advisors are not obligated to reimburse us for any part of the incentive fee they received that was based on accrued interest income that we never received as a result of a subsequent default, and such circumstances would result in our paying a subordinated incentive fee on income we never receive. PIK income will be counted toward the incentive fee that we are obligated to pay our Advisors even though we do not receive the income in the form of cash.
The incentive fee that we pay does not include a “high water” benchmark, which means that in any year we may be obligated to pay an incentive fee even if we experience a loss over the entire course of said year.
For federal income tax purposes, we may be required to recognize taxable income in some circumstances in which we do not receive a corresponding payment in cash and to make distributions with respect to such income to maintain our status as a RIC. Under such circumstances, we may have difficulty meeting the annual distribution requirement necessary to maintain RIC tax treatment under the Code. This difficulty in making the required distribution may be amplified to the extent that we are required to pay a subordinated incentive fee on income with respect to such accrued income. As a result, we may have to sell some of our investments at times and/or at prices we would not consider advantageous, raise additional debt or equity capital, or forgo new investment opportunities for this purpose. If we are not able to obtain cash from other sources, we may fail to qualify for RIC tax treatment and thus become subject to corporate-level income tax.
Our incentive fee may induce our Advisors to make speculative investments.
The incentive fee payable by us to CNL (50% of which will be paid to KKR) may create an incentive for our Advisors to make investments on our behalf that are risky or more speculative than would be the case in the absence of such compensation arrangements. The way in which the incentive fee is determined may encourage our Advisors to use leverage to increase the leveraged return on our Investment Portfolio.
In addition, the fact that our base management fee— a portion of which is paid to KKR —is payable based upon our gross assets (which includes any borrowings for investment purposes, any unrealized depreciation or appreciation on the TRS and any cash collateral on deposit pursuant to the terms of the TRS) may encourage our Advisors to use leverage to make additional investments. Such a practice could result in our investing in more speculative securities than would otherwise be the case, which could result in higher investment losses, particularly during cyclical economic downturns. Under certain circumstances, the use of substantial leverage may increase the likelihood of our default on our borrowings, which would be detrimental to holders of our common stock.
Our ability to enter into transactions with our affiliates will be restricted.
We are prohibited under the 1940 Act from participating in certain transactions with certain of our affiliates without the prior approval of a majority of the independent directors and, in some cases, the SEC. Any person that owns, directly or indirectly, 5% or more of our outstanding voting securities will be our affiliate for purposes of the 1940 Act, and we will generally be prohibited from buying or selling any securities from or to such affiliate on a principal basis, absent the prior approval of our board of directors and, in some cases, the SEC. The 1940 Act also prohibits certain “joint” transactions with certain of our affiliates, which in certain circumstances could include investments in the same portfolio company (whether at the same or different times to the extent the transaction involves jointness), without prior approval of our board of directors and, in some cases, the SEC. If a person acquires more than 25% of our voting securities, we will be prohibited from buying or selling any security from or to such person or certain of that person’s affiliates, or entering into prohibited joint transactions with such persons, absent the prior approval of the SEC. Similar restrictions limit our ability to transact business with our officers or directors or their affiliates. The SEC has interpreted the business development company regulations governing transactions with affiliates to prohibit certain joint transactions involving entities that share a common investment adviser. As a result of these restrictions, we may be prohibited from buying or selling any security from or to any portfolio company that is controlled by a fund managed by either of our Advisors or their respective affiliates without the prior approval of the SEC, which may limit the scope of investment opportunities that would otherwise be available to us.
However, our SEC Exemptive Order allows us to invest alongside our Advisors’ and their respective affiliates’ other clients, including other entities they manage, which we refer to as affiliates’ other clients, in certain circumstances when doing so is consistent with applicable law and SEC staff interpretations and guidance. Such co-investment is subject to a number of conditions contained in the order, including requirements for oversight of these transactions by our board of directors. We may also invest alongside the other clients of our Advisors, as otherwise permissible under regulatory guidance, applicable regulations and the Advisors’ allocation policies. It is our policy to base our board of directors’ determinations as to the amount of capital available for investment on such factors as: the amount of cash on-hand, existing commitments and reserves, the targeted leverage level, the targeted asset mix and diversification requirements and other investment policies and restrictions set by our board of directors or imposed by applicable laws, rules, regulations or interpretations. However, we can offer no assurance that investment opportunities will be allocated to us fairly or equitably in the short-term or over time.
The SEC Exemptive Order permits us to participate in certain transactions originated by the Advisors or their respective affiliates. However, affiliates of our Advisors whose primary business includes the origination of investments may engage in investment advisory businesses with client accounts that compete with us, and those affiliates have no obligation to make their originated investment opportunities available to our Advisors or to us.
12
Table of Contents
In situations when co-investment with affiliates’ other clients is not permitted under the 1940 Act and related rules, existing or future staff guidance, or the terms and conditions of exemptive relief granted to us by the SEC (as discussed above), our Advisors will need to decide which client or clients will proceed with the investment. Generally, we will not have an entitlement to make a co-investment in these circumstances and, to the extent that another client elects to proceed with the investment, we will not be permitted to participate. Moreover, except in certain circumstances, we are unable to invest in any issuer in which an affiliate’s other client holds a controlling interest.
We may make investments that could give rise to a conflict of interest.
We do not expect to invest in, or hold securities of, companies that are controlled by affiliates’ other clients. However, an affiliate’s other clients may invest in, and gain control over, one of our portfolio companies. If an affiliate’s other client, or clients, gains control over one of our portfolio companies, it may create conflicts of interest and may subject us to certain restrictions under the 1940 Act. As a result of these conflicts and restrictions our Advisors may be unable to implement our investment strategies as effectively as they could have in the absence of such conflicts or restrictions. For example, as a result of a conflict or restriction, our Advisors may be unable to engage in certain transactions that they would otherwise pursue. In order to avoid these conflicts and restrictions, our Advisors may choose to exit these investments prematurely and, as a result, we would forego any positive returns associated with such investments. In addition, to the extent that an affiliate’s other client holds a different class of securities than we as a result of such transactions, our interests may not be aligned.
We are not managed by KKR & Co. L.P. or CNL Financial Group, Inc., but rather subsidiaries of both and may not replicate the success of those entities.
We are managed by our Advisors and not by CNL Financial Group Inc. or KKR & Co. L.P.. Our performance may be lower or higher than the performance of other entities managed by CNL Financial Group Inc. or KKR & Co. L.P. or their affiliates and their past performance is no guarantee of our future results.
Our Advisors’ liability is limited under the Investment Advisory and Investment Sub-Advisory Agreements, and we are required to indemnify our Advisors against certain liabilities, which may lead our Advisors to act in a riskier manner on our behalf than they would when acting for their own account.
Our Advisors have not assumed any responsibility to us other than to render the services described in the Investment Advisory and Investment Sub-Advisory Agreements, and they will not be responsible for any action of our board of directors in declining to follow our Advisors’ advice or recommendations. Pursuant to the Investment Advisory and Investment Sub-Advisory Agreements, our Advisors and their respective directors, officers, shareholders, members, agents, employees, controlling persons, and any other person or entity affiliated with, or acting on behalf of the Advisors will not be liable to us for their acts under the Investment Advisory and Investment Sub-Advisory Agreements, absent willful misfeasance, bad faith, gross negligence or reckless disregard in the performance of their duties. We have also agreed to indemnify, defend and protect our Advisors and their respective directors, officers, shareholders, members, agents, employees, controlling persons and any other person or entity affiliated with, or acting on behalf of the Advisors with respect to all damages, liabilities, costs and expenses resulting from acts of our Advisors not arising out of willful misfeasance, bad faith, gross negligence or reckless disregard in the performance of their duties. These protections may lead our Advisors to act in a riskier manner when acting on our behalf than they would when acting for their own account.
Risks Related to Business Development Companies
The requirement that we invest a sufficient portion of our assets in qualifying assets could preclude us from investing in accordance with our current business strategy; conversely, the failure to invest a sufficient portion of our assets in qualifying assets could result in our failure to maintain our status as a business development company.
As a business development company, the 1940 Act prohibits us from acquiring any assets other than certain qualifying assets unless, at the time of and after giving effect to such acquisition, at least 70% of our total assets are qualifying assets. Therefore, we may be precluded from investing in what we believe are attractive investments if such investments are not qualifying assets. Conversely, if we fail to invest a sufficient portion of our assets in qualifying assets, we could lose our status as a business development company, which would have a material adverse effect on our business, financial condition, and result of operations. Similarly, these rules could prevent us from making additional investments in existing portfolio companies, which could result in the dilution of our position, or could require us to dispose of investments at an inopportune time to comply with the 1940 Act. If we were forced to sell non-qualifying investments in the portfolio for compliance purposes, the proceeds from such sale could be significantly less than the current value of such investments.
13
Table of Contents
Failure to maintain our status as a business development company would reduce our operating flexibility.
If we do not remain a business development company, we might be regulated as a closed-end investment company under the 1940 Act, which would subject us to substantially more regulatory restrictions and correspondingly decrease our operating flexibility.
Regulations governing our operation as a business development company and RIC will affect our ability to raise capital and the way in which we raise additional capital or borrow for investment purposes, which may have a negative effect on our growth. As a business development company, the necessity of raising additional capital may expose us to risks, including the typical risks associated with leverage.
As a result of the annual distribution requirement to qualify as a RIC, we may need to access the capital markets periodically to raise cash to fund new investments in portfolio companies. We may issue “senior securities,” including borrowing money from banks or other financial institutions only in amounts such that our asset coverage, as defined in the 1940 Act, equals at least 200% after such incurrence or issuance. If we issue senior securities, we are exposed to typical risks associated with leverage, including an increased risk of loss. Our ability to issue different types of securities is also limited. Compliance with these distribution requirements may unfavorably limit our investment opportunities and reduce our ability in comparison to other companies to profit from favorable spreads between the rates at which we can borrow and the rates at which we can lend. Therefore, we intend to continuously issue equity securities, which may lead to shareholder dilution.
We may borrow for investment purposes. If the value of our assets declines, we may be unable to satisfy the asset coverage test, which would prohibit us from paying distributions and could prevent us from qualifying as a RIC, which would generally result in a corporate-level tax on any income and net gains. If we cannot satisfy the asset coverage test, we may be required to sell a portion of our investments and, depending on the nature of our debt financing, repay a portion of our indebtedness at a time when such sales may be disadvantageous. Also, any amounts that we use to service our indebtedness would not be available for distributions to our common shareholders.
In addition, we anticipate that as market conditions permit, we may securitize our loans to generate cash for funding new investments. To securitize loans, we may create a wholly owned subsidiary, contribute a pool of loans to the subsidiary and have the subsidiary issue primarily investment grade debt securities to purchasers who we would expect to be willing to accept a substantially lower interest rate than the loans earn. We would retain all or a portion of the equity in the securitized pool of loans. Our retained equity would be exposed to any losses on the portfolio of loans before any of the debt securities would be exposed to such losses. Accordingly, if the pool of loans experienced a low level of losses due to defaults, we would earn an incremental amount of income on our retained equity but we would be exposed, up to the amount of equity we retained, to that proportion of any losses we would have experienced if we had continued to hold the loans in our portfolio.
If we cannot obtain debt financing or equity capital on acceptable terms, our ability to acquire investments and to expand our operations will be adversely affected.
The net proceeds from our sale of shares will be used for our investment opportunities, and, if necessary, the payment of operating expenses and the payment of various fees and expenses such as management fees, incentive, other fees and distributions. Any working capital reserves we maintain may not be sufficient for investment purposes, and we may require additional debt financing or equity capital to operate. Pursuant to tax rules that apply to us, we are required to distribute at least 90% of our net ordinary income and net short-term capital gains in excess of net long-term capital losses, if any, to our shareholders to maintain our RIC status. Accordingly, in the event that we need additional capital in the future for investments or for any other reason we may need to access the capital markets periodically to issue debt or equity securities or borrow from financial institutions in order to obtain such additional capital. These sources of funding may not be available to us due to unfavorable economic conditions, which could increase our funding costs, limit our access to the capital markets or result in a decision by lenders not to extend credit to us. Consequently, if we cannot obtain further debt or equity financing on acceptable terms, our ability to acquire additional investments and to expand our operations will be adversely affected. As a result, we would be less able to achieve portfolio diversification and our investment objective, which may negatively impact our results of operations and reduce our ability to make distributions to our shareholders.
Risks Related to our Investments
Our investments in portfolio companies may be risky, and we could lose all or part of our investment.
We pursue a strategy focused on investing primarily in the debt of privately owned U.S. companies with a focus on originated transactions sourced through the networks of our Advisors.
| • | Senior Debt. When we invest in senior debt, we generally seek to take a security interest in the available assets of the portfolio company, including equity interests in any of its subsidiaries. There is a risk that the collateral securing our investments may decrease in value over time or lose its entire value, may be difficult to sell in a timely manner, may be difficult to appraise and may fluctuate in value based upon the success of the business and market conditions, including as a result of the inability of the portfolio company to raise additional capital. Also, in some circumstances, our lien could be subordinated to claims of other creditors. In addition, deterioration in a portfolio company’s financial condition and prospects, including its inability to raise |
14
Table of Contents
| additional capital, may be accompanied by deterioration in the value of the collateral for the loan. Consequently, the fact that a loan is secured does not guarantee that we will receive principal and interest payments according to the loan’s terms, or at all, or that we will be able to collect on the loan should we be forced to enforce our remedies. |
| • | Subordinated Debt. Our subordinated debt investments are generally subordinated to senior debt and are generally unsecured. This may result in a heightened level of risk and volatility or a loss of principal, which could lead to the loss of the entire investment. These investments may involve additional risks that could adversely affect our investment returns. To the extent interest payments associated with such debt are deferred, such debt may be subject to greater fluctuations in valuations, and such debt could subject us and our shareholders to non-cash income. Since we will not receive any principal repayments prior to the maturity of some of our subordinated debt investments, such investments will be of greater risk than amortizing loans. |
| • | Equity Investments. We expect to make selected equity investments. In addition, when we invest in senior and subordinated debt, we may acquire warrants or options to purchase equity securities or benefit from other types of equity participation. Our goal is ultimately to dispose of these equity interests and realize gains upon our disposition of such interests. However, the equity interests we receive may not appreciate in value and, in fact, may decline in value. Accordingly, we may not be able to realize gains from our equity interests, and any gains that we do realize on the disposition of any equity interests may not be sufficient to offset any other losses we experience. |
Most debt securities in which we invest will not be rated by any rating agency and, if they were rated, they would be rated as below investment grade quality. Debt securities rated below investment grade quality are generally regarded as having predominantly speculative characteristics and may carry a greater risk with respect to a borrower’s capacity to pay interest and repay principal.
To the extent original issue discount (OID) and payment-in-kind (PIK) interest income constitutes a portion of our income, we will be exposed to risks associated with the deferred receipt of cash representing such income.
Our investments may include OID and PIK instruments. To the extent OID and PIK constitute a portion of our income, we will be exposed to typical risks associated with such income being required to be included in accounting income and taxable income prior to receipt of cash, including the following:
| • | OID and PIK instruments may have unreliable valuations because the accruals require judgments about collectability. |
| • | OID and PIK instruments may create heightened credit risks because the inducement to the borrower to accept higher interest rates in exchange for the deferral of cash payments typically represents, to some extent, speculation on the part of the borrower. |
| • | For accounting purposes, cash distributions to shareholders that include a component of OID or PIK income do not come from paid-in capital, although they may be paid from the offering proceeds. Thus, although a distribution of OID or PIK income may come from the cash invested by the shareholders, the 1940 Act does not require that shareholders be given notice of this fact. |
| • | The presence of OID and PIK create the risk of non-refundable cash payments to the Advisors in the form of subordinated incentive fees on income based on non-cash OID and PIK accruals that may never be realized. |
Our portfolio companies may incur debt that ranks equally with, or senior to, our investments in such companies.
We pursue a strategy focused on investing primarily in the debt of privately owned U.S. companies with a focus on originated transactions sourced through the networks of our Advisors. Our portfolio companies may have, or may be permitted to incur, other debt that ranks equally with, or senior to, the debt in which we invest. By their terms, such debt instruments may entitle the holders to receive payment of interest or principal on or before the dates on which we are entitled to receive payments with respect to the debt instruments in which we invest. Also, in the event of insolvency, liquidation, dissolution, reorganization or bankruptcy of a portfolio company, holders of debt instruments ranking senior to our investment in that portfolio company would typically be entitled to receive payment in full before we receive any distribution. After repaying such senior creditors, such portfolio company may not have any remaining assets to use for repaying its obligation to us. In the case of debt ranking equally with debt instruments in which we invest, we would have to share on an equal basis any distributions with other creditors holding such debt in the event of an insolvency, liquidation, dissolution, reorganization or bankruptcy of the relevant portfolio company.
Subordinated liens on collateral securing debt investments that we will make to our portfolio companies may be subject to control by senior creditors with first priority liens. If there is a default, the value of the collateral may not be sufficient to repay in full both the first priority creditors and us.
Certain debt investments that we make in portfolio companies will be secured on a second priority basis by the same collateral securing senior debt of such companies. The first priority liens on the collateral will secure the portfolio company’s obligations under any outstanding senior debt and may secure certain other future debt that may be permitted to be incurred by the portfolio company under the agreements governing the debt. The holders of obligations secured by the first priority liens on the
15
Table of Contents
collateral will generally control the liquidation of and be entitled to receive proceeds from any realization of the collateral to repay their obligations in full before us. In addition, the value of the collateral in the event of liquidation will depend on market and economic conditions, the availability of buyers and other factors. There can be no assurance that the proceeds, if any, from the sale or sales of all of the collateral would be sufficient to satisfy the debt obligations secured by the second priority liens after payment in full of all obligations secured by the first priority liens on the collateral. If such proceeds are not sufficient to repay amounts outstanding under the debt obligations secured by the second priority liens, then we, to the extent not repaid from the proceeds of the sale of the collateral, will only have an unsecured claim against the portfolio company’s remaining assets, if any.
We may also make unsecured debt investments in portfolio companies, meaning that such investments will not benefit from any interest in collateral of such companies. Liens on such portfolio companies’ collateral, if any, will secure the portfolio company’s obligations under its outstanding secured debt and may secure certain future debt that is permitted to be incurred by the portfolio company under its secured debt agreements. The holders of obligations secured by such liens will generally control the liquidation of, and be entitled to receive proceeds from, any realization of such collateral to repay their obligations in full before us. In addition, the value of such collateral in the event of liquidation will depend on market and economic conditions, the availability of buyers and other factors. There can be no assurance that the proceeds, if any, from sales of such collateral would be sufficient to satisfy our unsecured debt obligations after payment in full of all secured debt obligations. If such proceeds were not sufficient to repay the outstanding secured debt obligations, then our unsecured claims would rank equally with the unpaid portion of such secured creditors’ claims against the portfolio company’s remaining assets, if any.
The rights we may have with respect to the collateral securing the debt investments we make in our portfolio companies with senior debt outstanding may also be limited pursuant to the terms of one or more inter-creditor agreements that we enter into with the holders of senior debt. Under such an inter-creditor agreement, at any time that obligations that have the benefit of the first priority liens are outstanding, any of the following actions that may be taken in respect of the collateral will be at the direction of the holders of the obligations secured by the first priority liens: the ability to cause the commencement of enforcement proceedings against the collateral; the ability to control the conduct of such proceedings; the approval of amendments to collateral documents; releases of liens on the collateral; and waivers of past defaults under collateral documents. We may not have the ability to control or direct such actions, even if our rights are adversely affected.
There may be circumstances where our debt investments could be subordinated to claims of other creditors or we could be subject to lender liability claims.
Although we generally structure certain of our investments as senior debt, if one of our portfolio companies were to go bankrupt, depending on the facts and circumstances, including the extent to which we actually provided managerial assistance to that portfolio company or a representative of us or the Advisors sat on the board of directors of such portfolio company, a bankruptcy court might re-characterize our debt investment and subordinate all or a portion of our claim to that of other creditors. In situations where a bankruptcy carries a high degree of political significance, our legal rights may be subordinated to other creditors.
In addition, a number of U.S. judicial decisions have upheld judgments obtained by borrowers against lending institutions on the basis of various evolving legal theories, collectively termed “lender liability.” Generally, lender liability is founded on the premise that a lender has violated a duty (whether implied or contractual) of good faith, commercial reasonableness and fair dealing, or a similar duty owed to the borrower or has assumed an excessive degree of control over the borrower resulting in the creation of a fiduciary duty owed to the borrower or its other creditors or shareholders. Because of the nature of our investments in portfolio companies (including that, as a business development company, we may be required to provide managerial assistance to those portfolio companies), we may be subject to allegations of lender liability.
We generally will not control the business operations of our portfolio companies and, due to the illiquid nature of our holdings in our portfolio companies, may not be able to dispose of our interest in our portfolio companies.
We do not expect to control most of our portfolio companies, although we may have board representation or board observation rights, and our debt agreements may impose certain restrictive covenants on our borrowers. As a result, we are subject to the risk that a portfolio company in which we invest may make business decisions with which we disagree and the management of such company, as representatives of the holders of their common equity, may take risks or otherwise act in ways that do not serve our interests as debt investors. Due to the lack of liquidity for our investments in non-traded companies, we may not be able to dispose of our interests in our portfolio companies as readily as we would like or at an appropriate valuation. As a result, a portfolio company may make decisions that could decrease the value of our portfolio holdings.
We are exposed to risks associated with changes in interest rates.
We are subject to financial market risks, including changes in interest rates. Because we use borrow money to finance a portion of our Investment Portfolio, then our net investment income depends, in part, upon the difference between the rate at which we borrow funds and the rate at which we invest those funds. As a result, we can offer no assurance that a significant change in market interest rates will not have a material adverse effect on our net investment income. In periods of rising interest rates when we have debt outstanding, our cost of funds will increase, which could reduce our net investment income.
16
Table of Contents
In addition, interest rates have recently been at or near historic lows. In the event of a significant rising interest rate environment, our portfolio companies with adjustable-rate loans could see their interest payments increase and there may be a significant increase in the number of our portfolio companies who are unable or unwilling to pay interest and repay their loans. Our investments portfolio of adjustable-rate loans may also decline in value in response to rising interest rates if the adjustable interest rates do not rise as much, or as quickly, as market interest rates in general. Similarly, during periods of rising interest rates, our investments with fixed interest rates will likely decline in value.
The Board of Governors of the Federal Reserve System has indicated that it intends to taper its “quantitative easing” program, which potentially could lead to a general rise in interest rates and/or market volatility. In periods of market volatility, the market values of (i) fixed income securities, (ii) and portfolio companies with adjustable-rate loans, may be more sensitive to changes in interest rates.
We may use interest rate risk management techniques in an effort to limit our exposure to interest rate fluctuations. These techniques may include various interest rate hedging activities to the extent such activities are not prohibited by the 1940 Act. These activities may limit our ability to participate in the benefits of lower interest rates with respect to the hedged portfolio. Adverse developments resulting from changes in interest rates or hedging transactions could have a material adverse effect on our business, financial condition and results of operations.
International investments create additional risks.
We have made, and expect to continue to make, investments in portfolio companies that are domiciled outside of the United States. We anticipate that up to 30% of our investments may be in these types of assets. Our investments in foreign portfolio companies are deemed “non-qualifying assets”, which means, as required by the 1940 Act, they may not constitute more than 30% of our total assets at the time of our acquisition of any asset, after giving effect to the acquisition. Notwithstanding the limitation on our ownership of foreign portfolio companies, such investments subject us to many of the same risks as our domestic investments, as well as certain additional risks, including the following:
| • | foreign governmental laws, rules and policies, including those restricting the ownership of assets in the foreign country or the repatriation of profits from the foreign country to the United States; |
| • | foreign currency devaluations that reduce the value of and returns on our foreign investments; |
| • | adverse changes in the availability, cost and terms of investments due to the varying economic policies of a foreign country in which we invest; |
| • | adverse changes in tax rates, the tax treatment of transaction structures and other changes in operating expenses of a particular foreign country in which we invest; |
| • | the assessment of foreign-country taxes (including withholding taxes, transfer taxes and value added taxes, any or all of which could be significant) on income or gains from our investments in the foreign country; |
| • | adverse changes in foreign-country laws, including those relating to taxation, bankruptcy and ownership of assets; |
| • | changes that adversely affect the social, political and/or economic stability of a foreign country in which we invest; |
| • | high inflation in the foreign countries in which we invest, which could increase the costs to us of investing in those countries; |
| • | deflationary periods in the foreign countries in which we invest, which could reduce demand for our assets in those countries and diminish the value of such investments and the related investment returns to us; and |
| • | legal and logistical barriers in the foreign countries in which we invest that materially and adversely limit our ability to enforce our contractual rights with respect to those investments. |
In addition we may make investments in countries whose governments or economies may prove unstable. Certain of the countries in which we may invest may have political, economic and legal systems that are unpredictable, unreliable or otherwise inadequate with respect to the implementation, interpretation and enforcement of laws protecting asset ownership and economic interests. In some of the countries in which we may invest, there may be a risk of nationalization, expropriation or confiscatory taxation, which may have an adverse effect on our portfolio companies in those countries and the rates of return we are able to achieve on such investments. We may also lose the total value of any investment which is nationalized, expropriated or confiscated. The financial results and investment opportunities available to us, particularly in developing countries and emerging markets, may be materially and adversely affected by any or all of these political, economic and legal risks.
17
Table of Contents
We may acquire various structured financial instruments for purposes of “hedging” or reducing our risks, which may be costly and ineffective and could reduce our cash available for distribution to our shareholders.
We may seek to hedge against interest rate and currency exchange rate fluctuations and credit risk by using structured financial instruments such as futures, options, swaps and forward contracts, subject to the requirements of the 1940 Act. Use of structured financial instruments for hedging purposes may present significant risks, including the risk of loss of the amounts invested. Defaults by the other party to a hedging transaction can result in losses in the hedging transaction. Hedging activities also involve the risk of an imperfect correlation between the hedging instrument and the asset being hedged, which could result in losses both on the hedging transaction and on the instrument being hedged. Use of hedging activities may not prevent significant losses and could increase our losses. Further, hedging transactions may reduce cash available to pay distributions to our shareholders.
The TRS and any other derivative transactions into which we may enter expose us to certain risks, including market risk, liquidity risk and other risks associated with the use of leverage.
As of November 2012, our wholly owned special purpose financing subsidiary, Halifax Funding, became a party to a total return swap arrangement, or TRS, with The Bank of Nova Scotia, referred to as the counterparty. Pursuant to the TRS, we periodically receive any income generated by TRS reference assets underlying the TRS and collected by the counterparty. We also receive the realized gains from the liquidation of TRS reference assets over the life of the TRS. Correspondingly, if there is a net realized loss from the liquidation of TRS reference assets over the life of the TRS, we are required to periodically pay the counterparty the amount of such net realized losses. Pursuant to the terms of the TRS arrangement, we must pay the counterparty a series of floating rate periodic payments over the life of the TRS. These periodic payments are based on the settled notional amounts of the underlying TRS reference assets.
The TRS effectively adds leverage to our portfolio by providing us investment and economic exposure to a security or portfolio of securities without our owning, investing directly in, or taking physical custody of such security or portfolio of securities.
The TRS is subject to market risk, liquidity risk and risk of imperfect correlation between the value of the TRS and the TRS reference assets underlying the TRS. In addition, because the TRS is a form of synthetic leverage, it is subject to risks associated with the use of leverage. Moreover, we may incur certain costs in connection with the TRS that could in the aggregate be significant.
The TRS is subject to the risk that the counterparty will default on its payment obligations under the TRS arrangement or that one party will otherwise not be able to meet its contractual obligations to the other. Under the TRS, we make periodic payments based on a variable interest rate and have to post collateral to secure our obligations to the counterparty. In addition, by making periodic payments based on a variable interest rate, we bear the risk of depreciation with respect to the value of the TRS reference assets underlying the TRS and may be required under the terms of the TRS to post additional collateral on a dollar-for-dollar basis in the event the value of the TRS reference assets underlying the TRS depreciates in a material amount relative to any cash collateral previously posted by us.
If the counterparty chooses to exercise its termination rights under the TRS, it is possible that, because of adverse market conditions existing at the time of such termination, we will owe more to the counterparty (or will be entitled to receive less from the counterparty) than we would otherwise have if we controlled the timing of such termination.
For purposes of determining our compliance with the asset coverage ratio test applicable to us as a business development company, we will treat the outstanding notional amount of the TRS and any further total return swap to which we are a party, less the actual amount of any cash collateral posted by us under the TRS and such further total return swap, as a senior security for the life of that instrument. Further, for purposes of determining our compliance with the 70% qualifying assets requirement of Section 55(a) under the 1940 Act, we will treat each loan or bond underlying the TRS and any further total return swap to which we are a party as a qualifying asset if the obligor on such loan is an eligible portfolio company and as a non-qualifying asset if the obligor is not an eligible portfolio company.
Economic recessions or downturns could impair our portfolio companies and harm our operating results.
Many of our portfolio companies are susceptible to economic slowdowns or recessions and may be unable to repay our debt investments during these periods. Therefore, our non-performing assets may increase, and the value of our portfolio is likely to decrease during these periods. Adverse economic conditions may also decrease the value of any collateral securing our senior or second lien loans. A severe recession may further decrease the value of such collateral and result in losses of value in our portfolio and a decrease in our revenues, net income, assets and net worth. Unfavorable economic conditions also could increase our funding costs, limit our access to the capital markets or result in a decision by lenders not to extend credit to us on terms we deem acceptable. These events could prevent us from increasing investments and harm our operating results.
Since the third quarter of 2007, global credit and other financial markets have suffered substantial stress, volatility, illiquidity and disruption. The financial services sector was negatively impacted by significant write-offs as the value of the assets held by financial firms declined, impairing their capital positions and abilities to lend and invest. Such value declines were exacerbated by widespread forced liquidations. Such forced liquidations impacted many investors and investment vehicles, leading to a decline in the supply of capital for investment and depressed pricing levels for many assets. These events significantly diminished overall confidence in the debt and equity markets, engendered unprecedented declines in the values of certain assets and caused extreme economic uncertainty.
18
Table of Contents
A prolonged period of market illiquidity may have an adverse effect on our business, financial condition, results of operations and cash flows. In addition, unfavorable economic conditions, including rising interest rates, may also increase our funding costs, limit our access to capital markets or negatively impact our ability to obtain financing, particularly from the debt markets. Future financial market uncertainty could also lead to further financial market disruptions and could further impact our ability to obtain financing. These events could limit our investment originations, limit our ability to grow and negatively impact our operating results.
The downgrade of the U.S. credit rating and the economic crisis in Europe could negatively impact our business, financial condition and results of operations.
In August 2011 and then affirmed in August 2013, Standard & Poor’s Rating Services lowered its long-term sovereign credit rating on the U.S. from “AAA” to “AA+”. Additionally in January of 2012, Standard & Poor’s Rating Agency lowered its long-term sovereign credit rating for several large European countries. These ratings have negatively impacted global markets and economic conditions. Although the U.S. lawmakers have taken steps to avoid further downgrades, U.S. budget deficit concerns and similar conditions in Europe have increased the possibility of additional credit-rating downgrades and worsening global economic and market conditions. There can be no assurance that current or future governmental measures to mitigate these conditions will be effective. These conditions, government actions and future developments may cause interest rates and borrowing costs to rise, which may adversely impact our ability to access debt financing on favorable terms. Continued or future adverse economic conditions could have a material adverse effect on our business, financial condition and results of operations.
Defaults by our portfolio companies will harm our operating results.
A portfolio company’s failure to satisfy financial or operating covenants imposed by us or other lenders could lead to defaults and, potentially, termination of its debt financing and foreclosure on its secured assets, which could trigger cross-defaults under other agreements and jeopardize a portfolio company’s ability to meet its obligations under the debt or equity securities that we hold. We may incur expenses to the extent necessary to seek recovery upon default or to negotiate new terms, which may include the waiver of certain financial covenants, with a defaulting portfolio company.
An investment strategy focused primarily on privately held companies presents certain challenges, including the lack of available information about these companies.
We invest primarily in privately held companies. Investments in private companies pose certain incremental risks as compared to investments in public companies including that they:
| • | have reduced access to the capital markets, resulting in diminished capital resources and ability to withstand financial distress; |
| • | may have limited financial resources and may be unable to meet their obligations under their debt securities that we hold, which may be accompanied by a deterioration in the value of any collateral and a reduction in the likelihood of us realizing any guarantees we may have obtained in connection with our investment; |
| • | may have shorter operating histories, narrower product lines and smaller market shares than larger businesses, which tend to render them more vulnerable to competitors’ actions and changing market conditions, as well as general economic downturns; |
| • | are more likely to depend on the management talents and efforts of a small group of persons; therefore, the death, disability, resignation or termination of one or more of these persons could have a material adverse impact on our portfolio company and, in turn, on us; and |
| • | generally have less predictable operating results, may from time to time be parties to litigation, may be engaged in rapidly changing businesses with products subject to a substantial risk of obsolescence, and may require substantial additional capital to support their operations, finance expansion or maintain their competitive position. In addition, our executive officers, directors and members of the Advisors’ management may, in the ordinary course of business, be named as defendants in litigation arising from our investments in the portfolio companies. |
In addition, investments in private companies tend to be less liquid. The securities of private companies are not publicly traded or actively traded on the secondary market and are, instead, traded on a privately negotiated over-the-counter secondary market for institutional investors. These over-the-counter secondary markets may be inactive during an economic downturn or a credit crisis. In addition, the securities in these companies will be subject to legal and other restrictions on resale or will otherwise be less liquid than publicly traded securities. If there is no readily available market for these investments, we are required to carry these investments at fair value as determined by our board of directors. As a result, if we are required to liquidate all or a portion of our portfolio quickly, we may realize significantly less than the value at which we had previously recorded these investments. We may also face other restrictions on our ability to liquidate an investment in a portfolio company to the extent that we, our Advisors or any of their
19
Table of Contents
respective affiliates have material nonpublic information regarding such portfolio company or where the sale would be an impermissible joint transaction. The reduced liquidity of our investments may make it difficult for us to dispose of them at a favorable price, and, as a result, we may suffer losses.
Finally, little public information generally exists about private companies and these companies may not have third-party credit ratings or audited financial statements. We must therefore rely on the ability of our Advisors to obtain adequate information through due diligence to evaluate the creditworthiness and potential returns from investing in these companies. Additionally, these companies and their financial information will not generally be subject to the Sarbanes-Oxley Act and other rules that govern public companies. If we are unable to uncover all material information about these companies, we may not make a fully informed investment decision, and we may lose money on our investments.
We may not have the funds or ability to make additional investments in our portfolio companies or to fund our unfunded commitments.
After our initial investment in a portfolio company, we may be called upon from time to time to provide additional funds to such company or have the opportunity to increase our investment through the exercise of a warrant or other right to purchase common stock. There is no assurance that we will make, or will have sufficient funds to make, follow-on investments. Even if we have sufficient capital to make a desired follow-on investment, we may elect not to make a follow-on investment because we may not want to increase our level of risk, we prefer other opportunities, we are limited in our ability to do so by compliance with business development company requirements, or we desire to maintain our RIC status. Our ability to make follow-on investments may also be limited by our Advisors’ allocation policies. Any decisions not to make a follow-on investment or any inability on our part to make such an investment may have a negative impact on a portfolio company in need of such an investment, may result in a missed opportunity for us to increase our participation in a successful operation or may reduce the expected return on the investment.
Prepayments of our debt investments by our portfolio companies could adversely impact our results of operations and reduce our return on equity.
We are subject to the risk that the investments we make in our portfolio companies may be repaid prior to maturity. When this occurs, we will generally reinvest these proceeds in temporary investments, pending their future investment in new portfolio companies. These temporary investments will typically have substantially lower yields than the debt being prepaid and we could experience significant delays in reinvesting these amounts. Any future investment in a new portfolio company may also be at lower yields than the debt that was repaid. As a result, our results of operations could be materially adversely affected if one or more of our portfolio companies elect to prepay amounts owed to us. Additionally, prepayments, net of prepayment fees, could negatively impact our return on equity.
The agreements governing each of our revolving credit facilities contain various covenants which, if not complied with, could accelerate repayment under the relevant facility, thereby materially and adversely affecting our liquidity, financial condition, results of operations and our ability to pay distributions to our shareholders.
We and each of our wholly owned, special purpose financing subsidiaries are party to revolving or term credit facilities with one or more lenders. We or either of our special purpose financing subsidiaries may become party to additional such facilities in the future. The agreements governing these facilities currently, and are likely to continue to, contain default provisions such as:
| • | the failure to make principal payments when due or interest payments within three business days of when due; |
| • | borrowings under the facility exceeding the applicable advance rates; |
| • | the purchase by us or the relevant financing subsidiary, as applicable, of certain ineligible assets; |
| • | the insolvency or bankruptcy of us or the relevant financing subsidiary; |
| • | the decline of our or the relevant financing subsidiary’s, as applicable, net asset value below a specified threshold; and |
| • | fraud or other illicit acts by us, KKR or CNL in our or their respective investment advisory capacities. |
An event of default under any one credit facility may result, among other things, in the termination of the availability of further funds under that facility and other unrelated credit facilities, and an accelerated maturity date for all amounts outstanding under the credit facility or facilities. This could disrupt our business, reduce our revenues and, by delaying any dividends allowed to us under the facility until the lender has been paid in full, reduce our liquidity and cash flow and impair our ability to grow our business, make distribution payments to our shareholders and maintain our status as a RIC.
The agreements governing each credit facility would require us or the relevant financing subsidiary, as applicable, to comply with certain operational covenants. These covenants may, for example, require us or the relevant financing subsidiary, as
20
Table of Contents
applicable, to, among other things, maintain eligible assets with an aggregate equity value, net of borrowing balance, equal to or exceeding specified amounts under the facility. In addition, under the relevant facility, the occurrence of certain “Super-Collateralization Events” may result in an increase of the collateral equity value that we or the relevant financing subsidiary, as applicable, is required to maintain. Super-Collateralization Events would include, among other things:
| • | certain key employees ceasing to be directors, principals, officers or investment managers of KKR; |
| • | the bankruptcy or insolvency of KKR or CNL; |
| • | KKR or CNL ceasing to act as sub-advisor or advisor for us or the relevant financing subsidiary; |
| • | our ceasing to act as the relevant financing subsidiary’s investment manager, becoming bankrupt or insolvent, defaulting on certain material agreements or failing to maintain a net asset value above a specified threshold; and |
| • | fraud or other illicit acts by us, KKR or CNL in our or their respective investment advisory capacities. |
A decline in the value of assets owned by us or the relevant financing subsidiary, as applicable or the occurrence of a Super-Collateralization Event under the relevant facility could result in our being required to retain, acquire or contribute to the relevant financing subsidiary, as applicable, additional assets, which would likely disrupt our business and impact our ability to meet our investment objectives and pay distributions to our shareholders.
The failure to meet collateral requirements under the relevant facility or the occurrence of any other event of default that results in the termination of such facility may force us to liquidate positions at a time and/or at a price that is disadvantageous to us and could result in losses. In addition, upon the occurrence of an event of default under the relevant facility, the related lender would have the right to the assets pledged as collateral supporting the amounts outstanding under the facility and could sell such assets in order to satisfy amounts due under the facility.
Each borrowing under any credit facility will be subject to the satisfaction of certain conditions. We cannot assure you that we or the relevant financing subsidiary, as applicable, will be able to borrow funds under the relevant facility at any particular time or at all.
To the extent that we borrow money, the potential for gain or loss on amounts invested in us will be magnified and may increase the risk of investing in us. Borrowed money may also adversely affect the return on our assets, reduce cash available for distribution to our shareholders, and result in losses.
The use of borrowings, also known as leverage, increases the volatility of investments by magnifying the potential for gain or loss on invested equity capital. Since we use leverage to partially finance our investments, through borrowing from banks and other lenders, you will experience increased risks of investing in our common stock. If the value of our assets decreases, leveraging will cause net asset value to decline more sharply than it otherwise would if we had not borrowed and employed leverage. Similarly, any decrease in our income would cause net income to decline more sharply than it would have if we had not borrowed and employed leverage. Such a decline could negatively affect our ability to make distributions to our shareholders. In addition, our shareholders will bear the burden of any increase in our expenses as a result of our use of leverage, including interest expenses and any increase in the management or incentive fees payable to the Advisors.
The amount of leverage that we employ depends on our Advisors’ and our board of directors’ assessment of market and other factors at the time of any proposed borrowing. There can be no assurance that leveraged financing will be available to us on favorable terms or at all. However, to the extent that we use leverage to finance our assets, our financing costs will reduce cash available for distributions to shareholders. Moreover, we may not be able to meet our financing obligations and, to the extent that we cannot, we risk the loss of some or all of our assets to liquidation or sale to satisfy the obligations. In such an event, we may be forced to sell assets at significantly depressed prices due to market conditions or otherwise, which may result in losses.
As a business development company, we are required to meet a coverage ratio of total assets to total borrowings and other senior securities, which include all of our borrowings and any preferred stock that we may issue in the future, of at least 200%. If this ratio declines below 200%, we cannot incur additional debt and could be required to sell a portion of our investments to repay some debt when it is disadvantageous to do so. This could have a material adverse effect on our operations, and we may not be able to make distributions.
21
Table of Contents
Risks Related to an Investment in our Common Stock
Our shares are not listed on an exchange or quoted through a quotation system and will not be listed for the foreseeable future, if ever. Therefore, our shareholders will have limited liquidity and may not receive a full return of invested capital (including front-end commissions, fees and expenses), upon selling their shares or upon a liquidation of our company.
Our shares are illiquid investments for which there is not a secondary market nor is it expected that any such secondary market will develop in the future. On or before December 31, 2018, our board of directors must consider, but is not required to recommend, a liquidity event for our shareholders. A future liquidity event could include: (i) a listing of our shares on a national securities exchange; (ii) a merger or another transaction approved by our board of directors in which our shareholders will receive cash or shares of a listed company; or (iii) a sale of all or substantially all of our assets either on a complete portfolio basis or individually followed by a liquidation. Certain types of liquidity events, such as a listing, would allow us to retain our Investment Portfolio intact while providing our shareholders with access to a trading market for their securities.
We do not know at this time what circumstances will exist in the future and therefore we do not know what factors our board of directors will consider in determining whether to pursue a liquidity event in the future.
Also, since a portion of the public offering price from our sales of shares is used to pay expenses, commissions and fees, the full offering price paid by our shareholders is not usually invested in portfolio companies. As a result, even if we do complete a liquidity event, you may not receive a return of all of your invested capital. If we do not successfully complete a liquidity event, liquidity for your shares will be limited to participation in our share repurchase program, which we have no obligation to maintain.
If our shares are listed on a national securities exchange or quoted through a quotation system, we cannot assure you a public trading market will develop or, if one develops, that such trading market can be sustained. Shares of companies offered in an initial public offering often trade at a discount to the initial offering price due to underwriting discounts and related offering expenses. Also, shares of listed closed-end investment companies, including those that are business development companies, frequently trade at a discount from their net asset value. This characteristic of closed-end investment companies is separate and distinct from the risk that our net asset value per share of common stock may decline. We cannot predict whether our common stock, if listed on a national securities exchange, will trade at, above or below net asset value.
We intend, but are not required, to offer to repurchase your shares on a quarterly basis. As a result you will have limited opportunities to sell your shares.
We have adopted a share repurchase program to allow you to tender your shares to us on a quarterly basis at a price that is approximately equal to our net asset value as of the last business date of each relevant calendar quarter. The share repurchase program includes numerous restrictions that limit your ability to sell your shares. We currently intend to limit the number of shares to be repurchased during any calendar year to the number of shares we can repurchase with the proceeds we receive from the issuance of shares of our common stock under our distribution reinvestment plan. At the discretion of our board of directors, we may also use cash on hand, cash available from borrowings and cash from the sale of our investments as of the end of the applicable period to repurchase shares. We limit repurchases in each quarter to 2.5% of the weighted average number of shares of our common stock outstanding in the prior four calendar quarters. To the extent that the number of shares put to us for repurchase exceeds the number of shares that we are able to purchase, we will repurchase shares on a pro rata basis, not on a first-come, first-served basis. Further, we will have no obligation to repurchase shares if the repurchase would violate the restrictions on distributions under federal law or Maryland law, which prohibits distributions that would cause a corporation to fail to meet statutory tests of solvency. Further, certain covenants in our senior credit facility may limit our ability to offer to repurchase your shares on a quarterly basis. These limits may prevent us from accommodating all share repurchase demands in any year. Our board of directors may amend, suspend or terminate the share repurchase program upon 30 days’ notice. We will notify our shareholders of such developments: (i) in our quarterly reports or (ii) by means of a separate mailing to you, accompanied by disclosure in a current or periodic report under the Exchange Act. In addition, under the quarterly share repurchase program, we have discretion to not repurchase shares, to suspend the program, and to cease repurchases. Further, the program has many limitations and should not be relied upon as a method to sell shares promptly and at a desired price
The timing of our repurchase offers pursuant to our share repurchase program may be at a time that is disadvantageous to our shareholders, and, to the extent you are able to sell your shares under the program, you may not be able to recover the amount of your investment in our shares.
When we make quarterly repurchase offers pursuant to the share repurchase program, we may offer to repurchase shares at a price that is lower than the price that you paid for our shares. As a result, to the extent you paid a price that includes a related sales load and to the extent you have the ability to sell your shares pursuant to our share repurchase program, then the price at which you may sell shares, which will be at a price approximately equal to our net asset value on the last business day of the prior calendar quarter, may be lower than the amount you paid in connection with the purchase of our shares.
22
Table of Contents
A shareholder’s interest in us will be diluted if we issue additional shares, which could reduce the overall value of an investment in us.
Our shareholders do not have preemptive rights to any shares we issue in the future. Our charter, which we refer to herein as the articles of incorporation, authorizes us to issue up to 1,000,000,000 shares of common stock. Pursuant to our articles of incorporation, a majority of our entire board of directors may amend our articles of incorporation to increase or decrease the aggregate number of authorized shares of stock or the number of authorized shares of stock of any class or series without shareholder approval. Our board may elect to sell additional shares in the future or issue equity interests in private offerings. To the extent we issue additional equity interests at or below net asset value, your percentage ownership interest in us may be diluted. In addition, depending upon the terms and pricing of any additional offerings and the value of our investments, you may also experience dilution in the book value and fair value of your shares.
Under the 1940 Act, we generally are prohibited from issuing or selling our common stock at a price below net asset value per share, which may be a disadvantage as compared with certain public companies. We may, however, sell our common stock, or warrants, options, or rights to acquire our common stock, at a price below the current net asset value of our common stock if our board of directors and independent directors determine that such sale is in our best interests and the best interests of our shareholders, and our shareholders, including a majority of those shareholders that are not affiliated with us, approve such sale. In any such case, the price at which our securities are to be issued and sold may not be less than a price that, in the determination of our board of directors, closely approximates the fair value of such securities (less any distributing commission or discount). If we raise additional funds by issuing common stock or senior securities convertible into, or exchangeable for, our common stock, then the percentage ownership of our shareholders at that time will decrease and you will experience dilution.
Preferred stock could be issued with rights and preferences that would adversely affect holders of our common stock.
Our Offerings have not included, and do not presently include, an offering of preferred stock. However, under the terms of our articles of incorporation, our board of directors is authorized to issue shares of preferred stock in one or more series without shareholder approval, which could potentially adversely affect the interests of existing shareholders.
Certain provisions of the Maryland General Corporation Law could deter takeover attempts.
Our bylaws exempt us from the Maryland Control Share Acquisition Act, which significantly restricts the voting rights of control shares of a Maryland corporation acquired in a control share acquisition. If our bylaws were amended to repeal this exemption from the Maryland Control Share Acquisition Act, that statute may make it more difficult for a third party to obtain control of us and increase the difficulty of consummating such a transaction. Although we do not presently intend to adopt such an amendment to our bylaws, there can be no assurance that we will not so amend our bylaws at some time in the future. We will not, however, amend our bylaws to make us subject to the Maryland Control Share Acquisition Act without our board of directors determining that doing so would not conflict with the 1940 Act and obtaining confirmation from the SEC that it does not object to that determination.
Additionally, our board of directors may, without shareholder action, authorize the issuance of shares of stock in one or more classes or series, including preferred stock. Our board of directors may also, without shareholder action, amend our articles of incorporation to increase or decrease the aggregate number of shares of stock or the number of shares of stock of any class or series that we have authority to issue. These provisions may inhibit a change of control in circumstances that could give the holders of our common stock the opportunity to realize a premium over the value of our common stock.
The net asset value of our common stock may fluctuate significantly.
The net asset value and liquidity, if any, of the market for shares of our common stock may be significantly affected by numerous factors, some of which are beyond our control and may not be directly related to our operating performance. These factors include:
| • | changes in the value of our portfolio of investments and derivative instruments; |
| • | changes in regulatory policies or tax guidelines, particularly with respect to RICs or business development companies; |
| • | loss of RIC or business development company status; |
| • | distributions that exceed our net investment income and net income as reported according to GAAP; |
| • | changes in earnings or variations in operating results; |
| • | changes in accounting guidelines governing valuation of our investments; |
| • | any shortfall in revenue or net income or any increase in losses from levels expected by investors; |
23
Table of Contents
| • | departure of either of our Advisors or certain of their respective key personnel; |
| • | general economic trends and other external factors; and |
| • | loss of a major funding source. |
Federal Income Tax Risks
We will be subject to corporate-level income tax if we are unable to maintain our qualification as a RIC under Subchapter M of the Code or if we make investments through taxable subsidiaries.
To maintain RIC tax treatment under the Code, we must meet the following minimum annual distribution, income source and asset diversification requirements.
The minimum annual distribution requirement for a RIC will be satisfied if we distribute to our shareholders on an annual basis at least 90% of our net ordinary taxable income and realized net short-term capital gains in excess of realized net long-term capital losses, if any. In addition, a RIC may, in certain cases, satisfy the 90% distribution requirement by distributing dividends relating to a taxable year after the close of such taxable year under the “spillover dividend” provisions of subchapter M. We would be taxed on any retained income and/or gains, including any short-term capital gains or long-term capital gains. We must also satisfy an additional annual distribution requirement during each calendar year in order to avoid a 4% excise tax on the amount of the under-distribution. Because we use debt financing, we are subject to (i) an asset coverage ratio requirement under the 1940 Act and (ii) certain financial covenants under loan and credit agreements that could, under certain circumstances, restrict us from making distributions necessary to satisfy the distribution requirements. If we are unable to obtain cash from other sources, we could fail to qualify for RIC tax treatment, or could be required to retain a portion of our income or gains, and thus become subject to corporate-level income tax.
The income source requirement will be satisfied if we obtain at least 90% of our annual income from dividends, interest, gains from the sale of stock or securities, or similar sources.
The asset diversification requirement will be satisfied if we meet certain asset diversification requirements at the end of each quarter of our taxable year. To satisfy this requirement, at least 50% of the value of our assets must consist of cash, cash equivalents (including receivables), U.S. Government securities, securities of other RICs, and other acceptable securities; and no more than 25% of the value of our assets can be invested in the securities, other than U.S. government securities or securities of other RICs, of one issuer, of two or more issuers that are controlled, as determined under applicable Code rules, by us and that are engaged in the same or similar or related trades or businesses or of certain “qualified publicly traded partnerships.” Failure to meet these requirements may result in our having to dispose of certain investments quickly in order to prevent the loss of RIC status. Because most of our investments will be in private companies, and therefore will be relatively illiquid, any such dispositions could be made at disadvantageous prices and could result in substantial losses.
If we fail to qualify for or maintain RIC tax treatment for any reason and are subject to corporate income tax, the resulting corporate taxes could substantially reduce our net assets, the amount of income available for distribution, and the amount of our distributions.
We may invest in certain debt and equity investments through taxable subsidiaries and the net taxable income of these taxable subsidiaries will be subject to federal and state corporate income taxes.
We may have difficulty paying our required distributions if we recognize income before or without receiving cash representing such income.
For federal income tax purposes, we may be required to recognize taxable income in circumstances in which we do not receive a corresponding payment in cash. For example, since we will likely hold debt obligations that are treated under applicable tax rules as having original issue discount (such as debt instruments with PIK, secondary market purchase of debt securities at discount to par, interest or, in certain cases, increasing interest rates or debt instruments that were issued with warrants), we must include in income each year a portion of the original issue discount that accrues over the life of the obligation, regardless of whether cash representing such income is received by us in the same taxable year. We may also have to include in income other amounts that we have not yet received in cash, such as deferred loan origination fees that are paid after origination of the loan or are paid in non-cash compensation such as warrants or stock. Furthermore, we may invest in non-U.S. corporations (or other non-U.S. entities treated as corporations for U.S. federal income tax purposes) that could be treated under the Code and U.S. Treasury regulations as “passive foreign investment companies” and/or “controlled foreign corporations.” The rules relating to investment in these types of non-U.S. entities are designed to ensure that U.S. taxpayers are either, in effect, taxed currently (or on an accelerated basis with respect to corporate level events) or taxed at increased tax rates at distribution or disposition. In certain circumstances this could require us to recognize income where we do not receive a corresponding payment in cash.
24
Table of Contents
A portion of our income may constitute original issue discount or other income required to be included in taxable income prior to receipt of cash. Further, we may elect to amortize market discounts and include such amounts in our taxable income in the current year, instead of upon disposition, as an election not to do so would limit our ability to deduct interest expenses for tax purposes. Because any original issue discount or other amounts accrued will be included in our investment company taxable income for the year of the accrual, we may be required to make a distribution to our shareholders in order to satisfy the annual distribution requirement, even if we will not have received any corresponding cash amount. As a result, we may have difficulty meeting the annual distribution requirement necessary to maintain RIC tax treatment under the Code. We may have to sell some of our investments at times and/or at prices we would not consider advantageous, raise additional debt or equity capital, make a partial share distribution, or forgo new investment opportunities for this purpose. If we are not able to obtain cash from other sources, and choose not to make a qualifying share distribution, we may fail to qualify for RIC tax treatment and thus become subject to corporate-level income tax.
| Item 1B. | Unresolved Staff Comments |
Not applicable.
| Item 2. | Properties |
We do not own any real estate or other physical properties materially important to our operation. We believe that the office facilities of the Advisor are suitable and adequate for our business as it is contemplated to be conducted.
| Item 3. | Legal Proceedings |
None of us, our Advisors or our Administrator, is currently subject to any material legal proceedings, nor, to our knowledge, is any material legal proceeding threatened against us, or against our Advisors or Administrator. From time to time, we, our Advisors or Administrator may be a party to certain legal proceedings in the ordinary course of, or incidental to the normal course of, our business, including the enforcement of our rights under contracts with our portfolio companies. While we cannot predict the outcome of these legal proceedings with certainty, we do not expect that these proceedings will have a material adverse effect on our results of operations or financial condition.
| Item 4. | Mine Safety Disclosures |
Not applicable.
25
Table of Contents
| Item 5. | Market for Registrant’s Common Equity, Related Shareholder Matters and Issuer Purchases of Equity Securities |
Market Information
There is no established public trading market for our common stock, and we do not expect one to develop. Therefore, there is a risk that a shareholder may not be able to sell our shares of common stock at a time or price acceptable to the shareholder, or at all.
Continuous Public Offering of Common Stock
We are currently selling our shares on a continuous basis at an offering price of $11.30 per share under our Follow-On Registration Statement. To the extent that our net asset value per share increases, we will ensure that our shares are not sold at a price, after deduction of selling commissions and marketing support fees, that is below net asset value per share. In connection with each weekly closing on the sale of shares of our common stock pursuant to our Offerings and periodic reinvestment of distributions in our shares, we make the determination that we are not selling shares of our common stock at a price below our then current net asset value per share within 48 hours before the time that we issue shares. In addition, if the net asset value per share were to decline below 97.5% of the public offering price, net of sales load, for ten continuous business days (for this purpose, any day on which the principal stock markets in the United States are open for business), then, unless and until our board of directors determines otherwise, we will voluntarily suspend selling shares in the Offerings until the net asset value per share is greater than 97.5% of the public offering price, net of sales load. The following table lists the net asset value per share, the public offering price including and excluding sales load, the net public offering price premium as a percentage of net asset value per share (“NAV”), and quarterly declared distributions per share for the years ended December 31, 2013 and 2012.
| End of Quarter | ||||||||||||||||||||
| NAV(1) | Public Offering Price |
Net POP(2) | Net POP Premium to NAV(3) |
Declared Distributions per Share |
||||||||||||||||
| Year Ended December 31, 2013 |
||||||||||||||||||||
| First Quarter |
$ | 9.91 | $ | 11.05 | $ | 9.95 | 0 | % | $ | 0.20 | ||||||||||
| Second Quarter |
$ | 9.78 | $ | 11.10 | $ | 9.99 | 2 | % | $ | 0.19 | ||||||||||
| Third Quarter |
$ | 9.92 | $ | 11.10 | $ | 9.99 | 1 | % | $ | 0.20 | ||||||||||
| Fourth Quarter |
$ | 10.00 | $ | 11.30 | $ | 10.17 | 2 | % | $ | 0.24 | (4) | |||||||||
| Year Ended December 31, 2012 |
||||||||||||||||||||
| First Quarter |
$ | 9.66 | $ | 10.85 | $ | 9.76 | 1 | % | $ | 0.19 | ||||||||||
| Second Quarter |
$ | 9.64 | $ | 10.85 | $ | 9.76 | 1 | % | $ | 0.19 | ||||||||||
| Third Quarter |
$ | 9.78 | $ | 10.95 | $ | 9.86 | 1 | % | $ | 0.19 | ||||||||||
| Fourth Quarter |
$ | 9.75 | $ | 10.95 | $ | 9.86 | 1 | % | $ | 0.19 | ||||||||||
| (1) | Net asset value per share (“NAV”) is determined as of the last day in the period. The NAVs are based on outstanding shares at the end of the period. |
| (2) | Net public offering price excluding sales load (“Net POP”) is equal to public offering price less a 10% allowance for selling commissions and marketing support fees. Net POP is also the price employed in the distribution reinvestment plan. |
| (3) | Calculated at end of the period, Net POP divided by NAV, less 100%. |
| (4) | Includes a special distribution of $0.03 per share. |
As of December 31, 2013, we received aggregate subscription proceeds of approximately $1,508.58 million (138.80 million shares) in connection with our Offerings and 4.90 million shares were issued in connection with the reinvestment of $48.70 million of distributions pursuant to our distribution reinvestment plan. Set forth below is a chart that reconciles gross and net proceeds from the Offerings since we commenced our Initial Offering on April 4, 2011 (dollar amounts in thousands except per share data):
| As of December 31, 2013 | ||||||||
| Shares | Amount | |||||||
| Gross Proceeds from Offerings |
138,802,096 | $ | 1,508,575 | |||||
| Commissions and Marketing Support Fees |
— | (140,946 | ) | |||||
| Reinvestment of Distributions |
4,901,529 | 48,703 | ||||||
|
|
|
|
|
|||||
| Net Proceeds to Company |
143,703,625 | $ | 1,416,332 | |||||
|
|
|
|
|
|||||
| Average Net Proceeds Per Share |
$9.86 | |||||||
26
Table of Contents
Holders
As of March 14, 2014, we had 40,841 record holders of our common stock. No shares of our common stock have been authorized for issuance under any equity compensation plan. Set forth below is a chart describing the single class of our securities outstanding as of March 14, 2014:
| (1) |
(2) | (3) | (4) | |||||||||
| Title of Class |
Amount Authorized |
Amount Held by Us or for Our Account |
Amount Outstanding Exclusive of Amount Under Column (3) |
|||||||||
| Common Stock |
1,000,000,000 | — | 153,081,534 | |||||||||
Recent Sales of Unregistered Securities
None.
Share Repurchase Program
We commenced our share repurchase program in July 2012 and the first repurchase of shares occurred in August 2012. We limit repurchases in each quarter to 2.5% of the weighted average number of shares of our common stock outstanding in the prior four calendar quarters. We currently intend to limit the number of shares to be repurchased during any calendar year to the number of shares we can repurchase with the proceeds we receive from the issuance of shares of our common stock under our distribution reinvestment plan. At the discretion of our board of directors, we may also use cash on hand, cash available from borrowings and cash from the sale of our investments as of the end of the applicable period to repurchase shares. Our board of directors may amend, suspend or terminate the share repurchase program upon 30 days’ notice. All shares purchased by us pursuant to the terms of each tender offer will be retired and thereafter will be authorized and unissued shares. The table below provides information concerning our repurchases of shares of our common stock during the quarter ended December 31, 2013 pursuant to our share repurchase program.
| Period |
Total Number of Shares Purchased |
Average Price Paid per Share |
Total Number of Shares Purchased as Part of Publicly Announced Programs |
Maximum Number of Shares that May Yet Be Purchased Under the Program |
||||||||||||
| October 1, 2013 through October 31, 2013 |
— | — | — | — | ||||||||||||
| November 1, 2013 through November 30, 2013 |
359,217 | $ | 9.91 | 359,217 | — | |||||||||||
| December 1, 2013 through December 31, 2013 |
— | — | — | — | ||||||||||||
|
|
|
|
|
|
|
|
|
|||||||||
| Total |
359,217 | $ | 9.91 | 359,217 | — | |||||||||||
|
|
|
|
|
|
|
|
|
|||||||||
Distributions
Distributions to our shareholders are governed by our articles of incorporation. Our board of directors declares a weekly record date, a weekly distribution rate and a monthly payment date. We intend to continue to pay monthly distributions to our shareholders. The timing and amount of our monthly distributions, if any, is determined by our board of directors. Any distributions to our shareholders are declared out of assets legally available for distribution. (See Notes 8 and 13 to our consolidated financial statements).
The following table presents the total cash distributions declared per share of common stock outstanding during the years ended December 31, 2013 and 2012:
| Cash Distributions Declared Per Share | ||||||||
| Quarter |
2013 | 2012 | ||||||
| First |
$ | 0.195052 | $ | 0.185700 | ||||
| Second |
0.195052 | 0.189878 | ||||||
| Third |
0.195052 | 0.189878 | ||||||
| Fourth |
0.240056 | (1) | 0.189878 | |||||
|
|
|
|
|
|||||
| Total |
$ | 0.825212 | $ | 0.755334 | ||||
|
|
|
|
|
|||||
| (1) | In addition to regular monthly distributions, cash distributions declared on our common stock during the fourth quarter of 2013 included $0.03 per share in special cash distributions. |
Because we intend to maintain our qualification as a RIC, we intend to distribute at least 90% of our annual taxable income to our shareholders. To the extent our taxable earnings fall below the total amount of our paid distributions for any given fiscal year, a portion of those paid distributions may be deemed to be a tax return of capital to our shareholders. For the years ended December 31, 2013 and 2012, 100% of the distributions paid to shareholders were comprised of taxable income (ordinary income and capital gains, if any) for federal income tax purposes, and none of the paid distributions were determined to be a return of capital. In January 2013 and 2012, a Form 1099-DIV was sent to our shareholders which stated the amount and sources of the paid distributions and provided information with respect to appropriate tax treatment of the paid distributions.
27
Table of Contents
On December 20, 2013, our board of directors declared distributions for the first quarter of 2014 which represent an annualized distribution rate of 6.90% based on our current public offering price of $11.30 per share. The annualized distribution rate should not be interpreted to be a measure of our current or future performance. It is anticipated that these distributions, in the aggregate, will be substantially supported by our taxable income and the sources of distributions will be disclosed in our regular financial reports. Distributions will be recorded weekly and paid monthly in accordance with the schedule below.
| Record Date |
Distribution Payment Date |
Declared Distribution Per Share Per Record Date |
||||
| January 7, 14, 21 and 28, 2014 |
January 29, 2014 | $ | 0.015004 | |||
| February 4, 11, 18 and 25, 2014 |
February 26, 2014 | $ | 0.015004 | |||
| March 4, 11, 18 and 25, 2014 |
March 26, 2014 | $ | 0.015004 | |||
We have adopted a distribution reinvestment plan that enables our shareholders to elect for the reinvestment of distributions in shares of common stock. As a result, if our company’s board of directors authorizes and declares a cash distribution, then shareholders who have elected to participate in the distribution reinvestment plan will have their cash distribution automatically reinvested in additional shares of common stock at a price equivalent to the public offering price exclusive of commissions and marketing support fees, rather than receiving the cash distribution.
| Item 6. | Selected Financial Data |
The following selected financial data for the years ended December 31, 2013, 2012 and 2011, and for the period from June 9, 2010, (Inception) to December 31, 2010 is derived from our consolidated financial statements. The following selected financial data should be read in conjunction with “Item 7.—Management’s Discussion and Analysis of Financial Condition and Results of Operations” and “Item 8. —Financial Statements and Supplementary Data” included elsewhere in this report.
| (U.S. dollar amounts in thousands, except per share data) | ||||||||||||||||
| Year Ended December 31, | Period from June 9, 2010 (Inception) to December 31, 2010 |
|||||||||||||||
| 2013 | 2012 | 2011 | ||||||||||||||
| Statement of operations data: |
||||||||||||||||
| Investment income |
$ | 119,573 | $ | 35,583 | $ | 959 | $ | — | ||||||||
| Operating expenses |
||||||||||||||||
| Total expenses |
68,502 | 19,651 | 1,482 | — | ||||||||||||
| Reimbursement of expense support |
1,136 | 1,830 | — | |||||||||||||
| Advisors’ expense support |
— | (1,590 | ) | (1,376 | ) | — | ||||||||||
|
|
|
|
|
|
|
|
|
|||||||||
| Net expenses |
69,638 | 19,891 | 106 | — | ||||||||||||
|
|
|
|
|
|
|
|
|
|||||||||
| Net investment income |
49,935 | 15,692 | 853 | — | ||||||||||||
| Realized and unrealized gain |
55,022 | 9,962 | 529 | — | ||||||||||||
|
|
|
|
|
|
|
|
|
|||||||||
| Net increase in net assets resulting from operations |
$ | 104,957 | $ | 25,654 | $ | 1,382 | $ | — | ||||||||
|
|
|
|
|
|
|
|
|
|||||||||
| Per share data: |
||||||||||||||||
| Net investment income - basic and diluted |
$ | 0.48 | $ | 0.50 | $ | 0.67 | ||||||||||
| Net increase in net assets resulting from operations—basic and diluted |
$ | 1.00 | $ | 0.82 | $ | 1.09 | ||||||||||
| Distributions declared |
$ | 0.83 | $ | 0.76 | $ | 0.37 | ||||||||||
| Balance sheet data: |
||||||||||||||||
| Total assets |
$ | 2,281,186 | $ | 850,324 | $ | 116,223 | $ | 200 | ||||||||
| Credit facilities |
$ | 707,389 | $ | 159,620 | $ | 25,340 | $ | — | ||||||||
| Total net assets |
$ | 1,430,434 | $ | 611,484 | $ | 65,163 | $ | 200 | ||||||||
| Other data: |
||||||||||||||||
| Total investment return-net price(1) |
10.2 | % | 14.2 | % | 6.5 | % | — | |||||||||
| Total investment return-net asset value(2) |
11.4 | % | 14.3 | % | 6.5 | % | ||||||||||
| Number of portfolio companies at period end |
94 | 126 | 110 | — | ||||||||||||
| Total portfolio investments for the period |
$ | 2,090,370 | $ | 991,952 | $ | 106,811 | — | |||||||||
| Investment sales and prepayments for the period |
$ | 925,095 | $ | 410,530 | $ | 482 | — | |||||||||
| (1) | Total investment return-net price is a measure of total return for shareholders who purchased our common stock at the beginning of the period, including distributions declared during the period. Total investment return-net price is based on (i) the purchase of one share at the public offering price, net of sales load, on the first day of the period, (ii) the sale at the net asset value per share on the last day of the period, of (A) one share plus (B) any fractional shares issued in connection with the reinvestment of monthly distributions, and (iii) the cash payment for distributions payable, if any, on the last day of the period. The total investment return-net price calculation assumes that (i) monthly cash distributions are reinvested in accordance with our distribution reinvestment plan and (ii) the |
28
Table of Contents
| fractional shares issued pursuant to the distribution reinvestment plan are issued at the then public offering price, net of sales load, on each monthly distribution payment date. There is no public market for our shares and the market value at sale is assumed to be equal to net asset value per share on the last day of the period. Our performance changes over time and currently may be different than that shown above. Past performance is no guarantee of future results. Investment performance is presented without regard to sales load that may be incurred by our shareholders in the purchase of our shares of common stock. |
| (2) | Total investment return-net asset value is a measure of the change in total value for shareholders who held our common stock at the beginning and end of the period, including distributions declared during the period. Total investment return-net asset value is based on (i) the beginning period net asset value per share on the first day of the period, (ii) the net asset value per share on the last day of the period, of (A) one share plus (B) any fractional shares issued in connection with the reinvestment of monthly distributions, and (iii) the value of distributions payable, if any, on the last day of the period. The total investment return-net asset value calculation assumes that (i) monthly cash distributions are reinvested in accordance with our distribution reinvestment plan and (ii) the fractional shares issued pursuant to the distribution reinvestment plan are issued at the then public offering price, net of sales load, on each monthly distribution payment date. There is no public market for our shares. Our performance changes over time and currently may be different than that shown above. Past performance is no guarantee of future results. Investment performance is presented without regard to sales load that may be incurred by our shareholders in the purchase of our shares of common stock. |
| Item 7. | Management’s Discussion and Analysis of Financial Condition and Results of Operations |
The information contained in this section should be read in conjunction with our consolidated financial statements and related notes thereto appearing elsewhere in this annual report on Form 10-K. In this report, “we”, “our”, “us” and “our company” refer to Corporate Capital Trust, Inc.
STATEMENT REGARDING FORWARD-LOOKING INFORMATION
The following information contains statements that constitute forward-looking statements, within the meaning of Section 27A of the Securities Act of 1933, as amended, and Section 21E of the Exchange Act. These statements generally are characterized by the use of terms such as “may,” “should,” “plan,” “anticipate,” “estimate,” “intend,” “predict,” “believe” and “expect” or the negative of these terms or other comparable terminology. Although we believe that the expectations reflected in such forward-looking statements are based upon reasonable assumptions, our actual results could differ materially from those set forth in the forward-looking statements. Some factors that might cause such a difference include the following: the current global economic downturn, increased direct competition, changes in government regulations or accounting rules, changes in local, national and global capital market conditions, our ability to obtain credit lines or credit facilities on satisfactory terms, changes in interest rates, availability of proceeds from our offering of shares, our ability to identify suitable investments, our ability to close on identified investments, inaccuracies of our accounting estimates, our ability to locate suitable borrowers for our loans and the ability of such borrowers to make payments under their respective loans. Given these uncertainties, we caution you not to place undue reliance on such statements, which apply only as of the date hereof. We undertake no obligation to publicly release the results of any revisions to these forward-looking statements that may be made to reflect future events or circumstances or to reflect the occurrence of unanticipated events. The forward-looking statements should be read in light of the risk factors identified in the “Risk Factors” section of this report.
CRITICAL ACCOUNTING POLICIES AND ESTIMATES
Our discussion and analysis of our financial condition and results of operations are based upon our consolidated financial statements which have been prepared in accordance with GAAP. The preparation of these consolidated financial statements requires management to make estimates and assumptions that affect the reported amounts of assets, liabilities, revenues and expenses. Changes in the economic environment, financial markets and any other parameters used in determining such estimates could cause actual results to differ.
In addition to the discussion below, our critical accounting policies are further described in Note 2 to the consolidated financial statements. We consider these accounting policies to be deemed critical because they involve management judgments and assumptions, require estimates about matters that are inherently uncertain and because they are important for understanding and evaluating our reported financial results. These judgments will affect the reported amounts of assets and liabilities and our disclosure of contingent assets and liabilities at the dates of the financial statements and the reported amounts of revenue and expenses during the reporting periods. With different estimates or assumptions, materially different amounts could be reported in our financial statements.
Valuation of Investments – We measure the value of our investments in accordance with Accounting Standards Codification Topic 820, Fair Value Measurements and Disclosure (“ASC Topic 820”), issued by the Financial Accounting Standards Board (“FASB”). Fair value is the price that would be received to sell an asset or paid to transfer a liability in an orderly transaction between market participants at the measurement date.
ASC Topic 820 also defines hierarchical levels directly related to the amount of subjectivity associated with the inputs to fair valuations of these assets and liabilities, and the hierarchical levels are described as follows:
Level 1 – Quoted prices are available in active markets for identical investments as of the reporting date. Publicly listed equities and debt securities, publicly listed derivatives, money market fund/ short term investment funds and foreign currency are generally included in Level 1. We do not adjust the quoted price for these investments.
29
Table of Contents
Level 2 – Pricing inputs are other than quoted prices in active markets, which are either directly or indirectly observable as of the reporting date, and fair value is determined through the use of models or other valuation methodologies. In certain cases, debt and equity securities are valued on the basis of prices from orderly transactions for similar investments in active markets between market participants and provided by reputable dealers or independent pricing services. In determining the value of a particular investment, pricing services may use certain information with respect to transactions in such investments, quotations from dealers, pricing matrices, market transactions in comparable investments, and various relationships between investments. Investments generally included in this category are corporate bonds and loans, convertible debt indexed to publicly listed securities, foreign currency forward contracts and certain over-the-counter derivatives.
Level 3 – Pricing inputs are unobservable for the investment and include situations where there is little, if any, market activity for the investment. The inputs into the determination of fair value require significant judgment or estimation. Investments generally included in this category are total return swap agreements, corporate bonds and loans, common and preferred stock investments, and equity options that lack observable market pricing.
In certain cases, the inputs used to measure fair value may fall into different levels of the fair value hierarchy. In such cases, an investment’s level within the fair value hierarchy is based on the lowest level of input that is significant to the fair value measurement. Our assessment of the significance of a particular input to the fair value measurement in its entirety requires judgment, and it considers factors specific to the investment.
Investments for which market quotations are readily available are valued using market quotations, which are generally obtained from independent pricing services, broker-dealers or market makers. With respect to our portfolio investments for which market quotations are not readily available, our board of directors is responsible for determining in good faith the fair value in accordance with the valuation policy approved by the board of directors, based on, among other things, the input of our Advisors, audit committee and independent third-party valuation firms under a valuation policy and a consistently applied valuation process. Our board of directors has the final responsibility for reviewing and approving, in good faith, our determination of the fair value of our investments for which market quotations are not readily available.
Our board of directors makes this fair value determination on a quarterly basis and any other time when a decision regarding the fair value of the portfolio investments is required. A determination of fair value involves subjective judgments and estimates. Due to the inherent uncertainty of determining the fair value of portfolio investments that do not have a readily available market value, the fair value of the investments may differ significantly from the values that would have been used had a readily available market value existed for such investments, and the differences could be material. Further, such investments are generally less liquid than publicly traded securities. If we were required to liquidate a portfolio investment that does not have a readily available market value in a forced or liquidation sale, we could realize significantly less than the value recorded us.
We and the Advisors undertake a multi-step valuation process each quarter for debt and equity securities whose market prices are not otherwise readily available, as described below:
| • | The quarterly valuation process initially begins with each portfolio company or investment being initially valued by KKR (internal valuation) and/or an independent third party valuation firm retained by us (external valuation), which provides a valuation range. |
| • | Valuation recommendations are formulated and documented by KKR and reviewed by KKR’s valuation committee. The KKR valuation committee then provides its valuation recommendation for each investment, along with supporting documentation, to CNL and our management where the valuation recommendations and internal/external valuation documentation are reviewed by CNL and our management. |
| • | If our management is satisfied, it will forward the valuation recommendations and supporting documentation for review by our audit committee. |
| • | Our board of directors then discusses the investment valuation recommendations with our Advisors and, based on those discussions and the related conclusions of our audit committee, determines the fair value of these investments in good faith. |
Depending on the relative liquidity in the markets for certain assets, we may transfer assets to Level 3 if we determine that observable quoted prices, obtained directly or indirectly, are not available. The valuation techniques used for the assets and liabilities that are valued using Level 3 of the fair value hierarchy are described below.
| • | Corporate Debt Securities and Corporate Loans, at Estimated Fair Value: Corporate debt securities and corporate loans, at estimated fair value are initially valued at transaction price and are subsequently valued using market data for similar instruments (e.g., recent transactions or indicative broker quotes), comparisons to benchmark derivative indices or valuation models. Valuation models are based on yield analysis and discounted cash flow techniques, where the key inputs are based on relative value analyses and the assignment of risk-adjusted discounted rates, based on the analysis of similar instruments from similar issuers. In addition, an illiquidity discount is applied where appropriate. |
30
Table of Contents
| • | Equity Investments, at Estimated Fair Value: Equity investments, at estimated fair value, are initially valued at transaction price and are subsequently valued using observable market prices, if available, or internally developed models in the absence of readily observable market prices. Valuation models are generally based on market and income (discounted cash flow) approaches, in which various internal and external factors are considered. Factors include key financial inputs and recent public and private transactions for comparable investments. Key inputs used for the discounted cash flow approach include the weighted average cost of capital and assumed inputs used to calculate terminal values, such as EBITDA exit multiples. The fair value recorded for a particular investment will generally be within the range suggested by the two approaches. Upon completion of the valuations conducted, an illiquidity discount is applied where appropriate. |
| • | Total Return Swaps, at Estimated Fair Value: We value our TRS in accordance with the TRS agreements between us (or our wholly owned subsidiary) and the TRS counter-party, which collectively established the TRS. Pursuant to the TRS agreements, the value of the TRS is based on (i) the increase or decrease in the value of the TRS reference assets relative to the notional amounts, together with (ii) accrued interest income and fee income, (iii) TRS financing costs on the TRS settled notional amount, and (iv) certain other expenses incurred under the TRS. The TRS reference assets are valued pursuant to the valuation algorithm specified in the TRS Agreements, including reliance on indicative bid prices provided by independent third-party pricing services. Bid prices reflect the highest price that market participants may be willing to pay. On a quarterly basis, our management reviews, tests and compares (i) the indicative bid prices assigned to each TRS reference asset by the TRS counter-party, based on the inputs provided by third-party pricing services with (ii) pricing inputs that are independently sourced by our management and/or the Advisors from third-party pricing services. Additionally, our management reviews the calculations of both collected and accrued interest, TRS financing costs, and realized gains and losses that also determine the aggregate fair value of the TRS. For additional disclosures on the TRS, including quantitative disclosures of the current period conclusions of the fair value components, refer to Note 4. |
Key unobservable inputs that have a significant impact on the Level 3 valuations as described above are included in Note 5 to the consolidated financial statements. We utilize several unobservable pricing inputs and assumptions in determining the fair value of its Level 3 investments. These unobservable pricing inputs and assumptions may differ by asset and in the application of our valuation methodologies. The reported fair value estimates could vary materially if we had chosen to incorporate different unobservable pricing inputs and other assumptions.
Security Transactions, Realized/Unrealized Gains or Losses, and Income Recognition - Security transactions are recorded on a trade-date basis. We measure realized gains or losses from the repayment or sale of investments using the specific identification method. The amortized cost basis of investments includes (i) the original cost and (ii) adjustments for the accretion/amortization of market discounts and premiums, original issue discount and loan origination fees. We report changes in fair value of investments that are measured at fair value as a component of net change in unrealized appreciation (depreciation) on investments in the condensed consolidated statements of operations.
Interest income is recorded on an accrual basis and includes amortization of premiums to par value and accretion of discounts to par value. Discounts and premiums to par value on securities purchased are accreted/amortized into interest income over the life of the respective security using the effective interest method. Premiums and discounts are determined based on the cash flows expected to be collected for a particular investment. In its role as our investment adviser, KKR may provide assistance to portfolio companies and in return may receive fees for capital structuring services. KKR is obligated to remit to us any earned capital structuring fees based on the pro-rata portion of our investment. These fees are generally non-recurring and are recognized as earned revenue by us upon closing of the associated investment. Loan origination, closing, commitment and other fees received directly from borrowers in connection with the closing of investments are accreted over the contractual life of the loan based on the effective interest method as interest income. Upon prepayment of a debt investment, any prepayment penalties and unamortized loan fees and discounts are recorded as interest income.
We have investments in debt securities that contain a contractual payment-in-kind (“PIK”) interest provision. PIK interest computed at the contractual rate specified in the investment’s credit agreement is accrued into income and reflected as interest receivable up to the capitalization date. PIK investments offer issuers either the option or the obligation at each interest payment date of making payments in cash or in additional securities. When additional securities are received, they typically have the same terms, including maturity dates and interest rates as the original securities issued. On these payment dates, we capitalize the accrued interest receivable as additional principal due from the borrower. PIK generally becomes due at maturity of the investment or upon the investment being called by the issuer. If the portfolio company valuation indicates a value of the PIK investment that is not sufficient to cover the contractual PIK interest, we will not accrue PIK interest or income on the PIK investment and will record an allowance for any accrued PIK interest receivable as a reduction of interest or dividend income in the period we determine it is not collectible. To maintain our status as a RIC, PIK interest income, which is considered taxable income, must be paid out to shareholders in the form of distributions, even though we have not yet collected the cash.
Dividend income on preferred equity securities is recorded as dividend income on an accrual basis to the extent that such amounts are payable by the portfolio company and are expected to be collected. Dividend income on common equity securities is recorded on the record date for private portfolio companies or on the ex-dividend date for publicly traded portfolio companies.
31
Table of Contents
Loans or debt securities are placed on non-accrual status when principal or interest payments are at least 90 days past due or when there is reasonable doubt that principal or interest will be collected. Generally, accrued interest is reversed when a loan or a debt security is placed on non-accrual status. Interest payments received on non-accrual loans or debt securities may be recognized as income or applied to principal depending upon management’s judgment. Non-accrual loans and debt securities are restored to accrual status when past due principal and interest is paid and, in management’s judgment, are likely to remain current. We may make exceptions to this treatment if the loan has sufficient collateral value and is in the process of collection.
Foreign Currency Translation, Transactions and Gains/Losses – Foreign currency amounts are translated into U.S. dollars on the following basis: (i) at the exchange rate on the last business day of the reporting period for the fair value of investment securities, other assets and liabilities; and (ii) at the rates of exchange prevailing on the respective recording dates for the purchase and sale of investment securities, income, expenses, gains and losses.
Net assets and fair values are presented based on the applicable foreign exchange rates described above and we do not isolate that portion of the results of operations resulting from changes in foreign exchange rates on investments from the fluctuations arising from changes in fair values of investments held; therefore the fluctuations related to foreign exchange rate conversion are included with the net realized gain (loss) and unrealized appreciation (depreciation) on investments.
Net realized foreign exchange gains or losses arise from activity in foreign currency forward contracts, sales of foreign currency, currency gains or losses realized between the trade and settlement dates on securities transactions, and the difference between the amounts of dividends, interest, and foreign withholding taxes recorded by us and the U.S. dollar equivalent of the amounts actually received or paid by the Company. Unrealized appreciation (depreciation) from currency translation for foreign currency forward contracts is included in net change in unrealized appreciation (depreciation) on derivative instruments on the consolidated statements of operations. Unrealized appreciation (depreciation) from foreign currency translation for other receivables or payables is presented as net change in unrealized appreciation (depreciation) on foreign currency translation in the consolidated statements of operations. Unrealized appreciation (depreciation) on foreign currency forward contracts is included with unrealized appreciation (depreciation) on derivative instruments on the consolidated statements of assets and liabilities.
Management Fees – We accrue for the base management fee (recorded as investment advisory fees) and performance-based incentive fees, including (i) a subordinated incentive fee on income and (ii) an incentive fee on capital gains. We record the liability for the incentive fee on capital gains based on a hypothetical liquidation of our Investment Portfolio at the end of each reporting period. Therefore the accrual for incentive fee on capital gains includes the recognition of incentive fee on both net realized gains and net unrealized appreciation, if any, although any such incentive fee associated with net unrealized appreciation is neither earned nor payable to the Advisors until net unrealized appreciation is realized as net realized gains. Additionally the determination of whether the accrued incentive fee associated with net realized gains is earned and payable to the Advisors can only be made at the end of the calendar year. The two components of performance-based incentive fees are combined and expensed on the consolidated statements of operations and accrued on the consolidated statements of assets and liabilities as accrued performance-based incentive fees.
Federal Income Taxes – We have elected to be treated for federal income tax purposes, and intend to maintain our qualification as RIC under Subchapter M of the Code. Generally, a RIC is not subject to federal income taxes on distributed income and gains if it distributes at least 90% of “Investment Company Taxable Income,” as defined in the Code. We intend to distribute sufficient dividends to maintain our RIC status each year and do not anticipate paying a material level of federal income taxes in the future.
We are also generally subject to nondeductible federal excise taxes if we do not distribute an amount at least equal to the sum (i) 98% of net ordinary income for a calendar year, (ii) 98.2% of the Company’s capital gains in excess of capital losses for the one-year period generally ending on October 31 of the calendar year and (iii) any ordinary income and net capital gains for preceding years that were not distributed during such years and on which we paid no federal income tax. We may, at our discretion, carry forward taxable income in excess of calendar year distributions and pay a 4% federal excise tax on this excess taxable income.
We recognize in our consolidated financial statements the effect of a tax position when it is more likely than not, based on the technical merits, that the position will be sustained upon examination. Tax benefits of positions not deemed to meet the more-likely-than-not threshold would be recorded as a tax expense in the current year. We did not have any uncertain tax positions that met the recognition or measurement criteria of ASC 740-10-25, Income Taxes – Overall –Recognition, nor did we have any unrecognized tax benefits as of the periods presented herein. Although we file federal and state tax returns, our major tax jurisdiction is federal.
Book and tax basis differences relating to permanent book and tax differences are reclassified among our capital accounts, as appropriate. Additionally, the tax character of distributions is determined in accordance with the Code, which differs from GAAP. See Note 13 to the consolidated financial statements.
See Note 2 to the consolidated financial statements for a description of recently issued accounting pronouncements. None of the recently issued accounting pronouncements has had a material effect on our consolidated financial statements.
32
Table of Contents
OVERVIEW
We are a non-diversified closed-end management investment company that has elected to be treated as a business development company under the 1940 Act. Formed as a Maryland corporation on June 9, 2010, we are externally managed by CNL and KKR, which are collectively responsible for sourcing potential investments, conducting due diligence on prospective investments, analyzing investment opportunities, structuring investments and monitoring our portfolio on an ongoing basis. Both Advisors are registered as investment advisers with the SEC. CNL also provides the administrative services necessary for us to operate.
Investment Objective, Investment Program and Primary Investment Types
Our investment objective is to provide our shareholders with current income and, to a lesser extent, long-term capital appreciation. We pursue our investment objective by investing primarily in the debt of privately owned U.S. companies (also referred to as “portfolio companies”) with a focus on originated transactions sourced through the networks of our Advisors. We define originated transactions as any negotiated investment where we, through our Advisors’ direct efforts, provide funds directly to a portfolio company. A substantial portion of our portfolio consists of direct lending investments, which we believe offer potential opportunities for superior risk-adjusted returns and income generation. Our debt investments may take the form of corporate loans or bonds, may be secured or unsecured and may, in some cases, be accompanied by warrants, options or other forms of equity participation. We may separately purchase common or preferred equity interests in transactions. We may also invest in structured products such as collateralized loan obligations.
As of December 31, 2013, our investment program consisted of two main components. First, since the inception of our investment activities we have been engaged in the direct purchase of debt securities primarily issued by portfolio companies, and these debt securities were acquired through both secondary market and direct lending transactions. We refer to this investment component as our “Investment Portfolio” in this report. Second, beginning in November 2012, we supplemented our economic exposure to portfolio companies by entering into total return swap arrangements (“the TRS”) with a commercial bank counterparty and directing the creation of a portfolio of underlying corporate bonds and loans that serve as reference assets under the TRS. We refer to this investment component as our portfolio of TRS reference assets or “TRS Portfolio” in this report. In the case of our TRS Portfolio, we receive all: (i) realized income and fees and (ii) realized capital gains generated by TRS reference assets. In return, we must pay quarterly to the TRS counterparty a payment consisting of: (i) realized capital losses and (ii) financing costs that are based on a floating interest rate and the notional amount of TRS reference assets. At the end of the TRS contract life, we will receive additional economic benefit if the net value of the TRS Portfolio appreciates relative to its notional amount. Conversely, we will be required to pay the counterparty the amount, if any, by which the net value of the portfolio of TRS reference assets declines relative to its notional amount. We do not own, or have physical custody of, the TRS reference assets. The TRS reference assets are not direct investments by us.
Our investment program is focused on creating and growing an Investment Portfolio that generates superior risk-adjusted returns by carefully selecting investments through rigorous due diligence and actively managing and monitoring our Investment Portfolio. When evaluating an investment in, or investment security issued by, a portfolio company, we use the resources of our Advisors to develop an investment thesis and a proprietary view of a potential portfolio company’s intrinsic value. We believe our flexible approach to investing allows us to take advantage of opportunities that offer the most favorable risk/reward characteristics.
This flexible investment program enables us to primarily focus on four investment types:
| • | Senior Debt. We invest in senior debt, and we generally take a security interest in the available assets of the portfolio company, including equity interests in any of its subsidiaries. These investments generally take the form of senior secured first lien loans, senior secured second lien loans, or senior secured bonds. In some circumstances, our lien could be subordinated to claims of other creditors. |
| • | Subordinated Debt. Our subordinated debt investments are generally subordinated to senior debt and are generally unsecured. These investments are generally structured with interest-only payments throughout the life of the security, with the principal due at maturity. |
| • | Structured Products. We also invest in structured products, which may include collateralized debt obligations (“CDOs”), collateralized bond obligations (“CBOs”), collateralized loan obligations (“CLOs”), structured notes and credit-linked notes. These investment entities may be structured as trusts or other types of pooled investment vehicles. They may also involve the deposit with or purchase by an entity of the underlying investments and the issuance by that entity of one or more classes of securities backed by, or representing interests in, the underlying investments or referencing an indicator related to such investments. |
| • | Equity Investments. We also make selected equity investments. In addition, when we invest in senior and subordinated debt, we may acquire warrants or options to purchase equity securities or benefit from other types of equity participation. Our goal is ultimately to dispose of these equity interests and realize gains upon our disposition of such interests. |
33
Table of Contents
On May 23, 2013 we were granted the SEC Exemptive Order, which expanded our ability to co-invest in privately negotiated transactions with other investment funds affiliated with KKR (the “Co-Investment Transactions”). Accordingly, our Advisors are able to pursue and access investment opportunities where:
| • | the business terms for investing debt and equity capital in the portfolio company are negotiated in all respects, |
| • | KKR or one or more of its affiliates is directly sourcing and negotiating the business terms of the Co-Investment Transaction, and |
| • | we can establish and liquidate our investment position alongside other investment funds that are managed by KKR or that represent affiliates of KKR. |
Our Advisors expect that these Co-Investment Transactions will represent an increasing portion of our Investment Portfolio and therefore we can expect some of the following changes as a result of that greater emphasis on Co-Investment Transactions:
| • | An alteration in the liquidity characteristics of our Investment Portfolio because of an increase in the proportion of investments in portfolio companies that are originated directly by KKR and its affiliates as primary market negotiated transactions, and a commensurate reduction in the proportion of our portfolio that is composed of debt investments that are acquired and liquidated through secondary market transactions; |
| • | An increase in the average amount invested per portfolio company (because of (i) a reduction in the overall number of portfolio companies held in the Investment Portfolio and (ii) the likely increase in the average amount of capital that is committed to primary market negotiated transactions, including Co-Investment Transactions) which will alter the investment diversification and concentration characteristics of our Investment Portfolio; |
| • | An increase in the number of investments and the share of our Investment Portfolio that will rely on valuation inputs that are unobservable and where initially there is little, if any, market activity for the investments that result from Co-Investment Transactions, thereby an increased dependency by us on our board of directors to determine in good faith the fair value of a larger proportion of our investments, including Co-Investment Transactions; and |
| • | The addition of new borrowing arrangements, including secured and unsecured credit facilities, to finance our Co-Investment Transactions with borrowed capital in addition to equity capital available to us, while adhering to the borrowing limitations that already apply to us pursuant to the 1940 Act. |
The level of our investment activity can and does vary substantially from period to period depending on many factors, including: the demand for debt from creditworthy privately owned U.S. companies, the level of merger, acquisition and refinancing activity involving private companies, the availability of credit to finance transactions, the general economic environment, the competitive investment environment for the types of investments we currently seek and intend to seek in the future, the amount of equity capital we raise from offering common stock in our company and the amount of capital we may borrow under our revolving credit facilities.
As a business development company, we are required to comply with certain regulatory requirements. For instance, we may not acquire any assets other than “qualifying assets” as specified in the 1940 Act unless, at the time the acquisition is made, at least 70% of our total assets are qualifying assets as determined at the end of the prior quarter (with certain limited exceptions). Qualifying assets include investments in “eligible portfolio companies.” Under the relevant SEC rules, the term “eligible portfolio company” includes all private companies, companies whose securities are not listed on a national securities exchange, and certain public companies that have listed their securities on a national securities exchange and have a market capitalization of less than $250 million. These rules also permit us to include as qualifying assets certain follow-on investments in companies that were eligible portfolio companies at the time of initial investment but that no longer meet the definition of eligible portfolio company at the time of the follow-on investment.
Revenues
We generate revenue primarily in the form of interest on the debt securities of portfolio companies that we acquire and hold for investment purposes. Our investments in debt securities generally have an expected maturity of three to ten years, although we have no lower or upper constraint on maturity, and typically earn interest at fixed or floating rates. Interest on our debt securities is generally payable to us quarterly or semi-annually. In some cases, our debt investments may partially defer cash interest payments with payment-in-kind provisions. Any outstanding principal amount of our debt securities and any accrued but unpaid interest will generally become due at the maturity date. In addition, we may generate revenue in the form of prepayment fees, commitment fees, origination fees, and fees for providing significant managerial assistance. While the TRS reference assets also generate interest income and fees, such amounts, net of the financing amounts we pay quarterly to the TRS counterparty, are recognized as realized gains pursuant to GAAP when payable to us.
34
Table of Contents
Operating Expenses
Our primary operating expenses include the payment of a base management fee and, depending on our operating results, performance-based incentive fees, reimbursable expenses under the investment advisory agreement, interest expense and financing fees, amortization of deferred offering expenses, fund administrative expenses, custody/accounting fees, and third-party expenses incurred under the administrative services agreement. The base management fee and performance-based incentive fees compensate the Advisors for their efforts and resources in identifying, evaluating, negotiating, closing and monitoring our investments. We bear all other costs and expenses of our operations and transactions.
FINANCIAL AND OPERATING HIGHLIGHTS
| ($ in millions except per share data) |
||||||||
| Year ended December 31, |
2013 | 2012 | ||||||
| Total consolidated assets |
$ | 2,281.19 | $ | 850.32 | ||||
| Adjusted total assets (Total consolidated assets net of payable for investments purchased) |
$ | 2,180.17 | $ | 777.89 | ||||
| Investment in portfolio companies |
$ | 1,924.87 | $ | 697.67 | ||||
| Borrowings - credit facilities |
$ | 707.39 | $ | 159.62 | ||||
| Borrowings - TRS deemed senior securities |
$ | 22.41 | $ | 76.05 | ||||
| Average credit facility borrowings |
$ | 339.27 | $ | 110.07 | ||||
| Net assets |
$ | 1,430.43 | $ | 611.48 | ||||
| Average net assets |
$ | 1,036.50 | $ | 304.26 | ||||
| Net asset value per share as of December 31, |
$ | 10.00 | $ | 9.75 | ||||
| Leverage ratio (Borrowings/Adjusted total assets) as of December 31, |
33 | % | 30 | % | ||||
| Weighted average asset coverage ratio |
3.58 | 3.62 | ||||||
| Portfolio Activity for the Year Ended December 31, |
2013 | 2012 | ||||||
| Cost of investments purchased |
$ | 2,090.37 | $ | 991.95 | ||||
| Sales, principal payments and other exits |
$ | 925.10 | $ | 410.53 | ||||
| Net investment income |
$ | 49.94 | $ | 15.69 | ||||
| Net realized gains on investments, derivative instruments and foreign currency transactions |
$ | 28.05 | $ | 3.04 | ||||
| Net change in unrealized appreciation on investments, derivative instruments and foreign currency translation: |
$ | 26.98 | $ | 6.92 | ||||
| Net increase in net assets from operations |
$ | 104.96 | $ | 25.65 | ||||
| Total distributions declared |
$ | 87.00 | $ | 23.32 | ||||
| Calendar year paid distribution as % of taxable income available for distribution |
97 | % | 97 | % | ||||
| Net investment income before unearned incentive fees per share |
$ | 0.54 | $ | 0.56 | ||||
| Net investment income per share |
$ | 0.48 | $ | 0.50 | ||||
| Earnings per share |
$ | 1.00 | $ | 0.82 | ||||
| Distributions declared per share outstanding for the entire period |
$ | 0.83 | $ | 0.76 | ||||
| Common Stock Offering Summary for the Year Ended December 31, |
2013 | 2012 | ||||||
| Gross proceeds |
$ | 849.31 | $ | 588.37 | ||||
| Net proceeds to Company |
$ | 770.59 | $ | 532.86 | ||||
| Average net proceeds per share |
$ | 9.97 | $ | 9.77 | ||||
| Shares issued in connection with offering |
77.26 | 54.52 | ||||||
BUSINESS ENVIRONMENT
The prices of loans and bonds trading in the secondary market continued to climb higher in 2013 and therefore the investment yields on secondary debt investments generally declined during the year. While originated private debt to middle market companies were not immune to the technical market forces which were the primary driver of secondary market movements, the required returns associated with the less liquid private debt investment market did not compress at the same pace, thereby resulting in generally wider margins to treasury bonds as compared to yields associated with the more liquid syndicated debt market. As discussed above under “— Overview,” we began rotating our Investment Portfolio to originated private debt investments beginning in the second half of 2013 and expect this trend to continue as we capitalize on our Advisors’ ability to directly originate investments.
Overall we retain a favorable outlook for the global economy in 2014 and maintain our stance on corporate credit based on underlying fundamentals. Moreover, we believe that we are still in the early to middle stages of the cyclical part of the economic recovery, and as such we do not see the credit cycle turning in 2014. However, it is important to maintain a degree of caution as we progress into 2014. Credit defaults are currently at abnormally low levels and we do not assume this rate is sustainable. It is through rigorous fundamental due diligence, robust credit underwriting and direct structuring of investments that we believe we are positioning the portfolio to protect principal and generate attractive risk-adjusted returns.
Markets will continue to receive a generous but decreasing amount of stimulus through the Federal Reserve’s liquidity injections, but the uncertainty around the timing of any future tapering could potentially lead to short-term volatility especially in the secondary market. While we are currently focused on originated investments and we believe our flexibility to invest across the credit spectrum with a long-term perspective provides us with the best opportunity to generate favorable returns on invested capital. Therefore, we must remain vigilant for, and able to move quickly in response to changes in technical dynamics.
35
Table of Contents
PORTFOLIO AND INVESTMENT ACTIVITY
Portfolio Investment Activity for the years ended December 31, 2013 and 2012
The following table summarizes our investment activity for the years ended December 31, 2013 and 2012, excluding our short term investments.
| Investment Activity Summary for the Year Ended December 31, ($ in millions) | ||||||||||||||||
| 2013 | 2012 | |||||||||||||||
| Investment Portfolio |
TRS Portfolio |
Investment Portfolio |
TRS Portfolio |
|||||||||||||
| Total Fair Value |
$ | 1,924.87 | $ | 60.10 | $ | 697.67 | $ | 164.77 | ||||||||
| Incremental Investment Activity |
$ | 2,090.37 | $ | 531.89 | $ | 991.95 | $ | 183.22 | ||||||||
| Investment Sales |
$ | (807.22 | ) | $ | (421.00 | ) | $ | (358.60 | ) | $ | (16.68 | ) | ||||
| No. Portfolio Companies |
94 | 20 | 126 | 47 | ||||||||||||
| Portfolio Company Additions |
61 | 16 | 62 | 49 | ||||||||||||
| Portfolio Company Exits |
(93 | ) | (43 | ) | (46 | ) | (2 | ) | ||||||||
| No. Debt Investments |
103 | 20 | 161 | 54 | ||||||||||||
| Debt Investment Additions |
82 | 18 | 119 | 56 | ||||||||||||
| Debt Investment Exits |
(140 | ) | (52 | ) | (100 | ) | (2 | ) | ||||||||
| No. Structured Products Investments |
4 | — | 1 | — | ||||||||||||
| No. Equity/Other Investments |
5 | — | 3 | — | ||||||||||||
While the Investment Portfolio and the TRS Portfolio are accounted for, and presented as, two distinct portfolios, the two portfolios had 17 and seven debt investment positions and 17 and 19 portfolio companies in common as of December 31, 2013 and 2012, respectively. The fair value of our TRS Portfolio decreased by 64% during the same period, primarily due to deletion and liquidation of reference assets in the TRS Portfolio. The utilization of the TRS has declined since December 31, 2012 in order to reallocate capital to fund our Co-Investment Transactions and other originated transactions.
The following information consists of additional segmentation analysis of our Investment Portfolio and TRS Portfolio based on asset categories and debt investment characteristics. However, our investment program is not managed with any specific asset category target goals.
The next two tables summarize the composition of our Investment Portfolio and our TRS Portfolio based on fair value as of December 31, 2013 and 2012, excluding our short term investments.
| Fair Value Summary as of December 31, 2013 ($ in thousands) | ||||||||||||||||
| Asset Category | Investment Portfolio at Fair Value |
Percentage of Investment Portfolio |
TRS Portfolio at Fair Value |
Percentage of TRS Portfolio |
||||||||||||
| Senior debt |
||||||||||||||||
| First lien |
$ | 771,511 | 40.1 | % | $ | 38,897 | 64.7 | % | ||||||||
| Second lien |
689,630 | 35.8 | 10,045 | 16.7 | ||||||||||||
| Secured bonds |
13,351 | 0.7 | 3,640 | 6.1 | ||||||||||||
|
|
|
|
|
|
|
|
|
|||||||||
| Total senior debt |
1,474,492 | 76.6 | 52,582 | 87.5 | ||||||||||||
| Subordinated debt |
370,131 | 19.2 | 7,514 | 12.5 | ||||||||||||
| Structured products |
55,575 | 2.9 | — | — | ||||||||||||
| Equity/Other |
24,671 | 1.3 | — | — | ||||||||||||
|
|
|
|
|
|
|
|
|
|||||||||
| Total |
$ | 1,924,869 | 100.0 | % | $ | 60,096 | 100.0 | % | ||||||||
|
|
|
|
|
|
|
|
|
|||||||||
| Fair Value Summary as of December 31, 2012 ($ in thousands) | ||||||||||||||||
| Asset Category | Investment Portfolio at Fair Value |
Percentage of Investment Portfolio |
TRS Portfolio at Fair Value |
Percentage of TRS Portfolio |
||||||||||||
| Senior debt |
||||||||||||||||
| First lien |
$ | 415,501 | 59.6 | % | $ | 121,458 | 73.7 | % | ||||||||
| Second lien |
94,742 | 13.6 | 6,548 | 4.0 | ||||||||||||
| Secured loans |
3,023 | 0.4 | — | — | ||||||||||||
| Secured bonds |
9,177 | 1.3 | — | — | ||||||||||||
|
|
|
|
|
|
|
|
|
|||||||||
| Total senior debt |
522,443 | 74.9 | 128,006 | 77.7 | ||||||||||||
| Subordinated debt |
166,345 | 23.8 | 36,762 | 22.3 | ||||||||||||
| Structured products |
3,443 | 0.5 | — | — | ||||||||||||
| Equity/Other |
5,437 | 0.8 | — | — | ||||||||||||
|
|
|
|
|
|
|
|
|
|||||||||
| Total |
$ | 697,668 | 100.0 | % | $ | 164,768 | 100.0 | % | ||||||||
|
|
|
|
|
|
|
|
|
|||||||||
36
Table of Contents
The next two tables summarize the composition of our Investment Portfolio based on amortized cost and the TRS Portfolio based on notional amount as of December 31, 2013 and 2012. The primary investment concentrations include (i) senior debt and (ii) subordinated debt securities.
| Investment Portfolio Cost and TRS Notional Amount Summary as of December 31,
2013 ($ in thousands) |
||||||||||||||||
| Asset Category | Investment Portfolio at Amortized Cost |
Percentage of Investment Portfolio |
TRS Portfolio at Notional Amount |
Percentage of TRS Portfolio |
||||||||||||
| Senior debt |
||||||||||||||||
| First lien |
$ | 758,999 | 40.2 | % | $ | 38,912 | 65.0 | % | ||||||||
| Second lien |
681,018 | 36.1 | 9,788 | 16.3 | ||||||||||||
| Secured bonds |
12,575 | 0.7 | 3,640 | 6.1 | ||||||||||||
|
|
|
|
|
|
|
|
|
|||||||||
| Total senior debt |
1,452,592 | 77.0 | 52,340 | 87.4 | ||||||||||||
| Subordinated debt |
355,239 | 18.8 | 7,571 | 12.6 | ||||||||||||
| Structured products |
55,520 | 2.9 | — | — | ||||||||||||
| Equity/Other |
24,250 | 1.3 | — | — | ||||||||||||
|
|
|
|
|
|
|
|
|
|||||||||
| Total |
$ | 1,887,601 | 100.0 | % | $ | 59,911 | 100.0 | % | ||||||||
|
|
|
|
|
|
|
|
|
|||||||||
| Investment Portfolio Cost and TRS Notional Amount Summary as of December 31,
2012 ($ in thousands) |
||||||||||||||||
| Asset Category | Investment Portfolio at Amortized Cost |
Percentage of Investment Portfolio |
TRS Portfolio at Notional Amount |
Percentage of TRS Portfolio |
||||||||||||
| Senior debt |
||||||||||||||||
| First lien |
$ | 412,409 | 59.6 | % | $ | 121,145 | 73.9 | % | ||||||||
| Second lien |
94,769 | 13.7 | 6,587 | 4.0 | ||||||||||||
| Secured loans |
3,139 | 0.4 | — | — | ||||||||||||
| Secured bonds |
8,879 | 1.3 | — | — | ||||||||||||
|
|
|
|
|
|
|
|
|
|||||||||
| Total senior debt |
519,196 | 75.1 | 127,732 | 77.9 | ||||||||||||
| Subordinated debt |
163,646 | 23.6 | 36,280 | 22.1 | ||||||||||||
| Structured products |
3,335 | 0.5 | — | — | ||||||||||||
| Equity/Other |
5,250 | 0.8 | — | — | ||||||||||||
|
|
|
|
|
|
|
|
|
|||||||||
| Total |
$ | 691,427 | 100.0 | % | $ | 164,012 | 100.0 | % | ||||||||
|
|
|
|
|
|
|
|
|
|||||||||
The next table presents a summary of interest rate and maturity statistics for the debt investments, based on par value, in our Investment Portfolio and the TRS Portfolio as of December 31, 2013.
| Investment Portfolio as of December 31, | TRS Portfolio as of December 31, | |||||||||||||||
| Floating interest rate debt investments: |
2013 | 2012 | 2013 | 2012 | ||||||||||||
| Percent of portfolio |
63.4 | % | 57.8 | % | 64.8 | % | 74.2 | % | ||||||||
| Percent of floating rate debt investments with interest rate floors |
96.4 | % | 87.3 | % | 100.0 | % | 87.0 | % | ||||||||
| Weighted average interest rate floor |
1.1 | % | 1.3 | % | 1.2 | % | 1.2 | % | ||||||||
| Weighted average coupon spread |
747 | bps | 595 | bps | 568 | bps | 433 | bps | ||||||||
| Weighted average years to maturity |
5.8 | 5.2 | 5.5 | 5.8 | ||||||||||||
| Fixed interest rate debt investments: |
||||||||||||||||
| Percent of portfolio |
36.6 | % | 42.2 | % | 35.2 | % | 25.8 | % | ||||||||
| Weighted average coupon rate |
10.6 | % | 9.5 | % | 8.6 | % | 8.3 | % | ||||||||
| Weighted average years to maturity |
6.1 | 5.6 | 6.8 | 7.0 | ||||||||||||
All of our floating interest rate debt investments have index reset frequencies of less than twelve months with the majority resetting at least quarterly. The three-month LIBOR, the most prevalent index employed among our floating interest rate debt investments, ranged between 0.236% and 0.305% during the year ended December 31, 2013 and the terminal value was 0.246% on December 31, 2013. Interest rate resets for floating interest rate investments will only result in interest income increases when the reset interest rate exceeds the associated interest rate floor.
As of December 31, 2013, the debt investments in our Investment Portfolio were purchased at an average price of 97.4% of par value and our estimated forward-looking debt portfolio yield was 10.0% based on amortized cost. The forward-looking debt portfolio yield is calculated on the debt investments in our Investment Portfolio as the sum of a) the annual interest rate of each debt investment multiplied by its par amount and b) the annual amortization of any discount or premium, divided by the total amortized cost of the debt investments as of December 31, 2013.
37
Table of Contents
The following table shows the credit ratings of the investments in our Investment Portfolio and TRS Portfolio, based upon the rating scale of Standard & Poor’s Ratings Services, as of December 31, 2013 and 2012.
| Investment Portfolio as of December 31, ($ in millions) |
TRS Portfolio as of December 31, ($ in millions) |
|||||||||||||||||||||||||||||||
| 2013 | 2012 | 2013 | 2012 | |||||||||||||||||||||||||||||
| Standard & Poor’s rating |
Fair Value | Percentage of Portfolio |
Fair Value | Percentage of Portfolio |
Fair Value | Percentage of Portfolio |
Fair Value | Percentage of Portfolio |
||||||||||||||||||||||||
| BBB- |
$ | — | — | % | $ | — | — | % | $ | — | — | % | $ | 5.67 | 3.4 | % | ||||||||||||||||
| BB+ |
— | — | 0.20 | 0.1 | — | — | — | — | ||||||||||||||||||||||||
| BB |
— | — | 13.53 | 1.9 | — | — | 14.37 | 8.7 | ||||||||||||||||||||||||
| BB- |
— | — | 39.72 | 5.7 | — | — | 8.61 | 5.2 | ||||||||||||||||||||||||
| B+ |
117.53 | 6.1 | 87.28 | 12.5 | 12.06 | 20.1 | 44.41 | 27.0 | ||||||||||||||||||||||||
| B |
329.46 | 17.1 | 178.18 | 25.6 | 28.26 | 47.0 | 70.02 | 42.5 | ||||||||||||||||||||||||
| B- |
195.51 | 10.2 | 184.37 | 26.4 | 9.73 | 16.2 | 7.78 | 4.7 | ||||||||||||||||||||||||
| CCC+ |
561.63 | 29.2 | 125.75 | 18.0 | 10.05 | 16.7 | 12.85 | 7.8 | ||||||||||||||||||||||||
| CCC |
48.10 | 2.5 | 23.20 | 3.3 | — | — | 1.06 | 0.7 | ||||||||||||||||||||||||
| CCC- |
8.80 | 0.5 | 9.74 | 1.4 | — | — | — | — | ||||||||||||||||||||||||
| Not rated |
663.84 | 34.4 | 35.70 | 5.1 | — | — | — | — | ||||||||||||||||||||||||
|
|
|
|
|
|
|
|
|
|
|
|
|
|
|
|
|
|||||||||||||||||
| Total |
$ | 1,924.87 | 100.0 | % | $ | 697.67 | 100.0 | % | $ | 60.10 | 100.0 | % | $ | 164.77 | 100.0 | % | ||||||||||||||||
|
|
|
|
|
|
|
|
|
|
|
|
|
|
|
|
|
|||||||||||||||||
The table below presents a summary of our debt investment positions held in portfolio that feature payment-in-kind (PIK) for some or all of the borrowers’ interest payment obligations.
| ($ in millions) | ||||||||
| As of December 31, |
2013 | 2012 | ||||||
| Number of originated investments with PIK feature and active PIK election |
5 | — | ||||||
| Total number of all investments with PIK feature |
15 | 1 | ||||||
| Total number of all investments that have active PIK election |
10 | 1 | ||||||
| Par value of originated investments with PIK feature and active PIK election |
$ | 303.04 | $ | — | ||||
| Total par value of all investments with PIK feature |
$ | 431.14 | $ | 9.27 | ||||
| Total par value of all investments that have active PIK election |
$ | 368.65 | $ | 9.27 | ||||
| Percent of Investment Portfolio with active PIK election, at par value |
16.1 | % | 1.3 | % | ||||
| PIK capitalized during the year ended December 31, |
$ | 9.32 | $ | 0.27 | ||||
| Capitalized PIK as a percentage of interest income for the year ended December 31, |
8.8 | % | 0.8 | % | ||||
| Capitalized PIK as a percentage of total investment income for the year ended December 31, |
7.8 | % | 0.8 | % | ||||
As discussed above under “— Overview,” since we received our SEC Exemptive Order, we have increased our focus on originated debt investments, including Co-Investment Transactions, as a main element of the investment strategy. During the year ended December 31, 2013, the following highlights are associated with this investment focus on originated debt investments:
| • | A total of 15 investments, that together represent $704.32 million at original cost, were directly originated in the year ended December 31, 2013, and was approximately 33.7% of total investment activity for the year. Thirteen of these originated investments were classed as Co-Investment Transactions as defined under the SEC Exemptive Order, representing $594.74 million of invested capital at original cost. In total we have invested $713.02 million in originated investments which now represent 37.0% of our total Investment Portfolio as of December 31, 2013, as measured on the basis of estimated fair value. |
| • | As of December 31, 2013, the estimated forward-looking annual yield of the originated debt investments was 11.6% based on amortized cost, as compared to 9.1% for the remainder of our debt investment portfolio. |
| • | The investment diversification and concentration characteristics of our Investment Portfolio have shifted; our average amount invested per portfolio company has increased to $20.48 million as of December 31, 2013, up from $5.6 million as of December 31, 2012, as measured on the basis of estimated fair value, while the number of portfolio company positions has decreased from 126 as of December 31, 2012 to 94 as of December 31, 2013. The average originated deal size, based on original cost and measured at the portfolio company level, was $46.95 million as compared to an average of $14.77 million for all other portfolio companies held in our Investment Portfolio. |
| • | The fair valuation leveling has shifted in our Investment Portfolio, whereby as of December 31, 2013, 41.6% of our total Investment Portfolio at fair value relied on unobservable valuation inputs (i.e. Level 3) , as compared to 13.1% classified as Level 3 as of December 31, 2012. |
38
Table of Contents
| • | We added a third credit facility to expand our borrowing capacity during the year ended December 31, 2013 with $320 million of committed borrowing capacity; this credit facility enables us to borrow investment capital to invest alongside our equity capital in our investment program that is focused on originated transactions. |
| • | We recognized $10.49 million in fee income during the year ended December 31, 2013 in connection with originated debt investments. |
As of December 31, 2013, our Investment Portfolio of 94 portfolio companies was diversified across 17 industry classifications, as compared to our Investment Portfolio as of December 31, 2012 that consisted of 126 portfolio companies diversified across 23 distinct industry classifications. As of December 31, 2013, the TRS Portfolio consisted of 20 portfolio companies diversified across seven distinct industry classifications, as compared to our TRS Portfolio as of December 31, 2012 that consisted of 47 portfolio companies diversified across 18 distinct industry classifications. The next table presents a diversification summary of our Investment Portfolio and TRS Portfolio arranged by industry classifications at December 31, 2013 and December 31, 2012.
| Investment Portfolio as of December 31, ($ in millions) |
TRS Portfolio as of December 31, ($ in millions) |
|||||||||||||||||||||||||||||||
| 2013 | 2012 | 2013 | 2012 | |||||||||||||||||||||||||||||
| Industry Classification |
Percentage of Portfolio |
Fair Value | Percentage of Portfolio |
Fair Value |
Percentage of Portfolio |
Fair Value |
Percentage of Portfolio |
Fair Value |
||||||||||||||||||||||||
| Consumer Durables & Apparel |
19.0 | % | $ | 365.97 | 1.0 | % | $ | 6.92 | 18.2 | % | $ | 10.94 | 0.9 | % | $ | 1.49 | ||||||||||||||||
| Technology Hardware & Equipment |
12.4 | 238.57 | 7.8 | 54.56 | 22.2 | 13.35 | 2.4 | 3.90 | ||||||||||||||||||||||||
| Retailing |
10.6 | 204.88 | 9.2 | 64.01 | — | — | 2.6 | 4.24 | ||||||||||||||||||||||||
| Health Care Equipment & Services |
9.3 | 178.20 | 6.2 | 43.23 | 4.1 | 2.46 | 7.7 | 12.66 | ||||||||||||||||||||||||
| Software & Services |
7.7 | 147.36 | 9.1 | 63.20 | 12.2 | 7.30 | 15.6 | 25.78 | ||||||||||||||||||||||||
| Materials |
7.1 | 136.36 | 9.9 | 69.35 | 22.0 | 13.23 | 3.7 | 6.09 | ||||||||||||||||||||||||
| Energy |
6.1 | 117.40 | 0.9 | 6.43 | — | — | 1.1 | 1.81 | ||||||||||||||||||||||||
| Capital Goods |
5.4 | 103.20 | 13.7 | 95.73 | 4.4 | 2.67 | 15.0 | 24.76 | ||||||||||||||||||||||||
| Food, Beverage & Tobacco |
5.2 | 99.25 | 1.3 | 9.00 | — | — | — | — | ||||||||||||||||||||||||
| Insurance |
3.5 | 67.68 | 6.2 | 43.51 | — | — | 1.8 | 3.00 | ||||||||||||||||||||||||
| Commercial & Professional Services |
3.5 | 67.55 | 3.4 | 24.03 | — | — | 4.2 | 7.00 | ||||||||||||||||||||||||
| Remaining Industries |
10.2 | 198.45 | 31.3 | 217.70 | 16.9 | 10.15 | 45.0 | 74.04 | ||||||||||||||||||||||||
|
|
|
|
|
|
|
|
|
|
|
|
|
|
|
|
|
|||||||||||||||||
| Total |
100.0 | % | $ | 1,924.87 | 100.0 | % | $ | 697.67 | 100.0 | % | $ | 60.10 | 100.0 | % | $ | 164.77 | ||||||||||||||||
|
|
|
|
|
|
|
|
|
|
|
|
|
|
|
|
|
|||||||||||||||||
We neither “control” nor are we an “affiliated person” (each as defined in the 1940 Act) of any of our portfolio companies. Under the 1940 Act, we generally would be presumed to “control” a portfolio company if we own beneficially, either directly or through one or more controlled companies, 25% or more of its voting securities; and generally would be an “affiliated person” of a portfolio company if we directly or indirectly own or otherwise control 5% or more of its voting securities.
LIQUIDITY AND CAPITAL RESOURCES
Our liquidity and capital resources are derived primarily from proceeds of our Offerings, credit facilities and cash flows from operations, including investment sales and repayments, and income earned. Our primary use of funds from operations includes investments in portfolio companies and payments of fees and other operating expenses we incur. We have used, and expect to continue to use, our credit facilities and proceeds from the turnover of our Investment Portfolio to finance our secondary market and originated investments in portfolio companies.
Equity Capital
We raised net proceeds from our Offerings of $807.20 million and $544.70 million during the years ended December 31, 2013 and 2012, respectively. As of December 31, 2013, we have raised net proceeds of $1,416.33 million through the sale of 143.70 million shares of common stock since we commenced our Offerings, including the reinvestment of distributions into shares of our common stock.
Credit Facilities
We borrow funds to invest alongside the equity capital proceeds of our Offerings and the proceeds from the turnover of our portfolio. We may issue “senior securities,” including borrowing money from banks or other financial institutions only in amounts such that our asset coverage, as defined in the 1940 Act, is greater than 200% after such borrowing incurrence or issuance of our senior securities.
39
Table of Contents
The following table presents summary information with respect to our outstanding credit facilities.
| As of December 31, 2013 ($ in thousands) | ||||||||
| Credit Facility |
Total Aggregate Principal Amount Committed (1) |
Principal Amount Outstanding |
||||||
| Deutsche Bank Credit Facility |
$ | 265,000 | $ | 264,440 | ||||
| BNP Credit Facility |
200,000 | 123,000 | ||||||
| Senior Secured Credit Facility |
320,000 | (2) | 319,949 | (3) | ||||
|
|
|
|
|
|||||
| Total |
$ | 785,000 | $ | 707,389 | ||||
|
|
|
|
|
|||||
| (1) | Subject to borrowing base and leverage restrictions. |
| (2) | Provides for a feature that allows us under certain circumstances, to increase the size of the Senior Secured Credit Facility to a maximum of $600 million. |
| (3) | Includes $142.40 million denominated in foreign currency. |
Deutsche Bank Credit Facility
In 2011, our wholly-owned special purpose financing subsidiary CCT Funding LLC (“CCT Funding”) entered into a revolving credit facility agreement as amended, the “Deutsche Bank Credit Facility”) with Deutsche Bank AG, New York Branch (“Deutsche Bank”). At the time CCT Funding initially entered into the Deutsche Bank Credit Facility, Deutsche Bank was the sole initial lender. On February 11, 2013, CCT Funding, Deutsche Bank and a second lender entered into an amendment (the “Third Amendment”) to the Deutsche Bank Credit Facility. The Third Amendment amended the Deutsche Bank Credit Facility by providing for, among other things, the extension of a new tranche of loan commitments (the “Tranche D Loans”) permitting additional borrowings in an aggregate amount of up to $100 million. Pursuant to the Third Amendment, Healthcare of Ontario Pension Plan became a Lender under the Deutsche Bank Credit Facility.
CCT Funding has appointed us to manage its investment portfolio pursuant to the terms of an investment management agreement. CCT Funding’s obligations to the lenders under the Deutsche Bank Credit Facility are secured by a first priority security interest in substantially all of the assets of CCT Funding. The obligations of CCT Funding under the revolving credit facility are non-recourse to us. Approximately 23% of our total Investment Portfolio, including money market investments, was held as collateral at CCT Funding under the Deutsche Bank Credit Facility as of December 31, 2013.
We have incurred costs of $1.34 million in connection with arranging and amending the Deutsche Bank Credit Facility, primarily consisting of upfront commitment and legal fees. We have recorded these costs as deferred financing costs on our consolidated statement of assets and liabilities and we amortize these costs to interest expense over the life of the credit facility. As of December 31, 2013, $0.58 million of such deferred financing costs had yet to be amortized to interest expense.
As of December 31, 2013, $65.00 million was borrowed and outstanding as Tranche B1 Loans, $100.00 million was borrowed and outstanding as Tranche B2 Loans and $94.44 million was borrowed and outstanding as Tranche D loans. The unused commitment balance was $0.56 million under the Tranche D Loans commitments. For the years ended December 31, 2013 and 2012, our all-in cost of financing for the Deutsche Bank Credit Facility, including fees and expenses, was 2.65% and 2.60%, respectively.
On January 28, 2014, CCT Funding entered into an amendment (the “Fourth Amendment”) under the Deutsche Bank Credit Facility. The Fourth Amendment further amends the Deutsche Bank Credit Facility by providing for, among other things, an upsize of the Tranche B1 Loans from $65 million to $140 million, for total borrowings available under the credit facility of $340 million. As amended, the Tranche B1 Loans are scheduled to mature on January 28, 2015.
BNP Credit Facility
On June 4, 2013, we entered into a committed facility arrangement (the “BNP Credit Facility”), which became effective on June 12, 2013, with BNP Paribas Prime Brokerage, Inc. (“BNP”) under which we may borrow up to $200 million. On August 29, 2013 we assigned the agreements under the BNP Credit Facility to Paris Funding LLC (“Paris Funding”), our newly created wholly-owned special purpose financing subsidiary. The BNP Credit Facility is secured by certain assets in our portfolio that have been pledged as collateral. The amount of assets that we are required to pledge is determined in accordance with the margin requirements of the BNP Credit Facility. Approximately 12% of our total Investment Portfolio, including money market investments, was pledged as collateral under the BNP Credit Facility as of December 31, 2013. Interest is charged at the annual rate of one month LIBOR plus 1.10% and is payable monthly. We also pay an annual commitment fee on any unused commitment amounts. That fee, which was initially 0.55%, was increased to 0.75% on December 30, 2013.
As of December 31, 2013, $123.00 million was borrowed and outstanding under the BNP Credit Facility. For the year ended December 31, 2013, our all-in cost of financing for the BNP Credit Facility, including fees and expenses, was 2.15%. We have
40
Table of Contents
incurred costs of $0.47 million in connection with arranging the BNP Credit Facility, primarily consisting of upfront commitment and legal fees. We have recorded these costs as deferred financing costs on our consolidated statement of assets and liabilities and we amortize these costs to interest expense over the initial term of the credit facility. As of December 31, 2013, $0.21 million of such deferred financing costs had yet to be amortized to interest expense.
Senior Secured Credit Facility
On September 4, 2013 (the “Closing Date”), we entered into a senior secured revolving credit agreement (the “Senior Secured Credit Agreement”) with certain lenders and JPMorgan Chase Bank, N.A. (“JPMorgan”), acting as administrative agent. The Senior Secured Credit Agreement provides for a revolving credit facility (the “Senior Secured Credit Facility”) consisting of loans to be made in dollars and other foreign currencies in an initial aggregate amount of $285 million. The Senior Secured Credit Facility includes an “accordion” feature that allows us, under certain circumstances, to increase the size of the facility to a maximum of $600 million. On October 24, 2013, the aggregate loan commitment under the Senior Secured Credit Facility was increased to $320 million.
The Senior Secured Credit Facility is secured by substantially all of our portfolio investments and our cash and securities accounts excluding those held by our wholly owned financing subsidiaries, and provides for a guaranty by certain of our subsidiaries. Borrowings under the Senior Secured Credit Facility are subject to compliance with a borrowing base that applies different advance rates to different types of investments in our portfolio. The stated borrowing rate under the Senior Secured Credit Facility is based on LIBOR plus an applicable spread of 2.50%, or on an “alternate base rate” (which is the highest of a prime rate, the federal funds rate plus 0.50%, or one-month LIBOR plus 1.00%) plus an applicable spread of 1.50%, or, with respect to borrowings in non-LIBOR currencies, on a rate applicable to such currency plus an applicable spread of 2.50%. We also pay an annual commitment fee on any unused commitment amounts of between 0.375% and 1.00%, which varies depending on total utilization.
As of December 31, 2013, $319.95 million was borrowed and outstanding under the Senior Secured Credit Facility, including $142.40 million of foreign currency borrowings. For the year ended December 31, 2013, our all-in cost of financing for the Senior Secured Credit Facility, including fees and expenses, was 3.73%. We have incurred costs of $3.95 million in connection with arranging the Senior Secured Credit Facility, primarily consisting of upfront commitment and legal fees. We have recorded these costs as deferred financing costs on our consolidated statement of assets and liabilities and we amortize these costs to interest expense over the initial term of the credit facility. As of December 31, 2013, $3.63 million of such deferred financing costs had yet to be amortized to interest expense.
Total Credit Facility Borrowings
For the year ended December 31, 2013, our total all-in cost of financing, including fees and expenses, was 2.73%. As of December 31, 2013, the ratio of total credit facility borrowings-to-adjusted total assets was 32%. (Adjusted total assets is equal to total consolidated assets excluding payable for investments purchased.) We will continue to draw on the revolving credit facilities and combine borrowed funds with equity capital to finance our acquisition of investment positions in portfolio companies. Additionally, we may further increase the aggregate borrowing commitment in the future beyond the current amount of $785.00 million that is available to us from our revolving credit facilities, and/or we may add additional credit arrangements. See “Note 11 Revolving Credit Facilities and Borrowings” in our consolidated financial statements for additional disclosures regarding our credit facilities.
Total Return Swaps
On November 15, 2012, Halifax Funding LLC, (“Halifax Funding”) our wholly-owned, special purpose financing subsidiary, entered into a TRS arrangement with The Bank of Nova Scotia (“BNS”). Our TRS arrangement with BNS consists of a set of agreements (namely, an ISDA 2002 Master Agreement, together with the Schedule thereto and Credit Support Annex to such Schedule, by and between Halifax Funding LLC and BNS, and a Confirmation Letter Agreement by and between Halifax Funding and BNS, and a tri-party custodian agreement (the “BNS Custodian Agreement”) between Halifax Funding and BNS and The Bank of Nova Scotia Trust Company of New York (“BNS Trust”), each dated as of November 15, 2012), and are collectively referred to herein as the TRS Agreements. Under the terms of the TRS Agreements, each reference asset in the TRS portfolio constitutes a separate total return swap transaction, although all calculations, payments and transfers required to be made under the TRS are calculated and treated on an aggregate basis, based upon all such transactions.
Effective July 22, 2013, BNS Trust resigned as custodian in connection with the TRS, and the BNS Custodian Agreement was terminated without any early termination penalties incurred by us or Halifax Funding. The resignation of BNS Trust was made in connection with a broader decision by BNS to discontinue its custody business operations in the United States. In connection with the termination of the BNS Custodian Agreement, Halifax Funding and BNS entered into a Control Agreement dated as of July 22, 2013 (the “Control Agreement”) with State Street Bank and Trust Company, as custodian (the “Custodian”). Pursuant to an amendment to the TRS, the Custodian succeeds BNS Trust as the custodian in connection with the TRS.
Pursuant to the terms of the TRS Agreements, Halifax Funding may select single-name corporate loans and bonds and create a TRS portfolio with a maximum aggregate notional amount of $500.00 million. Halifax Funding is required to initially collateralize a specified percentage of each loan or bond (generally, at least 40% of the notional amount of such loan or bond) in accordance with margin requirements stipulated in the TRS Agreements.
41
Table of Contents
Pursuant to Halifax Funding’s limited liability company operating agreement, we act as the manager of Halifax Funding and exercise Halifax Funding’s rights under the TRS, including selecting the specific loans or bonds to be included in, or deleted from, the TRS Portfolio. The loans and/or bonds selected by Halifax Funding for purposes of inclusion in the TRS Portfolio are selected by us in accordance with our investment objective. Each selected loan or bond, and the TRS Portfolio taken as a whole, must also meet criteria described in the TRS Agreements. BNS, as calculation agent, determines whether each loan or bond complies with the TRS portfolio criteria. Halifax Funding receives quarterly from BNS all collected interest and fees from the portfolio of TRS reference assets. Halifax Funding pays to BNS interest at a rate equal to the three-month LIBOR+0.80% per annum if the initial investment amount (i.e., posted collateral) equals or exceeds 50% of the notional amount, or three-month LIBOR+1.00% if the initial investment amount is less than 50% of the TRS notional amount. In addition, upon the sale or repayment of any TRS reference asset, Halifax Funding will either receive from BNS the realized gain in the value of such reference asset relative to its notional amount, or pay to BNS any realized loss in the value of the reference asset relative to its notional amount. The required amount of collateral may exceed 50% of the notional amount in the event that reference asset(s) or groupings of assets exceed certain portfolio concentration limits. As of December 31, 2013, the posted collateral of $37.50 million equals 63% of the total notional amount, as compared to 54% as of December 31, 2012. The required collateral amount as of December 31, 2013 at 40% and 50% of total notional amount was $23.96 million and $29.96 million, respectively. As of December 31, 2013, we were also required to post additional collateral in the amount of $12.93 million due to concentration limits in the TRS Portfolio.
Under the terms of the TRS Agreements, Halifax Funding may be required to post additional collateral, on a dollar-for-dollar basis, in the event of depreciation in the value of the portfolio of TRS reference assets after such value decreases below a specified amount. The minimum additional collateral that Halifax Funding is required to post pursuant to the TRS Agreements is equal to the amount required to ensure that the value of the TRS credit support is equal to 25% of the value of the TRS Portfolio.
The obligations of Halifax Funding under the TRS Agreements are non-recourse to us and our exposure under the TRS Agreements is limited to the amount of collateral that is posted pursuant to the terms of the TRS Agreements. We have no contractual obligation to post any collateral or to make any payments on behalf of Halifax Funding to BNS. We may, but are not obligated to, increase our equity capital investment in Halifax Funding for the purpose of funding any additional collateral or payment obligations for which Halifax Funding may become obligated during the term of the TRS Agreements. If we do not make any such additional equity capital investment in Halifax Funding and Halifax Funding fails to meet its obligations under the TRS Agreements, then BNS will have the right to terminate the TRS Agreements and seize the collateral posted by Halifax Funding. In the event of an early termination of the TRS, Halifax Funding would be required to pay an early termination fee.
All collateral required to be posted under the TRS Agreements is held in the custody of the Custodian. The Custodian will maintain and perform certain custodial services with respect to the collateral pursuant to the Control Agreement. The Control Agreement and the obligations of the Custodian thereunder will continue until BNS has notified the Custodian in writing that all obligations of Halifax Funding under the TRS Agreements have been satisfied.
In connection with the TRS Agreements, Halifax Funding has made customary representations and warranties and is required to comply with various covenants, financial reporting requirements and other customary requirements for similar facilities. In addition to customary events of default and termination events, the TRS Agreements contain the following additional termination events, among others: (a) the occurrence of an event that materially and adversely affects us and that BNS reasonably believes could also materially impair Halifax Funding’s ability to perform its obligations under the TRS Agreements; (b) a regulatory or judicial authority’s initiation of a proceeding for financial fraud or criminal wrongdoing against us that is reasonably likely to adversely impact the risk profile of an investment in or loan to Halifax Funding; (c) specified material reductions in Halifax Funding’s net asset value, including if, at any time, such net asset value declines to less than 50% of its net asset value in effect either as of the last day of the preceding calendar year or as of the date of the TRS Agreements; (d) Halifax Funding’s material amendment to, or material failure to comply with, its investment strategies or restrictions, to the extent that, in light of such amendment or non-compliance, BNS reasonably expects Halifax Funding to be unable to observe its obligations under the TRS Agreements; and (e) if, at any time, out of a group of seven specifically identified key KKR personnel, fewer than four continue to be partners, members, directors or employees of KKR or serve investment or risk assessment roles in respect of KKR. Additionally, on November 12, 2013, Halifax Funding and BNS amended the TRS Agreements to add, among other revisions, an additional termination event, namely, the incurrence by Halifax Funding of any indebtedness or financial obligation exceeding $2.50 million.
For purposes of the asset coverage ratio test applicable to us under the 1940 Act as a business development company, we treat the difference between (i) the TRS notional amount, and (ii) the actual amount of cash collateral posted by Halifax Funding under the TRS, as a senior security for the life of the TRS Agreements. Further, for purposes of determining our compliance with the 70% qualifying asset requirement of Section 55(a) under the 1940 Act, we treat a TRS reference asset as a qualifying asset if the obligor associated with the TRS reference asset is an eligible portfolio company and as a non-qualifying asset if the obligor is not an eligible portfolio company.
42
Table of Contents
Commitments and Contingencies
Unfunded commitments to provide funds to portfolio companies are not reflected on our consolidated statements of assets and liabilities. Our unfunded commitments may be significant from time to time. Because these commitments may expire without being drawn upon, the total commitment amount does not necessarily represent future cash requirements. We intend to use cash flow from normal and early principal repayments and proceeds from borrowings and offerings to fund these commitments. As of December 31, 2013, our unfunded loan commitments totaled $17.50 million. We maintain sufficient liquidity in the form of cash on hand, cash proceeds from unsettled liquidated investments, and borrowing capacity under our revolving credit facilities to fund such unfunded loan commitments should the need arise.
During the first two months of 2014, we have sold investments of $281.35 million. The proceeds from these sales have been used to fund new investment activity of $154.61 million and to pay down existing credit facilities.
Distributions Paid and Declared
We pay our monthly distributions in the form of cash. Shareholders may elect to reinvest their ordinary monthly distributions and/or long-term capital gains distributions as additional shares of our common stock under our distribution reinvestment plan. Any distributions reinvested under our distribution reinvestment plan remain taxable to the U.S. shareholder.
We declared our first distribution on June 8, 2011. The following table reflects the cash distributions per share and the total amount of distributions that we have declared on our common stock during the years ended December 31, 2012 and 2013:
| For the Year Ended December 31, |
Per Share | Amount ($ millions) |
||||||
| 2012 |
$ | 0.755374 | $ | 23.32 | ||||
| 2013 |
$ | 0.825212 | $ | 87.00 | ||||
Approximately 51% and 50% of the distributions we declared in the years ended December 31, 2013 and 2012, respectively, were reinvested in shares of our common stock at the prevailing net price per share at the time of distribution payments and represent an additional source of capital to invest in portfolio companies. See Note 8 to the consolidated financial statements for a discussion of the sources of distributions on a GAAP basis.
Net investment income and realized capital gains represent the primary sources for us to pay distributions. The next table presents other sources of taxable income available for distributions for the years ended December 31, 2013 and 2012.
| For the year ended December 31, ($ millions) |
2013 | 2012 | ||||||
| Ordinary income component of tax basis accumulated earnings |
$ | 0.82 | $ | 0.11 | ||||
| Estimated unearned performance-based incentive fees |
6.72 | 1.98 | ||||||
| Organization and offering expenses |
6.44 | 2.11 | ||||||
| Taxable income from investments on non-accrual status |
1.05 | — | ||||||
| Net change in unrealized depreciation on total return swaps |
0.51 | 1.35 | ||||||
| Net change in unrealized depreciation on foreign currency forward contracts |
(3.03 | ) | (.15 | ) | ||||
| Other book-tax differences |
0.4 | — | ||||||
|
|
|
|
|
|||||
| Total of other sources available for distributions (1) |
$ | 12.55 | 5.40 | |||||
|
|
|
|
|
|||||
| (1) | The above table does not present all adjustments to calculate taxable income available for distributions. See Note 13 to the consolidated financial statements for a reconciliation of net increase in net assets resulting from operations to taxable income available for distributions. |
For the years ended December 31, 2013 and 2012, 100% of our declared distributions were covered by taxable income available for distributions. We routinely disclose the sources of paid distributions to our shareholders on periodic reports that accompany (i) quarterly account statements and (ii) monthly distribution checks that are prepared and sent directly by our transfer agent to our shareholders.
Results of Operations
RESULTS COMPARISONS FOR THE YEARS ENDED DECEMBER 31, 2013 AND 2012
Set forth below are our results of operations for the years ended December 31, 2013 and 2012. The growth of our Investment Portfolio since December 31, 2012 is primarily due to the increase in equity capital from our Offerings, and this increase in both (i) capital available for investment, including borrowed funds, and (ii) investment activity contributed to significant increases in investment income, operating expenses, net investment income and net assets between the comparative periods, as discussed below.
Investment Income
Investment income for the years ended December 31, 2013 and 2012 was $119.57 million and $35.58 million, respectively. The largest component of investment income was interest income of $105.71 million and $34.21 million for the years
43
Table of Contents
ended December 31, 2013 and 2012, respectively. The increase in investment income is due primarily to the growth of our Investment Portfolio over the last year. We raised $807.20 million in net proceeds from our Offerings during the year ended December 31, 2013, and this equity capital was deployed throughout the year in the acquisition of investment securities issued by portfolio companies. We also generated fee income of $13.80 million during the year ended December 31, 2013, as compared to $1.27 million during the year ended December 31, 2012. The increase in fee income is due primarily to $10.49 million of structuring service fees earned on direct origination deals, including Co-Investment Transactions. We expect our Investment Portfolio to continue to grow during 2014 and, accordingly, we believe that reported investment income for the year ended December 31, 2013 is not representative of our stabilized performance or our future performance. We expect further increases in investment income in future periods due to (i) an increase in our weighted average coupon spread that has resulted from our recent focus on Co-Investment Transactions and other originated transactions, (ii) a growing base of portfolio company investments that we expect to result from the expected increases in equity capital available to us for investment purposes from our Follow-On Offering and borrowed capital, and (iii) additional structuring service fees earned on Co-Investment Transactions. The interest income earned by the TRS reference assets is not included in investment income in the consolidated statements of operations, but rather it is included in the TRS fair value, and eventually recorded as part of realized gain or loss on derivative instruments in connection with quarterly TRS settlement payments.
Operating Expenses
Our total operating expenses were $68.50 million and $19.65 million for the years ended December 31, 2013 and 2012, respectively. Our operating expenses included $30.09 million and $9.19 million in base management fees attributed to the investment advisory services of our Advisors for the years ended December 31, 2013 and 2012, respectively. Our Advisors are also eligible to receive incentive fees based on performance. We recorded performance-based incentive fee expense of $16.03 million and $1.98 million for the years ended December 31, 2013 and 2012, respectively. The performance-based incentive fee expense for the year ended December 31, 2013 is comprised of subordinated incentive fees on income of $6.99 million and incentive fees on capital gains of $9.04 million. The performance-based incentive fee expense for the year ended December 31, 2012 is comprised entirely of incentive fees on capital gains. Additionally, during 2013 we implemented a change in the computation of performance-based incentive fees that effectively reduces the amount of incentive fees on capital gains that the Advisors can earn from the TRS investment. As discussed in “Note 6. Agreements and Related Party Transactions” in our consolidated financial statements, the calculation of performance-based incentive fees disregards any net realized and unrealized gains associated with the TRS net interest spread. A portion of performance-based incentive fees on capital gains is accrued with respect to net unrealized appreciation in our Investment Portfolio and derivative instruments. However, the performance-based incentive fee on capital gains with respect to such net unrealized appreciation is not payable by us unless and until the net unrealized appreciation is actually realized in a cumulative amount that exceeds any unrealized depreciation that is recorded in our Investment Portfolio, TRS Portfolio and other derivatives.
The following table illustrates the calculation of the incentive fees on income for the three months ending September 30 and December 31, 2013. The Advisors did not earn any incentive fees on income for the three months ended March 31 and June 30, 2013.
| For the three months ended ($ millions) | ||||||||||||||||
| September 30, 2013 | December 31, 2013 | |||||||||||||||
| Amount | Percent of Average Adjusted Capital |
Amount | Percent of Average Adjusted Capital |
|||||||||||||
| Average Adjusted Capital |
$ | 1,128.54 | $ | 1,358.21 | ||||||||||||
| Net Investment Income |
$ | 15.73 | $ | 19.24 | ||||||||||||
| Add Back: Performance-Based Incentive Fees |
5.89 | 10.00 | ||||||||||||||
|
|
|
|
|
|||||||||||||
| Pre-Incentive Fees Net Investment Income |
21.62 | 1.91 | % | 29.24 | 2.15 | % | ||||||||||
| Subordinated Incentive Fees on Income |
(1.71 | ) | (0.15 | )% | (5.28 | ) | (0.39 | )% | ||||||||
|
|
|
|
|
|
|
|
|
|||||||||
| Preference Return to Shareholders (1) |
$ | 19.91 | 1.76 | % | $ | 23.96 | 1.76 | % | ||||||||
|
|
|
|
|
|
|
|
|
|||||||||
| (1) | Preference return rate is 1.7644% = 7%*(92 days/365 days) |
The actual amount of incentive fees on capital gains that are due and payable to the Advisors is determined at the end of the calendar year. The Advisors have earned $2.32 million of incentive fees on capital gains for the 12 months ended December 31, 2013. The earned fees are expected to be paid to the Advisors during the first quarter of 2014. Prior to the year ended December 31, 2013, the Advisors had not received, nor earned, any payment of incentive fees on capital gains. The following table illustrates the calculation of the amount of the recorded incentive fee on capital gains that is payable to the Advisors as of December 31, 2013.
44
Table of Contents
| As of December 31, 2013 |
Amount ($ millions) | |||
| Cumulative net realized gains since inception (a) |
$ | 22.92 | ||
| Less: Unrealized depreciation in Investment Portfolio, TRS Portfolio and other derivatives (b) |
(11.31 | ) | ||
|
|
|
|||
| Excess cumulative net realized gains eligible for earned incentive fees |
$ | 11.61 | ||
|
|
|
|||
| Earned performance-based incentive fee on net realized gains@20% (1) |
$ | 2.32 | ||
| Prior period paid incentive fees |
— | |||
|
|
|
|||
| Current period earned performance based incentive fee on net realized gains |
$ | 2.32 | ||
|
|
|
|||
| (1) | The actual incentive fee on capital gains earned and payable to the Advisors, as determined at the end of the year, is 20% of the excess of (a) over (b), less any prior period payments of incentive fees on capital gain, if any. |
See “—Contractual Obligations, —Investment Advisory Agreements,” below for further details about the performance-based incentive fees.
We recorded interest expense of $9.29 million and $2.88 million for the year ended December 31, 2013 and 2012, respectively, primarily in connection with borrowings under our revolving credit facilities. The increase in interest expense is primarily attributable to the increase in our weighted average debt outstanding to $339.27 million during the year ended December 31, 2013 as compared to $110.07 million the year ended December 31, 2012.
Our other operating expenses for the years ended December 31, 2013 and 2012 include $6.50 million and $1.21 million in offering expense, $2.05 million and $1.06 million in administrative services expenses, $1.43 million and $1.09 million in professional services expense, $0.56 million and $0.20 million in custodian and accounting fees, $0.37 million and $0.18 million in director fees and expenses and $2.18 million and $0.96 million in other expenses, respectively. We also incurred organization expenses of $0.90 million during the year ended December 31, 2012.
As our asset base and number of shareholders have grown, our general and administrative expenses have increased, but at a slower rate compared to the growth rate in the asset base. We expect certain variable operating expenses to continue to increase because of the anticipated growth in the size of our asset base and the number of open shareholder accounts. During the year ended December 31, 2013, the ratio of annualized core operating expenses (excluding investment advisory fees, interest expense and reimbursement of organization and offering expenses, and including net expense support) to average net assets was 0.75%, as compared to 1.23% for the year ended December 31, 2012. We generally expect core operating expenses to decline as a percentage of our net assets during periods of asset growth over the next several calendar quarters. Incentive fees and interest expense, among other things, may also increase or decrease our overall operating expenses and expense ratios relative to comparative periods depending on portfolio performance, an increase or reduction in borrowed funds, and changes in benchmark interest rates such as LIBOR, among other factors.
Expense Support Payments and Reimbursement Payments - Expense Support Payments from the Advisors were $1.59 million and we accrued $1.83 million as probable Reimbursement Payment obligation for the year ended December 31, 2012. The provisions of the Expense Support Agreement that provide for Expense Support Payments from the Advisors to us were not extended beyond June 30, 2012, and therefore there were no Expense Support Payments from the Advisors for the year ended December 31, 2013. Additionally, we paid $1.83 million in 2013 and accrued $1.14 million for the year ended December 31, 2013 as probable Reimbursement Payment obligation relative to the cumulative Expense Support Payments of $2.97 million. Accordingly, our payments and accrual of reimbursement of Expense Support Payments equals 100% of cumulative Expense Support Payments as of December 31, 2013. (See “—Contractual Obligations, —Expense Support Agreement,” below for further details about the Expense Support Agreement. Also see “Note 6. Agreements and Related Party Transactions” included within our consolidated financial statements for additional disclosures regarding the Expense Support Payments and Reimbursement Payments.)
Net Investment Income
Our net investment income totaled $49.94 million ($0.48 per share) and $15.69 million ($0.50 per share) for the years ended December 31, 2013 and 2012, respectively. The primary drivers of the decrease in net investment income per share were (i) accrued reimbursement of expense support payable to the Advisors in the year ended December 31, 2013 and (ii) the receipt of expense support payments from Advisors in the year ended December 31, 2012. The table below shows net investment income and net investment income per share for the years ended December 31, 2013 and 2012, before the effects of unearned performance-based incentive fees and expense support, which we refer to as adjusted net investment income (non-GAAP).
| For the years ended December 31, ($ millions) | ||||||||
| 2013 | 2012 | |||||||
| Net Investment Income (GAAP) |
$ | 49.94 | $ | 15.69 | ||||
| Estimated unearned performance-based incentive fees |
6.72 | 1.98 | ||||||
| Reimbursement of expense support |
1.14 | 1.83 | ||||||
| Expense support |
— | (1.59 | ) | |||||
|
|
|
|
|
|||||
| Adjusted Net Investment Income (non-GAAP) |
$ | 57.80 | $ | 17.91 | ||||
|
|
|
|
|
|||||
| Net Investment Income Per Share |
$ | 0.48 | $ | 0.50 | ||||
| Adjusted Net Investment Income Per Share |
$ | 0.55 | $ | 0.57 | ||||
45
Table of Contents
The decline in net investment income per share can also be partly attributed to the presence of the TRS Portfolio, which is not a contributor to GAAP net investment income since the TRS Portfolio collected and accrued interest income and TRS financing charges are included in the TRS fair value, and eventually recorded as part of realized gain or loss on derivative instruments in connection with quarterly TRS settlement payments. The following table shows the TRS interest income and financing charges for the years ended December 31, 2013 and 2012.
| For the years ended December 31, ($ millions) | ||||||||
| 2013 | 2012 | |||||||
| Interest and fee income included in TRS fair value |
$ | 1.81 | $ | 1.02 | ||||
| Financing charge included in TRS fair value |
(0.10 | ) | (0.08 | ) | ||||
|
|
|
|
|
|||||
| Subtotal |
1.71 | 0.94 | ||||||
| Interest and fee income recorded as TRS realized gains |
10.02 | — | ||||||
| Financing charge recorded as TRS realized gains |
(1.85 | ) | — | |||||
| Less: amounts included in prior period fair value |
(0.94 | ) | — | |||||
|
|
|
|
|
|||||
| TRS Net Interest Spread |
$ | 8.94 | $ | 0.94 | ||||
|
|
|
|
|
|||||
| TRS Net Interest Spread Per Share |
$ | 0.09 | $ | 0.03 | ||||
Net Realized Gain
We sold investments and received principal payments of $807.22 million and $117.88 million, respectively, during the year ended December 31, 2013, from which we realized net gains of $20.04 million. Our net realized gain on derivative instruments of $9.14 million for the year ended December 31, 2013 was comprised of a $10.31 million realized gain on the TRS and a $1.17 million realized loss on foreign currency forward contracts. The net realized loss on foreign currency transactions was $1.13 million. We sold investments and received principal payments of $358.60 million and $51.93 million, respectively, during the year ended December 31, 2012, from which we realized a net gain of $3.48 million. Our net realized loss on derivative instruments of $0.43 million for the year ended December 31, 2012 was comprised of net realized losses on foreign currency forward contracts. We also realized a net loss on foreign currency transactions of $0.06 million during the year ended December 31, 2012.
Net Unrealized Appreciation or Depreciation
For the year ended December 31, 2013, net unrealized appreciation on investments increased by $31.03 million, net unrealized appreciation/depreciation on derivative instruments decreased by $2.52 million and net unrealized appreciation/ depreciation on foreign currency translation decreased by $1.53 million. The increase in net unrealized appreciation on investments was driven largely by new investments acquired during the year ended December 31, 2013. The net change in unrealized appreciation/depreciation on derivative instruments consisted of net unrealized appreciation on the TRS Portfolio of $0.51 million and net unrealized depreciation on foreign currency forward contracts of $3.03 million. The net change in TRS unrealized appreciation consisted of (i) spread interest income of $0.76 million, (ii) realized gains on the TRS reference assets of $0.32 million and (iii) unrealized depreciation on the TRS reference assets of $0.57 million. The net change in unrealized depreciation on foreign currency translation consisted of $1.61 million of net unrealized depreciation on the portion of the Senior Secured Credit Facility that is denominated in foreign currencies, offset by $0.08 million of net unrealized appreciation on the foreign currency translation of other trade receivables and payables. For the year ended December 31, 2012, the net change in unrealized appreciation on investments was $5.76 million, the net change in unrealized appreciation on derivative instruments was $1.20 million and the net change in unrealized depreciation on foreign currency translation was $0.04 million.
Net Increase in Net Assets Resulting from Operations
For the years ended December 31, 2013 and 2012, the net increase in net assets resulting from operations was $104.96 million and $25.65 million, respectively.
RESULTS COMPARISONS FOR THE YEARS ENDED DECEMBER 31, 2012 AND 2011
Set forth below are our results of operations for the years ended December 31, 2012 and 2011. Our portfolio investment activity commenced on July 1, 2011 and our Investment Portfolio growth since July 1, 2011 is primarily due to growth in equity and borrowed capital, and this rise in both capital available for investment and investment activity primarily accounted for the significant increases in investment income, operating expenses, net investment income and net assets between the comparative periods, as discussed below.
Investment Income
We generated investment income of $35.58 million and $0.96 million for the years ended December 31, 2012 and 2011, respectively. Our investment income primarily consists of interest earned on senior and subordinated debt investments held in our Investment Portfolio. This comparative increase in investment income is due to the growth of our Investment Portfolio since commencing investment operations in July 2011. The level of interest income we receive is directly related to (i) our rate of investing
46
Table of Contents
equity capital and borrowed funds into the investment securities of portfolio companies, (ii) the weighted average balance of interest-bearing investments throughout the period, and (iii) the weighted average yield of our investments. The interest earned by the TRS reference assets is not recorded as investment income, but rather it is included in the TRS fair value, and eventually recorded as part of realized gain or loss on derivative instruments in connection with quarterly TRS settlement payments.
Operating Expenses
Our total operating expenses were $19.65 million and $1.48 million for the years ended December 31, 2012 and 2011, respectively. Our operating expenses included $9.19 million and $0.35 million in base management fees attributed to the investment advisory services of our Advisors for the years ended December 31, 2012 and 2011, respectively. Our Advisors are also eligible to receive incentive fees based on performance. We recorded incentive fee expense of $1.98 million and $0.28 million for the years ended December 31, 2012 and 2011, respectively. A significant portion of incentive fees on capital gains is accrued with respect to net unrealized appreciation in our Investment Portfolio, although no such incentive fee is actually payable by us with respect to such net unrealized appreciation unless and until the net unrealized appreciation is actually realized in a cumulative amount that exceeds any unrealized depreciation in our Investment Portfolio. The actual amount due and payable to the Advisors is determined at the end of the calendar year. As of December 31, 2012 and 2011, the cumulative realized gains were $3.05 million and $0.01 million, respectively, and the unrealized depreciation in our Investment Portfolio was $8.76 million and $0.49 million, respectively, therefore the Advisors have not received, nor earned, any payment of incentive fees on capital gains as of December 31, 2012.
We recorded interest expense of $2.87 million and $0.09 million for the years ended December 31, 2012 and 2011, respectively, in connection with borrowing under our revolving credit facility which became effective on August 23, 2011. The increase in interest expense is primarily attributable to the increase in our weighted average debt outstanding to $110.07 million during the year ended December 31, 2012 as compared to $4.08 million the year ended December 31, 2011.
Our other operating expenses for the years ended December 31, 2012 and 2011 include $1.06 million and $0.18 million in administrative services expenses, $1.09 million and $0.23 million in professional services expense, $0.20 million and $0.12 million in custodian and accounting fees, $0.18 million and $0.08 million in director fees and expenses and $0.96 million and $0.15 million in other expenses, respectively. We also incurred offering and organization expenses of $1.21 and $0.90 million, respectively, during the year ended December 31, 2012.
As our asset base and number of investors have grown, our general and administrative expenses have increased accordingly, but at a slower rate compared to the growth rate in the asset base. We expect certain variable operating expenses to continue to increase because of the anticipated growth in the size of our asset base and the number of open shareholder accounts. During the year ended December 31, 2012, the ratio of core operating expenses (excluding investment advisory fees, interest expense and reimbursement of organization and offering expenses, and including net expense support) to average net assets was 1.23%. All operating expenses for the year ended December 31, 2011, with the exception of unearned incentive fees on capital gains in the amount of $0.11 million were offset by the Advisors’ Expense Support Payments (as defined and discussed below under “—Contractual Obligations —Expense Support Agreement”). We generally expect core operating expenses to decline as a percentage of our net assets during periods of asset growth over the next several calendar quarters. Incentive fees and interest expense, among other things, may also increase or decrease our overall operating expenses and our overall expense ratios relative to comparative periods depending on portfolio performance and changes in benchmark interest rates such as LIBOR, among other factors.
Expense Support Payments and Reimbursement Payments - Expense Support Payments from the Advisors were $1.59 million and $1.38 million for the year ended December 31, 2012 and for the period from July 1, 2011 (commencement of operations) to December 31, 2011, respectively. The provisions of the Expense Support Agreement that provide for Expense Support Payments from the Advisors to us were not extended beyond June 30, 2012. Additionally, we accrued $1.83 million as probable Reimbursement Payment obligation relative to the cumulative Expense Support Payments of $2.97 million as of December 31, 2012. (See “—Contractual Agreements, —Expense Support Agreement,” below for further details about the Expense Support Agreement. Also see “Note 6. Agreements and Related Party Transactions” included within our consolidated financial statements for additional disclosures regarding the Expense Support Payments and Reimbursement Payments.)
47
Table of Contents
Net Investment Income
Our net investment income totaled $15.69 million ($0.50 per share) and $0.85 million ($0.67 per share) for the years ended December 31, 2012 and 2011, respectively. The primary drivers of the decrease in net investment income per share were (i) accrued reimbursement of expense support payable to the Advisors in the year ended December 31, 2012 and (ii) the receipt of expense support payments from Advisors in the year ended December 31, 2011. The table below shows net investment income and net investment income per share for the years ended December 31, 2012 and 2011, before the effects of unearned performance-based incentive fees and expense support, which we refer to as adjusted net investment income (non-GAAP).
| For the years ended December 31, ($ millions) | ||||||||
| 2012 | 2011 | |||||||
| Net Investment Income (GAAP) |
$ | 15.69 | $ | 0.85 | ||||
| Estimated unearned performance-based incentive fees |
1.98 | 0.11 | ||||||
| Reimbursement of expense support |
1.83 | — | ||||||
| Expense support |
(1.59 | ) | (1.38 | ) | ||||
|
|
|
|
|
|||||
| Adjusted Net Investment Income (Loss) (non-GAAP) |
$ | 17.91 | $ | (0.42 | ) | |||
|
|
|
|
|
|||||
| Net Investment Income Per Share |
$ | 0.50 | $ | 0.67 | ||||
| Adjusted Net Investment Income (Loss) Per Share |
$ | 0.57 | $ | (0.33 | ) | |||
The decline in net investment income per share can also be partly attributed to the presence of the TRS Portfolio, which is not a contributor to GAAP net investment income since the TRS Portfolio collected and accrued interest income and TRS financing charges are included in the TRS fair value, and eventually recorded as part of realized gain or loss on derivative instruments in connection with quarterly TRS settlement payments. The following table shows the TRS interest income and financing charges for the year ended December 31, 2012. We had not entered into the TRS as of December 31, 2011.
| For the year ended December 31, 2012 | Amount ($ millions) | |||
| Interest and fee income included in TRS fair value |
$ | 1.02 | ||
| Financing charge included in TRS fair value |
(0.08 | ) | ||
|
|
|
|||
| TRS Net Interest Spread |
$ | 0.94 | ||
|
|
|
|||
| TRS Net Interest Spread Per Share |
$ | 0.03 | ||
Net Realized Gain
We sold investments and received principal payments of $358.60 million and $51.93 million, respectively, during the year ended December 31, 2012, from which we realized net gains of $3.48 million. Our net realized loss on derivative instruments of $0.43 million for the year ended December 31, 2012 was comprised entirely of losses on foreign currency forward contracts. The net realized loss on foreign currency transactions was an additional $0.01 million. We sold investments of $0.48 million during the year ended December 31, 2011, from which we realized a net gain of $0.01 million.
Net Unrealized Appreciation or Depreciation
For the year ended December 31, 2012, the net change in unrealized appreciation on investments totaled $5.76 million, the net change in unrealized appreciation on derivative instruments totaled $1.20 million and the net change in unrealized depreciation on foreign currency translation totaled $0.04 million. The change in unrealized appreciation on investments was primarily driven by the appreciation in fair values, including tighter credit spreads, as recorded in several investment positions held in our Investment Portfolio. The net change in unrealized appreciation on derivative instruments consisted of net unrealized appreciation on the TRS of $1.35 million and net unrealized depreciation on foreign currency forward contracts of $0.15 million. The net change in unrealized appreciation on the TRS consisted of spread interest income of $0.94 million, realized losses of $0.35 million on the TRS reference assets and an unrealized gain on the TRS reference assets of $0.76 million. For the year ended December 31, 2011, the net change in unrealized depreciation on investments was $0.48 million and the net change in unrealized appreciation on foreign currency translation was $0.04 million.
Net Increase in Net Assets Resulting from Operations
For the year ended December 31, 2012 and 2011, the net increase in net assets resulting from operations was $25.65 million and $1.38 million, respectively.
NET ASSETS, NET ASSET VALUE PER SHARE, ANNUAL INVESTMENT RETURN AND TOTAL RETURN SINCE INCEPTION
Net assets increased $818.95 million during the year ended December 31, 2013. The most significant increase in net assets during the year ended December 31, 2013 was attributable to capital transactions including (i) new issuance of shares of common stock, and (ii) reinvestment of distributions in the combined amount of $807.20 million. Net investment income contributed
48
Table of Contents
$49.94 million to the growth in net assets during the year ended December 31 30, 2013. Other increases in net assets were attributable to (i) unrealized appreciation on investments, derivative instruments and foreign currency translation of $26.98 million and (ii) net realized gains of $28.05 million. Distributions to shareholders in the amount of $87.00 million and the repurchase of shares of common stock in the amount of $6.20 million contributed to a reduction in net assets during the year ended December 31, 2013.
Net assets increased $546.32 million during the year ended December 31, 2012. The most significant increase in net assets during the year ended December 31, 2012 was attributable to capital transactions including (i) new issuance of shares of common stock, and (ii) reinvestment of distributions in the combined amount of $544.70 million. Net investment income contributed $15.69 million to the growth in net assets during the year ended December 31, 2012. Other increases in net assets were attributable to (i) unrealized appreciation on investments, derivative instruments and foreign currency translation of $6.92 million and (ii) net realized gains of $3.04 million. Distributions to shareholders in the amount of $23.32 million and the repurchase of shares of common stock in the amount of $0.71 million contributed to a reduction in net assets during the year ended December 31, 2012.
Net assets increased $64.96 million during the year ended December 31, 2011. The most significant increase in net assets during the year ended December 31, 2011 was attributable to capital transactions including (i) new issuance of shares of common stock, and (ii) reinvestment of distributions in the combined amount of $64.44 million. Net investment income contributed $0.85 million to the growth in net assets during the year ended December 31, 2011. Other increases in net assets were attributable to (i) unrealized appreciation on investments and foreign currency translation of $0.52 million and (ii) net realized gains of $0.01 million. Distributions to shareholders in the amount of $0.86 million contributed to a reduction in net assets during the year ended December 31, 2011.
Our net asset value per share was $10.00, $9.75 and $9.21 on December 31, 2013, 2012 and 2011, respectively. After considering (i) the overall changes in net asset value per share, (ii) paid distributions of approximately $0.83, $0.76 and $0.37 per share during the years ended December 31, 2013, 2012 and 2011, respectively, and (iii) the assumed reinvestment of those distributions at 90% of the prevailing offering price per share, then the total investment return was 11.4%, 14.3% and 6.5% for shareholders who held our shares over the entire twelve-month periods ending December 31, 2013 and 2012 and for the period from June 17, 2011 (commencement of operations) through December 31, 2011, respectively.
Initial shareholders who subscribed to the Initial Offering in June 2011 with an initial investment of $10,000 and an initial purchase price equal to $9.00 per share (public offering price net of sales load) have seen the value of their investment grow by 35.6% (see chart below), or an annualized return of 12.7%. Initial shareholders who subscribed to the Initial Offering in June 2011 with an initial investment of $10,000 and an initial purchase price equal to $10.00 per share (the initial public offering price) have registered a total investment return of 22.1%, or an annualized return of 8.2%. The S&P/LSTA Leveraged Loan Index, a primary measure of senior debt covering the U.S. leveraged loan market which currently consists of approximately 1,100 credit facilities throughout numerous industries, and the Merrill Lynch US High Yield Master II Index, a primary measure of subordinated debt consisting of approximately 2,000 high yield corporate bonds, registered cumulative total returns of approximately 14.4% and 24.0%, respectively, in the period from June 17, 2011 to December 31, 2013.
49
Table of Contents
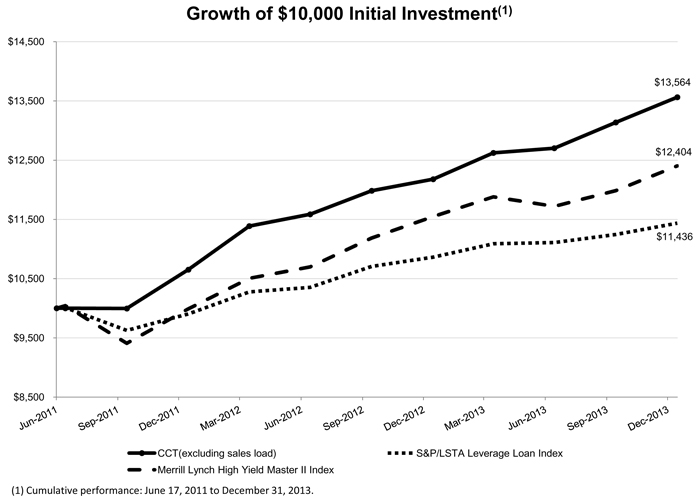
The calculations for the Growth of $10,000 Initial Investment are based upon (i) an initial investment of $10,000 in our common stock at the beginning of the period, at a share price of $10.00 per share (including sales load) and $9.00 per share (excluding sales load), (ii) assumes reinvestment of monthly distributions in accordance with our distribution reinvestment plan (iii) the sale of the entire investment position at the net asset value per share on the last day of the period; and (iv) the cash payment for distributions payable to shareholders, if any, on the last day of the period.
Our shares are illiquid investments for which there is not a secondary market, and we do not expect a secondary market in our shares to develop in the future. You should not expect to be able to resell your shares regardless of how we perform. If you are able to sell your shares, you will likely receive less than your purchase price. Our net asset value and annualized returns — which are based in part upon determinations of fair value of Level 3 investments by our board of directors, not active market quotations — are inherently uncertain. Past performance is not a guarantee of future results.
Off-Balance Sheet Arrangements
We had no off-balance sheet arrangements as of December 31, 2013.
Contractual Obligations
Investment Advisory Agreements – We have entered into the Investment Advisory Agreement with CNL for the overall management of our investment activities. We and CNL have also entered into the Sub-Advisory Agreement with KKR, under which KKR is responsible for the day-to-day management of our Investment Portfolio. CNL compensates KKR for advisory services that it provides to us with 50% of the base management fees and performance-based incentive fees that CNL receives under the Investment Advisory Agreement. Pursuant to the Investment Advisory Agreement, CNL earns a management fee equal to an annual rate of 2% of our average gross assets (including assets purchased with borrowed funds and unsettled trades, unrealized appreciation or depreciation on total return swaps and collateral posted with custodian in connection with TRS, but excluding deferred offering expense), and an incentive fee based on our performance. The incentive fee is comprised of the following two parts:
| (i) | a subordinated incentive fee on pre-incentive fee net investment income, that is paid quarterly if earned, and it is computed as the sum of (A) 100% of quarterly pre-incentive fee net investment income in excess of 1.75% of average adjusted capital up to a limit of 0.4375% of average adjusted capital, and (B) 20% of pre-incentive fee net investment income in excess of 2.1875% of average adjusted capital, and |
| (ii) | an incentive fee on capital gains that is paid annually if earned, and it is equal to 20% of (A) all realized gains on a cumulative basis from inception, net of (i) all realized losses on a cumulative basis, (ii) unrealized depreciation at year-end and (iii) disregarding any net realized gains associated with the TRS interest spread (which represents the difference between (a) the interest and fees received on total return swaps, and (b) the financing fees paid to the total return swaps counterparty), and subtracting (B) the aggregate amount of any previously paid incentive fee on capital gains. |
50
Table of Contents
The terms of the Investment Advisory Agreement entitle CNL (and indirectly KKR) to receive up to 5% of gross proceeds in connection with the Offerings as reimbursement for organization and offering expenses incurred by the Advisors on our behalf. The Advisors waived our requirement to reimburse them for organization and offering expenses for the period from June 17, 2011 through January 31, 2012. The waiver of the reimbursement requirements did not reduce the amount of organization and offering expenses incurred by the Advisors that are eligible for reimbursement in future periods. Beginning February 1, 2012, we implemented an expense reimbursement rate equal to 0.75% of gross Initial Offering proceeds to initiate the reimbursement of organization and offering expenses incurred by the Advisors. The reimbursement rate was increased to 1.0% of gross Initial Offering proceeds on March 1, 2013. Through the completion of the Initial Offering, the Advisors have been reimbursed in the amounts of $0.90 million for organization expenses and $10.84 million for offering expenses. There are no remaining unreimbursed organization and offering expenses from the Initial Offering. The final reimbursement rate was 0.8% of gross offering proceeds from the Initial Offering. As of December 31, 2013, the Advisors have been reimbursed in the amounts of $0.26 million for offering expenses from the Follow-On Offering, including any payable balances for reimbursement of offering expenses. As of December 31, 2013, the Advisors carried a balance of approximately $1.56 million for expenses incurred on our behalf in connection with the Follow-On Offering, net of (i) incremental offering expenses incurred by the Advisors on our behalf and (ii) our reimbursement payments to the Advisors and any payable balances for reimbursement of offering expenses.
The Advisors are expected to continue to incur offering expenses on our behalf throughout the remainder of the Follow-On Offering period and the reimbursement of the Advisor for offering expenses they incur on our behalf is expected to continue through the termination date of the Follow-On Offering. We expect the reimbursement rate to remain at or below 1.0% of gross offering proceeds for the remainder of the Follow-On Offering. See “Note 6. Agreements and Related Party Transactions” in our consolidated financial statements for expanded discussion of the Investment Advisory Agreements.
Expense Support Agreement – We are party to an Expense Support and Conditional Reimbursement Agreement with CNL and KKR (as amended, the “Expense Support Agreement”) pursuant to which CNL and KKR jointly and severally agreed to reimburse us for a specified percentage of our operating expenses (an “Expense Support Payment”) during the Expense Support Payment Period beginning on June 17, 2011 and ending on June 30, 2012. As of June 30, 2012, the Advisors had incurred $2.97 million of Expense Support Payments.
During the term of the Expense Support Agreement, the Advisors are entitled to an annual year-end reimbursement payment by us for unreimbursed Expense Support Payments made under the Agreement (a “Reimbursement Payment”), but such Reimbursement Payments may only be made within three years after the calendar year in which such Expense Support Payments are made. No Reimbursement Payment may be paid by us to the extent that it would cause our Other Operating Expenses (Other Operating Expenses is equal to Operating Expenses, but excluding base advisory fees and including a Reimbursement Payment) to exceed 1.75% of average net assets attributable to common shares as of the calendar year-end (the “Reimbursement Limit Percentage”). During the year ended December 31, 2013, we made a Reimbursement Payment of $1.83 million. As of December 31, 2013, the Advisors have been reimbursed $1.83 million of Expense Support payments and we have accrued an additional $1.14 million for probable Reimbursement Payment obligation. As of December 31, 2013, all Expense Support Payments received from the Advisors have been either repaid or accrued for probable reimbursement in 2014.
Revolving Credit Facilities – As discussed above under “Financial Condition, Liquidity and Capital Resources – Credit Facilities,” we, either directly or through our wholly-owned subsidiaries, have entered into several revolving credit facilities. As of December 31, 2013, the credit facilities provided for borrowings in an aggregate amount up to $785.00 million on a committed basis and $707.39 million was borrowed and outstanding under the credit facilities. (See “— Liquidity and Capital Resources — Credit Facilities” above and “Note 11. Revolving Credit Facilities and Borrowings” in our consolidated financial statements for expanded discussion of the revolving credit facilities.)
A summary of our significant contractual payment obligations for the repayment of outstanding borrowings and interest expense and other fees related to the credit facilities at December 31, 2013 is as follows (in millions):
| Total | < 1 year | 1-3 years | 3-5 years | After 5 years | ||||||||||||||||
| Deutsche Bank Credit Facility (1) |
$ | 264.44 | $ | 65.00 | $ | 199.44 | $ | — | $ | — | ||||||||||
| BNP Credit Facility (2) |
123.00 | 123.00 | — | — | — | |||||||||||||||
| Senior Secured Credit Facility (3) |
319.95 | — | — | 319.95 | — | |||||||||||||||
| Interest and Credit Facility Fees Payable |
0.97 | 0.97 | — | — | — | |||||||||||||||
|
|
|
|
|
|
|
|
|
|
|
|||||||||||
| TOTAL |
$ | 708.36 | $ | 188.97 | $ | 199.44 | $ | 319.95 | $ | — | ||||||||||
|
|
|
|
|
|
|
|
|
|
|
|||||||||||
| (1) | At December 31, 2013 our unused commitment amount was $0.56 million under the Deutsche Bank Credit Facility. |
| (2) | At December 31, 2013 our unused commitment amount was $77.00 million under the BNP Credit Facility. |
| (3) | At December 31, 2013 our unused commitment amount was $0.51 million under the Senior Secured Credit Facility. |
51
Table of Contents
The maturity structure of our Investment Portfolio of debt investments at December 31, 2013, based on par amounts, is as follows (in millions):
| Total | < 1 year | 1-3 years | 3-5 years | After 5 years | ||||||||||||||||
| Investment Portfolio Debt Investments (1) |
$ | 1,887.09 | $ | 3.31 | $ | 55.30 | $ | 464.23 | $ | 1,364.25 | ||||||||||
| (1) | Par amounts denominated in foreign currencies are converted to U.S. dollars using the applicable exchange rate at December 31, 2013. |
The maturity schedule presented above does not include consideration of partial paydown of principal. Call provisions and refinancings may also lead to the earlier return of principal balances to the extent we do not participate in the refinancings.
| Item 7A. | Quantitative and Qualitative Disclosures About Market Risk |
Interest Rate Risk
We are subject to financial market risks, in particular changes in interest rates. Future changes in interest rates will likely have effects on the interest income we earn on our portfolio investments, the fair value of our fixed income investments, the interest rates and interest expenses associated with the money we borrow for investment purposes, and the fair value of loan balances.
Subject to the requirements of the 1940 Act, we may hedge against interest rate fluctuations by using standard hedging instruments such as futures, options and forward contracts. Although hedging activities may insulate us against adverse changes in interest rates, they may also limit our ability to participate in the benefits of lower interest rates. During the years ended December 31, 2013 and 2012, we did not engage in interest rate hedging activities.
As of December 31, 2013, approximately 63.4% of our portfolio of debt investments, or approximately $1,197.19 million measured at par value, featured floating or variable interest rates. The variable interest rate debt investments are usually based on three-month LIBOR (the base rate) and typically have durations of three months after which the base rates are reset to then prevailing three-month LIBOR. At December 31, 2013, approximately 96.4% of our portfolio of variable interest rate debt investments, or approximately $1,153.94 million measured at par value, featured minimum base rates, or base rate floors, and the weighted average base rate floor for such investments was 1.1%. Variable interest rate investments that feature a base rate floor generally reset to the then prevailing three-month LIBOR only if the reset base rate exceeds the base rate floor on the applicable interest rate reset date, in which cases we may benefit through an increase in interest income from such interest rate adjustments. At December 31, 2013, we held an aggregate investment position of $43.25 million at par value in variable interest rate debt investments that featured variable interest rates without any minimum base rates, or approximately 3.6% of our portfolio of variable interest rate debt investments. In the case of these “no base rate floor” variable interest debt investments held in our portfolio, we may benefit from increases in the base rates that may subsequently result in an increase in interest income from such interest rate adjustments.
Because we borrow money to make investments, our net investment income is partially dependent upon the difference between the interest rate at which we invest borrowed funds and the interest rate at which we borrow funds. In periods of rising interest rates and when we have borrowed capital with floating interest rates, then our interest expense would increase, which could increase our financing costs and reduce our net investment income, especially to the extent we continue to acquire and hold fixed-rate debt investments. As a result, there can be no assurance that a significant change in market interest rates will not have a material adverse effect on our net investment income. Pursuant to the amended terms of our Deutsche Bank Credit Facility as discussed above (see “— Financial Condition, Liquidity and Capital Resources — Credit Facilities”), CCT Funding borrows at a floating base rate of (i) three-month LIBOR plus 1.50% for Tranche B1 Loans ($65.00 million loan balance outstanding), (ii) three-month LIBOR plus 2.325% for Tranche B2 Loans ($100.00 million loan balance outstanding) and (iii) three-month LIBOR plus 2.325% for Tranche D Loans ($99.44 million loan balance outstanding and $0.56 million unused commitment). Pursuant to the terms of our BNP Credit Facility, Paris Funding borrows at a floating base rate of one-month LIBOR plus 1.10% for the credit facility borrowings ($123.00 million loan balance outstanding and $77.00 million unused commitment). Pursuant to the terms of our Senior Secured Credit Facility, we borrow at a rate based on LIBOR plus an applicable spread of 2.50% or on an “alternate base rate” (which is the highest of a prime rate, the federal funds rate plus 0.50%, or one-month LIBOR plus 1.00%) plus an applicable spread of 1.50%, or, with respect to borrowings in non-LIBOR currencies, on a rate applicable to such currency plus an applicable spread of 2.50% ($319.95 million loan balance outstanding and $0.51 million unused commitment). Therefore, if we were to completely draw down the unused Tranche D Loans commitment amount in our Deutsche Bank facility, the maximum commitment amount in our BNP facility and the maximum commitment in our Senior Secured Credit Facility under the same interest election as our current U.S. dollar borrowing, we expect that our weighted average direct interest cost will decrease by approximately 12 bps, as compared to our current weighted average direct interest cost for borrowed funds. We expect that any further expansion of the current revolving credit facilities, or any future credit facilities that we or any subsidiary may enter into, will also be based on a floating base rate. As a result, we are subject to continuous risks relating to changes in market interest rates.
Under the terms of the TRS agreements between Halifax Funding and BNS, Halifax Funding pays interest to BNS at a floating rate based on three-month LIBOR in exchange for the right to receive the economic benefits of a portfolio of TRS reference assets having a maximum aggregate notional amount of $500.00 million.
52
Table of Contents
Assuming that the consolidated schedule of investments as of December 31, 2013 was to remain constant with regards to the Investment Portfolio and no actions were taken to alter the existing interest rate sensitivity or Investment Portfolio allocations, the upper section of the table below presents an estimated and hypothetical increase in interest income due to an immediate and persistent 12-month increase in the base rates associated with our debt investments featuring variable interest rates.
The middle section of the table below also presents sensitivity analysis for a persistent 12-month increase in the base interest rates that apply to our floating rate credit facility and the associated increase in interest expense, as well as the net effect of change in interest rates on the TRS unrealized appreciation (depreciation). For persistent LIBOR increases of less than 150 basis points, the increase in interest expense eclipses the hypothetical increase in interest income associated with our floating rate debt investments; for a persistent LIBOR increase greater than 150 basis points, the hypothetical increase in interest income associated with our floating rate debt investments begins to provide a positive contribution to net interest income, in both cases assuming that the consolidated schedule of investments as of December 31, 2013 was to remain constant with regards to the Investment Portfolio and no actions were taken to alter the existing interest rate sensitivity or Investment Portfolio allocations.
| ($ amounts in millions except per share data) | ||||||||||||||||||||||||
| Par Amount |
Weighted Avg. Floor |
Increases in LIBOR | ||||||||||||||||||||||
| +50 bps | +100 bps | +150 bps | +200 bps | |||||||||||||||||||||
| No base rate floor |
$ | 43.25 | $ | 0.197 | $ | 0.394 | $ | 0.591 | $ | 0.789 | ||||||||||||||
| Base rate floor |
$ | 1,153.94 | 1.1 | % | 0.000 | 1.149 | 6.054 | 11.108 | ||||||||||||||||
|
|
|
|
|
|
|
|
|
|||||||||||||||||
| Increase in Floating Rate Interest Income |
0.197 | 1.543 | 6.645 | 11.897 | ||||||||||||||||||||
|
|
|
|
|
|
|
|
|
|||||||||||||||||
| Base Rate Spread |
||||||||||||||||||||||||
| Deutsche Bank Credit Facility Tranche B1 Loans |
$ | 65.00 | 150 | bps | $ | (0.325 | ) | $ | (0.650 | ) | $ | (0.975 | ) | $ | (1.300 | ) | ||||||||
| Deutsche Bank Credit Facility Tranche B2 Loans |
$ | 100.00 | 232.5 | bps | (0.500 | ) | (1.000 | ) | (1.500 | ) | (2.000 | ) | ||||||||||||
| Deutsche Bank Credit Facility Tranche D Loans |
$ | 99.44 | 232.5 | bps | (0.497 | ) | (0.994 | ) | (1.492 | ) | (1.989 | ) | ||||||||||||
| BNP Credit Facility |
$ | 123.00 | 110 | bps | (0.615 | ) | (1.230 | ) | (1.845 | ) | (2.460 | ) | ||||||||||||
| Senior Secured Credit Facility USD Loan |
$ | 177.55 | 250 | bps | (0.888 | ) | (1.776 | ) | (2.663 | ) | (3.551 | ) | ||||||||||||
| Senior Secured Credit Facility Euro Loan |
$ | 108.68 | 250 | bps | (0.543 | ) | (1.087 | ) | (1.630 | ) | (2.174 | ) | ||||||||||||
| Senior Secured Credit Facility NZD Loan |
$ | 33.72 | 250 | bps | (0.169 | ) | (0.337 | ) | (0.506 | ) | (0.674 | ) | ||||||||||||
|
|
|
|
|
|
|
|
|
|||||||||||||||||
| Increase to Floating Rate Interest Expense |
(3.537 | ) | (7.074 | ) | (10.611 | ) | (14.148 | ) | ||||||||||||||||
|
|
|
|
|
|
|
|
|
|||||||||||||||||
| Change in Floating Rate Net Interest Income, before TRS |
(3.340 | ) | (5.531 | ) | (3.965 | ) | (2.250 | ) | ||||||||||||||||
| Net change in TRS unrealized appreciation (depreciation) (1) |
(0.274 | ) | (0.514 | ) | (0.628 | ) | (0.735 | ) | ||||||||||||||||
|
|
|
|
|
|
|
|
|
|||||||||||||||||
| Overall Change in Floating Rate Net Interest Income, including TRS |
$ | (3.614 | ) | $ | (6.045 | ) | $ | (4.594 | ) | $ | (2.986 | ) | ||||||||||||
|
|
|
|
|
|
|
|
|
|||||||||||||||||
| Change in Floating Rate Net Interest Income Per Share Outstanding as of December 31, 2013 |
$ | (0.03 | ) | $ | (0.04 | ) | $ | (0.03 | ) | $ | (0.02 | ) | ||||||||||||
| (1) | Pursuant to the TRS Agreements, Halifax Funding receives from BNS all collected interest and fees derived from the TRS reference assets and pays to BNS interest at a rate equal to three-month LIBOR+80 bps per annum on the settled notional amount of TRS reference assets. As of December 31, 2013, 64.8% of the TRS reference assets, or approximately $38.25 million measured at par value, featured floating or variable interest rates. At December 31, 2013, 100% of the TRS reference assets with variable interest rates featured minimum base rate floors, or approximately $38.25 million measured at par value, and the weighted average base rate floor for such TRS reference assets was 1.2%. As of December 31, 2013, the total notional amount of the portfolio of TRS reference assets was $59.91 million, and the settled notional amount was $54.83 million. For the purpose of presenting this net interest sensitivity analysis, we have assumed that all TRS reference assets are settled as of December 31, 2013 and that the TRS notional amount would equal $59.91 million upon which the financing payments to BNS are based. |
The interest rate sensitivity analysis presented above does not consider the potential impact of the changes in value of our debt investments and the net asset value of our common stock in the event of sudden increases in interest rates associated with high yield corporate bonds. Approximately 36.6% of our debt Investment Portfolio is invested in fixed interest rate, high yield corporate debt investments. Rising market interest rates will most likely lead to value declines for high yield corporate bonds and a decline in the net asset value of our common stock, while declining market interest rates will most likely lead to an increase in bond values.
As of December 31, 2013, approximately 46.9% of our fixed interest rate debt investments, or approximately $318.63 million measured at fair value have prices that are generally available from third party pricing services, excluding any investments on non-accrual status. We consider these debt investments to be one of the more liquid subsets of our Investment Portfolio since these types of assets are generally broadly syndicated and owned by a wide group of institutional investors and investment funds. Additionally this group of assets is susceptible to revaluation, or changes in bid-ask values, in response to sudden changes in expected rates of return associated with these investments. We have other fixed interest rate investments in the less liquid subset of our Investment Portfolio that are not included in this analysis.
We have computed a duration of approximately 4.6 for this liquid/fixed subset of our total portfolio. This implies that a sudden increase in the market’s expected rate of return of 100 basis points for this subset of our Investment Portfolio may result in a reduction in value of approximately 4.6%, all other financial and market factors assuming to remain unchanged. A 4.6% decrease in the valuation of this Investment Portfolio subset would equate to a decrease of $0.11, or a 1.1% decline in net asset value relative to $10.00 net asset value per share as of December 31, 2013.
53
Table of Contents
Foreign Currency Risk
From time to time, we may make investments that are denominated in a foreign currency through which we may be subject to foreign currency exchange risk. As of December 31, 2013, 16.1% of our portfolio of debt investments, or approximately $309.92 million measured at par value was denominated in foreign currencies, of which 69.9% was denominated in Euros. The remaining foreign currency investments are denominated in British Pound Sterling, New Zealand dollars and Swedish Krona. We may use derivative instruments from time to time, including foreign currency forward contracts, to manage the impact of fluctuations in foreign currency exchange rates. As of December 31, 2013, the net contractual notional balance of our foreign currency forward contracts totaled $139.34 million, all of which related to certain of our foreign currency denominated debt investments. In order to further reduce our exposure to fluctuations in exchange rates, we also have outstanding borrowings in Euros and New Zealand dollars under our Senior Secured Credit Facility. The U.S. dollar equivalent of our Euro and New Zealand dollar borrowings was $108.68 million and $33.72 million, respectively as of December 31, 2013. Fluctuations in exchange rates therefore impact our financial condition and results of operations, as reported in U.S. dollars. During the year ended December 31, 2013, the foreign currency translation adjustment recorded in our consolidated statements of operations was net unrealized depreciation of $1.53 million. Our foreign currency forward contracts had unrealized depreciation of $3.03 million during the year ended December 31, 2013. The unrealized foreign currency losses were primarily as a result of changes in the exchange rates between the Euro and the U.S. dollar and between the New Zealand dollar and the U.S. dollar. We do not isolate that portion of the results of operations resulting from changes in foreign exchange rates on investments from the fluctuations arising from changes in fair values of investments held; therefore the fluctuations related to foreign exchange rate conversion are included with the net realized gain (loss) and unrealized appreciation (depreciation) on investments.
| Item 8. | Financial Statements and Supplementary Data. |
Information required by this Item is included herein beginning on page F-1.
| Item 9. | Changes in and Disagreements With Accountants on Accounting and Financial Disclosure |
None.
| Item 9A. | Controls and Procedures |
Evaluation of Disclosure Controls and Procedures
Pursuant to Rule 13a-15(b) under the Exchange Act, under the supervision and with the participation of our management, including our principal executive officer and principal financial officer, we conducted an evaluation of the effectiveness of our disclosure controls and procedures (as defined under Rule 13a-15(e) under the Exchange Act) as of the end of the period covered by this report. Based upon that evaluation, our management, including our principal executive officer and principal financial officer, concluded that our disclosure controls and procedures are effective as of the end of the period covered by this report.
Management’s Annual Report on Internal Control Over Financial Reporting
Management is responsible for establishing and maintaining adequate internal control over financial reporting (as defined in Rule 13a-15(f) under the Exchange Act). Our internal control over financial reporting is designed to provide reasonable assurance to our management and board of directors regarding the preparation and fair presentation of published financial statements.
Because of its inherent limitations, internal control over financial reporting may not prevent or detect misstatements. Also, projections of any evaluation of effectiveness to future periods are subject to the risk that controls may become inadequate because of changes in conditions, or that the degree of compliance with the policies or procedures may deteriorate.
Based on management’s assessment, we maintained, in all material respects, effective internal control over financial reporting as of December 31, 2013 using the criteria set forth by the Committee of Sponsoring Organizations of the Treadway Commission (COSO) in “Internal Control Integrated Framework (1992)”.
Pursuant to rules established by the SEC, this annual report does not include an attestation report of our independent registered public accounting firm regarding internal control over financial reporting.
54
Table of Contents
Changes in Internal Control over Financial Reporting
During the most recent fiscal quarter, there was no change in our internal controls over financial reporting (as defined under Rule 13a-15(f) under the Exchange Act) that has materially affected, or is reasonably likely to materially affect, our internal controls over financial reporting.
| Item 9B. | Other Information |
Not applicable.
| Item 10. | Directors, Executive Officers and Corporate Governance |
The information required by this Item is incorporated by reference to our 2014 Proxy Statement to be filed with the SEC within 120 days following the end of our company’s fiscal year.
| Item 11. | Executive Compensation |
The information required by this Item is incorporated by reference to our 2014 Proxy Statement to be filed with the SEC within 120 days following the end of our company’s fiscal year.
| Item 12. | Security Ownership of Certain Beneficial Owners and Management and Related Shareholder Matters |
The information required by this Item is incorporated by reference to our 2014 Proxy Statement to be filed with the SEC within 120 days following the end of our company’s fiscal year.
| Item 13. | Certain Relationships and Related Transactions and Director Independence |
The information required by this Item is incorporated by reference to our 2014 Proxy Statement to be filed with the SEC within 120 days following the end of our company’s fiscal year.
| Item 14. | Principal Accountant Fees and Services |
The information required by this Item is incorporated by reference to our 2014 Proxy Statement to be filed with the SEC within 120 days following the end of our company’s fiscal year.
55
Table of Contents
| Item 15. | Exhibits and Financial Statement Schedules |
| a. | The following financial statements are filed as part of this report in Part II, Item 8: | |||
| Page | ||||
| Report of Independent Registered Certified Public Accounting Firm | F-1 | |||
| Consolidated Statements of Assets and Liabilities | F-2 | |||
| Consolidated Statements of Operations | F-3 | |||
| Consolidated Statements of Changes in Net Assets | F-4 | |||
| Consolidated Statements of Cash Flows | F-5 | |||
| Consolidated Schedules of Investments | F-6 | |||
| Notes to Consolidated Financial Statements | F-18 | |||
| b. | No financial statement schedules are being filed because the required information is not applicable or is presented in the consolidated financial statements or notes. | |||
| c. | The following exhibits are filed or incorporated as part of this report. | |||
| 3.1 | Second Amended and Restated Articles of Incorporation of the Registrant. (Incorporated by reference to Exhibit 3.1 to the Company’s Current Report on Form 8-K filed on May 8, 2012.) | |||
| 3.2 | Amended and Restated Bylaws of the Registrant. (Incorporated by reference to Exhibit 2(b) filed with Pre-Effective Amendment No. 3 to the Company’s registration statement on Form N-2 (File No. 333-167730) filed on March 29, 2011.) | |||
| 10.1 | Form of Managing Dealer Agreement by and between the Registrant and CNL Securities Corp. (Incorporated by reference to Exhibit 2(h)(1) filed with Pre-Effective Amendment No. 1 to the Company’s registration statement on Form N-2 (File No. 333-189544) filed on October 16, 2013.) | |||
| 10.2 | Form of Participating Broker Agreement. (Incorporated by reference to Exhibit 2(h)(2) filed with Pre-Effective Amendment No. 1 to the Company’s registration statement on Form N-2 (File No. 333-189544) filed on October 16, 2013.) | |||
| 10.3 | Form of Distribution Reinvestment Plan. (Incorporated by reference to Exhibit 2(e) filed with Pre-Effective Amendment No. 2 to the Company’s registration statement on Form N-2 (File No. 333-167730) filed on February 18, 2011.) | |||
| 10.4 | Form of Intellectual Property License Agreement by and between the Registrant and CNL Intellectual Properties, Inc. (Incorporated by reference to Exhibit 2(k)(3) filed with Pre-Effective Amendment No. 2 to the Company’s registration statement on Form N-2 (File No. 333-167730) filed on February 18, 2011.) | |||
| 10.5 | Administrative Services Agreement by and between the Registrant and CNL Fund Advisors Company. (Incorporated by reference to Exhibit 2(k)(2) filed with Pre-Effective Amendment No. 3 to the Company’s registration statement on Form N-2 (File No. 333-167730) filed on March 29, 2011.) | |||
| 10.6 | Custodian Agreement. (Incorporated by reference to Exhibit 2(j) filed with Pre-Effective Amendment No. 3 to the Company’s registration statement on Form N-2 (File No. 333-167730) filed on March 29, 2011.) | |||
| 10.7 | Investment Advisory Agreement by and between the Registrant and CNL Fund Advisors Company. (Incorporated by reference to Exhibit 2(g)(1) filed with Pre-Effective Amendment No. 3 to the Company’s registration statement on Form N-2 (File No. 333-167730) filed on March 29, 2011.) | |||
| 10.8 | Sub-Advisory Agreement by and among the Registrant, CNL Fund Advisors Company and KKR Asset Management LLC. (Incorporated by reference to Exhibit 2(g)(2) filed with Pre-Effective Amendment No. 3 to the Company’s registration statement on Form N-2 (File No. 333-167730) filed on March 29, 2011.) | |||
| 10.9 | Amended and Restated Escrow Agreement by and among the Registrant, UMB Bank N.A., and CNL Securities Corp. (Incorporated by reference to Exhibit 10.10 to the Company’s Quarterly Report on Form 10-Q filed on August 12, 2011.) | |||
| 10.10 | Limited Liability Company Agreement of CCT Funding LLC. (Incorporated by reference to Exhibit 10.13 to the Company’s Quarterly Report on Form 10-Q filed on November 10, 2011.) | |||
56
Table of Contents
| 10.11 | Credit Agreement between CCT Funding LLC and Deutsche Bank AG, New York Branch. (Incorporated by reference to Exhibit 10.14 to the Company’s Quarterly Report on Form 10-Q filed on November 10, 2011.) (Confidential portions of this exhibit have been omitted pursuant to a request for confidential treatment and filed separately with the SEC.) | |||
| 10.12 | Custodial Agreement among the Registrant, CCT Funding LLC, Deutsche Bank AG, New York Branch and Deutsche Bank Trust Company Americas. (Incorporated by reference to Exhibit 10.15 to the Company’s Quarterly Report on Form 10-Q filed on November 10, 2011.) (Confidential portions of this exhibit have been omitted pursuant to a request for confidential treatment and filed separately with the SEC.) | |||
| 10.13 | Asset Contribution Agreement between the Registrant and CCT Funding LLC. (Incorporated by reference to Exhibit 10.16 to the Company’s Quarterly Report on Form 10-Q filed on November 10, 2011.) | |||
| 10.14 | Security Agreement between CCT Funding LLC and Deutsche Bank AG, New York Branch. (Incorporated by reference to Exhibit 10.17 to the Company’s Quarterly Report on Form 10-Q filed on November 10, 2011.) | |||
| 10.15 | Investment Management Agreement between the Registrant and CCT Funding LLC. (Incorporated by reference to Exhibit 10.18 to the Company’s Quarterly Report on Form 10-Q filed on November 10, 2011.) | |||
| 10.16 | First Amendment to Credit Agreement between CCT Funding LLC and Deutsche Bank AG, New York Branch. (Incorporated by reference to Exhibit 10.17 to the Company’s Annual Report on Form 10-K filed on March 16, 2012.) (Confidential portions of this exhibit have been omitted pursuant to a request for confidential treatment and filed separately with the SEC.) | |||
| 10.17 | Amended and Restated Expense Support and Conditional Reimbursement Agreement by and among the Registrant, CNL Fund Advisors Company and KKR Asset Management LLC. (Incorporated by reference to Exhibit 10.18 to the Company’s Annual Report on Form 10-K filed on March 16, 2012.) | |||
| 10.18 | Amendment No. 1 to Investment Advisory Agreement by and between the Registrant and CNL Fund Advisors Company. (Incorporated by reference to Exhibit 10.19 to the Company’s Annual Report on Form 10-K filed on March 16, 2012.) | |||
| 10.19 | Second Amendment to Credit Agreement between CCT Funding LLC and Deutsche Bank AG, New York Branch. (Incorporated by reference to Exhibit 10.1 to the Company’s Current Report on Form 8-K filed on August 24, 2012.) (Confidential portions of this exhibit have been omitted pursuant to a request for confidential treatment and filed separately with the SEC.) | |||
| 10.20 | ISDA 2002 Master Agreement, together with the Schedule thereto and Credit Support Annex to such Schedule, each dated as of November 15, 2012, by and between Halifax Funding LLC and The Bank of Nova Scotia. (Incorporated by reference to Exhibit 10.1 to the Company’s Current Report on Form 8-K filed on November 21, 2012.) | |||
| 10.21 | Confirmation Letter Agreement, dated as of November 15, 2012, by and between Halifax Funding LLC and The Bank of Nova Scotia. (Incorporated by reference to Exhibit 10.2 to the Company’s Current Report on Form 8-K filed on November 21, 2012.) | |||
| 10.22 | Amendment to Amended and Restated Expense Support and Conditional Reimbursement Agreement by and among the Registrant, CNL Fund Advisors Company and KKR Asset Management LLC. (Incorporated by reference to Exhibit 10.1 to the Company’s Current Report on Form 8-K filed on January 7, 2013.) | |||
| 10.23 | Third Amendment to Credit Agreement between CCT Funding LLC, the lenders referred to therein and Deutsche Bank AG, New York Branch. (Incorporated by reference to Exhibit 10.1 to the Company’s Current Report on Form 8-K filed on February 14, 2013.) (Confidential portions of this exhibit have been omitted pursuant to a request for confidential treatment and filed separately with the SEC.) | |||
| 10.24 | U.S. PB Agreement, dated as of June 4, 2013, by and between the Registrant and BNP Paribas Prime Brokerage, Inc. (Incorporated by reference to Exhibit 10.2 to the Company’s Current Report on Form 8-K filed on June 18, 2013.) | |||
57
Table of Contents
| 10.25 | Special Custody and Pledge Agreement, dated as of June 4, 2013, by and between the Registrant, BNP Paribas Prime Brokerage, Inc. and State Street Bank and Trust Company. (Incorporated by reference to Exhibit 10.3 to the Company’s Current Report on Form 8-K filed on June 18, 2013.) | |||
| 10.26 | Control Agreement, dated as of July 22, 2013, by and among Halifax Funding LLC, The Bank of Nova Scotia, and State Street Bank and Trust Company (Incorporated by reference to Exhibit 10.1 to the Company’s Current Report on Form 8-K filed on July 26, 2013.) | |||
| 10.27 | Amending Agreement, dated as of July 22, 2013, by and among the Registrant, Halifax Funding LLC, The Bank of Nova Scotia, and The Bank of Nova Scotia Trust Company of New York (Incorporated by reference to Exhibit 10.2 to the Company’s Current Report on Form 8-K filed on July 26, 2013.) | |||
| 10.28 | Amended and Restated Committed Facility Agreement, dated as of August 29, 2013, by and between Paris Funding LLC and BNP Paribas Prime Brokerage, Inc. (Incorporated by reference to Exhibit 10.1 to the Company’s Current Report on Form 8-K filed on September 5, 2013.) | |||
| 10.29 | Senior Secured Revolving Credit Agreement, dated as of September 4, 2013, among the Registrant, as borrower, the lenders from time to time party thereto, JPMorgan Chase Bank, N.A., as administrative agent, and ING Capital LLC as syndication agent (Incorporated by reference to Exhibit 10.1 to the Company’s Current Report on Form 8-K filed on September 10, 2013.) | |||
| 10.30 | Guarantee and Security Agreement, dated as of September 4, 2013, and entered into among the Registrant, as borrower, and JPMorgan Chase Bank, N.A., as administrative agent and as collateral agent, and the other parties thereto (Incorporated by reference to Exhibit 10.1 to the Company’s Current Report on Form 8-K filed on September 10, 2013.) | |||
| 10.31 | Control Agreement, dated as of September 4, 2013, among the Registrant, as borrower, JPMorgan Chase Bank, N.A., as collateral agent, and State Street Bank and Trust Company, as custodian (Incorporated by reference to Exhibit 10.1 to the Company’s Current Report on Form 8-K filed on September 10, 2013.) | |||
| 10.32 | Amending Agreement, dated as of November 12, 2013, by and between Halifax Funding LLC and The Bank of Nova Scotia. (Incorporated by reference to Exhibit 10.32 to the Company’s Quarterly Report on Form 10-Q filed on November 14, 2013.) | |||
| 10.33 | Fourth Amendment to Credit Agreement between CCT Funding LLC, the lenders referred to therein and Deutsche Bank AG, New York Branch. (Incorporated by reference to Exhibit 10.26 to the Company’s Current Report on Form 8-K filed on January 31, 2014.) (Confidential portions of this exhibit have been omitted pursuant to a request for confidential treatment and filed separately with the SEC.) | |||
| 10.34 | Selected Dealer Agreement among the Registrant, CNL Securities Corp., CNL Fund Advisors Company, CNL Financial Group, LLC, KKR Asset Management LLC and Ameriprise Financial Services, Inc. (Confidential portions of this exhibit have been omitted pursuant to a request for confidential treatment and filed separately with the SEC.) (Filed herewith.) | |||
| 14.1 | Amended and Restated Code of Ethics of the Registrant (Incorporated by reference to Exhibit 14.1 to the Company’s Annual Report on Form 10-K filed on March 16, 2012.) | |||
| 31.1 | Certification of Chief Executive Officer of Corporate Capital Trust, Inc., Pursuant to Rule 13a-14(a), as Adopted Pursuant to Section 302 of the Sarbanes-Oxley Act of 2002. (Filed herewith.) | |||
| 31.2 | Certification of Chief Financial Officer of Corporate Capital Trust, Inc., Pursuant to Rule 13a-14(a), as Adopted Pursuant to Section 302 of the Sarbanes-Oxley Act of 2002. (Filed herewith.) | |||
| 32.1 | Certification of Chief Executive Officer and Chief Financial Officer of Corporate Capital Trust, Inc., Pursuant to 18 U.S.C. Section 1350, as Adopted Pursuant to Section 906 of the Sarbanes-Oxley Act of 2002. (Filed herewith.) | |||
58
Table of Contents
Pursuant to the requirements of Section 13 or 15(d) of the Securities Exchange Act of 1934, the registrant has duly caused this report to be signed on its behalf by the undersigned, thereunto duly authorized, on the 18th day of March 2014.
| CORPORATE CAPITAL TRUST, INC. | ||
| By: | /s/ Andrew A. Hyltin | |
| ANDREW A. HYLTIN | ||
| Chief Executive Officer | ||
| (Principal Executive Officer) | ||
| By: | /s/ Paul S. Saint-Pierre | |
| PAUL S. SAINT-PIERRE | ||
| Chief Financial Officer | ||
| (Principal Financial Officer) | ||
Pursuant to the requirements of the Securities Exchange Act of 1934, this report has been signed below by the following persons on behalf of the Registrant and in the capacities and on the dates indicated.
| Signature |
Title |
Date | ||
| /s/ Thomas K. Sittema Thomas K. Sittema |
Director and Chairman of the Board | March 18, 2014 | ||
| /s/ Erik A. Falk Erik A. Falk |
Director | March 18, 2014 | ||
| /s/ Frederick Arnold Frederick Arnold |
Independent Director | March 18, 2014 | ||
| /s/ James H. Kropp James H. Kropp |
Independent Director | March 18, 2014 | ||
| /s/ Kenneth C. Wright Kenneth C. Wright |
Independent Director | March 18, 2014 | ||
| /s/ Andrew A. Hyltin Andrew A. Hyltin |
Chief Executive Officer (Principal Executive Officer) |
March 18, 2014 | ||
| /s/ Paul S. Saint-Pierre Paul S. Saint-Pierre |
Chief Financial Officer (Principal Financial Officer) |
March 18, 2014 | ||
59
Table of Contents
REPORT OF INDEPENDENT REGISTERED PUBLIC ACCOUNTING FIRM
To the Board of Directors and Shareholders of
Corporate Capital Trust, Inc.:
Orlando, Florida
We have audited the accompanying consolidated statements of assets and liabilities of Corporate Capital Trust, Inc. and subsidiaries (the “Company”), including the consolidated schedules of investments, as of December 31, 2013 and 2012, and the related consolidated statements of operations, changes in net assets, and cash flows for each of the three years in the period ended December 31, 2013 and the consolidated financial highlights for the years ended December 31, 2013 and 2012 and the period from June 17, 2011 (commencement of operations) to December 31, 2011. These financial statements and financial highlights are the responsibility of the Company’s management. Our responsibility is to express an opinion on these financial statements and financial highlights based on our audits.
We conducted our audits in accordance with the standards of the Public Company Accounting Oversight Board (United States). Those standards require that we plan and perform the audit to obtain reasonable assurance about whether the financial statements and financial highlights are free of material misstatement. The Company is not required to have, nor were we engaged to perform, an audit of its internal control over financial reporting. Our audits included consideration of internal control over financial reporting as a basis for designing audit procedures that are appropriate in the circumstances, but not for the purpose of expressing an opinion on the effectiveness of the Company’s internal control over financial reporting. Accordingly, we express no such opinion. An audit also includes examining, on a test basis, evidence supporting the amounts and disclosures in the financial statements, assessing the accounting principles used and significant estimates made by management, as well as evaluating the overall financial statement presentation. Our procedures included confirmation of securities owned as of December 31, 2013 and 2012, by correspondence with the custodians, or loan agents; where replies were not received we performed other auditing procedures. We believe that our audits provide a reasonable basis for our opinion.
In our opinion, such consolidated financial statements and consolidated financial highlights referred to above present fairly, in all material respects, the financial position of Corporate Capital Trust, Inc. and subsidiaries as of December 31, 2013 and 2012, and the results of their operations, changes in their net assets, and their cash flows for each of the three years in the period ended December 31, 2013 and the financial highlights for the years ended December 31, 2013 and 2012 and the period from June 17, 2011 (commencement of operations) to December 31, 2011, in conformity with accounting principles generally accepted in the United States of America.
/s/ Deloitte & Touche
San Francisco, CA
March 20, 2014
F-1
Table of Contents
Corporate Capital Trust, Inc. and Subsidiaries
Consolidated Statements of Assets and Liabilities
(in thousands, except share and per share amounts)
| December 31, 2013 | December 31, 2012 | |||||||
| Assets |
||||||||
| Investments, at fair value (amortized cost of $2,037,504 and $704,630) - including $244,981 and $- of investments pledged to creditors (Note 11) |
$ | 2,074,772 | $ | 710,871 | ||||
| Cash |
85,987 | 306 | ||||||
| Cash denominated in foreign currency (cost $218 and $-, respectively) |
218 | — | ||||||
| Collateral on deposit with custodian |
37,501 | 87,974 | ||||||
| Dividends and interest receivable |
25,613 | 9,258 | ||||||
| Receivable for investments sold |
46,469 | 37,704 | ||||||
| Principal receivable |
795 | 463 | ||||||
| Unrealized appreciation on derivative instruments |
1,861 | 1,358 | ||||||
| Deferred offering expense |
3,394 | 2,146 | ||||||
| Prepaid and deferred expenses |
4,576 | 244 | ||||||
|
|
|
|
|
|||||
| Total assets |
2,281,186 | 850,324 | ||||||
|
|
|
|
|
|||||
| Liabilities |
||||||||
| Revolving credit facilities |
$ | 707,389 | $ | 159,620 | ||||
| Payable for investments purchased |
101,014 | 72,435 | ||||||
| Accrued performance-based incentive fees |
16,412 | 2,087 | ||||||
| Shareholders’ distributions payable |
14,923 | — | ||||||
| Accrued investment advisory fees |
3,825 | 1,434 | ||||||
| Unrealized depreciation on derivative instruments |
3,181 | 156 | ||||||
| Accrued reimbursement of expense support |
1,136 | 1,830 | ||||||
| Accrued directors’ fees |
74 | 10 | ||||||
| Other accrued expenses and liabilities |
2,798 | 1,268 | ||||||
|
|
|
|
|
|||||
| Total liabilities |
850,752 | 238,840 | ||||||
|
|
|
|
|
|||||
| Net Assets |
||||||||
| Common stock, $0.001 par value per share, 1,000,000,000 shares authorized, 143,024,102 and 62,728,439 shares issued and outstanding at December 31, 2013 and December 31, 2012, respectively |
143 | 63 | ||||||
| Paid-in capital in excess of par value |
1,401,767 | 607,351 | ||||||
| Distributions in excess of net investment income |
(5,896 | ) | (3,375 | ) | ||||
| Accumulated net unrealized appreciation on investments, derivative instruments and foreign currency translation |
34,420 | 7,445 | ||||||
|
|
|
|
|
|||||
| Net assets |
$ | 1,430,434 | $ | 611,484 | ||||
|
|
|
|
|
|||||
| Net asset value per share |
$ | 10.00 | $ | 9.75 | ||||
|
|
|
|
|
|||||
See notes to consolidated financial statements.
F-2
Table of Contents
Corporate Capital Trust, Inc. and Subsidiaries
Consolidated Statements of Operations
(in thousands, except share and per share amounts)
| Year ended December 31, | ||||||||||||
| 2013 | 2012 | 2011 | ||||||||||
| Investment income |
||||||||||||
| Interest income |
$ | 105,571 | $ | 34,210 | $ | 956 | ||||||
| Fee income |
13,803 | 1,270 | — | |||||||||
| Dividend income |
199 | 103 | 3 | |||||||||
|
|
|
|
|
|
|
|||||||
| Total investment income |
119,573 | 35,583 | 959 | |||||||||
|
|
|
|
|
|
|
|||||||
| Operating expenses |
||||||||||||
| Investment advisory fees |
30,089 | 9,193 | 347 | |||||||||
| Performance-based incentive fees |
16,033 | 1,981 | 283 | |||||||||
| Interest expense |
9,285 | 2,874 | 86 | |||||||||
| Offering expense |
6,502 | 1,209 | — | |||||||||
| Administrative services |
2,049 | 1,061 | 184 | |||||||||
| Professional services |
1,432 | 1,092 | 233 | |||||||||
| Organization expenses |
— | 896 | — | |||||||||
| Custodian and accounting fees |
561 | 202 | 115 | |||||||||
| Director fees and expenses |
374 | 181 | 82 | |||||||||
| Other |
2,177 | 962 | 152 | |||||||||
|
|
|
|
|
|
|
|||||||
| Total operating expenses |
68,502 | 19,651 | 1,482 | |||||||||
| Reimbursement of expense support |
1,136 | 1,830 | — | |||||||||
| Expense support |
— | (1,590 | ) | (1,376 | ) | |||||||
|
|
|
|
|
|
|
|||||||
| Net expenses |
69,638 | 19,891 | 106 | |||||||||
|
|
|
|
|
|
|
|||||||
| Net investment income |
49,935 | 15,692 | 853 | |||||||||
|
|
|
|
|
|
|
|||||||
| Realized and unrealized gain (loss): |
||||||||||||
| Net realized gain on investments |
20,042 | 3,479 | 5 | |||||||||
| Net realized gain (loss) on derivative instruments |
9,135 | (433 | ) | — | ||||||||
| Net realized gain (loss) on foreign currency transactions |
(1,130 | ) | (6 | ) | — | |||||||
| Net change in unrealized appreciation/depreciation on investments |
31,027 | 5,763 | 479 | |||||||||
| Net change in unrealized appreciation/depreciation on derivative instruments |
(2,522 | ) | 1,202 | — | ||||||||
| Net change in unrealized appreciation/depreciation on foreign currency translation |
(1,530 | ) | (43 | ) | 45 | |||||||
|
|
|
|
|
|
|
|||||||
| Net realized and unrealized gain |
55,022 | 9,962 | 529 | |||||||||
|
|
|
|
|
|
|
|||||||
| Net increase in net assets resulting from operations |
$ | 104,957 | $ | 25,654 | $ | 1,382 | ||||||
|
|
|
|
|
|
|
|||||||
| Net Investment Income Per Share |
$ | 0.48 | $ | 0.50 | $ | 0.67 | ||||||
|
|
|
|
|
|
|
|||||||
| Diluted and Basic Earnings Per Share |
$ | 1.00 | $ | 0.82 | $ | 1.09 | ||||||
|
|
|
|
|
|
|
|||||||
| Weighted Average Shares Outstanding |
104,505,667 | 31,394,766 | 1,269,117 | |||||||||
|
|
|
|
|
|
|
|||||||
See notes to consolidated financial statements.
F-3
Table of Contents
Corporate Capital Trust, Inc. and Subsidiaries
Consolidated Statements of Changes in Net Assets
(in thousands, except share amounts)
| Year Ended December 31, | ||||||||||||
| 2013 | 2012 | 2011 | ||||||||||
| Operations |
||||||||||||
| Net investment income |
$ | 49,935 | $ | 15,692 | $ | 853 | ||||||
| Net realized gain on investments, derivative instruments and foreign currency transactions |
28,047 | 3,040 | 5 | |||||||||
| Net change in unrealized appreciation on investments, derivative instruments and foreign currency translation |
26,975 | 6,922 | 524 | |||||||||
|
|
|
|
|
|
|
|||||||
| Net increase in net assets resulting from operations |
104,957 | 25,654 | 1,382 | |||||||||
|
|
|
|
|
|
|
|||||||
| Distributions to shareholders from |
||||||||||||
| Net investment income |
(49,935 | ) | (15,698 | ) | (853 | ) | ||||||
| Realized gains |
(28,047 | ) | (3,040 | ) | (3 | ) | ||||||
| Distributions in excess of net investment income (Note 8) |
(9,023 | ) | (4,584 | ) | — | |||||||
|
|
|
|
|
|
|
|||||||
| Net decrease in net assets resulting from shareholders distributions |
(87,005 | ) | (23,322 | ) | (856 | ) | ||||||
|
|
|
|
|
|
|
|||||||
| Capital share transactions |
||||||||||||
| Issuance of shares of common stock |
770,595 | 532,863 | 64,171 | |||||||||
| Reinvestment of shareholders distributions |
36,605 | 11,832 | 266 | |||||||||
| Repurchase of shares of common stock |
(6,202 | ) | (706 | ) | — | |||||||
|
|
|
|
|
|
|
|||||||
| Net increase in net assets resulting from capital share transactions |
800,998 | 543,989 | 64,437 | |||||||||
|
|
|
|
|
|
|
|||||||
| Total increase in net assets |
818,950 | 546,321 | 64,963 | |||||||||
| Net assets at beginning of year |
611,484 | 65,163 | 200 | |||||||||
|
|
|
|
|
|
|
|||||||
| Net assets at end of year |
$ | 1,430,434 | $ | 611,484 | $ | 65,163 | ||||||
|
|
|
|
|
|
|
|||||||
| Capital share activity |
||||||||||||
| Shares issued from subscriptions |
77,259,720 | 54,520,455 | 7,021,920 | |||||||||
| Shares issued from reinvestment of distributions |
3,664,801 | 1,207,704 | 29,024 | |||||||||
| Shares repurchased |
(628,858 | ) | (72,886 | ) | — | |||||||
|
|
|
|
|
|
|
|||||||
| Net increase in shares outstanding |
80,295,663 | 55,655,273 | 7,050,944 | |||||||||
|
|
|
|
|
|
|
|||||||
| Undistributed (distributions in excess of) net investment income at end of year |
$ | (5,896 | ) | $ | (3,375 | ) | $ | 6 | ||||
|
|
|
|
|
|
|
|||||||
| Dividends Declared Per Share |
$ | 0.83 | $ | 0.76 | $ | 0.37 | ||||||
|
|
|
|
|
|
|
|||||||
See notes to consolidated financial statements.
F-4
Table of Contents
Corporate Capital Trust, Inc. and Subsidiaries
Consolidated Statements of Cash Flows
(in thousands)
| Year Ended December 31, | ||||||||||||
| 2013 | 2012 | 2011 | ||||||||||
| Operating Activities: |
||||||||||||
| Net increase in net assets resulting from operations |
$ | 104,957 | $ | 25,654 | $ | 1,382 | ||||||
| Adjustments to reconcile net increase in net assets resulting from operations to net cash used in operating activities: |
||||||||||||
| Purchases of investments |
(2,090,370 | ) | (991,952 | ) | (106,811 | ) | ||||||
| Increase in payable for investments purchased |
28,618 | 47,660 | 24,759 | |||||||||
| Paid-in-kind interest |
(9,318 | ) | (270 | ) | — | |||||||
| Proceeds from sales of investments |
807,216 | 358,598 | 481 | |||||||||
| Proceeds from principal payments |
117,879 | 51,932 | 295 | |||||||||
| Net realized gain on investments |
(20,042 | ) | (3,479 | ) | (5 | ) | ||||||
| Net change in unrealized appreciation on investments |
(31,027 | ) | (5,763 | ) | (479 | ) | ||||||
| Net change in unrealized (appreciation) depreciation on derivative instruments |
2,522 | (1,202 | ) | — | ||||||||
| Net change in unrealized (appreciation) depreciation on foreign currency translation |
1,530 | 43 | (45 | ) | ||||||||
| Amortization of premium/discount - net |
(1,539 | ) | (145 | ) | 45 | |||||||
| Amortization of deferred financing cost |
1,178 | 152 | — | |||||||||
| Increase in short-term investments, net |
(136,700 | ) | (5,488 | ) | (7,715 | ) | ||||||
| Decrease (increase) in collateral on deposit with custodian |
50,473 | (87,974 | ) | — | ||||||||
| Increase in dividend and interest receivable |
(16,331 | ) | (8,185 | ) | (1,056 | ) | ||||||
| Increase in receivable for investments sold |
(8,749 | ) | (37,704 | ) | — | |||||||
| Increase in principal receivable |
(332 | ) | (403 | ) | (59 | ) | ||||||
| Decrease (increase) in receivable from advisors |
— | 565 | (565 | ) | ||||||||
| Increase in other assets |
(1,307 | ) | (2,155 | ) | (110 | ) | ||||||
| Increase in accrued investment advisory fees |
2,391 | 1,274 | 161 | |||||||||
| Increase in accrued performance-based incentive fees |
14,325 | 1,805 | 283 | |||||||||
| Increase in accrued directors’ fees |
64 | 10 | — | |||||||||
| Increase in other accrued expenses and liabilities |
771 | 2,933 | 152 | |||||||||
|
|
|
|
|
|
|
|||||||
| Net cash used in operating activities |
(1,183,791 | ) | (654,094 | ) | (89,287 | ) | ||||||
|
|
|
|
|
|
|
|||||||
| Financing Activities: |
||||||||||||
| Proceeds from issuance of shares of common stock |
770,595 | 532,863 | 64,171 | |||||||||
| Payment on repurchase of shares of common stock |
(6,202 | ) | (706 | ) | — | |||||||
| Distributions paid |
(35,477 | ) | (11,888 | ) | (191 | ) | ||||||
| Borrowings under credit facilities |
710,560 | 189,000 | 25,340 | |||||||||
| Repayments of credit facility |
(164,400 | ) | (54,720 | ) | — | |||||||
| Deferred financing costs paid |
(5,386 | ) | (149 | ) | (233 | ) | ||||||
|
|
|
|
|
|
|
|||||||
| Net cash provided by financing activities |
1,269,690 | 654,400 | 89,087 | |||||||||
|
|
|
|
|
|
|
|||||||
| Net increase (decrease) in cash |
85,899 | 306 | (200 | ) | ||||||||
| Cash and cash denominated in foreign currency, beginning of period |
306 | — | 200 | |||||||||
|
|
|
|
|
|
|
|||||||
| Cash and cash denominated in foreign currency, end of period |
$ | 86,205 | $ | 306 | $ | — | ||||||
|
|
|
|
|
|
|
|||||||
| Supplemental disclosure of cash flow information and non-cash financing activities: |
||||||||||||
| Cash paid for interest |
$ | 7,450 | $ | 2,482 | $ | 28 | ||||||
|
|
|
|
|
|
|
|||||||
| Distributions reinvested |
$ | 36,605 | $ | 11,832 | $ | 266 | ||||||
|
|
|
|
|
|
|
|||||||
| Deferred financing costs accrued in other accrued expenses and liabilities |
$ | 65 | $ | — | $ | — | ||||||
|
|
|
|
|
|
|
|||||||
| Distributions payable |
$ | 14,923 | $ | — | $ | 399 | ||||||
|
|
|
|
|
|
|
|||||||
See notes to consolidated financial statements.
F-5
Table of Contents
Corporate Capital Trust, Inc. and Subsidiaries
Consolidated Schedule of Investments
As of December 31, 2013
(in thousands, except share amounts)
| Company (a) | Industry | Investments | Interest Rate |
EURIBOR/ LIBOR Floor |
Maturity Date |
No. Shares/ Principal Amount (b) |
Cost (c) | Fair Value | % of Net Assets |
|||||||||||||||||||||||||||||
| Non-Control/Non-Affiliate Investments(d)—134.6% |
|
|||||||||||||||||||||||||||||||||||||
| Algeco/Scotsman (LU)(e) | Consumer Durables & Apparel | Senior Debt(f) Subordinated Debt(f)(g)(h) |
|
15.75% PIK 10.75% |
|
|
5/1/2018 10/15/2019 |
|
$ |
26,464 179 |
|
$ | |
26,243 181 |
|
$ | |
27,787 189 |
|
|
1.9% 0.0% |
| ||||||||||||||||
|
|
|
|
|
|
|
|||||||||||||||||||||||||||||||||
| 26,424 | 27,976 | 1.9% | ||||||||||||||||||||||||||||||||||||
|
|
||||||||||||||||||||||||||||||||||||||
| Allen Systems Group, Inc. | Software & Services | Senior Debt(g)(h) | 10.50% | 11/15/2016 | 106 | 73 | 57 | 0.0% | ||||||||||||||||||||||||||||||
|
|
||||||||||||||||||||||||||||||||||||||
| American Casino & Entertainment Properties, LLC | Consumer Services | Senior Debt | L + 1000 | 1.25% | 1/3/2020 | 1,832 | 1,897 | 1,915 | 0.1% | |||||||||||||||||||||||||||||
|
|
||||||||||||||||||||||||||||||||||||||
| American Rock Salt Co., LLC | Materials | Senior Debt(g)(h) | 8.25% | 5/1/2018 | 9,690 | 9,051 | 9,763 | 0.7% | ||||||||||||||||||||||||||||||
|
|
||||||||||||||||||||||||||||||||||||||
| Angelica Corp. | Health Care Equipment & Services | Senior Debt(j) | L + 875 | 1.25% | 7/15/2019 | 50,869 | 50,869 | 50,512 | 3.5% | |||||||||||||||||||||||||||||
|
|
||||||||||||||||||||||||||||||||||||||
| Applied Systems, Inc. | Software & Services | Senior Debt(i) | L + 725 | 1.00% | 6/8/2017 | 5,895 | 5,969 | 5,932 | 0.4% | |||||||||||||||||||||||||||||
|
|
||||||||||||||||||||||||||||||||||||||
| Artesyn Technologies, Inc. | Technology Hardware & Equipment | Senior Debt(f)(g) | 9.75% | 10/15/2020 | 3,567 | 3,567 | 3,745 | 0.3% | ||||||||||||||||||||||||||||||
|
|
||||||||||||||||||||||||||||||||||||||
| Arysta Lifescience SPC, LLC | Food, Beverage & Tobacco | Senior Debt(f)(i) | L + 700 | 1.25% | 11/30/2020 | 16,305 | 16,150 | 16,606 | 1.2% | |||||||||||||||||||||||||||||
|
|
||||||||||||||||||||||||||||||||||||||
| Aspen Dental Management, Inc. | Health Care Equipment & Services | Senior Debt(i) | L + 550 | 1.50% | 10/6/2016 | 6,053 | 6,005 | 6,008 | 0.4% | |||||||||||||||||||||||||||||
|
|
||||||||||||||||||||||||||||||||||||||
| Avaya, Inc. | Technology Hardware & Equipment | Senior Debt(i) | L + 675 | 1.25% | 3/31/2018 | 33,909 | 33,105 | 34,468 | 2.4% | |||||||||||||||||||||||||||||
| Senior Debt(g)(i) | 7.00% | 4/1/2019 | 3,722 | 3,436 | 3,648 | 0.3% | ||||||||||||||||||||||||||||||||
| Senior Debt(g) | 9.00% | 4/1/2019 | 7,048 | 7,035 | 7,365 | 0.5% | ||||||||||||||||||||||||||||||||
|
|
|
|
|
|
|
|||||||||||||||||||||||||||||||||
| 43,576 | 45,481 | 3.2% | ||||||||||||||||||||||||||||||||||||
|
|
||||||||||||||||||||||||||||||||||||||
| Bluestem Brands, Inc. | Consumer Durables & Apparel | Senior Debt(i)(k) | L + 650 | 1.00% | 12/6/2018 | 57,731 | 55,422 | 57,154 | 4.0% | |||||||||||||||||||||||||||||
|
|
||||||||||||||||||||||||||||||||||||||
| Brake Bros Ltd. (UK)(e) | Food & Staples Retailing | Senior Debt(f)(GBP) | |
L + 325, 3.00% PIK |
|
3/12/2017 | £ |
8,650 |
|
12,049 | 13,661 | 1.0% | ||||||||||||||||||||||||||
|
|
||||||||||||||||||||||||||||||||||||||
| Catalina Marketing Corp. | Media | Senior Debt(i) | L + 425 | 1.00% | 10/12/2020 | $ | 5,215 | 5,273 | 5,295 | 0.4% | ||||||||||||||||||||||||||||
|
|
||||||||||||||||||||||||||||||||||||||
| CDW Corp. | Technology Hardware & Equipment | Subordinated Debt(f) | 12.54% | 10/12/2017 | 1,879 | 1,986 | 1,964 | 0.1% | ||||||||||||||||||||||||||||||
|
|
||||||||||||||||||||||||||||||||||||||
| Cemex Materials, LLC | Materials | Subordinated Debt(g)(h) | 7.70% | 7/21/2025 | 23,312 | 22,941 | 24,128 | 1.7% | ||||||||||||||||||||||||||||||
|
|
||||||||||||||||||||||||||||||||||||||
| Cemex S.A.B. de C.V. (MX)(e) | Materials | Senior Debt(f) | L + 450 | 2/14/2017 | 3,441 | 3,222 | 3,411 | 0.2% | ||||||||||||||||||||||||||||||
|
|
||||||||||||||||||||||||||||||||||||||
| Cengage Learning Acquisitions, Inc. | Media | Senior Debt(i)(l) | L + 550 | 7/5/2017 | $ | 2,701 | $ | 2,036 | $ | 2,119 | 0.2% | |||||||||||||||||||||||||||
| Senior Debt(g)(h)(l) | 11.50% | 4/15/2020 | 12,154 | 12,398 | 9,738 | 0.7% | ||||||||||||||||||||||||||||||||
|
|
|
|
|
|
|
|||||||||||||||||||||||||||||||||
| 14,434 | 11,857 | 0.9% | ||||||||||||||||||||||||||||||||||||
|
|
||||||||||||||||||||||||||||||||||||||
| Cequel Communications Holdings, LLC | Media | Subordinated Debt(g)(h) | 5.13% | 12/15/2021 | 5,000 | 4,834 | 4,688 | 0.3% | ||||||||||||||||||||||||||||||
|
|
||||||||||||||||||||||||||||||||||||||
| Ceridian Corp. | Commercial & Professional Services | Subordinated Debt(h) | 11.00% | 3/15/2021 | 16,201 | 17,574 | 18,672 | 1.3% | ||||||||||||||||||||||||||||||
|
|
||||||||||||||||||||||||||||||||||||||
| CHG Companies, Inc. | Health Care Equipment & Services | Senior Debt(i) | L + 775 | 1.25% | 11/19/2020 | 10,485 | 10,363 | 10,669 | 0.7% | |||||||||||||||||||||||||||||
|
|
||||||||||||||||||||||||||||||||||||||
| Commscope, Inc. | Technology Hardware & Equipment | Subordinated Debt(g)(h) | |
6.63% or 7.38% PIK |
|
6/1/2020 | 5,000 | 4,976 | 5,200 | 0.4% | ||||||||||||||||||||||||||||
|
|
||||||||||||||||||||||||||||||||||||||
| CompuCom Systems, Inc. | Software & Services | Subordinated Debt(g)(h) | 7.00% | 5/1/2021 | 9,847 | 9,566 | 9,773 | 0.7% | ||||||||||||||||||||||||||||||
|
|
||||||||||||||||||||||||||||||||||||||
| Continental Building Products, LLC | Materials | Senior Debt(i) | L + 375 | 1.00% | 8/28/2020 | 9,203 | 9,159 | 9,221 | 0.6% | |||||||||||||||||||||||||||||
| Senior Debt(i)(k) | L + 775 | 1.00% | 2/26/2021 | 19,378 | 19,509 | 19,475 | 1.4% | |||||||||||||||||||||||||||||||
|
|
|
|
|
|
|
|||||||||||||||||||||||||||||||||
| 28,668 | 28,696 | 2.0% | ||||||||||||||||||||||||||||||||||||
|
|
||||||||||||||||||||||||||||||||||||||
| ConvaTec Healthcare E SA (LU)(e) | Health Care Equipment & Services | Subordinated Debt(f)(g)(h) | |
8.25% or 9.00% PIK |
|
1/15/2019 | 2,545 | 2,521 | 2,605 | 0.2% | ||||||||||||||||||||||||||||
|
|
||||||||||||||||||||||||||||||||||||||
| CRC Health Corp. | Health Care Equipment & Services | Subordinated Debt(h) | 10.75% | 2/1/2016 | 6,021 | 6,047 | 6,036 | 0.4% | ||||||||||||||||||||||||||||||
|
|
||||||||||||||||||||||||||||||||||||||
| CSM Bakery Products | Food, Beverage & Tobacco | Senior Debt(f) | L + 750 | 1.00% | 7/3/2021 | 15,175 | 15,322 | 15,336 | 1.1% | |||||||||||||||||||||||||||||
|
|
||||||||||||||||||||||||||||||||||||||
| CTI Foods Holding Co., LLC | Food, Beverage & Tobacco | Senior Debt | L + 725 | 1.00% | 6/28/2021 | 23,219 | 22,884 | 23,451 | 1.6% | |||||||||||||||||||||||||||||
|
|
||||||||||||||||||||||||||||||||||||||
See notes to consolidated financial statements.
F-6
Table of Contents
Corporate Capital Trust, Inc. and Subsidiaries
Consolidated Schedule of Investments (continued)
As of December 31, 2013
(in thousands, except share amounts)
| Company (a) | Industry | Investments | Interest Rate |
EURIBOR/ LIBOR Floor |
Maturity Date |
No. Shares/ Principal Amount (b) |
Cost (c) | Fair Value | % of Net Assets |
|||||||||||||||||||||||||||||
| Data Device Corp. | Capital Goods | Senior Debt(i) | L + 650 | 1.50% | 7/11/2018 | 10,873 | 10,683 | 10,900 | 0.8% | |||||||||||||||||||||||||||||
| Senior Debt | L + 1000 | 1.50% | 7/11/2019 | 8,000 | 7,864 | 7,680 | 0.5% | |||||||||||||||||||||||||||||||
|
|
|
|
|
|
|
|||||||||||||||||||||||||||||||||
| 18,547 | 18,580 | 1.3% | ||||||||||||||||||||||||||||||||||||
|
|
||||||||||||||||||||||||||||||||||||||
| Datatel, Inc. | Software & Services | Subordinated Debt(g)(i) | |
9.63% or 9.63% PIK |
|
12/1/2018 | 9,287 | 9,195 | 9,566 | 0.7% | ||||||||||||||||||||||||||||
|
|
||||||||||||||||||||||||||||||||||||||
| Distribution International, Inc. | Retailing | Senior Debt | L + 650 | 1.00% | 7/16/2019 | 48,387 | 47,932 | 48,174 | 3.4% | |||||||||||||||||||||||||||||
|
|
||||||||||||||||||||||||||||||||||||||
| Easton-Bell Sports, Inc. | Consumer Durables & Apparel | Senior Debt(j) | 11.50% | 12/31/2015 | 24,247 | 24,259 | 24,247 | 1.7% | ||||||||||||||||||||||||||||||
|
|
||||||||||||||||||||||||||||||||||||||
| Education Management, LLC | Consumer Services | Subordinated Debt(f) | 15.00% | 7/1/2018 | 1,299 | 1,307 | 1,409 | 0.1% | ||||||||||||||||||||||||||||||
|
|
||||||||||||||||||||||||||||||||||||||
| Epicor Software Corp. | Software & Services | Subordinated Debt(g)(h) | |
9.00% or 9.75% PIK |
|
6/15/2018 | $ | 39,815 | $ | 39,090 | $ | 41,507 | 2.9% | |||||||||||||||||||||||||
|
|
||||||||||||||||||||||||||||||||||||||
| Excelitas Technologies Corp. | Technology Hardware & Equipment | Common Stock(j)* | 5,636,153 | 5,636 | 5,566 | 0.4% | ||||||||||||||||||||||||||||||||
| Senior Debt(j) | |
L + 975, 1.50% PIK |
|
1.00% | 4/29/2021 | 107,355 | 107,355 | 107,033 | 7.5% | |||||||||||||||||||||||||||||
|
|
|
|
|
|
|
|||||||||||||||||||||||||||||||||
| 112,991 | 112,599 | 7.9% | ||||||||||||||||||||||||||||||||||||
|
|
||||||||||||||||||||||||||||||||||||||
| Eze Software Group | Software & Services | Senior Debt(i) | L + 725 | 1.25% | 4/5/2021 | 12,962 | 12,922 | 13,210 | 0.9% | |||||||||||||||||||||||||||||
|
|
||||||||||||||||||||||||||||||||||||||
| Flagstone Foods Holding Corp. | Food & Staples Retailing | Senior Debt(j) | L + 575 | 1.25% | 4/15/2018 | 20,103 | 19,916 | 20,017 | 1.4% | |||||||||||||||||||||||||||||
|
|
||||||||||||||||||||||||||||||||||||||
| Football Association of Ireland (IE)(e) | Consumer Durables & Apparel | Senior Debt(f)(j)(EUR) | 6.20% | 12/20/2020 | € | 44,390 | 59,588 | 59,843 | 4.2% | |||||||||||||||||||||||||||||
|
|
||||||||||||||||||||||||||||||||||||||
| GCI, Inc. | Telecommunication Services | Subordinated Debt(h) | 8.63% | 11/15/2019 | $ | 8,575 | 9,041 | 9,111 | 0.6% | |||||||||||||||||||||||||||||
| Subordinated Debt(h) | 6.75% | 6/1/2021 | 14,381 | 13,737 | 13,770 | 1.0% | ||||||||||||||||||||||||||||||||
|
|
|
|
|
|
|
|||||||||||||||||||||||||||||||||
| 22,778 | 22,881 | 1.6% | ||||||||||||||||||||||||||||||||||||
|
|
||||||||||||||||||||||||||||||||||||||
| Genesys Telecommunications | Software & Services | Common Stock(j)* | 448,908 | 449 | 672 | 0.1% | ||||||||||||||||||||||||||||||||
| Laboratories, Inc. | Subordinated Debt(j)(EUR) | 12.50% | 1/31/2020 | € | 2,044 | 2,637 | 2,924 | 0.2% | ||||||||||||||||||||||||||||||
|
|
|
|
|
|
|
|||||||||||||||||||||||||||||||||
| 3,086 | 3,596 | 0.3% | ||||||||||||||||||||||||||||||||||||
|
|
||||||||||||||||||||||||||||||||||||||
| GENEX Services, Inc. | Health Care Equipment & Services | Senior Debt(i) | L + 825 | 1.00% | 1/26/2019 | $ | 21,029 | 20,828 | 21,266 | 1.5% | ||||||||||||||||||||||||||||
|
|
||||||||||||||||||||||||||||||||||||||
| Global Closure Systems (FR)(e) | Materials | Common Stock(f)(j)* | 597,989 | 823 | 823 | 0.1% | ||||||||||||||||||||||||||||||||
| Subordinated Debt(f)(j)(EUR) | |
12.00% or 13.00% PIK |
|
11/15/2019 | € |
17,828 |
|
23,443 | 25,140 | 1.8% | ||||||||||||||||||||||||||||
|
|
|
|
|
|
|
|||||||||||||||||||||||||||||||||
| 24,266 | 25,963 | 1.9% | ||||||||||||||||||||||||||||||||||||
|
|
||||||||||||||||||||||||||||||||||||||
| Greenway Medical Technologies | Health Care Equipment & Services | Senior Debt | L + 500 | 1.00% | 11/4/2020 | $ | 20,413 | 20,182 | 20,413 | 1.4% | ||||||||||||||||||||||||||||
| Senior Debt | L + 825 | 1.00% | 11/4/2021 | 26,396 | 25,998 | 26,660 | 1.9% | |||||||||||||||||||||||||||||||
|
|
|
|
|
|
|
|||||||||||||||||||||||||||||||||
| 46,180 | 47,073 | 3.3% | ||||||||||||||||||||||||||||||||||||
|
|
||||||||||||||||||||||||||||||||||||||
| Griffins Foods, Ltd. (NZ)(e) | Food, Beverage & Tobacco | Subordinated Debt(f)(j)(NZD) | 13.75% PIK | 1/31/2019 | N$ | 47,417 | 36,916 | 39,035 | 2.7% | |||||||||||||||||||||||||||||
|
|
||||||||||||||||||||||||||||||||||||||
| Guitar Center, Inc. | Retailing | Senior Debt(i) | L + 600 | 4/9/2017 | $ | 19,523 | $ | 19,111 | $ | 19,096 | 1.3% | |||||||||||||||||||||||||||
|
|
||||||||||||||||||||||||||||||||||||||
| Gymboree Corp. | Retailing | Subordinated Debt(h) | 9.13% | 12/1/2018 | 3,335 | 3,199 | 3,072 | 0.2% | ||||||||||||||||||||||||||||||
|
|
||||||||||||||||||||||||||||||||||||||
| Hilding Anders (SE)(e) | Consumer Durables & Apparel | Equity Options(f)(j)* | 12/31/2020 | 236,160,807 | 14,988 | 15,256 | 1.1% | |||||||||||||||||||||||||||||||
| Subordinated Debt(f)(j)(EUR) | |
12.00% or 13.00% PIK |
|
6/30/2021 | € | 81,478 | 95,634 | 98,974 | 6.9% | |||||||||||||||||||||||||||||
|
|
|
|
|
|
|
|||||||||||||||||||||||||||||||||
| 110,622 | 114,230 | 8.0% | ||||||||||||||||||||||||||||||||||||
|
|
||||||||||||||||||||||||||||||||||||||
| Hot Topic, Inc. | Consumer Durables & Apparel | Subordinated Debt(g)(h) | |
12.00% or 12.75% PIK |
|
5/15/2019 | $ | 8,113 | 7,951 | 8,032 | 0.6% | |||||||||||||||||||||||||||
| Senior Debt(g)(h) | 9.25% | 6/15/2021 | 27,300 | 27,464 | 28,597 | 2.0% | ||||||||||||||||||||||||||||||||
|
|
|
|
|
|
|
|||||||||||||||||||||||||||||||||
| 35,415 | 36,629 | 2.6% | ||||||||||||||||||||||||||||||||||||
|
|
||||||||||||||||||||||||||||||||||||||
| Hudson’s Bay Co. (CA)(e) | Retailing | Senior Debt(f) | L + 725 | 1.00% | 11/4/2021 | 2,933 | 2,904 | 3,039 | 0.2% | |||||||||||||||||||||||||||||
|
|
||||||||||||||||||||||||||||||||||||||
| Internet Brands, Inc. | Media | Senior Debt | L + 500 | 1.25% | 3/18/2019 | 31,792 | 30,254 | 31,991 | 2.2% | |||||||||||||||||||||||||||||
|
|
||||||||||||||||||||||||||||||||||||||
| iPayment, Inc. | Software & Services | Senior Debt(i) | L + 525 | 1.50% | 5/8/2017 | 3,186 | 3,134 | 3,107 | 0.2% | |||||||||||||||||||||||||||||
| Subordinated Debt | 10.25% | 5/15/2018 | 4,634 | 4,289 | 3,800 | 0.3% | ||||||||||||||||||||||||||||||||
|
|
|
|
|
|
|
|||||||||||||||||||||||||||||||||
| 7,423 | 6,907 | 0.5% | ||||||||||||||||||||||||||||||||||||
|
|
||||||||||||||||||||||||||||||||||||||
See notes to consolidated financial statements.
F-7
Table of Contents
Corporate Capital Trust, Inc. and Subsidiaries
Consolidated Schedule of Investments (continued)
As of December 31, 2013
(in thousands, except share amounts)
| Company (a) | Industry | Investments | Interest Rate |
EURIBOR/ LIBOR Floor |
Maturity Date |
No. Shares/ Principal Amount (b) |
Cost (c) | Fair Value | % of Net Assets |
|||||||||||||||||||||||||||||||
| IPC Systems, Inc. | Technology Hardware & Equipment | Senior Debt(i) | L + 650 | 1.25% | 7/31/2017 | 1,487 | 1,455 | 1,492 | 0.1% | |||||||||||||||||||||||||||||||
| Senior Debt(i) | L + 650 | 1.25% | 7/31/2017 | 6,372 | 6,270 | 6,352 | 0.4% | |||||||||||||||||||||||||||||||||
|
|
|
|
|
|
|
|||||||||||||||||||||||||||||||||||
| 7,725 | 7,844 | 0.5% | ||||||||||||||||||||||||||||||||||||||
|
|
||||||||||||||||||||||||||||||||||||||||
| J. Jill | Retailing | Senior Debt(j) | L + 850 | 1.50% | 4/29/2017 | 7,954 | 7,954 | 7,954 | 0.6% | |||||||||||||||||||||||||||||||
|
|
||||||||||||||||||||||||||||||||||||||||
| Jacuzzi Brands, Inc. (LU)(e) | Capital Goods | Senior Debt(j) | L + 650 | 1.25% | 7/3/2019 | 41,938 | 41,151 | 41,854 | 2.9% | |||||||||||||||||||||||||||||||
|
|
||||||||||||||||||||||||||||||||||||||||
| JC Penney Corp., Inc. | Retailing | Subordinated Debt(f) | 5.65% | 6/1/2020 | 11,139 | 8,338 | 8,744 | 0.6% | ||||||||||||||||||||||||||||||||
|
|
||||||||||||||||||||||||||||||||||||||||
| KeyPoint Government Solutions, Inc. | Capital Goods | Senior Debt(j) | L + 600 | 1.25% | 11/13/2017 | 31,383 | 30,871 | 31,383 | 2.2% | |||||||||||||||||||||||||||||||
|
|
||||||||||||||||||||||||||||||||||||||||
| KKR BPT Holdings Aggregator, LLC | Diversified Financials | Structured Products(f)(j)* | 2,500 | 2,500 | 2,500 | 0.2% | ||||||||||||||||||||||||||||||||||
|
|
||||||||||||||||||||||||||||||||||||||||
| Learfield Communications, Inc. | Media | Senior Debt | L + 775 | 1.00% | 10/8/2021 | 4,743 | 4,696 | 4,861 | 0.3% | |||||||||||||||||||||||||||||||
|
|
||||||||||||||||||||||||||||||||||||||||
| Lightower Fiber, LLC | Telecommunication Services | Senior Debt(i) | L + 675 | 1.25% | 4/12/2021 | 3,381 | 3,349 | 3,420 | 0.2% | |||||||||||||||||||||||||||||||
|
|
||||||||||||||||||||||||||||||||||||||||
| Louisiana Public Facilities Authority | Energy | Senior Debt(j) | 11.50% | 1/1/2020 | 50,580 | 49,070 | 49,063 | 3.4% | ||||||||||||||||||||||||||||||||
|
|
||||||||||||||||||||||||||||||||||||||||
| MCS AMS Sub-Holdings, LLC | Commercial & Professional Services | Senior Debt | L + 600 | 1.00% | 10/15/2019 | $ | 50,455 | $ | 48,973 | $ | 48,879 | 3.4% | ||||||||||||||||||||||||||||
|
|
||||||||||||||||||||||||||||||||||||||||
| Misys Ltd. (UK)(e) | Software & Services | Senior Debt(f)(i) | 12.00% | 6/12/2019 | 3,000 | 3,367 | 3,463 | 0.2% | ||||||||||||||||||||||||||||||||
|
|
||||||||||||||||||||||||||||||||||||||||
| Monarch (LU)(e) | Materials | Senior Debt(f)(i) | L + 700 | 1.25% | 4/3/2020 | 5,416 | 5,392 | 5,576 | 0.4% | |||||||||||||||||||||||||||||||
|
|
||||||||||||||||||||||||||||||||||||||||
| New Enterprise Stone & Lime Co., Inc. |
Capital Goods | Senior Debt(h) |
|
5.00%, 8.00% PIK |
|
3/15/2018 | 10,071 | 10,162 | 11,381 | 0.8% | ||||||||||||||||||||||||||||||
|
|
||||||||||||||||||||||||||||||||||||||||
| NewWave Communications, Inc. | Media | Senior Debt | L + 800 | 1.00% | 10/30/2020 | 8,339 | 8,264 | 8,506 | 0.6% | |||||||||||||||||||||||||||||||
|
|
||||||||||||||||||||||||||||||||||||||||
| North American Breweries Holdings, LLC | Food, Beverage & Tobacco | Senior Debt | L + 625 | 1.25% | 12/11/2018 | 4,920 | 4,836 | 4,821 | 0.3% | |||||||||||||||||||||||||||||||
|
|
||||||||||||||||||||||||||||||||||||||||
| OAG Holdings, LLC | Energy | Overriding Royalty Interest(f)(j)* | 2,353,940 | 2,354 | 2,354 | 0.2% | ||||||||||||||||||||||||||||||||||
| Senior Debt(f)(j) |
|
8.00%, 2.00% PIK |
|
12/20/2020 | 20,008 | 17,163 | 17,153 | 1.2% | ||||||||||||||||||||||||||||||||
|
|
|
|
|
|
|
|||||||||||||||||||||||||||||||||||
| 19,517 | 19,507 | 1.4% | ||||||||||||||||||||||||||||||||||||||
|
|
||||||||||||||||||||||||||||||||||||||||
| OpenLink Financial, Inc. | Software & Services | Senior Debt | L + 625 | 1.50% | 10/30/2017 | 46 | 46 | 46 | 0.0% | |||||||||||||||||||||||||||||||
|
|
||||||||||||||||||||||||||||||||||||||||
| P2 Energy Solutions, Inc. | Software & Services | Senior Debt | L + 800 | 1.00% | 4/30/2021 | 9,283 | 9,191 | 9,469 | 0.7% | |||||||||||||||||||||||||||||||
|
|
||||||||||||||||||||||||||||||||||||||||
| Packaging Coordinators, Inc. | Materials | Senior Debt(j) | L + 825 | 1.25% | 10/31/2020 | 11,827 | 11,716 | 11,886 | 0.8% | |||||||||||||||||||||||||||||||
|
|
||||||||||||||||||||||||||||||||||||||||
| Pinnacle Agriculture Holdings, LLC | Materials | Senior Debt(g)(h) | 9.00% | 11/15/2020 | 2,193 | 2,193 | 2,327 | 0.2% | ||||||||||||||||||||||||||||||||
|
|
||||||||||||||||||||||||||||||||||||||||
| Polyconcept Finance BV (NL)(e) | Consumer Durables & Apparel | Senior Debt(f)(j) | L + 875 | 1.25% | 6/28/2020 | 46,727 | 46,727 | 45,886 | 3.2% | |||||||||||||||||||||||||||||||
|
|
||||||||||||||||||||||||||||||||||||||||
| Progressive Solutions | Health Care Equipment & Services | Senior Debt(k) | L + 850 | 1.00% | 10/22/2021 | 19,903 | 19,704 | 20,002 | 1.4% | |||||||||||||||||||||||||||||||
|
|
||||||||||||||||||||||||||||||||||||||||
| RedPrairie Corp. | Software & Services | Senior Debt(i) | L + 1000 | 1.25% | 12/21/2019 | 18,150 | 18,169 | 18,691 | 1.3% | |||||||||||||||||||||||||||||||
|
|
||||||||||||||||||||||||||||||||||||||||
| Ryerson, Inc. | Materials | Senior Debt(i) | 9.00% | 10/15/2017 | 5,814 | 5,814 | 6,163 | 0.4% | ||||||||||||||||||||||||||||||||
|
|
||||||||||||||||||||||||||||||||||||||||
| Sabine Oil & Gas, LLC | Energy | Senior Debt(f)(i) | L + 750 | 1.25% | 12/31/2018 | 14,527 | 14,400 | 14,708 | 1.0% | |||||||||||||||||||||||||||||||
|
|
||||||||||||||||||||||||||||||||||||||||
| Safety Technology Holdings, Inc. | Technology Hardware & Equipment | Senior Debt(j) | L + 825 | 1.25% | 6/2/2020 | 30,402 | 29,651 | 29,642 | 2.1% | |||||||||||||||||||||||||||||||
|
|
||||||||||||||||||||||||||||||||||||||||
| Sedgwick Claims Management Services Holdings, Inc. | Insurance | Senior Debt | L + 700 | 1.00% | 12/15/2018 | 25,735 | 25,615 | 26,217 | 1.8% | |||||||||||||||||||||||||||||||
|
|
||||||||||||||||||||||||||||||||||||||||
| Sheridan Holdings, Inc. | Health Care Equipment & Services | Senior Debt(k) | L + 725 | 1.00% | 12/13/2021 | 13,899 | 13,830 | 14,030 | 1.0% | |||||||||||||||||||||||||||||||
|
|
||||||||||||||||||||||||||||||||||||||||
| Sportsman’s Warehouse, Inc. | Retailing | Senior Debt(j) | L + 600 | 1.25% | 8/20/2019 | $ | 40,211 | $ | 39,830 | $ | 40,593 | 2.8% | ||||||||||||||||||||||||||||
| Senior Debt(j) | L + 1075 | 1.25% | 8/20/2019 | 23,654 | 23,159 | 23,760 | 1.7% | |||||||||||||||||||||||||||||||||
|
|
|
|
|
|
|
|||||||||||||||||||||||||||||||||||
| 62,989 | 64,353 | 4.5% | ||||||||||||||||||||||||||||||||||||||
|
|
||||||||||||||||||||||||||||||||||||||||
| SquareTwo Financial Corp. | Banks | Senior Debt(h) | 11.63% | 4/1/2017 | 6,309 | 6,566 | 6,522 | 0.5% | ||||||||||||||||||||||||||||||||
|
|
||||||||||||||||||||||||||||||||||||||||
| Start CLO Ltd. 2010-6A Class A (KY)(e) | Diversified Financials | Structured Products(f)(g)(j)(m) | L + 1600 | 4/1/2014 | 3,310 | 3,325 | 3,359 | 0.2% | ||||||||||||||||||||||||||||||||
|
|
||||||||||||||||||||||||||||||||||||||||
| StoneRiver Holdings, Inc. | Insurance | Senior Debt | L + 725 | 1.25% | 5/30/2020 | 15,860 | 15,782 | 16,029 | 1.1% | |||||||||||||||||||||||||||||||
|
|
||||||||||||||||||||||||||||||||||||||||
| Summit Materials, LLC | Materials | Subordinated Debt(h) | 10.50% | 1/31/2020 | 462 | 518 | 508 | 0.0% | ||||||||||||||||||||||||||||||||
|
|
||||||||||||||||||||||||||||||||||||||||
| Talbots, Inc. | Retailing | Senior Debt(j) | L + 800 | 1.25% | 8/30/2018 | 50,000 | 50,000 | 50,450 | 3.5% | |||||||||||||||||||||||||||||||
|
|
||||||||||||||||||||||||||||||||||||||||
| The TelX Group, Inc. | Telecommunication Services | Subordinated Debt(g)(j) | |
12.00% or 10.00%, 2.00% PIK |
|
9/26/2019 | 5,517 | 5,952 | 5,848 | 0.4% | ||||||||||||||||||||||||||||||
|
|
||||||||||||||||||||||||||||||||||||||||
See notes to consolidated financial statements.
F-8
Table of Contents
Corporate Capital Trust, Inc. and Subsidiaries
Consolidated Schedule of Investments (continued)
As of December 31, 2013
(in thousands, except share amounts)
| Company (a) | Industry | Investments | Interest Rate |
EURIBOR/ LIBOR Floor |
Maturity Date |
No. Shares/ Principal Amount (b) |
Cost (c) | Fair Value | % of Net Assets |
|||||||||||||||||||||||||||||||
| Towergate Finance PLC (UK)(e) | Insurance | Subordinated Debt(f)(g)(h)(GBP) | 10.50% | 2/15/2019 | £ | 14,608 | 23,366 | 25,436 | 1.8% | |||||||||||||||||||||||||||||||
|
|
||||||||||||||||||||||||||||||||||||||||
| Trade Finance Funding I, Ltd. 2013-1A Class B | Diversified Financials | Structured Products(f)(g)(j) | 10.75% | 11/13/2018 | $ | 28,221 | 28,221 | 28,235 | 2.0% | |||||||||||||||||||||||||||||||
|
|
||||||||||||||||||||||||||||||||||||||||
| Travelport, LLC | Software & Services | Senior Debt(i) | L + 800 | 1.50% | 1/31/2016 | 18,868 | 18,533 | 19,582 | 1.4% | |||||||||||||||||||||||||||||||
| Senior Debt(i) | L + 500 | 1.25% | 6/26/2019 | 5,416 | 5,338 | 5,565 | 0.4% | |||||||||||||||||||||||||||||||||
|
|
|
|
|
|
|
|||||||||||||||||||||||||||||||||||
| 23,871 | 25,147 | 1.8% | ||||||||||||||||||||||||||||||||||||||
|
|
||||||||||||||||||||||||||||||||||||||||
| VSK Holdings, Ltd. (KY)(e) | Diversified Financials | Structured Products(f)(j)* | 620 | 21,474 | 21,481 | 1.5% | ||||||||||||||||||||||||||||||||||
|
|
||||||||||||||||||||||||||||||||||||||||
| Websense, Inc. | Technology Hardware & Equipment | Senior Debt | L + 725 | 1.00% | 12/24/2020 | 32,018 | 31,866 | 32,098 | 2.2% | |||||||||||||||||||||||||||||||
|
|
||||||||||||||||||||||||||||||||||||||||
| Willbros United States Holding, Inc. | Energy | Senior Debt(f) | L + 975 | 1.25% | 8/5/2019 | 33,614 | 32,477 | 34,118 | 2.4% | |||||||||||||||||||||||||||||||
|
|
||||||||||||||||||||||||||||||||||||||||
| Wilton Brands, LLC | Materials | Senior Debt(i) | L + 625 | 1.25% | 8/30/2018 | 8,720 | 8,573 | 8,335 | 0.6% | |||||||||||||||||||||||||||||||
|
|
||||||||||||||||||||||||||||||||||||||||
| Wise Metals Group, LLC | Materials | Senior Debt(g)(h) | 8.75% | 12/15/2018 | 2,148 | 2,148 | 2,261 | 0.2% | ||||||||||||||||||||||||||||||||
|
|
||||||||||||||||||||||||||||||||||||||||
| Xella Holdco Finance SA (LU)(e) | Materials | Senior Debt(f)(g)(h)(EUR) | |
9.13% or 9.88% PIK |
|
9/15/2018 | € | 5,097 | 6,860 | 7,345 | 0.5% | |||||||||||||||||||||||||||||
|
|
||||||||||||||||||||||||||||||||||||||||
| Total Non-Control/Non-Affiliate Investments | $ | 1,887,601 | $ | 1,924,869 | 134.6% | |||||||||||||||||||||||||||||||||||
|
|
|
|
|
|
|
|||||||||||||||||||||||||||||||||||
| Short Term Investments—10.5% | ||||||||||||||||||||||||||||||||||||||||
| Goldman Sachs Financial Square Funds - Prime Obligations Fund FST Preferred Shares |
Short Term Investments(i) | 0.01 | %(n) | 149,800,957 | $ | 149,801 | $ | 149,801 | 10.5% | |||||||||||||||||||||||||||||||
|
|
||||||||||||||||||||||||||||||||||||||||
| State Street Institutional Liquid Reserves Fund, Institutional Class |
Short Term Investments | 0.06 | %(n) | 102,061 | 102 | 102 | 0.0% | |||||||||||||||||||||||||||||||||
|
|
||||||||||||||||||||||||||||||||||||||||
| Total Short Term Investments |
$ | 149,903 | $ | 149,903 | 10.5% | |||||||||||||||||||||||||||||||||||
|
|
|
|
|
|
|
|||||||||||||||||||||||||||||||||||
| TOTAL INVESTMENTS —145.1%(o) | $ | 2,037,504 | 2,074,772 | 145.1% | ||||||||||||||||||||||||||||||||||||
|
|
|
|
|
|
|
|||||||||||||||||||||||||||||||||||
| LIABILITIES IN EXCESS OF OTHER ASSETS—(45.1%) | (644,338 | ) | (45.1)% | |||||||||||||||||||||||||||||||||||||
|
|
|
|
|
|||||||||||||||||||||||||||||||||||||
| NET ASSETS—100.0% | $ | 1,430,434 | 100.0% | |||||||||||||||||||||||||||||||||||||
|
|
|
|
|
|||||||||||||||||||||||||||||||||||||
| Collateral on Deposit with Custodian—2.6% | ||||||||||||||||||||||||||||||||||||||||
|
|
||||||||||||||||||||||||||||||||||||||||
| Bank of Nova Scotia - Certificate of Deposit |
Short Term Investments | 0.16 | % | 3/31/2014 | $ | 37,501 | $ | 37,501 | $ | 37,501 | 2.6% | |||||||||||||||||||||||||||||
|
|
|
|
|
|
|
|||||||||||||||||||||||||||||||||||
| Total Collateral on Deposit with Custodian |
$ | 37,501 | $ | 37,501 | 2.6% | |||||||||||||||||||||||||||||||||||
|
|
|
|
|
|
|
|||||||||||||||||||||||||||||||||||
| Derivative Instruments—(0.1%) | ||||||||||||||||||||||||||||||||||||||||
|
|
||||||||||||||||||||||||||||||||||||||||
| Foreign currency forward contracts | Foreign currency forward contracts(f) | N/A | 1/2014 – 1/2015 | $ | — | $ | (3,181 | ) | (0.2)% | |||||||||||||||||||||||||||||||
| Total return swaps | Total return swaps(f)(j) | N/A | 1/15/2016 | — | 1,861 | 0.1% | ||||||||||||||||||||||||||||||||||
|
|
||||||||||||||||||||||||||||||||||||||||
| Total Derivative Instruments | $ | — | $ | (1,320 | ) | (0.1)% | ||||||||||||||||||||||||||||||||||
|
|
|
|
|
|
|
|||||||||||||||||||||||||||||||||||
| * | Non-income producing security. |
| (a) | Security may be an obligation of one or more entities affiliated with the named company. |
(b) Denominated in U.S. Dollars unless otherwise noted.
See notes to consolidated financial statements.
F-9
Table of Contents
Corporate Capital Trust, Inc. and Subsidiaries
Consolidated Schedule of Investments (continued)
As of December 31, 2013
(in thousands, except share amounts)
(c) Represents amortized cost for debt securities and cost for common stocks translated to U.S. Dollars.
(d) Non-Control/Non-Affiliate investments are defined by the Investment Company Act of 1940, as amended (“1940 Act”) as investments that are neither Control Investments nor Affiliate Investments. Controlled investments are defined by the 1940 Act as investments in which more than 25% of the voting securities are owned or where the ability to nominate greater than 50% of the board representation is maintained. Affiliate investments are defined by the 1940 Act as investments in which between 5% and 25% of the voting securities are owned and the investments are not classified as Controlled investments.
(e) A portfolio company domiciled in a foreign country. The jurisdiction of the security issuer may be in a different country than the domicile of the portfolio company.
(f) The investment is not a qualifying asset as defined in Section 55(a) under the Investment Company Act of 1940, as amended, or the 1940 Act. A business development company may not acquire any asset other than qualifying assets, unless, at the time the acquisition is made, qualifying assets represent at least 70% of the company’s total assets. The Company calculates its compliance with the qualifying assets test on a “look through” basis by disregarding the value of the Company’s total return swaps and treating each loan underlying the total return swaps as either a qualifying asset or non-qualifying asset based on whether the obligor is an eligible portfolio company. On this basis, 75.8% of the Company’s total assets represented qualifying assets as of December 31, 2013.
(g) This security was acquired in a transaction that was exempt from the registration requirements of the Securities Act of 1933, as amended (the “Securities Act”), pursuant to Rule 144A thereunder. This security may be resold only in transactions that are exempt from the registration requirements of the Securities Act, normally to qualified institutional buyers.
(h) Security or portion thereof is held within Paris Funding, LLC and is pledged as collateral supporting the amounts outstanding under the committed facility agreement with BNP Paribas Prime Brokerage, Inc. and eligible to be hypothecated as allowed under Rule 15c2-1(a)(1) of the Exchange Act subject to the limits of the Rehypothecation Agreement.
(i) Security or portion thereof is held within CCT Funding, LLC and is pledged as collateral supporting the amounts outstanding under the revolving credit facility with Deutsche Bank.
(j) Investments classified as Level 3 whereby fair value was determined by the Company’s Board of Directors (see Note 2).
(k) Position or portion thereof unsettled as of December 31, 2013.
(l) Investment was on non-accrual status as of December 31, 2013.
(m) A portfolio company investment structured as a credit-linked floating rate note.
(n) 7-day effective yield as of December 31, 2013.
(o) As of December 31, 2013, the aggregate gross unrealized appreciation for all securities in which there was an excess of value over tax cost was $43,062; the aggregate gross unrealized depreciation for all securities in which there was an excess of tax cost over value was $5,918; the net unrealized appreciation was $37,144; the aggregate cost of securities for Federal income tax purposes was $2,037,628.
Abbreviations:
EUR - Euro; loan principal amount is denominated in Euros currency. €1 / US $1.377 as of December 31, 2013.
GBP - British Pound Sterling; loan principal amount is denominated in Pound Sterling. £1 / US $1.649 as of December 31, 2013.
NZD - New Zealand Dollar; loan principal amount is denominated in New Zealand Dollars. N$1 / US $0.816 as of December 31, 2013.
CA - Canada
FR - France
IE - Ireland
KY - Cayman Islands
LU - Luxembourg
MX - Mexico
NL - The Netherlands
NZ - New Zealand
SE - Sweden
SG - Singapore
UK - United Kingdom
L = LIBOR - London Interbank Offered Rate, typically 3-Month
PIK - Payment-in-kind
See notes to consolidated financial statements.
F-10
Table of Contents
Corporate Capital Trust, Inc. and Subsidiaries
Consolidated Schedule of Investments
As of December 31, 2012
(in thousands, except share amounts)
| Company (a) | Industry (n) | Investments | Interest Rate |
EURIBOR/ LIBOR |
Maturity Date |
No. Shares/ Principal |
Cost (c) | Fair Value | % of Net Assets |
|||||||||||||||||||||
|
|
||||||||||||||||||||||||||||||
| Non-Control/Non-Affiliate Investments(d)—114.1% |
|
|||||||||||||||||||||||||||||
| AdvancePierre Foods, Inc. | Food, Beverage & Tobacco | Senior Debt(e) | L + 450 | 1.25% | 7/10/2017 | $ | 3,938 | $ | 3,910 | $ | 3,987 | 0.6% | ||||||||||||||||||
|
|
||||||||||||||||||||||||||||||
| Allen Systems Group, Inc. | Software & Services | Senior Debt(e)(f) | 10.50% | 11/15/2016 | 106 | 66 | 78 | 0.0% | ||||||||||||||||||||||
|
|
||||||||||||||||||||||||||||||
| Alliance Laundry Systems, LLC | Capital Goods | Senior Debt(e) | L + 425 | 1.25% | 12/10/2018 | 3,553 | 3,535 | 3,589 | 0.6% | |||||||||||||||||||||
|
|
||||||||||||||||||||||||||||||
| Ally Financial, Inc. | Banks | Preferred Stock(g) | 118,908 | 2,996 | 3,124 | 0.5% | ||||||||||||||||||||||||
| Preferred Stock(g) | 69,800 | 1,804 | 1,860 | 0.3% | ||||||||||||||||||||||||||
|
|
|
|
|
|
|
|||||||||||||||||||||||||
| 4,800 | 4,984 | 0.8% | ||||||||||||||||||||||||||||
|
|
||||||||||||||||||||||||||||||
| Altisource Solutions (LU)(h) | Real Estate | Senior Debt(e)(g) | L + 450 | 1.25% | 11/27/2019 | 7,545 | 7,470 | 7,583 | 1.2% | |||||||||||||||||||||
|
|
||||||||||||||||||||||||||||||
| American Gaming Systems, LLC | Consumer Services | Senior Debt(i) | L + 1000 | 1.50% | 8/15/2016 | 11,974 | 11,524 | 11,974 | 2.0% | |||||||||||||||||||||
| Senior Debt(i) | L + 1000 | 1.50% | 8/15/2016 | 781 | (29 | ) | — | 0.0% | ||||||||||||||||||||||
| Senior Debt(i)(j) | L + 1000 | 1.50% | 8/15/2016 | 781 | 752 | 781 | 0.1% | |||||||||||||||||||||||
|
|
|
|
|
|
|
|||||||||||||||||||||||||
| 12,247 | 12,755 | 2.1% | ||||||||||||||||||||||||||||
|
|
||||||||||||||||||||||||||||||
| American Rock Salt Co., LLC | Materials | Senior Debt(e) | L + 425 | 1.25% | 4/25/2017 | 8,486 | 8,151 | 8,398 | 1.4% | |||||||||||||||||||||
|
|
||||||||||||||||||||||||||||||
| Amkor Technologies, Inc. | Semiconductors & Semiconductor Equipment | Subordinated Debt(e)(g) | 7.38% | 5/1/2018 | 213 | 211 | 220 | 0.0% | ||||||||||||||||||||||
|
|
||||||||||||||||||||||||||||||
| Amsurg Corp. | Health Care Equipment & Services | Subordinated Debt(e)(f)(g) | 5.63% | 11/30/2020 | 943 | 943 | 981 | 0.2% | ||||||||||||||||||||||
|
|
||||||||||||||||||||||||||||||
| Aramark Corp. | Commercial & Professional Services | Subordinated Debt(e) | 8.50% | 2/1/2015 | 2,836 | 2,897 | 2,850 | 0.5% | ||||||||||||||||||||||
|
|
||||||||||||||||||||||||||||||
| Ardagh Packaging Holdings, Ltd. (IE)(h) | Capital Goods | Senior Debt(e)(f)(g) | 7.38% | 10/15/2017 | 100 | 100 | 109 | 0.0% | ||||||||||||||||||||||
|
|
||||||||||||||||||||||||||||||
| Aspect Software, Inc. | Technology Hardware & Equipment | Senior Debt(e) | L + 525 | 1.75% | 5/7/2016 | 4,361 | 4,359 | 4,394 | 0.7% | |||||||||||||||||||||
| Senior Debt(e) | 10.63% | 5/15/2017 | 9,009 | 9,485 | 8,153 | 1.3% | ||||||||||||||||||||||||
|
|
|
|
|
|
|
|||||||||||||||||||||||||
| 13,844 | 12,547 | 2.0% | ||||||||||||||||||||||||||||
|
|
||||||||||||||||||||||||||||||
| Aspen Dental Management, Inc. | Health Care Equipment & Services | Senior Debt(e) | L + 550 | 1.50% | 10/6/2016 | 6,115 | 6,049 | 5,840 | 0.9% | |||||||||||||||||||||
|
|
||||||||||||||||||||||||||||||
| Asset Acceptance Capital Corp. | Diversified Financials | Senior Debt(g)(i) | L + 725 | 1.50% | 11/14/2017 | 919 | 897 | 930 | 0.2% | |||||||||||||||||||||
|
|
||||||||||||||||||||||||||||||
| AssuraMed Holding, Inc. | Health Care Equipment & Services | Senior Debt(e) | L + 800 | 1.25% | 4/24/2020 | 5,147 | 5,045 | 5,207 | 0.8% | |||||||||||||||||||||
|
|
||||||||||||||||||||||||||||||
| Asurion, LLC | Software & Services | Senior Debt(e) | L + 400 | 1.50% | 5/24/2018 | $ | 3,285 | $ | 3,241 | $ | 3,323 | 0.5% | ||||||||||||||||||
| Senior Debt(e) | L + 750 | 1.50% | 5/24/2019 | 396 | 396 | 409 | 0.1% | |||||||||||||||||||||||
|
|
|
|
|
|
|
|||||||||||||||||||||||||
| 3,637 | 3,732 |
|
0.6% |
| ||||||||||||||||||||||||||
|
|
||||||||||||||||||||||||||||||
| Avaya, Inc. | Technology Hardware & Equipment | Senior Debt(e)(f) | 7.00% | 4/1/2019 | 14,555 | 13,662 | 13,609 | 2.2% | ||||||||||||||||||||||
|
|
||||||||||||||||||||||||||||||
| Bill Barrett Corp. | Energy | Subordinated Debt(e)(g) | 7.63% | 10/1/2019 | 251 | 257 | 265 | 0.0% | ||||||||||||||||||||||
|
|
||||||||||||||||||||||||||||||
| BNY ConvergEX Group, LLC | Diversified Financials | Senior Debt(e)(g) | L + 375 | 1.50% | 12/19/2016 | 110 | 108 | 106 |
|
0.0% |
| |||||||||||||||||||
| Senior Debt(e)(g) | L + 375 | 1.50% | 12/19/2016 | 241 | 239 | 234 | 0.0% | |||||||||||||||||||||||
| Senior Debt(e)(g)(i) | L + 700 | 1.75% | 12/17/2017 | 1,387 | 1,381 | 1,307 | 0.2% | |||||||||||||||||||||||
| Senior Debt(e)(g)(i) | L + 700 | 1.75% | 12/17/2017 | 582 | 579 | 548 | 0.1% | |||||||||||||||||||||||
|
|
|
|
|
|
|
|||||||||||||||||||||||||
| 2,307 | 2,195 |
|
0.3% |
| ||||||||||||||||||||||||||
|
|
||||||||||||||||||||||||||||||
| Bright Horizons Family Solutions, Inc. | Consumer Services | Senior Debt(i) | L + 425 | 1.00% | 5/23/2017 | 1,004 | 999 | 1,014 | 0.2% | |||||||||||||||||||||
|
|
||||||||||||||||||||||||||||||
| Building Materials Corporation of America | Capital Goods | Subordinated Debt(e)(f) | 6.75% | 5/1/2021 | 41 | 44 | 45 |
|
0.0% |
| ||||||||||||||||||||
|
|
||||||||||||||||||||||||||||||
| Caesars Entertainment Operating Co., Inc. | Consumer Services | Senior Debt(e)(g) | 11.25% | 6/1/2017 | 1,023 | 1,075 | 1,096 |
|
0.2% |
| ||||||||||||||||||||
|
|
||||||||||||||||||||||||||||||
| Catalina Marketing Corp. | Media | Senior Debt(e) | L + 550 | 9/29/2017 | 8,432 | 8,356 | 8,466 |
|
1.4% |
| ||||||||||||||||||||
| Subordinated Debt(e)(f) | 10.50% | 10/1/2015 | 20,436 | 20,405 | 20,692 | 3.4% | ||||||||||||||||||||||||
|
|
|
|
|
|
|
|||||||||||||||||||||||||
| 28,761 | 29,158 |
|
4.8% |
| ||||||||||||||||||||||||||
|
|
||||||||||||||||||||||||||||||
| CDW Corp. | Technology Hardware & Equipment | Subordinated Debt(e) | 12.54% | 10/12/2017 | 12,626 | 13,510 | 13,494 | 2.2% | ||||||||||||||||||||||
|
|
||||||||||||||||||||||||||||||
See notes to consolidated financial statements
F-11
Table of Contents
Corporate Capital Trust, Inc. and Subsidiaries
Consolidated Schedule of Investments (continued)
As of December 31, 2012
(in thousands, except share amounts)
| Company (a) | Industry (n) | Investments | Interest Rate |
EURIBOR/ LIBOR |
Maturity Date |
No. Shares/ Principal |
Cost (c) | Fair Value | % of Net Assets |
|||||||||||||||||||||||||
|
|
||||||||||||||||||||||||||||||||||
| Celanese US Holdings, LLC | Materials | Subordinated Debt(e)(g) | 4.63% | 11/15/2022 | 2,900 | 2,900 | 3,038 | 0.5% | ||||||||||||||||||||||||||
|
|
||||||||||||||||||||||||||||||||||
| Cemex Espana S.A. (ES)(h) | Materials | Senior Debt(e)(g)(j)(EUR) | E + 500 | 2/14/2017 | € | 929 | 1,112 | 1,174 | 0.2% | |||||||||||||||||||||||||
|
|
||||||||||||||||||||||||||||||||||
| Cemex Finance, LLC | Materials | Senior Debt(e)(f)(g) | 9.38% | 10/12/2022 | $ | 825 | 825 | 928 | 0.1% | |||||||||||||||||||||||||
|
|
||||||||||||||||||||||||||||||||||
| Cemex Finance Europe BV | Materials | Subordinated Debt(g) | 4.75% | 3/5/2014 | € | 419 | 481 | 566 | 0.1% | |||||||||||||||||||||||||
|
|
||||||||||||||||||||||||||||||||||
| Cemex Materials, LLC | Materials | Subordinated Debt(e)(f) | 7.70% | 7/21/2025 | $ | 12,670 | 11,742 | 12,828 | 2.1% | |||||||||||||||||||||||||
|
|
||||||||||||||||||||||||||||||||||
| Cemex S.A.B. de C.V. (MX)(h) | Materials | Senior Debt(e)(g)(j) | L + 525 | 2/14/2017 | 3,441 | 3,192 | 3,295 | 0.5% | ||||||||||||||||||||||||||
|
|
||||||||||||||||||||||||||||||||||
| Cengage Learning Acquisitions, Inc. | Media | Senior Debt(e)(f) | 11.50% | 4/15/2020 | 14,622 | 15,000 | 12,611 | 2.1% | ||||||||||||||||||||||||||
|
|
||||||||||||||||||||||||||||||||||
| Ceridian Corp. | Commercial & Professional Services | Senior Debt(e) | L + 575 | 5/9/2017 | $ | 11,345 | $ | 11,321 | $ | 11,360 | 1.9% | |||||||||||||||||||||||
| Senior Debt(e)(f) | 8.88% | 7/15/2019 | 2,123 | 2,123 | 2,303 | 0.4% | ||||||||||||||||||||||||||||
|
|
|
|
|
|
|
|||||||||||||||||||||||||||||
| 13,444 | 13,663 |
|
2.3% |
| ||||||||||||||||||||||||||||||
|
|
||||||||||||||||||||||||||||||||||
| CHG Companies, Inc. | Health Care Equipment & Services | Senior Debt(e)(j) | L + 375 | 1.25% | 11/19/2019 | 3,073 | 3,042 | 3,078 | 0.5% | |||||||||||||||||||||||||
| Senior Debt(e)(j) | L + 775 | 1.25% | 11/19/2020 | 6,663 | 6,530 | 6,708 | 1.1% | |||||||||||||||||||||||||||
|
|
|
|
|
|
|
|||||||||||||||||||||||||||||
| 9,572 | 9,786 |
|
1.6% |
| ||||||||||||||||||||||||||||||
|
|
||||||||||||||||||||||||||||||||||
| Clear Channel Worldwide Holdings, Inc. | Media | Subordinated Debt(e)(g) | 7.63% | 3/15/2020 | 1,857 | 1,799 | 1,871 | 0.3% | ||||||||||||||||||||||||||
|
|
||||||||||||||||||||||||||||||||||
| ClubCorp Club Operations, Inc. | Consumer Services | Senior Debt(e) | L + 375 | 1.50% | 11/30/2016 | 136 | 129 | 138 | 0.0% | |||||||||||||||||||||||||
|
|
||||||||||||||||||||||||||||||||||
| CNO Financial Group, Inc. | Insurance | Senior Debt(e)(f)(g) | 6.38% | 10/1/2020 | 1,092 | 1,131 | 1,136 | 0.2% | ||||||||||||||||||||||||||
|
|
||||||||||||||||||||||||||||||||||
| Commscope, Inc. | Technology Hardware & Equipment | Subordinated Debt(e)(f) | 8.25% | 1/15/2019 | 632 | 666 | 692 | 0.1% | ||||||||||||||||||||||||||
|
|
||||||||||||||||||||||||||||||||||
| Continental Airlines, Inc. | Transportation | Senior Debt(e)(g) | 7.34% | 4/19/2014 | 267 | 270 | 275 | 0.0% | ||||||||||||||||||||||||||
|
|
||||||||||||||||||||||||||||||||||
| CRC Health Corp. | Health Care Equipment & Services | Senior Debt(e) | L + 450 | 11/16/2015 | 1,199 | 1,145 | 1,160 |
|
0.2% |
| ||||||||||||||||||||||||
| Subordinated Debt(e) | 10.75% | 2/1/2016 | 1,114 | 1,075 | 1,086 | 0.2% | ||||||||||||||||||||||||||||
|
|
|
|
|
|
|
|||||||||||||||||||||||||||||
| 2,220 | 2,246 | 0.4% | ||||||||||||||||||||||||||||||||
|
|
||||||||||||||||||||||||||||||||||
| Cunningham Lindsey U.S., Inc. | Insurance | Senior Debt(e) | L + 375 | 1.25% | 12/10/2019 | 4,616 | 4,571 | 4,657 | 0.8% | |||||||||||||||||||||||||
| Senior Debt(e) | L + 800 | 1.25% | 6/10/2020 | 6,643 | 6,577 | 6,809 | 1.1% | |||||||||||||||||||||||||||
|
|
|
|
|
|
|
|||||||||||||||||||||||||||||
| 11,148 | 11,466 |
|
1.9% |
| ||||||||||||||||||||||||||||||
|
|
||||||||||||||||||||||||||||||||||
| Data Device Corp. | Capital Goods | Senior Debt(e) | L + 600 | 1.50% | 7/11/2018 | 7,896 | 7,750 | 7,876 | 1.3% | |||||||||||||||||||||||||
| Senior Debt(i) | L + 1000 | 1.50% | 7/11/2019 | 8,000 | 7,847 | 7,840 | 1.3% | |||||||||||||||||||||||||||
|
|
|
|
|
|
|
|||||||||||||||||||||||||||||
| 15,597 | 15,716 |
|
2.6% |
| ||||||||||||||||||||||||||||||
|
|
||||||||||||||||||||||||||||||||||
| Datatel, Inc. | Software & Services | Senior Debt(e) | L + 500 | 1.25% | 7/19/2018 | 394 | 388 | 399 | 0.1% | |||||||||||||||||||||||||
|
|
||||||||||||||||||||||||||||||||||
| David’s Bridal, Inc. | Retailing | Senior Debt(e) | L + 375 | 1.25% | 10/11/2019 | 2,196 | 2,175 | 2,205 | 0.4% | |||||||||||||||||||||||||
|
|
||||||||||||||||||||||||||||||||||
| DJO Finance, LLC | Health Care Equipment & Services | Senior Debt(e) | L + 500 | 1.25% | 9/15/2017 | 1,975 | 1,977 | 1,990 | 0.3% | |||||||||||||||||||||||||
| Senior Debt(e)(f) | 8.75% | 3/15/2018 | 8,188 | 8,639 | 8,945 | 1.5% | ||||||||||||||||||||||||||||
|
|
|
|
|
|
|
|||||||||||||||||||||||||||||
| 10,616 | 10,935 | 1.8% | ||||||||||||||||||||||||||||||||
|
|
||||||||||||||||||||||||||||||||||
| DuPont Fabros Technology, LP | Real Estate | Subordinated Debt(e)(g) | 8.50% | 12/15/2017 | 100 | 106 | 109 | 0.0% | ||||||||||||||||||||||||||
|
|
||||||||||||||||||||||||||||||||||
| E*Trade Financial Corp. | Diversified Financials | Subordinated Debt(e)(g) | 6.75% | 6/1/2016 | $ | 10 | $ | 11 | $ | 11 | 0.0% | |||||||||||||||||||||||
|
|
||||||||||||||||||||||||||||||||||
| Easton-Bell Sports, Inc. | Consumer Durables & Apparel | Senior Debt(e) | 9.75% | 12/1/2016 | 1,190 | 1,261 | 1,279 | 0.2% | ||||||||||||||||||||||||||
|
|
||||||||||||||||||||||||||||||||||
| Education Management, LLC | Consumer Services | Senior Debt(e)(g) | L + 700 | 1.25% | 3/30/2018 | 7,078 | 6,891 | 5,919 | 1.0% | |||||||||||||||||||||||||
| Subordinated Debt(e)(g) | 8.75% | 6/1/2014 | 5,818 | 5,658 | 4,669 | 0.8% | ||||||||||||||||||||||||||||
|
|
|
|
|
|
|
|||||||||||||||||||||||||||||
| 12,549 | 10,588 |
|
1.8% |
| ||||||||||||||||||||||||||||||
|
|
||||||||||||||||||||||||||||||||||
| Express, LLC / Express Finance Corp. | Retailing | Subordinated Debt(e)(g) | 8.75% | 3/1/2018 | 707 | 765 | 765 | 0.1% | ||||||||||||||||||||||||||
|
|
||||||||||||||||||||||||||||||||||
| Fage Dairy Industry, SA | Food, Beverage & Tobacco | Subordinated Debt(e)(f)(g) | 9.88% | 2/1/2020 | 22 | 22 | 23 | 0.0% | ||||||||||||||||||||||||||
|
|
||||||||||||||||||||||||||||||||||
| Fidelity National Information Services, Inc. | Software & Services | Subordinated Debt(e)(g) | 5.00% | 3/15/2022 | 26 | 28 | 28 | 0.0% | ||||||||||||||||||||||||||
| Subordinated Debt(e)(g) | 7.88% | 7/15/2020 | 114 | 122 | 129 | 0.0% | ||||||||||||||||||||||||||||
|
|
|
|
|
|
|
|||||||||||||||||||||||||||||
| 150 | 157 |
|
0.0% |
| ||||||||||||||||||||||||||||||
|
|
||||||||||||||||||||||||||||||||||
| Fifth & Pacific Companies, Inc. | Consumer Durables & Apparel | Senior Debt(e)(f)(g) | 10.50% | 4/15/2019 | 1,735 | 1,848 | 1,922 | 0.3% | ||||||||||||||||||||||||||
|
|
||||||||||||||||||||||||||||||||||
| FleetPride Corp. | Capital Goods | Senior Debt(e) | L + 400 | 1.25% | 11/20/2019 | 588 | 578 | 590 | 0.1% | |||||||||||||||||||||||||
|
|
||||||||||||||||||||||||||||||||||
See notes to consolidated financial statements
F-12
Table of Contents
Corporate Capital Trust, Inc. and Subsidiaries
Consolidated Schedule of Investments (continued)
As of December 31, 2012
(in thousands, except share amounts)
| Company (a) | Industry (n) | Investments | Interest Rate |
EURIBOR/ LIBOR |
Maturity Date |
No. Shares/ Principal |
Cost (c) | Fair Value | % of Net Assets |
|||||||||||||||||||||||||||||
|
|
||||||||||||||||||||||||||||||||||||||
| Freedom Group | Consumer Durables & Apparel | Senior Debt(e) | L + 425 | 1.25% | 4/19/2019 | 992 | 987 | 969 | 0.2% | |||||||||||||||||||||||||||||
| Senior Debt(e)(f) | 7.88% | 5/1/2020 | 2,667 | 2,870 | 2,747 | 0.4% | ||||||||||||||||||||||||||||||||
|
|
|
|
|
|
|
|||||||||||||||||||||||||||||||||
| 3,857 | 3,716 |
|
0.6% |
| ||||||||||||||||||||||||||||||||||
|
|
||||||||||||||||||||||||||||||||||||||
| FTI Consulting, Inc. | Diversified Financials | Subordinated Debt(e)(f)(g) | 6.00% | 11/15/2022 | 2,869 | 2,869 | 2,984 | 0.5% | ||||||||||||||||||||||||||||||
|
|
||||||||||||||||||||||||||||||||||||||
| GCI, Inc. | Telecommunication Services | Subordinated Debt(e) | 8.63% | 11/15/2019 | 8,575 | 9,103 | 9,111 | 1.5% | ||||||||||||||||||||||||||||||
|
|
||||||||||||||||||||||||||||||||||||||
| Genesys Telecommunications Laboratories, Inc. | Software & Services | Common Stock*(i) Subordinated Debt(i)(EUR) |
12.50% | 1/31/2020 | € |
448,908 2,044 |
|
|
449 2,631 |
|
|
453 2,765 |
|
|
0.1% 0.5% |
| ||||||||||||||||||||||
|
|
|
|
|
|
|
|||||||||||||||||||||||||||||||||
| 3,080 | 3,218 |
|
0.6% |
| ||||||||||||||||||||||||||||||||||
|
|
||||||||||||||||||||||||||||||||||||||
| Good Sam Enterprises, LLC | Media | Senior Debt(e) | 11.50% | 12/1/2016 | $ | 12,224 | 12,630 | 13,080 | 2.1% | |||||||||||||||||||||||||||||
|
|
||||||||||||||||||||||||||||||||||||||
| Great Lakes Dredge & Dock Corp. | Capital Goods | Subordinated Debt(e)(g) | 7.38% | 2/1/2019 | 782 | 802 | 839 | 0.1% | ||||||||||||||||||||||||||||||
|
|
||||||||||||||||||||||||||||||||||||||
| Guitar Center, Inc. | Retailing | Senior Debt(e) | L + 350 | 4/9/2017 | 12,249 | 11,486 | 11,848 | 2.0% | ||||||||||||||||||||||||||||||
|
|
||||||||||||||||||||||||||||||||||||||
| Hamilton Sundstrand Industrial (LU)(h) | Capital Goods | Senior Debt(e)(j) | L + 375 | 1.25% | 12/13/2019 | $ | 1,708 | $ | 1,691 | $ | 1,727 | 0.3% | ||||||||||||||||||||||||||
| Subordinated Debt(e) | 7.75% | 12/15/2020 | 407 | 407 | 421 | 0.1% | ||||||||||||||||||||||||||||||||
|
|
|
|
|
|
|
|||||||||||||||||||||||||||||||||
|
|
2,098 |
|
|
2,148 |
|
|
0.4% |
| ||||||||||||||||||||||||||||||
|
|
||||||||||||||||||||||||||||||||||||||
| Harbor Freight Tools USA, Inc. | Capital Goods | Senior Debt(e) | L + 425 | 1.25% | 11/14/2017 | 5,266 | 5,231 | 5,337 | 0.9% | |||||||||||||||||||||||||||||
|
|
||||||||||||||||||||||||||||||||||||||
| HUB International, Ltd. | Insurance | Senior Debt(e) | L + 450 | 6/13/2017 | 5,091 | 5,052 | 5,139 | 0.8% | ||||||||||||||||||||||||||||||
| Senior Debt(e) | L + 475 | 2.00% | 12/13/2017 | 329 | 329 | 333 | 0.1% | |||||||||||||||||||||||||||||||
| Subordinated Debt(e)(f) | 8.13% | 10/15/2018 | 16,780 | 16,773 | 17,126 | 2.8% | ||||||||||||||||||||||||||||||||
|
|
|
|
|
|
|
|||||||||||||||||||||||||||||||||
|
|
22,154 |
|
|
22,598 |
|
|
3.7% |
| ||||||||||||||||||||||||||||||
|
|
||||||||||||||||||||||||||||||||||||||
| Hubbard Radio, LLC | Media | Senior Debt | L + 725 | 1.50% | 4/30/2018 | 14,670 | 14,800 | 14,963 | 2.4% | |||||||||||||||||||||||||||||
|
|
||||||||||||||||||||||||||||||||||||||
| Hyland Software, Inc. | Software & Services | Senior Debt(e) | L + 425 | 1.25% | 10/25/2019 | 4,718 | 4,695 | 4,738 | 0.8% | |||||||||||||||||||||||||||||
|
|
||||||||||||||||||||||||||||||||||||||
| Immucor, Inc. | Health Care Equipment & Services | Senior Debt(e)(j) | L + 450 | 1.25% | 8/19/2018 | 2,372 | 2,379 | 2,406 | 0.4% | |||||||||||||||||||||||||||||
|
|
||||||||||||||||||||||||||||||||||||||
| IMS Health, Inc. | Health Care Equipment & Services | Subordinated Debt(e)(f)(g) | 6.00% | 11/1/2020 | 1,657 | 1,657 | 1,736 | 0.3% | ||||||||||||||||||||||||||||||
|
|
||||||||||||||||||||||||||||||||||||||
| Ineos US Finance, LLC (UK)(h) | Materials | Senior Debt(e)(f)(g) | 9.00% | 5/15/2015 | 70 | 73 | 74 | 0.0% | ||||||||||||||||||||||||||||||
|
|
||||||||||||||||||||||||||||||||||||||
| Infor (US), Inc. | Software & Services | Senior Debt(e) | L + 400 | 1.25% | 4/5/2018 | 6,310 | 6,352 | 6,379 | 1.0% | |||||||||||||||||||||||||||||
| Subordinated Debt(e)(f) | 11.50% | 7/15/2018 | 4,549 | 4,968 | 5,322 | 0.9% | ||||||||||||||||||||||||||||||||
|
|
|
|
|
|
|
|||||||||||||||||||||||||||||||||
|
|
11,320 |
|
|
11,701 |
|
|
1.9% |
| ||||||||||||||||||||||||||||||
|
|
||||||||||||||||||||||||||||||||||||||
| Interactive Data Corp. | Diversified Financials | Senior Debt(e) | L + 325 | 1.25% | 2/11/2018 | 18 | 17 | 18 | 0.0% | |||||||||||||||||||||||||||||
|
|
||||||||||||||||||||||||||||||||||||||
| iPayment, Inc. | Software & Services | Senior Debt(e) | L + 425 | 1.50% | 5/8/2017 | 1,910 | 1,892 | 1,906 | 0.3% | |||||||||||||||||||||||||||||
| Subordinated Debt(e) | 10.25% | 5/15/2018 | 4,100 | 3,872 | 3,290 | 0.5% | ||||||||||||||||||||||||||||||||
|
|
|
|
|
|
|
|||||||||||||||||||||||||||||||||
|
|
5,764 |
|
|
5,196 |
|
|
0.8% |
| ||||||||||||||||||||||||||||||
|
|
||||||||||||||||||||||||||||||||||||||
| IPC Systems, Inc. | Technology Hardware & Equipment | Senior Debt(e) | L + 650 | 1.25% | 7/31/2017 | 6,307 | 6,185 | 6,179 | 1.0% | |||||||||||||||||||||||||||||
|
|
||||||||||||||||||||||||||||||||||||||
| J. Crew Group, Inc. | Retailing | Subordinated Debt(e) | 8.13% | 3/1/2019 | 1,471 | 1,401 | 1,556 | 0.3% | ||||||||||||||||||||||||||||||
|
|
||||||||||||||||||||||||||||||||||||||
| J. Jill | Retailing | Senior Debt(e)(i) | L + 850 | 1.50% | 4/29/2017 | 10,266 | 10,266 | 10,266 | 1.7% | |||||||||||||||||||||||||||||
|
|
||||||||||||||||||||||||||||||||||||||
| Jeld-Wen, Inc. | Capital Goods | Senior Debt(e)(f) | 12.25% | 10/15/2017 | 15,171 | 17,516 | 17,523 | 2.9% | ||||||||||||||||||||||||||||||
|
|
||||||||||||||||||||||||||||||||||||||
| Kerling PLC (UK)(h) | Materials | Senior Debt(f)(g)(EUR) | 10.63% | 2/1/2017 | € | 5,353 | 6,597 | 6,783 | 1.1% | |||||||||||||||||||||||||||||
|
|
||||||||||||||||||||||||||||||||||||||
| KeyPoint Government Solutions, Inc. | Capital Goods | Senior Debt(e)(i) | L + 600 | 1.25% | 11/13/2017 | $ | 35,000 | 34,284 | 34,650 | 5.7% | ||||||||||||||||||||||||||||
|
|
||||||||||||||||||||||||||||||||||||||
| Mcjunkin Corp. | Energy | Senior Debt(e) | L + 500 | 1.25% | 10/20/2019 | $ | 6,222 | $ | 6,160 | $ | 6,160 | 1.0% | ||||||||||||||||||||||||||
|
|
||||||||||||||||||||||||||||||||||||||
See notes to consolidated financial statements
F-13
Table of Contents
Corporate Capital Trust, Inc. and Subsidiaries
Consolidated Schedule of Investments (continued)
As of December 31, 2012
(in thousands, except share amounts)
| Company (a) | Industry (n) | Investments | Interest Rate |
EURIBOR/ LIBOR |
Maturity Date |
No. Shares/ Principal |
Cost (c) | Fair Value | % of Net Assets |
|||||||||||||||||||||||||
|
|
||||||||||||||||||||||||||||||||||
| MedAssets, Inc. | Health Care Equipment & Services | Subordinated Debt(e)(g) | 8.00% | 11/15/2018 | 489 | 490 | 531 | 0.1% | ||||||||||||||||||||||||||
|
|
||||||||||||||||||||||||||||||||||
| MetroPCS Wireless, Inc. | Telecommunication Services | Subordinated Debt(e)(g) | 7.88% | 9/1/2018 | 1,762 | 1,834 | 1,907 | 0.3% | ||||||||||||||||||||||||||
|
|
||||||||||||||||||||||||||||||||||
| Misys PLC (UK)(h) | Software & Services | Senior Debt(e)(g) | L + 600 | 1.25% | 12/12/2018 | 1,970 | 1,947 | 1,994 | 0.3% | |||||||||||||||||||||||||
|
|
||||||||||||||||||||||||||||||||||
| Mueller Water Products, Inc. | Capital Goods | Subordinated Debt(e)(g) | 7.38% | 6/1/2017 | 1,034 | 895 | 1,067 | 0.2% | ||||||||||||||||||||||||||
|
|
||||||||||||||||||||||||||||||||||
| Nara Cable Funding (IE)(h) | Media | Senior Debt(e)(f)(g) | 8.88% | 12/1/2018 | 981 | 831 | 998 | 0.2% | ||||||||||||||||||||||||||
|
|
||||||||||||||||||||||||||||||||||
| National Vision, Inc. | Retailing | Senior Debt(e)(i) | L + 575 | 1.25% | 8/2/2018 | 3,039 | 2,995 | 3,084 | 0.5% | |||||||||||||||||||||||||
|
|
||||||||||||||||||||||||||||||||||
| NBTY, Inc. | Household & Personal Products | Senior Debt(e) | L + 325 | 1.00% | 10/1/2017 | 26 | 26 | 27 | 0.0% | |||||||||||||||||||||||||
|
|
||||||||||||||||||||||||||||||||||
| New Enterprise Stone & Lime Co., Inc. | Capital Goods | Senior Debt(e)(f) | 4.00%, 9.00% PIK |
3/15/2018 | 9,267 | 9,366 | 9,661 | 1.6% | ||||||||||||||||||||||||||
|
|
||||||||||||||||||||||||||||||||||
| Nexstar Broadcasting, Inc. | Media | Senior Debt(e)(g) | L + 350 | 1.00% | 12/3/2019 | 953 | 949 | 963 | 0.2% | |||||||||||||||||||||||||
| Senior Debt(e)(g)(j) | L + 350 | 1.00% | 12/3/2019 | 171 | 170 | 173 | 0.0% | |||||||||||||||||||||||||||
| Senior Debt(e)(g) | 8.88% | 4/15/2017 | 170 | 176 | 186 | 0.0% | ||||||||||||||||||||||||||||
|
|
|
|
|
|
|
|||||||||||||||||||||||||||||
| 1,295 | 1,322 |
|
0.2% |
| ||||||||||||||||||||||||||||||
|
|
||||||||||||||||||||||||||||||||||
| North American Breweries, Inc. | Food, Beverage & Tobacco | Senior Debt(e)(j) | L + 625 | 1.25% | 12/28/2018 | 4,969 | 4,870 | 4,994 | 0.8% | |||||||||||||||||||||||||
|
|
||||||||||||||||||||||||||||||||||
| Nuveen Investments, Inc. | Diversified Financials | Senior Debt(e)(g) | L + 700 | 1.25% | 2/28/2019 | 6,967 | 7,072 | 7,120 | 1.2% | |||||||||||||||||||||||||
|
|
||||||||||||||||||||||||||||||||||
| Ocwen Financial Corp. | Banks | Senior Debt(e)(g)(j) | L + 550 | 1.50% | 9/1/2016 | 14,119 | 13,977 | 14,224 | 2.3% | |||||||||||||||||||||||||
|
|
||||||||||||||||||||||||||||||||||
| Office Depot, Inc. | Retailing | Senior Debt(e)(f)(g) | 9.75% | 3/15/2019 | 5,743 | 5,649 | 6,030 | 1.0% | ||||||||||||||||||||||||||
|
|
||||||||||||||||||||||||||||||||||
| Petco Animal Supplies, Inc. | Retailing | Senior Debt(e) | L + 325 | 1.25% | 11/24/2017 | 119 | 114 | 120 | 0.0% | |||||||||||||||||||||||||
|
|
||||||||||||||||||||||||||||||||||
| Pharmaceutical Product Development, Inc. | Pharmaceuticals, Biotechnology & Life Sciences | Senior Debt(e) | L + 500 | 1.25% | 12/5/2018 | 801 | 791 | 815 | 0.1% | |||||||||||||||||||||||||
|
|
||||||||||||||||||||||||||||||||||
| Prestige Brands, Inc. | Pharmaceuticals, Biotechnology & Life Sciences | Subordinated Debt(e)(g) | 8.13% | 2/1/2020 | 602 | 642 | 670 | 0.1% | ||||||||||||||||||||||||||
|
|
||||||||||||||||||||||||||||||||||
| Realogy Corp. | Real Estate | Senior Debt(e)(g) | L + 425 | 10/10/2016 | 4,126 | 3,916 | 4,145 | 0.6% | ||||||||||||||||||||||||||
|
|
||||||||||||||||||||||||||||||||||
| RedPrairie Corp. | Software & Services | Senior Debt(e)(j) | L + 550 | 1.25% | 12/15/2018 | $ | 13,766 | $ | 13,490 | $ | 13,785 | 2.3% | ||||||||||||||||||||||
| Senior Debt(e)(j) | L + 1000 | 1.25% | 12/15/2019 | 10,729 | 10,515 | 10,854 | 1.8% | |||||||||||||||||||||||||||
|
|
|
|
|
|
|
|||||||||||||||||||||||||||||
| 24,005 | 24,639 |
|
4.1% |
| ||||||||||||||||||||||||||||||
|
|
||||||||||||||||||||||||||||||||||
| Reynolds Group Holdings, Inc. | Capital Goods | Senior Debt(e)(f) | 5.75% | 10/15/2020 | 533 | 533 | 550 | 0.1% | ||||||||||||||||||||||||||
|
|
||||||||||||||||||||||||||||||||||
| Rocket Software, Inc. | Software & Services | Senior Debt(e)(j) | L + 450 | 1.25% | 2/8/2018 | 4,177 | 4,166 | 4,204 | 0.7% | |||||||||||||||||||||||||
|
|
||||||||||||||||||||||||||||||||||
| Roundy’s Supermarkets, Inc. | Food & Staples Retailing | Senior Debt(e)(g) | L + 450 | 1.25% | 2/13/2019 | 4,465 | 4,440 | 4,212 | 0.7% | |||||||||||||||||||||||||
|
|
||||||||||||||||||||||||||||||||||
| Ryerson, Inc. | Materials | Senior Debt(e)(f) | 9.00% | 10/15/2017 | 6,755 | 6,756 | 6,873 | 1.1% | ||||||||||||||||||||||||||
|
|
||||||||||||||||||||||||||||||||||
| Sabre, Inc. | Transportation | Senior Debt(e)(j) | L + 600 | 1.25% | 12/29/2017 | — | (1) | — | 0.0% | |||||||||||||||||||||||||
| Senior Debt(e)(f) | 8.50% | 5/15/2019 | 8,879 | 9,107 | 9,456 | 1.5% | ||||||||||||||||||||||||||||
|
|
|
|
|
|
|
|||||||||||||||||||||||||||||
| 9,106 | 9,456 |
|
1.5% |
| ||||||||||||||||||||||||||||||
|
|
||||||||||||||||||||||||||||||||||
| Sanmina Corp. | Technology Hardware & Equipment | Subordinated Debt(e)(f)(g) | 7.00% | 5/15/2019 | 7,879 | 7,868 | 8,037 | 1.3% | ||||||||||||||||||||||||||
|
|
||||||||||||||||||||||||||||||||||
| Schaeffler AG (DE)(h) | Automobiles & Components | Senior Debt(e)(g)(j) | L + 475 | 1.25% | 1/27/2017 | 3,086 | 3,095 | 3,121 | 0.5% | |||||||||||||||||||||||||
| Senior Debt(e)(f)(g) | 8.50% | 2/15/2019 | 5 | 5 | 5 | 0.0% | ||||||||||||||||||||||||||||
|
|
|
|
|
|
|
|||||||||||||||||||||||||||||
| 3,100 | 3,126 | 0.5% | ||||||||||||||||||||||||||||||||
|
|
||||||||||||||||||||||||||||||||||
| Sedgwick Claims Management Services | Insurance | Senior Debt(e)(i) | L + 350 | 1.50% | 12/31/2016 | 113 | 108 | 113 | 0.0% | |||||||||||||||||||||||||
| Holdings, Inc. | Senior Debt(e)(i) | L + 750 | 1.50% | 5/30/2017 | 1,339 | 1,318 | 1,359 | 0.3% | ||||||||||||||||||||||||||
|
|
|
|
|
|
|
|||||||||||||||||||||||||||||
| 1,426 | 1,472 |
|
0.3% |
| ||||||||||||||||||||||||||||||
|
|
||||||||||||||||||||||||||||||||||
| Sidera Networks, Inc. | Media | Senior Debt(e) | L + 450 | 1.50% | 8/26/2016 | 2,632 | 2,494 | 2,635 | 0.4% | |||||||||||||||||||||||||
|
|
||||||||||||||||||||||||||||||||||
| Sinclair Television Group, Inc. | Media | Subordinated Debt(e) | 8.38% | 10/15/2018 | 27 | 28 | 30 | 0.0% | ||||||||||||||||||||||||||
|
|
||||||||||||||||||||||||||||||||||
| Sirius XM Radio, Inc. | Media | Subordinated Debt(e)(f)(g) | 5.25% | 8/15/2022 | 9 | 9 | 9 | 0.0% | ||||||||||||||||||||||||||
|
|
||||||||||||||||||||||||||||||||||
| SkillSoft Corp. | Software & Services | Subordinated Debt(e) | 11.13% | 6/1/2018 | 1,369 | 1,444 | 1,514 | 0.2% | ||||||||||||||||||||||||||
|
|
||||||||||||||||||||||||||||||||||
| Smile Brands Group, Inc. | Health Care Equipment & Services | Senior Debt(e) | L + 525 | 1.75% | 12/21/2017 | 3,793 | 3,807 | 3,566 | 0.6% | |||||||||||||||||||||||||
|
|
||||||||||||||||||||||||||||||||||
See notes to consolidated financial statements
F-14
Table of Contents
Corporate Capital Trust, Inc. and Subsidiaries
Consolidated Schedule of Investments (continued)
As of December 31, 2012
(in thousands, except share amounts)
| Company (a) | Industry (n) | Investments | Interest Rate |
EURIBOR/ LIBOR |
Maturity Date |
No. Shares/ Principal |
Cost (c) | Fair Value | % of Net Assets |
|||||||||||||||||||||||||||||
|
|
||||||||||||||||||||||||||||||||||||||
| SNL Financial, LLC | Commercial & Professional Services | Senior Debt(e) | L + 425 | 1.25% | 10/23/2018 | 5,667 | 5,650 | 5,672 | 0.9% | |||||||||||||||||||||||||||||
|
|
||||||||||||||||||||||||||||||||||||||
| Springleaf Financial Funding Co. | Diversified Financials | Senior Debt(e)(g) | L + 425 | 1.25% | 5/10/2017 | 2,552 | 2,316 | 2,542 | 0.4% | |||||||||||||||||||||||||||||
|
|
||||||||||||||||||||||||||||||||||||||
| Start CLO Ltd. 2010-6A Class A (KY)(h) | Banks | Structured Products(f)(g)(i)(k) | L + 1600 | 4/1/2014 | 3,310 | 3,335 | 3,443 | 0.6% | ||||||||||||||||||||||||||||||
|
|
||||||||||||||||||||||||||||||||||||||
| Supervalu, Inc. | Food & Staples Retailing | Subordinated Debt(e)(g) | 7.25% | 5/1/2013 | $ | 3,503 | $ | 3,485 | $ | 3,534 | 0.6% | |||||||||||||||||||||||||||
| Subordinated Debt(e)(g) | 7.50% | 11/15/2014 | 5,397 | 5,235 | 5,235 | 0.9% | ||||||||||||||||||||||||||||||||
|
|
|
|
|
|
|
|||||||||||||||||||||||||||||||||
| 8,720 | 8,769 | 1.5% | ||||||||||||||||||||||||||||||||||||
|
|
||||||||||||||||||||||||||||||||||||||
| The Gymboree Corp. | Retailing | Senior Debt(e) | L + 350 | 1.50% | 2/23/2018 | 17,904 | 17,247 | 16,539 | 2.7% | |||||||||||||||||||||||||||||
| Subordinated Debt(e) | 9.13% | 12/1/2018 | 12,818 | 12,135 | 11,408 | 1.9% | ||||||||||||||||||||||||||||||||
|
|
|
|
|
|
|
|||||||||||||||||||||||||||||||||
| 29,382 | 27,947 | 4.6% | ||||||||||||||||||||||||||||||||||||
|
|
||||||||||||||||||||||||||||||||||||||
| The Manitowoc Co., Inc. | Capital Goods | Subordinated Debt(e)(g) | 5.88% | 10/15/2022 | 183 | 184 | 183 | 0.0% | ||||||||||||||||||||||||||||||
|
|
||||||||||||||||||||||||||||||||||||||
| The Neiman Marcus Group, Inc. | Retailing | Senior Debt(e) | L + 350 | 1.25% | 5/16/2018 | 189 | 183 | 189 | 0.0% | |||||||||||||||||||||||||||||
|
|
||||||||||||||||||||||||||||||||||||||
| The SI Organization, Inc. | Capital Goods | Senior Debt(e) | L + 325 | 1.25% | 11/22/2016 | 186 | 176 | 186 | 0.0% | |||||||||||||||||||||||||||||
|
|
||||||||||||||||||||||||||||||||||||||
| The TelX Group, Inc. | Telecommunication Services | Senior Debt(e) | L + 500 | 1.25% | 9/23/2017 | 9,550 | 9,606 | 9,657 | 1.6% | |||||||||||||||||||||||||||||
|
|
||||||||||||||||||||||||||||||||||||||
| Tomkins Air Distribution | Capital Goods | Senior Debt(e) | L + 800 | 1.25% | 5/11/2020 | 3,454 | 3,403 | 3,541 | 0.6% | |||||||||||||||||||||||||||||
|
|
||||||||||||||||||||||||||||||||||||||
| Towergate Finance PLC (UK)(h) | Insurance | Subordinated Debt(f)(g)(GBP) | 10.50% | 2/15/2019 | £ | 4,125 | 6,280 | 6,835 | 1.1% | |||||||||||||||||||||||||||||
|
|
||||||||||||||||||||||||||||||||||||||
| TransUnion, LLC | Diversified Financials | Subordinated Debt(e) | 11.38% | 6/15/2018 | $ | 1,403 | 1,541 | 1,634 | 0.3% | |||||||||||||||||||||||||||||
|
|
||||||||||||||||||||||||||||||||||||||
| Univar, Inc. | Materials | Senior Debt(e) | L + 350 | 1.50% | 6/30/2017 | 953 | 929 | 952 | 0.2% | |||||||||||||||||||||||||||||
|
|
||||||||||||||||||||||||||||||||||||||
| Verisure Holding AB (SE)(h) | Commercial & Professional Services | Senior Debt(f)(g)(EUR) | 8.75% | 9/1/2018 | € | 397 | 484 | 571 | 0.1% | |||||||||||||||||||||||||||||
|
|
||||||||||||||||||||||||||||||||||||||
| Vision Solutions, Inc. | Commercial & Professional Services | Senior Debt(e)(i) | L + 450 | 1.50% | 7/23/2016 | $ | 1,275 | 1,263 | 1,272 | 0.2% | ||||||||||||||||||||||||||||
|
|
||||||||||||||||||||||||||||||||||||||
| VWR Funding, Inc. | Pharmaceuticals, Biotechnology & Life Sciences | Senior Debt(e) Subordinated Debt(e)(f) |
L + 425 7.25% |
|
4/3/2017 9/15/2017 |
|
|
146 5,349 |
|
|
140 5,349 |
|
|
147 5,616 |
|
|
0.0% 0.9% |
| ||||||||||||||||||||
|
|
|
|
|
|
|
|||||||||||||||||||||||||||||||||
| 5,489 | 5,763 | 0.9% | ||||||||||||||||||||||||||||||||||||
|
|
||||||||||||||||||||||||||||||||||||||
| Warner Chilcott Co., LLC (IE) | Pharmaceuticals, Biotechnology & Life Sciences | Subordinated Debt(e)(g)(h) | 7.75% | 9/15/2018 | 1,225 | 1,220 | 1,305 | 0.2% | ||||||||||||||||||||||||||||||
|
|
||||||||||||||||||||||||||||||||||||||
| Wastequip, LLC | Materials | Senior Debt(e)(i) | L + 675 | 1.50% | 6/15/2018 | 11,228 | 10,970 | 11,453 | 1.9% | |||||||||||||||||||||||||||||
|
|
||||||||||||||||||||||||||||||||||||||
| West Corp. | Software & Services | Subordinated Debt(e) | 7.88% | 1/15/2019 | 1,575 | 1,560 | 1,630 | 0.3% | ||||||||||||||||||||||||||||||
|
|
||||||||||||||||||||||||||||||||||||||
| Wilton Brands, LLC | Materials | Senior Debt(e) | L + 625 | 1.25% | 8/30/2018 | 12,824 | 12,581 | 12,984 | 2.1% | |||||||||||||||||||||||||||||
|
|
||||||||||||||||||||||||||||||||||||||
| Zayo Group, LLC | Telecommunication Services | Senior Debt(e) | 8.13% | 1/1/2020 | $ | 2,260 | $ | 2,401 | $ | 2,514 | 0.4% | |||||||||||||||||||||||||||
| Subordinated Debt(e) | 10.13% | 7/1/2020 | 5,000 | 5,324 | 5,688 | 0.9% | ||||||||||||||||||||||||||||||||
|
|
|
|
|
|
|
|||||||||||||||||||||||||||||||||
| 7,725 | 8,202 | 1.3% | ||||||||||||||||||||||||||||||||||||
|
|
||||||||||||||||||||||||||||||||||||||
| Total Non-Control/Non-Affiliate Investments |
|
691,427 | 697,668 | 114.1% | ||||||||||||||||||||||||||||||||||
|
|
|
|
|
|
|
|||||||||||||||||||||||||||||||||
| Short Term Investments—2.2% |
|
|||||||||||||||||||||||||||||||||||||
| Goldman Sachs Financial Square Funds - Prime Obligations Fund | Short Term Investments(e) | 0.08%(l) | 2,049,281 | 2,050 | 2,050 | 0.4% | ||||||||||||||||||||||||||||||||
|
|
||||||||||||||||||||||||||||||||||||||
| State Street Institutional Liquid Reserves Fund | Short Term Investments | 0.16%(l) | 11,152,887 | 11,153 | 11,153 | 1.8% | ||||||||||||||||||||||||||||||||
|
|
||||||||||||||||||||||||||||||||||||||
| Total Short Term Investments |
|
13,203 | 13,203 | 2.2% | ||||||||||||||||||||||||||||||||||
|
|
|
|
|
|
|
|||||||||||||||||||||||||||||||||
See notes to consolidated financial statements
F-15
Table of Contents
Corporate Capital Trust, Inc. and Subsidiaries
Consolidated Schedule of Investments (continued)
As of December 31, 2012
(in thousands, except share amounts)
| Company (a) | Industry (n) | Investments | Interest Rate |
EURIBOR/ LIBOR |
Maturity Date |
No. Shares/ Principal |
Cost (c) | Fair Value | % of Net Assets |
|||||||||||||||||||||||||||
|
|
||||||||||||||||||||||||||||||||||||
| TOTAL INVESTMENTS —116.3%(m) |
|
$ | 704,630 | 710,871 | 116.3% | |||||||||||||||||||||||||||||||
|
|
|
|
|
|
|
|||||||||||||||||||||||||||||||
| LIABILITIES IN EXCESS OF OTHER ASSETS—(16.3%) |
|
(99,387 | ) | (16.3 | )% | |||||||||||||||||||||||||||||||
| NET ASSETS—100.0% |
|
$ | 611,484 | 100.0% | ||||||||||||||||||||||||||||||||
| Derivative Instruments—0.20% |
|
|||||||||||||||||||||||||||||||||||
| Total return swaps (Note 4) (g) | Total return swaps | N/A | 1/15/2016 | N/A | $ | — | $ | 1,349 | 0.2% | |||||||||||||||||||||||||||
|
|
||||||||||||||||||||||||||||||||||||
| Foreign currency forward contracts (Note 4) (g) | Foreign currency forward contracts | N/A | 1/2013 | N/A | — | (147 | ) | (0.0 | )% | |||||||||||||||||||||||||||
|
|
||||||||||||||||||||||||||||||||||||
| Total Derivative Instruments |
|
— | $ | 1,202 | 0.2% | |||||||||||||||||||||||||||||||
|
|
|
|
|
|
|
|||||||||||||||||||||||||||||||
| * | Non-income producing security. |
| (a) | Security may be an obligation of one or more entities affiliated with the named company. |
| (b) | Denominated in U.S. Dollars unless otherwise noted. |
| (c) | Represents amortized cost for debt securities and cost for common stock. |
| (d) | Non-Control/Non-Affiliate investments are defined by the Investment Company Act of 1940, as amended (“1940 Act”) as investments that are neither Control Investments nor Affiliate Investments. Controlled investments are defined by the 1940 Act as investments in which more than 25% of the voting securities are owned or where the ability to nominate greater than 50% of the board representation is maintained. Affiliate investments are defined by the 1940 Act as investments in which between 5% and 25% of the voting securities are owned and the investments are not classified as Controlled investments. |
| (e) | Security or portion thereof is held within CCT Funding, LLC and is pledged as collateral supporting the amounts outstanding under the revolving credit facility with Deutsche Bank. |
| (f) | This security was acquired in a transaction that was exempt from the registration requirements of the Securities Act of 1933, as amended (the “Securities Act”), pursuant to Rule 144A thereunder. This security may be resold only in transactions that are exempt from the registration requirements of the Securities Act, normally to qualified institutional buyers. |
| (g) | The investment is not a qualifying asset as defined in Section 55(a) under the Investment Company Act of 1940, as amended, or the 1940 Act. A business development company may not acquire any asset other than qualifying assets, unless, at the time the acquisition is made, qualifying assets represent at least 70% of the company’s total assets. The Company calculates its compliance with the qualifying assets test on a “look through” basis by disregarding the value of the Company’s total return swaps and treating each loan underlying the total return swaps as either a qualifying assets or non-qualifying asset based on whether the obligor is an eligible portfolio company. On this basis, 79.3% of the Company’s total assets represented qualifying assets as of December 31, 2012. |
| (h) | A portfolio company domiciled in a foreign country. |
| (i) | Investments classified as Level 3 whereby fair value was determined by the Company’s Board of Directors (see Note 2). |
| (j) | Position or portion thereof unsettled as of December 31, 2012. |
| (k) | A portfolio company investment structured as a credit-linked floating rate note. |
| (l) | 7-day effective yield as of December 31, 2012. |
| (m) | As of December 31, 2012, the aggregate gross unrealized appreciation for all securities in which there was an excess of value over tax cost was $15,000; the aggregate gross unrealized depreciation for all securities in which there was an excess of tax cost over value was $8,759; the net unrealized appreciation was $6,241; the aggregate cost of securities for Federal income tax purposes was $704,630. |
| (n) | Unaudited. |
See notes to consolidated financial statements
F-16
Table of Contents
Corporate Capital Trust, Inc. and Subsidiaries
Consolidated Schedule of Investments (continued)
As of December 31, 2012
(in thousands, except share amounts)
Abbreviations:
EUR - Euro; principal amount is denominated in Euros currency. €1 / US $1.320 as of December 31, 2012.
GBP - British Pound Sterling; principal amount is denominated in Pound Sterling. £1 / US $1.624 as of December 31, 2012.
DE - Germany
ES - Spain
IE - Ireland
KY - Cayman Islands
LU - Luxembourg
MX - Mexico
SE - Sweden
UK - United Kingdom
L = LIBOR - London Interbank Offered Rate, typically 3-Month
PIK - Payment-in-kind
See notes to consolidated financial statements
F-17
Table of Contents
CORPORATE CAPITAL TRUST, INC. AND SUBSIDIARIES
Notes to Consolidated Financial Statements ($ amounts in thousands, except share and per share amounts)
1. Principal Business and Organization
Corporate Capital Trust, Inc. (the “Company”) was incorporated under the general corporation laws of the State of Maryland on June 9, 2010. The Company is a non-diversified closed-end management investment company and it is regulated as a business development company (“BDC”) under the Investment Company Act of 1940 (the “40 Act”). The Company’s investment objective is to provide its shareholders with current income and, to a lesser extent, long-term capital appreciation, by investing primarily in the debt of privately owned U.S. companies with a focus on originated transactions sourced through the networks of its advisors. The Company commenced business operations on June 17, 2011 and it commenced investment operations on July 1, 2011. The Company has elected to be treated as a regulated investment company, (“RIC”), under the Internal Revenue Code of 1986, as amended (the “Code”) and operates in a manner so as to qualify for the tax treatment applicable to RICs.
The Company is externally managed by CNL Fund Advisors Company (“CNL”) and KKR Asset Management LLC (“KKR”) (collectively the “Advisors”), which are responsible for sourcing potential investments, analyzing and conducting due diligence on prospective investment opportunities, structuring investments and monitoring the Company’s investment portfolio on an ongoing basis. Both Advisors are registered as investment advisers with the Securities and Exchange Commission (“SEC”). CNL also provides the administrative services necessary for the Company to operate.
The Company is currently offering and selling shares of its common stock pursuant to a registration statement on Form N-2 (Registration No. 333-189544) (the “Follow-On Registration Statement”) covering its follow-on continuous public offering of up to 209 million shares of common stock for an approximate maximum offering amount of $2.3 billion (the “Follow-On Offering”). The Company filed the Follow-On Registration Statement on June 21, 2013, and it was declared effective by the SEC on November 1, 2013. Immediately prior to the commencement of the Follow-On Offering, the Company terminated its initial continuous public offering (the “Initial Offering”). Through the termination date of the Initial Offering, the Company sold approximately 141 million shares of common stock, including reinvestment of distributions, for total gross proceeds of approximately $1.5 billion. The Initial Offering and Follow-On Offering are collectively referred to as the “Offerings”.
As of December 31, 2013, the Company had three wholly owned financing subsidiaries. CCT Funding LLC (“CCT Funding”) and Paris Funding LLC (“Paris Funding”) were established on July 15, 2011 and August 13, 2013, respectively, both for the purpose of arranging secured, revolving credit facilities with banks and to borrow money to invest in portfolio companies. Halifax Funding LLC (“Halifax Funding”) was established on October 11, 2012 for the purpose of entering into total return swaps (“TRS”).
2. Significant Accounting Policies
Basis of Presentation and Principles of Consolidation - The accompanying financial statements of the Company are prepared in accordance with the instructions to Form 10-K and accounting principles generally accepted in the United States of America (“GAAP”). The Company consolidates the results of the Company’s subsidiaries in its consolidated financial statements. All intercompany account balances and transactions have been eliminated in consolidation.
Use of Estimates - The preparation of consolidated financial statements in conformity with GAAP requires management to make estimates and assumptions that affect (i) the reported amounts of assets and liabilities at the date of the consolidated financial statements, (ii) the reported amounts of income and expenses during the reported period and (iii) disclosure of contingent assets and liabilities at the date of the consolidated financial statements. Actual results could differ from those estimates.
Cash and Cash Equivalents - Cash and cash equivalents consist of demand deposits, foreign currency, and highly liquid investments with original maturities of three months or less.
Valuation of Investments - The Company measures the value of its investments in accordance with Accounting Standards Codification Topic 820, Fair Value Measurements and Disclosure (“ASC Topic 820”), issued by the Financial Accounting Standards Board (“FASB”). Fair value is the price that would be received to sell an asset or paid to transfer a liability in an orderly transaction between market participants at the measurement date.
ASC Topic 820 also defines hierarchical levels directly related to the amount of subjectivity associated with the inputs to fair valuations of these assets and liabilities, and the hierarchical levels are described as follows:
Level 1 – Quoted prices are available in active markets for identical investments as of the reporting date. Publicly listed equities and debt securities, publicly listed derivatives, money market fund/ short term investment funds and foreign currency are generally included in Level 1. The Company does not adjust the quoted price for these investments.
F-18
Table of Contents
Level 2 – Pricing inputs are other than quoted prices in active markets, which are either directly or indirectly observable as of the reporting date, and fair value is determined through the use of models or other valuation methodologies. In certain cases, debt and equity securities are valued on the basis of prices from orderly transactions for similar investments in active markets between market participants and provided by reputable dealers or independent pricing services. In determining the value of a particular investment, pricing services may use certain information with respect to transactions in such investments, quotations from dealers, pricing matrices, market transactions in comparable investments, and various relationships between investments. Investments generally included in this category are corporate bonds and loans, convertible debt indexed to publicly listed securities, foreign currency forward contracts and certain over-the-counter derivatives.
Level 3 – Pricing inputs are unobservable for the investment and include situations where there is little, if any, market activity for the investment. The inputs into the determination of fair value require significant judgment or estimation. Investments generally included in this category are total return swap agreements, corporate bonds and loans, common and preferred stock investments, and equity options that lack observable market pricing.
In certain cases, the inputs used to measure fair value may fall into different levels of the fair value hierarchy. In such cases, an investment’s level within the fair value hierarchy is based on the lowest level of input that is significant to the fair value measurement. The Company’s assessment of the significance of a particular input to the fair value measurement in its entirety requires judgment, and it considers factors specific to the investment.
Investments for which market quotations are readily available are valued using market quotations, which are generally obtained from independent pricing services, broker-dealers or market makers. With respect to the Company’s portfolio investments for which market quotations are not readily available, the Company’s board of directors is responsible for determining in good faith the fair value in accordance with the valuation policy approved by the board of directors, based on, among other things, the input of the Company’s Advisors, audit committee and independent third-party valuation firms under a valuation policy and a consistently applied valuation process. The Company’s board of directors has the final responsibility for reviewing and approving, in good faith, the Company’s determination of the fair value of its investments for which market quotations are not readily available.
The board of directors makes this fair value determination on a quarterly basis and any other time when a decision regarding the fair value of the portfolio investments is required. A determination of fair value involves subjective judgments and estimates. Due to the inherent uncertainty of determining the fair value of portfolio investments that do not have a readily available market value, the fair value of the investments may differ significantly from the values that would have been used had a readily available market value existed for such investments, and the differences could be material. Further, such investments are generally less liquid than publicly traded securities. If the Company was required to liquidate a portfolio investment that does not have a readily available market value in a forced or liquidation sale, the Company could realize significantly less than the value recorded by Company.
The Company and its Advisors undertake a multi-step valuation process each quarter for debt and equity securities whose market prices are not otherwise readily available, as described below:
| • | The quarterly valuation process initially begins with each portfolio company or investment being initially valued by KKR (internal valuation) and/or the Company’s independent third party valuation firm (external valuation) that provides a valuation range. |
| • | Valuation recommendations are formulated and documented by KKR and reviewed by KKR’s valuation committee. The KKR valuation committee then provides its valuation recommendation for each investment, along with supporting documentation, to CNL and the Company where the valuation recommendations and internal/external valuation documentation are reviewed by CNL and the Company’s management. |
| • | The Company’s audit committee then reviews the valuation recommendations and supporting documentation. |
| • | The Company’s board of directors then discusses the investment valuation recommendations with the Advisors and determines the fair value of these investments in good faith. |
Depending on the relative liquidity in the markets for certain assets, the Company may transfer assets to Level 3 if it determines that observable quoted prices, obtained directly or indirectly, are not available. The valuation techniques used for the assets and liabilities that are valued using Level 3 of the fair value hierarchy are described below.
| • | Corporate Debt Securities and Corporate Loans, at Estimated Fair Value: Corporate debt securities and corporate loans, at estimated fair value are initially valued at transaction price and are subsequently valued using market data for similar instruments (e.g., recent transactions or indicative broker quotes), comparisons to benchmark derivative indices or valuation models. Valuation models are based on yield analysis and discounted cash flow techniques, where the key inputs are based on relative value analyses and the assignment of risk-adjusted discounted rates, based on the analysis of similar instruments from similar issuers. In addition, an illiquidity discount is applied where appropriate. |
F-19
Table of Contents
| • | Equity Investments, at Estimated Fair Value: Equity investments, at estimated fair value, are initially valued at transaction price and are subsequently valued using observable market prices, if available, or internally developed models in the absence of readily observable market prices. Valuation models are generally based on market and income (discounted cash flow) approaches, in which various internal and external factors are considered. Factors include key financial inputs and recent public and private transactions for comparable investments. Key inputs used for the discounted cash flow approach include the weighted average cost of capital and assumed inputs used to calculate terminal values, such as earnings before interest, taxes, depreciation and amortization (“EBITDA”) exit multiples. The fair value recorded for a particular investment will generally be within the range suggested by the two approaches. Upon completion of the valuations conducted, an illiquidity discount is applied where appropriate. |
| • | Total Return Swaps, at Estimated Fair Value: The Company values its TRS in accordance with the TRS agreements between the Company (or its wholly owned subsidiary) and the TRS counter-party, which collectively established the TRS. Pursuant to the TRS agreements, the value of the TRS is based on (i) the increase or decrease in the value of the TRS reference assets relative to the notional amounts, together with (ii) accrued interest income and fee income, (iii) TRS financing costs on the TRS settled notional amount, and (iv) certain other expenses incurred under the TRS. The TRS reference assets are valued pursuant to the valuation algorithm specified in the TRS Agreements, including reliance on indicative bid prices provided by independent third-party pricing services. Bid prices reflect the highest price that market participants may be willing to pay. On a quarterly basis, the Company’s management reviews, tests and compares (i) the indicative bid prices assigned to each TRS reference asset by the TRS counter-party, based on the inputs provided by third-party pricing services with (ii) pricing inputs that are independently sourced by the Company’s management and/or its Advisors from third-party pricing services. Additionally, the Company’s management reviews the calculations of both collected and accrued interest, TRS financing costs, and realized gains and losses that also determine the aggregate fair value of the TRS. For additional disclosures on the Company’s TRS, including quantitative disclosures of the current period conclusions of the fair value components, refer to Note 4. |
Key unobservable inputs that have a significant impact on the Company’s Level 3 valuations as described above are included in Note 5. The Company utilizes several unobservable pricing inputs and assumptions in determining the fair value of its Level 3 investments. These unobservable pricing inputs and assumptions may differ by asset and in the application of the Company’s valuation methodologies. The reported fair value estimates could vary materially if the Company had chosen to incorporate different unobservable pricing inputs and other assumptions.
Security Transactions, Realized/Unrealized Gains or Losses, and Income Recognition - Security transactions are recorded on a trade-date basis. The Company measures realized gains or losses from the repayment or sale of investments using the specific identification method. The amortized cost basis of investments includes (i) the original cost and (ii) adjustments for the accretion/amortization of market discounts and premiums, original issue discount and loan origination fees. The Company reports changes in fair value of investments that are measured at fair value as a component of net change in unrealized appreciation (depreciation) on investments in the condensed consolidated statements of operations.
Interest income is recorded on an accrual basis and includes amortization of premiums to par value and accretion of discounts to par value. Discounts and premiums to par value on securities purchased are accreted/amortized into interest income over the life of the respective security using the effective interest method. Premiums and discounts are determined based on the cash flows expected to be collected for a particular investment. In its role as the Company’s investment adviser, KKR may provide assistance to portfolio companies and in return may receive fees for capital structuring services. KKR is obligated to remit to the Company any earned capital structuring fees based on the pro-rata portion of the Company’s investment. These fees are generally non-recurring and are recognized as earned revenue by the Company upon closing of the associated investment. Loan origination, closing, commitment and other fees received directly from borrowers in connection with the closing of investments are accreted over the contractual life of the loan based on the effective interest method as interest income. Upon prepayment of a debt investment, any prepayment penalties and unamortized loan fees and discounts are recorded as interest income.
The Company has investments in debt securities which contain a contractual payment-in-kind (“PIK”) interest provision. PIK interest computed at the contractual rate specified in the investment’s credit agreement is accrued into income and reflected as interest receivable up to the capitalization date. PIK investments offer issuers either the option or the obligation at each interest payment date of making payments in cash or in additional securities. When additional securities are received, they typically have the same terms, including maturity dates and interest rates as the original securities issued. On these payment dates, the Company capitalizes the accrued interest receivable as additional principal due from the borrower. PIK generally becomes due at maturity of the investment or upon the investment being called by the issuer. If the portfolio company valuation indicates a value of the PIK investment that is not sufficient to cover the contractual PIK interest, the Company will not accrue PIK interest income on the PIK investment and will record an allowance for any accrued PIK interest receivable as a reduction of interest or dividend income in the period the Company determines it is not collectible. To maintain the Company’s status as a RIC, PIK interest income, which is considered taxable income, could create an additional distribution requirement, even though the Company has not yet collected the cash.
F-20
Table of Contents
Dividend income on preferred equity securities is recorded as dividend income on an accrual basis to the extent that such amounts are payable by the portfolio company and are expected to be collected. Dividend income on common equity securities is recorded on the record date for private portfolio companies or on the ex-dividend date for publicly traded portfolio companies.
Loans or debt securities are placed on non-accrual status when principal or interest payments are at least 90 days past due or when there is reasonable doubt that principal or interest will be collected. Generally, accrued interest is reversed when a loan or a debt security is placed on non-accrual status. Interest payments received on non-accrual loans or debt securities may be recognized as income or applied to principal depending upon management’s judgment. Non-accrual loans and debt securities are restored to accrual status when past due principal and interest is paid and, in management’s judgment, are likely to remain current. The Company may make exceptions to this treatment if the loan has sufficient collateral value and is in the process of collection. The contractual interest associated with a loan or debt security that has been placed on non-accrual status might increase taxable income, which could create an additional distribution requirement to maintain the Company’s status as a RIC.
Derivative Instruments - The Company’s derivative instruments include foreign currency forward contracts and total return swaps. The Company marks the value of its derivative instruments to market value through net change in unrealized appreciation (depreciation) on derivative instruments in the consolidated statements of operations. Unrealized appreciation (depreciation) on the TRS is composed of the net accrued interest income and accrued interest expense owed and the overall change in fair value of the TRS reference assets. Realized gains and losses that occur upon the cash settlement of the derivative instruments are included in net realized gain (loss) on derivative instruments in the condensed consolidated statements of operations. Realized gains and losses on the TRS are composed of any realized gains or losses on the TRS reference assets and the net interest received or paid on the quarterly TRS settlement date.
Deferred Financing Costs - Deferred financing costs represent fees and other direct costs incurred in connection with arranging the Company’s borrowings and total return swaps. These amounts are initially recorded as prepaid and deferred expenses on the condensed consolidated statements of assets and liabilities and then subsequently amortized over the contractual term of the credit facilities and total return swap agreements as interest expense.
Paid In Capital - The Company records the proceeds from the sale of its common stock on a net basis to (i) capital stock and (ii) paid in capital in excess of par value, excluding all commissions and marketing support fees.
Foreign Currency Translation, Transactions and Gains/Losses - Foreign currency amounts are translated into U.S. dollars on the following basis: (i) at the exchange rate on the last business day of the reporting period for the fair value of investment securities, other assets and liabilities; and (ii) at the rates of exchange prevailing on the respective recording dates for the purchase and sale of investment securities, income, expenses, gains and losses.
Net assets and fair values are presented based on the applicable foreign exchange rates described above and the Company does not isolate that portion of the results of operations resulting from changes in foreign exchange rates on investments from the fluctuations arising from changes in fair values of investments held; therefore the fluctuations related to foreign exchange rate conversion are included with the net realized gain (loss) and unrealized appreciation (depreciation) on investments.
Net realized foreign exchange gains or losses arise from activity in foreign currency forward contracts, sales of foreign currency, currency gains or losses realized between the trade and settlement dates on securities transactions, and the difference between the amounts of dividends, interest, and foreign withholding taxes recorded by the Company and the U.S. dollar equivalent of the amounts actually received or paid by the Company. Unrealized appreciation (depreciation) from currency translation for foreign currency forward contracts is included in net change in unrealized appreciation (depreciation) on derivative instruments on the consolidated statements of operations and is included with unrealized appreciation (depreciation) on derivative instruments on the consolidated statements of assets and liabilities. Unrealized appreciation (depreciation) from foreign currency translation for other receivables or payables is presented as net change in unrealized appreciation (depreciation) on foreign currency translation in the consolidated statements of operations.
Management Fees - The Company accrues for the base management fee (recorded as investment advisory fees) and performance-based incentive fees, including (i) a subordinated incentive fee on income and (ii) an incentive fee on capital gains. The Company records the liability for the incentive fee on capital gains based on a hypothetical liquidation of its investment portfolio at the end of each reporting period. Therefore the accrual for incentive fee on capital gains includes the recognition of incentive fee on both net realized gains and net unrealized appreciation, if any, although any such incentive fee associated with net unrealized appreciation is neither earned nor payable to the Advisors until net unrealized appreciation is realized as net realized gains. Additionally the determination of whether the accrued incentive fee associated with net realized gains is earned and payable to the Advisors can only
F-21
Table of Contents
be made at the end of the calendar year. The two components of performance-based incentive fees are combined and expensed on the consolidated statements of operations and accrued on the consolidated statements of assets and liabilities as accrued performance-based incentive fees.
Organization and Offering Expenses - Organization expenses, including reimbursement payments to Advisors, are expensed on the Company’s consolidated statements of operations. Continuous offering expenses, including reimbursement payments to Advisors, but excluding commission and marketing support fees, are accumulated monthly and capitalized on the consolidated statements of assets and liabilities as deferred offering expenses and then subsequently expensed over a 12-month period.
Earnings per Share - Earnings per share is calculated based upon the weighted average number of shares of common stock outstanding during the reporting period.
Distributions - Distributions are generally declared by the Company’s board of directors each calendar quarter and recognized as distribution liabilities on the record date. Distributions are paid monthly. The Company has adopted a distribution reinvestment plan that provides for reinvestment of distributions on behalf of shareholders. Shareholders who have elected to participate in the distribution reinvestment plan will have their cash distribution automatically reinvested in additional shares of common stock at a price per share equivalent to the public offering price on the distribution payment date, net of commissions and marketing support fees.
Federal Income Taxes - The Company has elected to be treated for federal income tax purposes, and intends to maintain its qualification as RIC under Subchapter M of the Code. Generally, a RIC is not subject to federal income taxes on distributed income and gains if it distributes at least 90% of “Investment Company Taxable Income,” as defined in the Code. The Company intends to distribute sufficient dividends to maintain its RIC status each year and it does not anticipate paying a material level of federal income taxes.
The Company is also generally subject to nondeductible federal excise taxes if it does not distribute an amount at least equal to the sum (i) 98% of net ordinary income for a calendar year, (ii) 98.2% of the Company’s capital gains in excess of capital losses for the one-year period generally ending on October 31 of the calendar year and (iii) any ordinary income and net capital gains for preceding years that were not distributed during such years and on which the Company paid no federal income tax. The Company, at its discretion, may carry forward taxable income in excess of calendar year distributions and pay a 4% federal excise tax on this excess taxable income.
The Company recognizes in its consolidated financial statements the effect of a tax position when it is more likely than not, based on the technical merits, that the position will be sustained upon examination. Tax benefits of positions not deemed to meet the more-likely-than-not threshold would be recorded as a tax expense in the current year. The Company did not have any uncertain tax positions that met the recognition or measurement criteria of ASC 740-10-25, Income Taxes – Overall –Recognition, nor did it have any unrecognized tax benefits as of the periods presented herein. Although the Company files federal and state tax returns, its major tax jurisdiction is federal.
Book and tax basis differences relating to permanent book and tax differences are reclassified among the Company’s capital accounts, as appropriate. Additionally, the tax character of distributions is determined in accordance with the Code which differs from GAAP. See Note 13 to the consolidated financial statements.
Recent Accounting Pronouncements - In January 2013, the FASB clarified the scope of offsetting disclosure requirements which require an entity to disclose information about offsetting and related arrangements to enable users of its financial statements to evaluate the effect or potential effect of netting arrangements on an entity’s financial position, including the effect or potential effect of rights of setoff associated with certain financial instruments and derivative instruments. The guidance is effective for fiscal years beginning on or after January 1, 2013, and interim periods within those annual periods, with retrospective disclosures required for all comparative periods presented. The guidance did not have a material impact on the consolidated financial statements.
3. Investments
The Company is engaged in a strategy to invest primarily in the debt of privately owned U.S. companies. The primary investment concentrations include (i) senior debt securities and (ii) subordinated debt securities. The Company’s investments may, in some cases, be accompanied by warrants, options or other forms of equity participation. The Company may separately purchase common or preferred equity interests in transactions. The Company may also invest in structured products such as collateralized loan obligations. The fair value of the Company’s investments will generally fluctuate with, among other things, changes in prevailing interest rates, the general supply of, and demand for, debt capital among private and public companies, general domestic and global economic conditions, the condition of certain financial markets, developments or trends in any particular industry and changes in the financial condition and credit quality of each security’s issuer.
F-22
Table of Contents
Investment purchases, sales and principal payments/paydowns are summarized below for the years ended December 31, 2013 and 2012. These purchase and sale amounts exclude short-term investments (i.e. money market fund investments) and derivative instruments.
| Year Ended December 31, | ||||||||
| 2013 | 2012 | |||||||
| Investment purchases, at cost |
$ | 2,090,370 | $ | 991,952 | ||||
| Investment sales, proceeds |
807,216 | 358,598 | ||||||
| Principal payments/paydown proceeds |
117,879 | 51,932 | ||||||
As of December 31, 2013, debt investments on non-accrual status represented 0.7% and 0.6% of total investments on a cost and fair value basis, respectively. As of December 31, 2012, there were no debt investments on non-accrual status.
As of December 31, 2013, the Company’s investment portfolio consisted of the following:
| Percentage of | Percentage of | |||||||||||||||
| Asset Category | Cost | Fair Value | Portfolio | Net Assets | ||||||||||||
| Senior debt |
$ | 1,452,592 | $ | 1,474,492 | 76.6% | 103.1% | ||||||||||
| Subordinated debt |
305,239 | 370,131 | 19.2 | 25.9 | ||||||||||||
| Structured products |
55,520 | 55,575 | 2.9 | 3.9 | ||||||||||||
| Equity/Other |
24,250 | 24,671 | 1.3 | 1.7 | ||||||||||||
|
|
|
|
|
|
|
|
|
|||||||||
| Subtotal |
1,887,601 | 1,924,869 | 100.0% | 134.6 | ||||||||||||
|
|
|
|||||||||||||||
| Short term investments |
149,903 | 149,903 | 10.5 | |||||||||||||
|
|
|
|
|
|
|
|||||||||||
| Total investments |
$ | 2,037,504 | $ | 2,074,772 | 145.1% | |||||||||||
|
|
|
|
|
|
|
|||||||||||
|
As of December 31, 2012, the Company’s investment portfolio consisted of the following:
|
| |||||||||||||||
| Percentage of | Percentage of | |||||||||||||||
| Asset Category | Cost | Fair Value | Portfolio | Net Assets | ||||||||||||
| Senior debt |
$ | 519,196 | $ | 522,443 | 74.9% | 85.4% | ||||||||||
| Subordinated debt |
163,646 | 166,345 | 23.8 | 27.2 | ||||||||||||
| Structured products |
3,335 | 3,443 | 0.5 | 0.6 | ||||||||||||
| Equity/Other |
5,250 | 5,437 | 0.8 | 0.9 | ||||||||||||
|
|
|
|
|
|
|
|
|
|||||||||
| Subtotal |
691,427 | 697,668 | 100.0% | 114.1 | ||||||||||||
|
|
|
|||||||||||||||
| Short term investments |
13,203 | 13,203 | 2.2 | |||||||||||||
|
|
|
|
|
|
|
|||||||||||
| Total investments |
$ | 704,630 | $ | 710,871 | 116.3% | |||||||||||
|
|
|
|
|
|
|
|||||||||||
F-23
Table of Contents
The industry composition, geographic dispersion, and local currencies of the Company’s investment portfolio at fair value, excluding short-term investments and derivative instruments, as of December 31, 2013 and December 31, 2012 was as follows:
| Industry Composition |
December 31, 2013 | December 31, 2012 | ||||||
| Consumer Durables & Apparel |
19.0% | 1.0% | ||||||
| Technology Hardware & Equipment |
12.4 | 7.8 | ||||||
| Retailing |
10.6 | 9.2 | ||||||
| Health Care Equipment & Services |
9.3 | 6.2 | ||||||
| Software & Services |
7.7 | 9.1 | ||||||
| Materials |
7.1 | 9.9 | ||||||
| Energy |
6.1 | 0.9 | ||||||
| Capital Goods |
5.4 | 13.7 | ||||||
| Food, Beverage & Tobacco |
5.2 | 1.3 | ||||||
| Insurance |
3.5 | 6.2 | ||||||
| Commercial & Professional |
3.5 | 3.4 | ||||||
| Media |
3.5 | 11.0 | ||||||
| Diversified Financials |
2.9 | 2.5 | ||||||
| Food & Staples Retailing |
1.7 | 1.9 | ||||||
| Telecommunication Services |
1.7 | 4.1 | ||||||
| Remaining Industries |
0.4 | 11.8 | ||||||
|
|
|
|
|
|||||
| Total |
100.0% | 100.0% | ||||||
|
|
|
|
|
|||||
| Geographic Dispersion (1) |
||||||||
| United States |
76.9% | 94.4% | ||||||
| Sweden |
5.9 | 0.1 | ||||||
| Luxembourg |
4.4 | 1.3 | ||||||
| Ireland |
3.1 | 0.3 | ||||||
| Netherlands |
2.4 | - | ||||||
| United Kingdom |
2.2 | 2.2 | ||||||
| Remaining Countries |
5.1 | 1.7 | ||||||
|
|
|
|
|
|||||
| Total |
100.0% | 100.0% | ||||||
|
|
|
|
|
|||||
| Local Currency |
||||||||
| U.S. Dollar |
84.0% | 97.3% | ||||||
| Euro |
11.2 | 1.7 | ||||||
| British Pound Sterling |
2.0 | 1.0 | ||||||
| New Zealand Dollar |
2.0 | - | ||||||
| Swedish Krona |
0.8 | - | ||||||
|
|
|
|
|
|||||
| Total |
100.0% | 100.0% | ||||||
|
|
|
|
|
|||||
| (1) | The geographic dispersion is determined by the portfolio company’s country of domicile or the jurisdiction of the security issuer. |
During the years ended December 31, 2013 and 2012, the Company did not hold any non-controlled investments where it owned 5% or more of a portfolio company’s outstanding voting securities as investments in “affiliated” companies. In addition, the Company did not hold any investments in “controlled” companies where it owned more than 25% of a portfolio company’s outstanding voting securities.
F-24
Table of Contents
| 4. | Derivative Instruments |
The following is a summary of the fair value and location of the Company’s derivative instruments on the consolidated statements of assets and liabilities:
| Fair Value | ||||||||||
| As of December 31, | ||||||||||
| Derivative Instrument | Statement Location | 2013 | 2012 | |||||||
| Foreign currency forward contracts |
Unrealized depreciation on derivative instruments | $ | (3,181) | $ | (147) | |||||
| TRS |
Unrealized appreciation on derivative instruments | 1,861 | 1,349 | |||||||
|
|
|
|
|
|||||||
| Total |
$ | (1,320) | $ | 1,202 | ||||||
|
|
|
|
|
|||||||
|
Realized and unrealized gains and losses on derivative instruments recorded by the Company for the years ended December 31, 2013 and 2012 are in the following location on the consolidated statements of operations: |
| |||||||||
| Realized Gain (Loss) | ||||||||||
| Year Ended December 31, | ||||||||||
| Derivative Instrument | Statement Location | 2013 | 2012 | |||||||
| Foreign currency forward contracts |
Net realized loss on derivative instruments | $ | (1,174) | $ | (433) | |||||
| TRS |
Net realized gain on derivative instruments | 10,309 | - | |||||||
|
|
|
|
|
|||||||
| Total |
$ | 9,135 | $ | (433) | ||||||
|
|
|
|
|
|||||||
| Unrealized Gain (Loss) | ||||||||||
| Year Ended December 31, | ||||||||||
| Derivative Instrument | Statement Location | 2013 | 2012 | |||||||
| Foreign currency forward contracts |
Net change in unrealized depreciation on derivative instruments |
$ | (3,034) | $ | (147) | |||||
| TRS |
Net change in unrealized appreciation on derivative instruments |
512 | 1,349 | |||||||
|
|
|
|
|
|||||||
| Total |
$ | (2,522) | $ | 1,202 | ||||||
|
|
|
|
|
|||||||
Foreign Currency Forward Contracts:
The Company may enter into foreign currency forward contracts from time to time to facilitate settlement of purchases and sales of investments denominated in foreign currencies and to economically hedge the impact that an adverse change in foreign exchange rates would have on the value of the Company’s investments denominated in foreign currencies. A foreign currency forward contract is a commitment to purchase or sell a foreign currency at a future date at a negotiated forward rate. These contracts are marked-to-market by recognizing the difference between the contract exchange rate and the current market exchange rate as unrealized appreciation or depreciation. Realized gains or losses are recognized when forward contracts are settled. Risks may arise as a result of the potential inability of the counterparties to meet the terms of their contracts; the Company attempts to limit counterparty risk by only dealing with well known counterparties.
F-25
Table of Contents
At December 31, 2013, the details of the Company’s open foreign currency forward contracts were as follows:
| Unrealized | ||||||||||||||||||
| Foreign Currency |
Settlement Date |
Amount and Transaction |
US$ Value at Settlement Date |
US$ Value at December 31, 2013 |
Appreciation (Depreciation) |
|||||||||||||
| EUR |
Jan. 3, 2014 | € | 2,100 Sold | $ | 2,745 | $ | 2,889 | $ | (144) | |||||||||
| EUR |
Jan. 10, 2014 | € | 8,100 Sold | 10,747 | 11,143 | (396) | ||||||||||||
| EUR |
Jan. 8, 2015 | € | 17,000 Sold | 22,919 | 23,402 | (483) | ||||||||||||
| EUR |
Jan. 8, 2015 | € | 43,500 Sold | 59,608 | 59,882 | (274) | ||||||||||||
| EUR |
Jan. 8, 2015 | € | 2,100 Sold | 2,899 | 2,891 | 8 | ||||||||||||
| GBP |
Jan. 10, 2014 | £ | 15,100 Sold | 23,701 | 25,004 | (1,303) | ||||||||||||
| GBP |
Jan. 10, 2014 | £ | 8,498 Sold | 13,484 | 14,071 | (587) | ||||||||||||
| NZD |
Jul. 23, 2014 | N$ | 4,000 Sold | 3,235 | 3,237 | (2) | ||||||||||||
|
|
|
|
|
|
|
|||||||||||||
| Total |
$ | 139,338 | $ | 142,519 | $ | (3,181) | ||||||||||||
|
|
|
|
|
|
|
|||||||||||||
| At December 31, 2012, the details of the Company’s open foreign currency forward contracts were as follows: | ||||||||||||||||||
| Unrealized | ||||||||||||||||||
| Foreign Currency |
Settlement Date |
Amount and Transaction |
US$ Value at Settlement Date |
US$ Value at December 31, 2012 |
Appreciation (Depreciation) |
|||||||||||||
| EUR |
Jan. 3, 2013 | € | 2,300 Sold | $ | 2,918 | $ | 3,036 | $ | (118) | |||||||||
| EUR |
Jan. 31, 2013 | € | 6,242 Sold | 8,249 | 8,240 | 9 | ||||||||||||
| GBP |
Jan. 18, 2013 | £ | 4,255 Sold | 6,874 | 6,912 | (38) | ||||||||||||
|
|
|
|
|
|
|
|||||||||||||
| Total |
$ | 18,041 | $ | 18,188 | $ | (147) | ||||||||||||
|
|
|
|
|
|
|
|||||||||||||
Options:
The Company holds equity options in certain portfolio companies to enhance investment returns in connection with its primary lending activities. In purchasing options, the Company bears the risk of an unfavorable change in the value of the underlying equity interest. The aggregate fair value of options as of December 31, 2013 represents 1.1% of the Company’s net assets. The Company did not hold any equity options as of December 31, 2012.
Total Return Swaps:
On November 15, 2012, Halifax Funding entered into the TRS with the Bank of Nova Scotia (“BNS” or “counterparty”).
The TRS arrangement with BNS consists of a set of TRS agreements. Pursuant to the terms of the TRS, Halifax Funding may select a portfolio of single-name corporate loans and/or bonds (each a “TRS reference asset” and together the “TRS reference assets”) with a maximum aggregate notional amount of $500,000. Under the terms of the TRS agreements, each TRS reference asset included in the TRS portfolio constitutes a separate total return swap transaction, although all calculations, payments and transfers required to be made under the TRS agreements are calculated and treated on an aggregate basis, based upon all such transactions.
Halifax Funding receives quarterly from BNS (i) all collected interest and fees generated by TRS reference assets and (ii) realized gains from the sale or repayment of TRS reference assets, if any. Halifax Funding pays to BNS (i) interest on the TRS settled notional amount at a rate equal to the three-month LIBOR+0.80% per annum if the initial investment amount (i.e. posted collateral) equals or exceeds 50% of the TRS trade basis notional amount, or three-month LIBOR+1.00% if the initial investment amount is less than 50% of the TRS trade basis notional amount and (ii) realized losses, if any. In addition, upon the termination of the TRS arrangement, Halifax Funding will either receive from BNS any net realized gain, or pay to BNS any net realized loss, on the liquidation of TRS reference assets.
Halifax Funding posts collateral in the form of certificates of deposit held by a custodian. Generally, the required collateral amount is at least 40% of the notional amount of each TRS reference asset at the time that such TRS reference asset is confirmed for acquisition by the counterparty. Halifax Funding may be required to post additional collateral, on a dollar-for-dollar basis, in the event of depreciation in the value of TRS reference assets after such value decreases below a specified amount. Halifax Funding is required to post additional collateral to ensure that the collateral market value, as solely determined by BNS, is at least equal to 25% of the value of the TRS portfolio.
F-26
Table of Contents
The obligations of Halifax Funding under the TRS agreements are non-recourse to the Company and the Company’s exposure to the TRS is limited to the amount of collateral that is posted pursuant to the terms of the TRS agreements. The Company has no contractual obligation to post any collateral or to make any interest payments to BNS. The Company may, but is not obligated to, increase its equity investment in Halifax Funding for the purpose of funding additional collateral or payment obligations for which Halifax Funding may become obligated during the term of the TRS agreements. If the Company does not make any such additional equity investment in Halifax Funding and Halifax Funding fails to meet its obligations under the TRS agreements, then BNS will have the right to terminate the TRS and use the collateral posted by Halifax Funding with the custodian to offset any amount owed to BNS. The Company may terminate the TRS at any time upon providing at least 30 days notice prior to the proposed settlement date of the TRS reference assets related to such termination. In the absence of an early termination as just described, the TRS will terminate on January 15, 2016. Upon the third anniversary date of the TRS, Halifax Funding will be required to pay a termination fee if the cumulative interest spread paid to BNS over the life of the TRS agreements is less than $6,900. Halifax Funding would have been required to pay an early termination fee of $5,534 if the TRS had been terminated as of December 31, 2013.
As of December 31, 2013 and 2012, Halifax Funding had selected 20 and 54 underlying debt positions, respectively, and had posted $37,501 and $87,974 in collateral, respectively, which is recorded as collateral on deposit with custodian on the consolidated statements of assets and liabilities. The following table reconciles the TRS settled notional amount, upon which the financing charge to BNS is based, to the total, or trade basis, notional amount:
| As of December 31, | ||||||||
| 2013 | 2012 | |||||||
| Settled notional amount |
$ | 54,829 | $ | 105,014 | ||||
| Unsettled additions |
23,759 | 58,998 | ||||||
| Unsettled deletions |
(18,677) | - | ||||||
|
|
|
|
|
|||||
| Total notional amount |
$ | 59,911 | $ | 164,012 | ||||
|
|
|
|
|
|||||
| The following table summarizes the fair value components of the TRS portfolio: | ||||||||
| As of December 31, | ||||||||
| 2013 | 2012 | |||||||
| Interest and fee income |
$ | 1,806 | $ | 1,018 | ||||
| Financing charge |
(103) | (80) | ||||||
| Net realized loss |
(27) | (345) | ||||||
| Net unrealized appreciation of reference assets |
185 | 756 | ||||||
|
|
|
|
|
|||||
| TRS Total fair value |
$ | 1,861 | $ | 1,349 | ||||
|
|
|
|
|
|||||
|
The following table summarizes the components of
realized gains on the TRS. There were no TRS realized gains for the year ended
|
||||||||
| Year Ended December 31, 2013 |
||||||||
| Interest and fee income |
$ | 10,017 | ||||||
| Financing charge |
(1,848) | |||||||
| Net realized gain |
2,140 | |||||||
|
|
|
|||||||
| TRS Total realized gains |
$ | 10,309 | ||||||
|
|
|
|||||||
The following is a summary of the TRS reference assets as of December 31, 2013:
| Company (a) | Industry | Investment | Interest Rate |
LIBOR Floor |
Maturity Date |
Notional Amount |
Fair Value | Unrealized Appreciation (Depreciation) | ||||||||||||||||
| Artesyn Technologies, Inc. |
Technology Hardware & Equipment | Senior Debt (b) | 9.75% | 10/15/2020 | $ | 3,640 | $ | 3,640 | $ | - | ||||||||||||||
| Avaya, Inc. |
Technology Hardware & Equipment | Senior Debt | L + 675 | 1.25% | 3/31/2018 | 2,573 | 2,627 | 54 | ||||||||||||||||
| Caraustar Industries, Inc. |
Materials | Senior Debt (c) | L + 625 | 1.25% | 5/1/2019 | 3,648 | 3,626 | (22 | ) | |||||||||||||||
| Catalina Marketing Corp. |
Media | Senior Debt (c) | L + 425 | 1.00% | 10/12/2020 | 3,526 | 3,532 | 6 | ||||||||||||||||
| Cequel Communications Holdings, LLC |
Media | Subordinated Debt | 5.13% | 12/15/2021 | 3,007 | 2,812 | (195 | ) | ||||||||||||||||
| Commscope, Inc. |
Technology Hardware & Equipment | Subordinated Debt | 6.63% or 7.38% PIK |
6/1/2020 | 3,908 | 4,064 | 156 | |||||||||||||||||
| Continental Building Products, LLC |
Materials | Senior Debt | L + 375 | 1.00% | 8/28/2020 | 1,985 | 1,994 | 9 | ||||||||||||||||
| Data Device Corp. |
Capital Goods | Senior Debt (c) | L + 650 | 1.50% | 7/11/2018 | 2,680 | 2,669 | (11 | ) | |||||||||||||||
| Greenway Medical Technologies |
Health Care Equipment & Services | Senior Debt | L + 500 | 1.00% | 11/4/2020 | 2,475 | 2,462 | (13 | ) | |||||||||||||||
F-27
Table of Contents
| Company (a) | Industry | Investment | Interest Rate |
LIBOR Floor |
Maturity Date |
Notional Amount |
Fair Value | Unrealized Appreciation (Depreciation) | ||||||||||||||||
| Hot Topic, Inc. |
Consumer Durables & Apparel | Senior Debt | 9.25% | 6/15/2021 | 3,675 | 3,658 | (17 | ) | ||||||||||||||||
| Internet Brands, Inc. |
Media | Senior Debt (c) | L + 500 | 1.25% | 3/18/2019 | 2,465 | 2,440 | (25 | ) | |||||||||||||||
| IPC Systems, Inc. |
Technology Hardware & Equipment | Senior Debt | L + 650 | 1.25% | 7/31/2017 | 2,971 | 3,015 | 44 | ||||||||||||||||
| Misys Ltd. |
Software & Services | Senior Debt (b) | 12.00% | 6/12/2019 | 2,898 | 3,232 | 334 | |||||||||||||||||
| NEP Group, Inc. |
Media | Senior Debt | L + 825 | 1.25% | 7/22/2020 | 1,315 | 1,360 | 45 | ||||||||||||||||
| OneStopPlus Group |
Consumer Durables & Apparel | Senior Debt (c) | L + 450 | 1.00% | 2/5/2020 | 7,294 | 7,285 | (9 | ) | |||||||||||||||
| Pinnacle Agriculture Holdings, LLC |
Materials | Senior Debt | 9.00% | 11/15/2020 | 3,745 | 3,710 | (35 | ) | ||||||||||||||||
| RedPrairie Corp. |
Software & Services | Senior Debt | L + 1000 | 1.25% | 12/21/2019 | 1,830 | 1,743 | (87 | ) | |||||||||||||||
| Summit Materials, LLC |
Materials | Subordinated Debt | 10.50% | 1/31/2020 | 656 | 638 | (18 | ) | ||||||||||||||||
| Travelport, LLC |
Software & Services | Senior Debt (c) | L + 500 | 1.25% | 6/26/2019 | 2,304 | 2,326 | 22 | ||||||||||||||||
| Wilton Brands LLC |
Materials | Senior Debt (c) | L + 625 | 1.25% | 8/30/2018 | 3,316 | 3,263 | (53 | ) | |||||||||||||||
|
|
| |||||||||||||||||||||||
| TOTAL |
$ | 59,911 | $ | 60,096 | $ | 185 | ||||||||||||||||||
|
|
| |||||||||||||||||||||||
|
(a) Security may be an obligation of one or more entities affiliated with the named company. (b) The investment is not a qualifying asset as defined in Section 55(a) under the 1940 Act. (c) Reference asset position or portion thereof unsettled as of December 31, 2013.
The following is a summary of the TRS reference assets as of December 31, 2012:
| ||||||||||||||||||||||||
| Company (a) | Industry | Investment | Interest Rate |
LIBOR Floor |
Maturity Date |
Notional Amount |
Fair Value | Unrealized Appreciation (Depreciation) | ||||||||||||||||
| Block Communications, Inc. |
Media | Subordinated Debt | 7.25% | 2/1/2020 | $ | 114 | $ | 114 | $ | - | ||||||||||||||
| California Pizza Kitchen, Inc. | Food & Staples Retailing | Senior Debt | L+550 | 1.25% | 7/7/2017 | 4,263 | 4,241 | (22 | ) | |||||||||||||||
| Camp International Holding Co. | Software & Services | Senior Debt | L+400 | 1.25% | 5/31/2019 | 2,173 | 2,172 | (1 | ) | |||||||||||||||
| Catalina Marketing Corp. | Media | Subordinated Debt | 10.50% | 10/1/2015 | 7,000 | 6,871 | (129 | ) | ||||||||||||||||
| CCC Information Services, Inc. | Software & Services | Senior Debt (c) | L+470 | 1.25% | 12/14/2019 | 1,510 | 1,521 | 11 | ||||||||||||||||
| Charter Communications Operating, LLC |
Media | Subordinated Debt (b) | 7.25% | 10/30/2017 | 625 | 622 | (3 | ) | ||||||||||||||||
| CHG Companies, Inc. | Health Care Equipment & Services |
Senior Debt (c) | L+375 | 1.25% | 11/19/2019 | 6,913 | 6,971 | 58 | ||||||||||||||||
| Clear Channel Communications, Inc. | Media | Subordinated Debt (b) | 6.50% | 11/15/2022 | 2,236 | 2,342 | 106 | |||||||||||||||||
| Clear Channel Communications, Inc. | Media | Subordinated Debt (b) | 6.50% | 11/15/2022 | 6,111 | 6,411 | 300 | |||||||||||||||||
| Continental Airlines, Inc. | Transportation | Senior Debt (b) | 8.31% | 10/2/2019 | 605 | 569 | (36 | ) | ||||||||||||||||
| First American Payment Systems, LP | Software & Services | Senior Debt | L+450 | 1.25% | 10/12/2018 | 8,950 | 8,914 | (36 | ) | |||||||||||||||
| FleetPride Corp. | Capital Goods | Senior Debt (c) | L+400 | 1.25% | 11/19/2019 | 4,522 | 4,518 | (4 | ) | |||||||||||||||
| Fly Leasing, Ltd. | Transportation | Senior Debt (b)(c) | L+450 | 1.25% | 8/8/2018 | 4,193 | 4,177 | (16 | ) | |||||||||||||||
| GCI Inc. | Telecommunication Services | Subordinated Debt | 6.75% | 6/1/2021 | 6,644 | 6,577 | (67 | ) | ||||||||||||||||
| Gymboree Corporation | Retailing | Senior Debt | L+350 | 1.50% | 2/23/2018 | 4,097 | 3,885 | (212 | ) | |||||||||||||||
| Hamilton Sundstrand Industrial | Capital Goods | Senior Debt | L+375 | 1.25% | 12/13/2019 | 7,920 | 8,060 | 140 | ||||||||||||||||
| Heartland Dental Care | Pharmaceuticals, Biotechnology & Life Sciences |
Senior Debt (c) | L+500 | 1.25% | 12/21/2018 | 4,203 | 4,203 | - | ||||||||||||||||
| Hilcorp Energy I LP | Energy | Subordinated Debt (b) | 8.00% | 2/15/2020 | 1,817 | 1,808 | (9 | ) | ||||||||||||||||
| Hubbard Radio, LLC | Media | Senior Debt (c) | L+375 | 1.50% | 4/28/2017 | 494 | 495 | 1 | ||||||||||||||||
| Husky Injection Molding Systems, Ltd. | Capital Goods | Senior Debt (b)(c) | L+450 | 1.25% | 7/2/2018 | 1,256 | 1,249 | (7 | ) | |||||||||||||||
| Immucor, Inc. | Health Care Equipment & Services | Senior Debt (c) | L+450 | 1.25% | 8/19/2018 | 48 | 48 | - | ||||||||||||||||
| IPC Systems, Inc. | Technology Hardware & Equipment |
Senior Debt | L+650 | 7/31/2017 | 3,951 | 3,898 | (53 | ) | ||||||||||||||||
| Jo-Ann Stores, Inc. | Retailing | Senior Debt (c) | L+350 | 1.25% | 3/16/2018 | 23 | 23 | - | ||||||||||||||||
| Kinetic Concepts, Inc. | Health Care Equipment & Services |
Senior Debt (c) | L+425 | 1.25% | 5/4/2018 | 1,971 | 1,971 | - | ||||||||||||||||
| Kinetic Concepts, Inc. | Health Care Equipment & Services |
Senior Debt (c) | L+375 | 1.25% | 11/4/2016 | 1,313 | 1,312 | (1 | ) | |||||||||||||||
| Local TV Finance, LLC | Media | Senior Debt (c) | L+400 | 5/7/2015 | 372 | 370 | (2 | ) | ||||||||||||||||
| Lord & Taylor Holdings, LLC | Retailing | Senior Debt (c) | L+450 | 1.25% | 1/11/2019 | 34 | 34 | - | ||||||||||||||||
| MedAssets, Inc. | Health Care Equipment & Services | Senior Debt (b) | L+275 | 1.25% | 12/13/2019 | 2,341 | 2,347 | 6 | ||||||||||||||||
| MGM Resorts International | Consumer Services | Senior Debt (b) | L+325 | 1.00% | 12/20/2019 | 7,231 | 7,340 | 109 | ||||||||||||||||
| Misys PLC | Software & Services | Senior Debt (b) | 12.00% | 6/12/2019 | 5,982 | 5,979 | (3 | ) | ||||||||||||||||
| NPC International, Inc. | Consumer Services | Senior Debt (c) | L+325 | 1.25% | 12/28/2018 | 1,636 | 1,624 | (12 | ) | |||||||||||||||
| NuSil Technology LLC | Materials | Senior Debt (c) | L+375 | 1.25% | 4/7/2017 | 502 | 501 | (1 | ) | |||||||||||||||
| Nuveen Investments, Inc. | Diversified Financials | Senior Debt (b)(c) | L+550 | 5/13/2017 | 7,059 | 7,065 | 6 | |||||||||||||||||
| Nuveen Investments, Inc. | Diversified Financials | Senior Debt (b) | L+600 | 1.25% | 5/13/2017 | 285 | 283 | (2 | ) | |||||||||||||||
| Nuveen Investments, Inc. | Diversified Financials | Senior Debt (b) | L+550 | 5/13/2017 | 26 | 26 | - | |||||||||||||||||
| PQ Corp. | Materials | Senior Debt | L+425 | 1.25% | 5/8/2017 | 5,582 | 5,588 | 6 | ||||||||||||||||
| PVH Corp. | Consumer Durables & Apparel | Senior Debt (b)(c) | L+250 | 0.75% | 12/19/2019 | 1,473 | 1,488 | 15 | ||||||||||||||||
| RedPrairie Corp. | Software & Services | Senior Debt (c) | L+550 | 1.25% | 12/21/2018 | 1,078 | 1,097 | 19 | ||||||||||||||||
| Roofing Supply Group, LLC | Retailing | Senior Debt (c) | L+375 | 1.25% | 5/31/2019 | 90 | 90 | - | ||||||||||||||||
| Sabre, Inc. | Transportation | Senior Debt (c) | L+575 | 12/29/2017 | 4,399 | 4,397 | (2 | ) | ||||||||||||||||
| Sabre, Inc. | Transportation | Senior Debt (c) | L+600 | 1.25% | 12/29/2017 | 2,212 | 2,212 | - | ||||||||||||||||
F-28
Table of Contents
| Company (a) | Industry | Investment | Interest Rate |
LIBOR Floor |
Maturity Date |
Notional Amount |
Fair Value | Unrealized Appreciation (Depreciation) | ||||||||||||||||
| Savers, Inc. |
Retailing | Senior Debt (c) | L+375 | 1.25% | 7/9/2019 | 205 | 205 | - | ||||||||||||||||
| Scitor Corp. |
Capital Goods | Senior Debt (c) | L+350 | 1.50% | 2/15/2017 | 22 | 22 | - | ||||||||||||||||
| SGS International, Inc. |
Media | Senior Debt | L+375 | 1.25% | 10/17/2019 | 5,515 | 5,543 | 28 | ||||||||||||||||
| Skilled Healthcare Group, Inc. |
Health Care Equipment & Services |
Senior Debt (b) | L+525 | 1.50% | 4/9/2016 | 15 | 15 | - | ||||||||||||||||
| Spectrum Brands, Inc. |
Household & Personal Products |
Senior Debt (b) | L+325 | 1.25% | 12/17/2019 | 1,525 | 1,552 | 27 | ||||||||||||||||
| Tempur-Pedic International, Inc. |
Commercial & Professional Services |
Senior Debt (b)(c) | L+400 | 1.00% | 11/14/2019 | 6,852 | 7,000 | 148 | ||||||||||||||||
| Terex Corp. |
Capital Goods | Subordinated Debt (b) | 6.00% | 5/15/2021 | 4,626 | 4,857 | 231 | |||||||||||||||||
| The TelX Group, Inc. |
Telecommunication Services | Senior Debt (c) | L+500 | 1.25% | 9/23/2017 | 7,019 | 6,999 | (20 | ) | |||||||||||||||
| Tomkins Air Distribution |
Capital Goods | Senior Debt | L+375 | 1.25% | 11/9/2018 | 5,949 | 6,058 | 109 | ||||||||||||||||
| USI Holdings Corp. |
Insurance | Subordinated Debt | 7.75% | 1/15/2021 | 1,076 | 1,063 | (13 | ) | ||||||||||||||||
| USI Holdings Corp. |
Insurance | Senior Debt (c) | L+400 | 1.25% | 12/27/2019 | 1,919 | 1,940 | 21 | ||||||||||||||||
| West Corp. |
Software & Services | Subordinated Debt | 8.63% | 10/1/2018 | 6,030 | 6,096 | 66 | |||||||||||||||||
| West Corp. |
Software & Services | Senior Debt (c) | L+425 | 1.25% | 7/15/2016 | 5 | 5 | - | ||||||||||||||||
|
|
| |||||||||||||||||||||||
| Total |
$ 164,012 | $ 164,768 | $ 756 | |||||||||||||||||||||
|
|
| |||||||||||||||||||||||
(a) Security may be an obligation of one or more entities affiliated with the named company.
(b) The investment is not a qualifying asset as defined in Section 55(a) under the 1940 Act.
(c) Reference asset position or portion thereof unsettled as of December 31, 2012.
| 5. | Fair Value of Financial Instruments |
The Company’s investments were categorized in the fair value hierarchy as follows as of December 31, 2013 and 2012:
| December 31, 2013 | ||||||||||||||||
| Description | Level 1 | Level 2 | Level 3 | Total | ||||||||||||
| Senior debt |
$ | - | $ | 863,216 | $ | 611,276 | $ | 1,474,492 | ||||||||
| Subordinated debt |
- | 198,210 | 171,921 | 370,131 | ||||||||||||
| Structured products |
- | - | 55,575 | 55,575 | ||||||||||||
| Equity/Other |
- | - | 24,671 | 24,671 | ||||||||||||
|
|
|
|
|
|
|
|
|
|||||||||
| Subtotal |
- | 1,061,426 | 863,443 | 1,924,869 | ||||||||||||
| Short term investments |
149,903 | - | - | 149,903 | ||||||||||||
|
|
|
|
|
|
|
|
|
|||||||||
| Total investments |
$ | 149,903 | $ | 1,061,426 | $ | 863,443 | $ | 2,074,772 | ||||||||
|
|
|
|
|
|
|
|
|
|||||||||
| Derivative Type |
Level 1 | Level 2 | Level 3 | Total | ||||||||||||
| Assets |
||||||||||||||||
| Total return swaps |
$ | - | $ | - | $ | 1,861 | $ | 1,861 | ||||||||
| Liabilities |
||||||||||||||||
| Foreign currency forward contracts |
- | (3,181) | - | (3,181) | ||||||||||||
|
|
|
|
|
|
|
|
|
|||||||||
| Total |
$ | - | $ | (3,181) | $ | 1,861 | $ | (1,320) | ||||||||
|
|
|
|
|
|
|
|
|
|||||||||
| December 31, 2012 | ||||||||||||||||
| Description |
Level 1 | Level 2 | Level 3 | Total | ||||||||||||
| Senior debt |
$ | - | $ | 435,852 | $ | 86,591 | $ | 522,443 | ||||||||
| Subordinated debt |
- | 163,580 | 2,765 | 166,345 | ||||||||||||
| Structured products |
- | - | 3,443 | 3,443 | ||||||||||||
| Equity/Other |
4,984 | - | 453 | 5,437 | ||||||||||||
|
|
|
|
|
|
|
|
|
|||||||||
| Subtotal |
4,984 | 599,432 | 93,252 | 697,668 | ||||||||||||
| Short term investments |
13,203 | - | - | 13,203 | ||||||||||||
|
|
|
|
|
|
|
|
|
|||||||||
| Total investments |
$ | 18,187 | $ | 599,432 | $ | 93,252 | $ | 710,871 | ||||||||
|
|
|
|
|
|
|
|
|
|||||||||
| Derivative Type |
Level 1 | Level 2 | Level 3 | Total | ||||||||||||
| Assets |
||||||||||||||||
| Foreign currency forward contracts |
$ | - | $ | 9 | $ | - | $ | 9 | ||||||||
| Total return swaps |
- | - | 1,349 | 1,349 | ||||||||||||
| Liabilities |
||||||||||||||||
| Foreign currency forward contracts |
- | (156) | - | (156) | ||||||||||||
|
|
|
|
|
|
|
|
|
|||||||||
| Total |
$ | - | $ | (147) | $ | 1,349 | $ | 1,202 | ||||||||
|
|
|
|
|
|
|
|
|
|||||||||
F-29
Table of Contents
There were no transfers between Level 1 and Level 2 during the years ended December 31, 2013 and 2012.
The carrying value of cash and foreign currency is classified as Level 1 with respect to the fair value hierarchy. The carrying value of the Company’s collateral on deposit with custodian and credit facilities approximate their fair value and they would be classified as Level 2 with regards to the fair value hierarchy.
At December 31, 2013, the Company held 30 distinct investment positions that were classified as Level 3, representing an aggregate fair value of $863,443 and 41.6% of the total investment portfolio. The ranges of unobservable inputs used in the fair value measurement of the Company’s Level 3 investments as of December 31, 2013 were as follows:
| Asset Group | Fair Value (1) | Valuation Techniques (2) | Unobservable Inputs | Range (Weighted Average) (3) | Impact to Valuation from an Increase in Input (4) | |||||||
| Senior Debt |
$611,276 | Discounted Cash Flow | Discount Rate | 7.36% - 14.37% (11.12%) | Decrease | |||||||
| Market Yield | 5.92% - 10.60% (8.58%) | Decrease | ||||||||||
| Yield Premium | 0.00% - 4.00% (2.31%) | Decrease | ||||||||||
| Weighted Average Cost of Capital | 6.60% - 14.20% (10.61%) | Decrease | ||||||||||
| EBITDA Multiple | 5.00x - 9.50x (8.08x) | Increase | ||||||||||
| Subordinated Debt |
$171,921 | Discounted Cash Flow | Discount Rate | 11.26% - 15.51% (14.77%) | Decrease | |||||||
| Market Yield | 6.30% - 11.92% (11.12%) | Decrease | ||||||||||
| Yield Premium | 4.00% (4.00%) | Decrease | ||||||||||
| Weighted Average Cost of Capital | 7.70% - 15.20% (14.36%) | Decrease | ||||||||||
| EBITDA Multiple | 7.50x - 12.00x (9.25x) | Increase | ||||||||||
| Structured Products |
3,359 | Broker Quote | Bid Price | 101.50 (101.50) | Increase | |||||||
| 52,216 | Discounted Cash Flow | Discount Rate | 11.34% (11.34%) | Decrease | ||||||||
| Equity/Other – Common Stock | 7,061 | Market Comparables | EBITDA Multiple | 8.90x - 10.00x (9.02x) | Increase | |||||||
| Equity/Other – Equity Options | 15,256 | Discounted Cash Flow | EBITDA Multiple | 9.75x (9.75x) | Increase | |||||||
| Discount Rate | 12.00% (12.00%) | Decrease | ||||||||||
| Equity/Other – Overriding Royalty Interest | 2,354 | Discounted Cash Flow | Discount Rate | 13.71% (13.71%) | Decrease | |||||||
| Total |
$863,443 | |||||||||||
|
|
|
|||||||||||
| (1) | The TRS was valued in accordance with the TRS agreements as discussed in Note 2. See Note 4 for quantitative disclosures of the current period conclusions of the fair value of the TRS. |
| (2) | For the assets and investment that have more than one valuation technique, the Company may rely on the stated techniques individually or in the aggregate based on a weight ascribed to each valuation technique, ranging from 0 – 100%. Indicative broker quotes obtained for valuation purposes are reviewed by the Company relative to other valuation techniques. |
| (3) | Weighted average amounts are based on the estimated fair values. |
| (4) | This column represents the directional change in the fair value of the Level 3 investments that would result from an increase to the corresponding unobservable input. A decrease to the input would have the opposite effect. Significant changes in these inputs in isolation could result in significantly higher or lower fair value measurements. |
F-30
Table of Contents
At December 31, 2012, the Company held 18 distinct investment positions that were classified as Level 3, representing an aggregate fair value of $93,252 and 13.1% of the total investment portfolio. The ranges of unobservable inputs used in the fair value measurement of the Company’s Level 3 investments as of December 31, 2012 were as follows:
| Asset Group | Fair Value (1) | Valuation Techniques (2) | Unobservable Inputs | Range (Weighted Average) (3) | Impact to Valuation from an Increase in Input (4) | |||||||
| Senior Debt |
$18,681 | Broker Quotes | Mid Price | 94.25 – 102 (100.98) | Increase | |||||||
| 67,910 | Broker Quotes\ | Mid Price | 98 – 101.5 (98.55) | Increase | ||||||||
| Market Comparables | Market Yield | 5.0 – 11.9% (8.91%) | Decrease | |||||||||
| Discount Margin | 437 – 1069 bps (808 bps) | Decrease | ||||||||||
| Illiquidity Discount | 1.0 – 4.0% (2.29%) | Decrease | ||||||||||
| Subordinated Debt |
2,765 | Market Comparables | Market Yield | 12.0 – 13.0% (12.54%) | Decrease | |||||||
| Discount Margin | 1071 – 1250 bps (1170 bps) | Decrease | ||||||||||
| EBITDA Multiple | 9.6x (9.6x) | Increase | ||||||||||
| Illiquidity Discount | 2% (2%) | Decrease | ||||||||||
| Structured Products |
3,443 | Broker Quotes | Bid Price | 104.02 (104.02) | Increase | |||||||
| Equity/Other- |
453 | Market Comparables\ | Forward EBITDA Multiple | 9.8x (9.8x) | Increase | |||||||
| Common Stock |
Discounted Cash Flow | LTM EBITDA Multiple | 12.9x (12.9x) | Increase | ||||||||
| Illiquidity Discount | 15% (15%) | Decrease | ||||||||||
| Weighted Average Cost of Capital | 12.2% (12.2%) | Decrease | ||||||||||
| Total |
$93,252 | |||||||||||
|
|
|
|||||||||||
| (1) | The TRS was valued in accordance with the TRS Agreement as discussed below. See Note 4 for quantitative disclosures of the current period conclusions of the fair value of the TRS. |
| (2) | For the assets and investment that have more than one valuation technique, the Company may rely on the stated techniques individually or in the aggregate based on a weight ascribed to each valuation technique, ranging from 0 – 100%. Broker quotes obtained for valuation purposes are reviewed by the Company relative to other valuation techniques. |
| (3) | Weighted average amounts are based on the estimated fair values. If noted as NA, then the number of inputs is too few to compute the weighted average for the range. |
| (4) | This column represents the directional change in the fair value of the Level 3 investments that would result from an increase to the corresponding unobservable input. A decrease to the input would have the opposite effect. Significant changes in these inputs in isolation could result in significantly higher or lower fair value measurements. |
In the above tables, certain investments may be valued at cost for a period of time after an acquisition as the best indicator of fair value.
The above tables represent the significant unobservable inputs as they relate to the Company’s determination of fair values for the majority of its investments categorized within Level 3 as of December 31, 2013. In addition to the techniques and inputs noted in the table above, according to the Company’s valuation policy, it may also use other valuation techniques and methodologies when determining the Company’s fair value estimates. Any significant increases or decreases in these unobservable inputs would result in significant increases or decreases in the fair value of the Company’s investments.
Investments that do not have a readily available market value are valued utilizing a market comparables approach, an income approach (i.e. discounted cash flow approach), or both approaches, as appropriate. The market comparables approach uses prices, including third-party indicative broker quotes, and other relevant information generated by market transactions involving identical or comparable assets or liabilities (including a business). The income approach uses valuation techniques to convert future amounts (for example, cash flows or earnings) that are discounted based on a required or expected discount rate to derive a single present value amount. The measurement is based on the value indicated by current market expectations about those future amounts. In following these approaches, the types of factors that the Company may take into account in fair value pricing its investments include, as relevant: available current market data, including an assessment of the credit quality of the security issuer, relevant and applicable market trading and transaction comparables, applicable market yields and multiples, illiquidity discounts, security covenants, call protection provisions, information rights, the nature and realizable value of any collateral, the portfolio company’s ability to make payments, its earnings and cash flows, the markets in which the portfolio company does business, comparisons of financial ratios of peer companies that are public, M&A comparables, and enterprise values, among other factors.
F-31
Table of Contents
The following is a reconciliation for the year ended December 31, 2013 of investments for which Level 3 inputs were used in determining fair value:
| Senior | Subordinated | Structured | Equity/ | Total Return | ||||||||||||||||||||
| Debt | Debt | Products | Other | Swaps | Total | |||||||||||||||||||
| Fair Value Balance as of January 1, 2013 |
$ | 86,591 | $ | 2,765 | $ | 3,443 | $ | 453 | $ | 1,349 | $ | 94,601 | ||||||||||||
| Additions |
580,075 | 161,563 | 52,194 | 23,801 | - | 817,633 | ||||||||||||||||||
| Net realized gain |
1,581 | - | - | - | 10,309 | 11,890 | ||||||||||||||||||
| Net change in unrealized appreciation (depreciation) (1) |
616 | 7,205 | (52 | ) | 417 | 512 | 8,698 | |||||||||||||||||
| Sales or repayments |
(33,178 | ) | - | - | - | (10,309 | ) | (43,487 | ) | |||||||||||||||
| Net discount accretion |
866 | 388 | (10 | ) | - | - | 1,244 | |||||||||||||||||
| Transfers out of Level 3 |
(25,275 | ) | - | - | - | - | (25,275 | ) | ||||||||||||||||
| Transfers into Level 3 |
- | - | - | - | - | - | ||||||||||||||||||
|
|
|
|
|
|
|
|
|
|
|
|
|
|||||||||||||
| Fair Value Balance as of December 31, 2013 |
$ | 611,276 | $ | 171,921 | $ | 55,575 | $ | 24,671 | $ | 1,861 | $ | 865,304 | ||||||||||||
|
|
|
|
|
|
|
|
|
|
|
|
|
|||||||||||||
| Change in net unrealized appreciation (depreciation) in investments still held as of December 31, 2013 (1) |
$ | 1,657 | $ | 7,205 | $ | (52 | ) | $ | 417 | $ | 512 | $ | 9,739 | |||||||||||
| (1) | Amount is included in the related amount on investments and derivative instruments in the consolidated statements of operations. |
The following is a reconciliation for the year ended December 31, 2012 of investments for which Level 3 inputs were used in determining fair value:
| Senior | Subordinated | Structured | Equity/ | Total Return | ||||||||||||||||||||
| Debt | Debt | Products | Other | Swaps | Total | |||||||||||||||||||
| Fair Value Balance as of January 1, 2012 |
$ | 4,652 | $ | 963 | $ | - | $ | - | $ | - | $ | 5,615 | ||||||||||||
| Additions |
81,956 | 3,747 | 3,343 | 449 | - | 89,495 | ||||||||||||||||||
| Net realized gain |
606 | 12 | - | - | - | 618 | ||||||||||||||||||
| Net change in unrealized appreciation (depreciation) (1) |
1,111 | 141 | 108 | 4 | 1,349 | 2,713 | ||||||||||||||||||
| Sales or repayments |
(20,198 | ) | (998 | ) | - | - | - | (21,196 | ) | |||||||||||||||
| Net discount accretion |
120 | 6 | (8 | ) | - | - | 118 | |||||||||||||||||
| Transfers out of Level 3 |
(6,808 | ) | (1,106 | ) | - | - | - | (7,914 | ) | |||||||||||||||
| Transfers into Level 3 |
25,152 | - | - | - | - | 25,152 | ||||||||||||||||||
|
|
|
|
|
|
|
|
|
|
|
|
|
|||||||||||||
| Fair Value Balance as of December 31, 2012 |
$ | 86,591 | $ | 2,765 | $ | 3,443 | $ | 453 | $ | 1,349 | $ | 94,601 | ||||||||||||
|
|
|
|
|
|
|
|
|
|
|
|
|
|||||||||||||
| Change in net unrealized appreciation (depreciation) in investments still held as of December 31, 2012 (1) |
$ | 1,362 | $ | 135 | $ | 108 | $ | 4 | $ | 1,349 | $ | 2,958 | ||||||||||||
| (1) | Amount is included in the related amount on investments and derivative instruments in the consolidated statements of operations. |
No securities were transferred into the Level 3 hierarchy and seven were transferred out of the Level 3 hierarchy during the year ended December 31, 2013. Eight securities were transferred into the Level 3 hierarchy and four were transferred out of the Level 3 hierarchy during the year ended December 31, 2012. These investments were transferred at fair value as of the beginning of the quarter in which they were transferred. The classification transfers between Level 3 and Level 2 were based on the observed changes in liquidity based on information supplied by a third party pricing source, whereby such liquidity information is routinely reviewed no less frequently than monthly. All realized and unrealized gains and losses are included in earnings (changes in net assets) and are reported as separate line items within the Company’s consolidated statements of operations.
F-32
Table of Contents
6. Agreements and Related Party Transactions
CNL, certain CNL affiliates, and KKR receive compensation for advisory services and/or reimbursement of expenses in connection with (i) the performance and supervision of administrative services (ii) investment advisory activities, and (iii) the offering of the Company’s common stock. Related party fees, expenses and reimbursement of expenses incurred in the years ended December 31, 2013 and December 31, 2012 are summarized below:
| Year Ended December 31, | ||||||||||
| Related Party |
Source Agreement & Description |
2013 | 2012 | |||||||
| CNL Securities Corp. |
Managing Dealer Agreement: Selling commissions and marketing support fees |
$ | 78,713 | $ | 55,506 | |||||
| CNL and KKR |
Investment Advisory Agreement: Base management fees (investment advisory fees) |
30,089 | 9,193 | |||||||
| CNL and KKR |
Investment Advisory Agreement: Subordinated incentive fee on income(1) |
6,992 | - | |||||||
| CNL and KKR |
Investment Advisory Agreement: Incentive fee on capital gains(2) |
2,323 | - | |||||||
| CNL and KKR |
Investment Advisory Agreement: Organization and offering expenses reimbursement(3) |
7,750 | 4,251 | |||||||
| KKR |
Investment Advisory Agreement: Investment expense reimbursement |
469 | - | |||||||
| CNL |
Administrative Services Agreement: Administrative and compliance services(4) |
1,536 | 753 | |||||||
| (1) | During the year ended December 31, 2013, $1,708 of subordinated incentive fees on income were paid to the Advisors. As of December 31, 2013, a subordinated incentive fee on income of $5,284 was payable to the Advisors. The Company did not pay any subordinated incentive fees on income during the year ended December 31, 2012. |
| (2) | The following table provides additional details for the incentive fee on capital gains: |
| Incentive fee on capital gains |
2013 | 2012 | ||||||
| Accrued incentive fee on capital gains as of January 1, |
$ | 2,087 | $ | 106 | ||||
| Incentive fee on capital gains expense during the year ended December 31, |
9,041 | 1,981 | ||||||
|
|
|
|
|
|||||
| Accrued incentive fee on capital gains as of December 31, |
11,128 | 2,087 | ||||||
| Less: Incentive fees on capital gains unearned by the Advisors as of December 31, |
(8,805) | (2,087) | ||||||
|
|
|
|
|
|||||
| Incentive fee on capital gains earned by and payable to the Advisors as of December 31, |
$ | 2,323 | $ | - | ||||
|
|
|
|
|
|||||
| (3) | The following table provides additional details for the organization and offering expenses reimbursement: |
|
Organization and offering expense reimbursement |
2013 | 2012 | ||||||
| Offering expenses reimbursement payable as of December 31, |
$ | 240 | $ | 437 | ||||
| Offering expenses reimbursements paid to the Advisors during the year ended December 31, |
7,947 | 2,087 | ||||||
| Organization expenses reimbursements paid to the Advisors during the year ended December 31, |
- | 896 | ||||||
| Outstanding unreimbursed offering expenses as of December 31, |
1,561 | 4,001 | ||||||
| (4) | Includes $350 and $160 for reimbursement payments to CNL for services provided to the Company for its Chief Compliance Officer and Chief Financial Officer for the years ended December 31, 2013 and 2012, respectively. |
The Company entered into a managing dealer agreement with CNL Securities Corp., an affiliate of CNL. CNL Securities Corp. serves as the managing dealer of the Offering and Follow-On Offering and in connection therewith receives selling commissions of up to 7% of gross offering proceeds and a marketing support fee of up to 3% of gross offering proceeds. All or any portion of these fees may be reallowed to participating brokers as determined by CNL Securities Corp. The Company will pay a maximum sales load of 10% of gross offering proceeds for all combined selling commissions and marketing support fees.
The Company entered into an investment advisory agreement with CNL (together with one amendment, the “Investment Advisory Agreement”) for the overall management of the Company’s investment activities. The Company and CNL have entered into a sub-advisory agreement with KKR (the “Sub-Advisory Agreement”), under which KKR is responsible for the day-to-day management of the Company’s investment portfolio. CNL compensates KKR for advisory services that it provides to the Company with 50% of the base management fees and performance-based incentive fees that CNL receives under the Investment Advisory Agreement. CNL earns a base management fee equal to an annual rate of 2% of the Company’s average gross assets at the end of the two most recently completed months and it is computed and paid monthly. Gross assets include assets purchased with borrowed funds, TRS unrealized depreciation or appreciation and collateral posted with custodian in connection with TRS, but exclude deferred offering expense. CNL also earns a performance-based incentive fee that is comprised of the following two parts:
F-33
Table of Contents
(i) a subordinated incentive fee on pre-incentive fee net investment income, that is paid quarterly if earned, and it is computed as the sum of (A) 100% of quarterly pre-incentive fee net investment income in excess of 1.75% of average adjusted capital up to a limit of 0.4375% of average adjusted capital, and (B) 20% of pre-incentive fee net investment income in excess of 2.1875% of average adjusted capital and
(ii) an incentive fee on capital gains that is paid annually if earned, and it is equal to 20% of (A) all realized gains on a cumulative basis from inception, net of (i) all realized losses on a cumulative basis, (ii) unrealized depreciation at year end and (iii) disregarding any net realized gains associated with the TRS interest spread (which represents the difference between (a) the interest and fees received on total return swaps, and (b) the financing fees paid to the TRS counterparty), and subtracting (B) the aggregate amount of any previously paid incentive fee on capital gains.
The terms of the Investment Advisory Agreement entitle CNL (and indirectly KKR) to receive up to 5% of gross proceeds in connection with the Offerings as reimbursement for organization and offering expenses incurred by the Advisors on behalf of the Company. Beginning February 1, 2012, the Company implemented an initial reimbursement rate of 0.75% of gross offering proceeds to initiate the reimbursement of organization and offering expenses incurred by the Advisors. Beginning March 1, 2013, the Company changed the reimbursement rate to 1% of gross offering proceeds.
Under the terms of the Investment Advisory Agreement, the Advisors are entitled to reimbursement of certain expenses incurred on behalf of the Company in connection with its investment operations and investment transactions.
The Company entered into an administrative services agreement with CNL (the “Administrative Services Agreement”) whereby CNL performs, and oversees the performance of, various administrative services on behalf of the Company. Administrative services may include transfer agency oversight and supervisory services, shareholder communication services, general ledger accounting services, calculating the Company’s net asset value, maintaining required corporate and financial records, financial reporting for the Company and its subsidiaries, internal audit services, reporting to the Company’s board of directors and lenders, preparing and filing income tax returns, preparing and filing SEC reports, preparing, printing and disseminating shareholder reports, overseeing the payment of the Company’s expenses and shareholder distributions, administering the quarterly share repurchase programs, compliance services, and management and oversight of service providers in their performance of administrative and professional services rendered for the Company. CNL may also enter into agreements with its affiliates for the performance of select administrative services. The Company reimburses CNL for the professional services and expenses it incurs in performing its administrative obligations on behalf of the Company. CNL also receives reimbursement payments from the Company for professional services provided by certain officers of the Company.
On June 7, 2011, the Company entered into an Expense Support and Conditional Reimbursement Agreement (the “Expense Support Agreement”) with CNL and KKR pursuant to which CNL and KKR jointly and severally agreed to pay to the Company all operating expenses (an “Expense Support Payment”) during the Expense Support Payment Period between June 17, 2011 to December 31, 2011. On December 16, 2011, the Company and the Advisors entered into an amendment to the Expense Support Agreement, effective January 1, 2012, that extended the terminal date of the Expense Support Payment Period to March 31, 2012 and reduced the Reimbursement Ratio from 100% to 65% of the Company’s Operating Expenses. The Amendment also redefined Operating Expenses as all operating costs and expenses paid or incurred by the Company, as determined under GAAP, including base advisory fees payable pursuant to the Investment Advisory Agreement, and excluding (i) performance-based incentive fees payable pursuant to the Investment Advisory Agreement, (ii) organization and offering expenses, and (iii) all interest costs related to borrowings for such period. On March 16, 2012, the Company and the Advisors entered into an amendment and restatement of the Expense Support Agreement, effective April 1, 2012, that extended the terminal date of the Expense Support Payment Period to June 30, 2012 and reduced the Reimbursement Ratio from 65% to 25% of the Company’s Operating Expenses. Expense support payments ceased on
July 1, 2012.
During the term of the Expense Support Agreement, the Advisors are entitled to an annual year-end reimbursement payment by the Company for unreimbursed Expense Support Payments made under the Expense Support Agreement (a “Reimbursement Payment”), but such Reimbursement Payments may only be paid (i) within three years after the year in which such Expense Support Payments are attributable, and (ii) to the extent that it would not cause the Company’s Other Operating Expenses (Operating Expenses excluding base management fees and including a Reimbursement Payment) to exceed 1.75% of average net assets attributable to common shares as of the end of any such calendar year (the “Reimbursement Limit Percentage”). The Company records the liability for Reimbursement Payments based on a hypothetical liquidation of its investment portfolio at the end of the reporting period.
F-34
Table of Contents
Presented below is a summary of Expense Support Payments and the associated terminal eligibility dates for Reimbursement Payments for the years ending December 31, 2011 and December 31, 2012.
| Period Ended |
Expense Support Payments Received from Advisors |
Reimbursement Payments to Advisors |
Unreimbursed Expense Support Payments(1) |
Reimbursement Payments Eligibility through |
||||||||||||
| December 31, 2011 |
$ | 1,376 | $ | 1,376 | $ | - | - | |||||||||
| December 31, 2012 |
1,590 | 454 | 1,136 | December 31, 2015 | ||||||||||||
|
|
|
|
|
|
|
|||||||||||
| Total |
$ | 2,966 | $ | 1,830 | $ | 1,136 | ||||||||||
|
|
|
|
|
|
|
|||||||||||
| (1) | As of December 31, 2013 the Company has accrued $1,136 for Reimbursement Payment to Advisors. |
Indemnification - The Investment Advisory Agreement and the Sub-Advisory Agreement provide certain indemnification to the Advisors, their directors, officers, persons associated with the Advisors, and their affiliates. The managing dealer agreement provides certain indemnification to the managing dealer and each participating broker and their respective officers, directors, partners, employees, associated persons, agents and control persons. As of December 31, 2013, management believes that the risk of incurring any losses for such indemnification is remote.
7. Earnings Per Share
The following information sets forth the computation of basic and diluted net increase in net assets from operations per share (earnings per share).
| Basic and Diluted Net Increase (Decrease) in Net Assets Per Share |
||||||||||||
| Year Ended December 31, | ||||||||||||
| 2013 | 2012 | 2011 | ||||||||||
| Net increase in net assets resulting from operations |
$ | 104,957 | $ | 25,654 | $ | 1,382 | ||||||
| Weighted average shares outstanding |
104,505,667 | 31,394,766 | 1,269,117 | |||||||||
| Basic/diluted net increase in net assets from operations per share (1) |
$ | 1.00 | $ | 0.82 | $ | 1.09 | ||||||
| (1) | Diluted and basic net increase in net assets from operations per share were equivalent in each period because there were no common stock equivalents outstanding in each period. |
8. Distributions
The Company’s board of directors declared distributions for 53 and 52 record dates in the years ended December 31, 2013 and 2012, respectively. Declared distributions are paid monthly. The total of declared distributions and the sources of distribution payments for the years ended December 31, 2013 and 2012 are presented in the tables below.
| Year Ended December 31, 2013 |
Per Share | Amount | Allocation | |||||||||
| For three months ended March 31, 2013 (13 record dates) |
$ | 0.20 | $ | 13,735 | ||||||||
| For three months ended June 30, 2013 (13 record dates) |
0.19 | 17,807 | ||||||||||
| For three months ended September 30, 2013 (13 record dates) |
0.20 | 22,262 | ||||||||||
| For three months ended December 31, 2013 (14 record dates) |
0.24 | (1) | 33,201 | |||||||||
|
|
|
|
|
|||||||||
| Total Declared Distributions for the year ended December 31, 2013 |
$ | 0.83 | $ | 87,005 | 100.0 | % | ||||||
| From Net Investment Income |
$ | 0.47 | $ | 49,935 | 57.4 | |||||||
| From Realized Gains |
0.27 | 28,047 | 32.2 | |||||||||
| Distributions in Excess of Net Investment Income |
0.09 | 9,023 | 10.4 | |||||||||
| (1) | Includes a special distribution of $0.03 per share. |
F-35
Table of Contents
| Year Ended December 31, 2012 |
Per Share | Amount | Allocation | |||||||||||
| For three months ended March 31, 2012 (13 record dates) |
$ 0.19 | $ 1,987 | ||||||||||||
| For three months ended June 30, 2012 (13 record dates) |
0.19 | 4,107 | ||||||||||||
| For three months ended September 30, 2012 (13 record dates) |
0.19 | 7,067 | ||||||||||||
| For three months ended December 31, 2012 (13 record dates) |
0.19 | 10,161 | ||||||||||||
|
|
|
|
|
|||||||||||
| Total Declared Distributions for the year ended December 31, 2012 |
$ 0.76 | $ 23,322 | 100.0 | % | ||||||||||
| From Net Investment Income |
$ 0.51 | $ 15,698 | 67.3 | |||||||||||
| From Realized Gains |
0.10 | 3,040 | 13.0 | |||||||||||
| Distributions in Excess of Net Investment Income |
0.15 | 4,584 | 19.7 | |||||||||||
Sources of distributions, other than net investment income and realized gains, include (i) the ordinary income component of prior year tax basis accumulated earnings and (ii) required adjustments to GAAP net investment income in the current period to determine taxable income available for distributions for the calendar year. The following table summarizes the primary sources of differences between GAAP net investment income and taxable income available for distributions that contribute to tax-related distributions in excess of net investment income for the years ended December 31, 2013 and 2012.
| For the year ended December 31, |
2013 | 2012 | ||||||||
| Ordinary income component of tax basis accumulated earnings |
$ | 819 | $ | 112 | ||||||
| Estimated unearned performance-based incentive fee |
6,718 | 1,981 | ||||||||
| Offering expenses |
6,502 | 1,209 | ||||||||
| Organization expenses |
(60) | 896 | ||||||||
| Taxable income from investments on non-accrual status |
1,048 | - | ||||||||
| Net change in unrealized appreciation on total return swaps |
512 | 1,349 | ||||||||
| Net change in unrealized depreciation on foreign currency forward contracts |
(3,034) | (147) | ||||||||
| Other book-tax differences |
48 | (4) | ||||||||
|
|
|
|
|
|||||||
| Total (1) |
$ | 12,553 | $ | 5,396 | ||||||
|
|
|
|
|
|||||||
| (1) | The above table does not present all adjustments to calculate taxable income available for distributions. See footnote 13 for a reconciliation of net increase in net assets resulting from operations to taxable income available for distributions. |
For the years ended December 31, 2013 and 2012, the tax-related sources of distributions of $12,553 and $5,396, respectively, are greater than the distributions in excess of net investment income of $9,023 and $4,584, respectively. As a result, none of the distributions declared during the years ended December 31, 2013 and 2012 were considered to be a return of capital.
On December 14, 2013, the Company’s board of directors declared distributions of $0.015004 per share for 12 record dates beginning on January 7, 2014 through and including March 26, 2014.
| 9. | Share Transactions |
On January 29, 2013, May 7, 2013, November 21, 2013 and December 17, 2013 the Company’s board of directors increased the public offering price per share of common stock under the Offerings to $11.05, $11.10, $11.20 and $11.30, respectively, to ensure that the associated net offering price per share, exclusive of sales load, equaled or exceeded the net asset value per share on each subsequent subscription closing date and distribution reinvestment date.
The following table summarizes the total shares issued and proceeds received in connection with the Company’s Offerings for the years ended December 31, 2013, 2012, and 2011.
| Year Ended | ||||||||||||||||||||||||
| December 31, 2013 | December 31, 2012 | December 31, 2011 | ||||||||||||||||||||||
| Shares | Amount | Shares | Amount | Shares | Amount | |||||||||||||||||||
| Gross Proceeds from Offering |
77,259,720 | $ 849,308 | 54,520,455 | $ 588,369 | 7,021,920 | $ 70,898 | ||||||||||||||||||
| Commissions and Marketing Support Fees |
- | (78,713 | ) | - | (55,506 | ) | - | (6,727 | ) | |||||||||||||||
|
|
|
|
|
|
|
|
|
|
|
|
|
|||||||||||||
| Net Proceeds to Company |
77,259,720 | 770,595 | 54,520,455 | 532,863 | 7,021,920 | 64,171 | ||||||||||||||||||
| Reinvestment of Distributions |
3,664,801 | 36,605 | 1,207,704 | 11,832 | 29,024 | 266 | ||||||||||||||||||
|
|
|
|
|
|
|
|
|
|
|
|
|
|||||||||||||
| Net Proceeds from Offering |
80,924,521 | $ 807,200 | 55,728,159 | $ 544,695 | 7,050,944 | $ 64,437 | ||||||||||||||||||
|
|
|
|
|
|
|
|
|
|
|
|
|
|||||||||||||
| Average Net Proceeds Per Share |
$9.97 | $9.77 | $9.14 | |||||||||||||||||||||
F-36
Table of Contents
As of December 31, 2013, the Company has sold 143,703,625 shares of common stock through the Offerings, including reinvestment of distributions, for total gross proceeds of $1,557,278.
The Company conducts quarterly tender offers pursuant to its share repurchase program. The Company currently limits the number of shares to be repurchased during any calendar year to the number of shares it can repurchase with the proceeds it receives from the issuance of shares of its common stock under its distribution reinvestment plan. At the discretion of the Company’s board of directors, the Company may also use cash on hand, cash available from borrowings and cash from the sale of investments as of the end of the applicable period to repurchase shares. The Company limits repurchases in each quarter to 2.5% of the weighted average number of shares of common stock outstanding in the prior four calendar quarters. The Company’s board of directors may amend, suspend or terminate the share repurchase program upon 30 days notice.
The following table is a summary of the share repurchases completed during the year ended December 31, 2013:
| Total Number of | ||||||||||||||||||||
| Shares Offered | Total Number of | Total | No. of Shares | Price Paid | ||||||||||||||||
| Repurchase Date |
to Repurchase | Shares Purchased | Consideration | Purchased / Total Offer | per Share | |||||||||||||||
| February 20, 2013 |
785,106 | 84,074 | $ | 818 | 11% | $ | 9.73 | |||||||||||||
| May 24, 2013 |
1,158,737 | 68,788 | 682 | 6% | 9.91 | |||||||||||||||
| August 27, 2013 |
1,596,287 | 116,779 | 1,142 | 7% | 9.78 | |||||||||||||||
| November 25, 2013 |
2,084,159 | 359,217 | 3,560 | 17% | 9.91 | |||||||||||||||
|
|
|
|
|
|
|
|||||||||||||||
| Total |
5,624,289 | 628,858 | $ | 6,202 | 11% | |||||||||||||||
|
|
|
|
|
|
|
|||||||||||||||
|
The following table is a summary of the share repurchases completed during the year ended December 31, 2012:
|
| |||||||||||||||||||
| Total Number of | ||||||||||||||||||||
| Shares Offered | Total Number of | Total | No. of Shares | Price Paid | ||||||||||||||||
| Repurchase Date |
to Repurchase | Shares Purchased | Consideration | Purchased / Total Offer | per Share | |||||||||||||||
| August 15, 2012 |
236,604 | 47,481 | $ | 458 | 20% | $ | 9.64 | |||||||||||||
| November 15, 2012 |
470,031 | 25,405 | 248 | 5% | 9.79 | |||||||||||||||
|
|
|
|
|
|
|
|||||||||||||||
| Total |
706,635 | 72,886 | $ | 706 | 10% | |||||||||||||||
|
|
|
|
|
|
|
|||||||||||||||
F-37
Table of Contents
| 10. | Financial Highlights |
The following per share data and financial ratios have been derived from information provided in the financial statements. The following is a schedule of financial highlights for one share of common stock during the years ended December 31, 2013 and 2012 and for the period from June 17, 2011 (commencement of operations) through December 31, 2011.
| For the year ended December 31, | June 17, 2011 (commencement of operations) through December 31, |
|||||||||||
| 2013 | 2012 | 2011 | ||||||||||
| OPERATING PERFORMANCE PER SHARE |
||||||||||||
| Net Asset Value, Beginning of Year |
$ | 9.75 | $ | 9.21 | $ | 9.00 | ||||||
| Net Investment Income (Loss), Before Expense Support/Reimbursement(1) |
0.49 | 0.51 | (0.23) | |||||||||
| Expense Support/(Reimbursement)(1) |
(0.01) | (0.01) | 0.60 | |||||||||
|
|
|
|
|
|
|
|||||||
| Net Investment Income(1) |
0.48 | 0.50 | 0.37 | |||||||||
| Net Realized and Unrealized Gain (Loss)(1)(2) |
0.55 | 0.70 | 0.08 | |||||||||
|
|
|
|
|
|
|
|||||||
| Net Increase (Decrease) Resulting from Investment Operations |
1.03 | 1.20 | 0.45 | |||||||||
| Distributions from Net Investment Income(3) |
(0.47) | (0.51) | (0.37) | |||||||||
| Distributions from Realized Gains(3) |
(0.27) | (0.10) | — | |||||||||
| Distributions in Excess of Net Investment Income(3)(4) |
(0.09) | (0.15) | — | |||||||||
|
|
|
|
|
|
|
|||||||
| Net Increase (Decrease) Resulting from Distributions to Common Shareholders |
(0.83) | (0.76) | (0.37) | |||||||||
| Issuance of common stock above net asset value(5) |
0.05 | 0.10 | 0.13 | |||||||||
| Repurchases of common stock(6) |
— | — | — | |||||||||
|
|
|
|
|
|
|
|||||||
| Net Increase Resulting from Capital Share Transactions |
0.05 | 0.10 | 0.13 | |||||||||
|
|
|
|
|
|
|
|||||||
| Net Asset Value, End of Year |
$ | 10.00 | $ | 9.75 | $ | 9.21 | ||||||
|
|
|
|
|
|
|
|||||||
| INVESTMENT RETURNS |
||||||||||||
| Total Investment Return-Net Price(7) |
10.2% | 14.2% | 6.5% | |||||||||
| Total Investment Return-Net Asset Value(8) |
11.4% | 14.3% | 6.5% | |||||||||
| RATIOS/SUPPLEMENTAL DATA (all amounts in thousands except ratios) |
|
|||||||||||
| Net Assets, End of Year |
$ | 1,430,434 | $ | 611,484 | $ | 65,163 | ||||||
| Average Net Assets(9) |
$ | 1,036,498 | $ | 304,261 | $ | 20,926 | ||||||
| Average Credit Facilities Borrowings(9) |
$ | 339,271 | $ | 110,072 | $ | 4,080 | ||||||
| Shares Outstanding, End of Year |
143,024 | 62,728 | 7,073 | |||||||||
| Weighted Average Shares Outstanding |
104,506 | 31,395 | 2,309 | |||||||||
| Ratios to Average Net Assets:(9) |
||||||||||||
| Total Investment Income |
11.54% | 11.69% | 4.58% | |||||||||
| Total Operating Expenses Before Expense Support/Reimbursement |
6.61% | 6.46% | 7.08% | |||||||||
| Total Operating Expenses After Expense Support/Reimbursement |
6.72% | 6.54% | 0.51% | |||||||||
| Net Investment Income |
4.82% | 5.16% | 4.08% | |||||||||
| Portfolio Turnover Rate |
73% | 85% | 1% | |||||||||
| Asset Coverage Ratio(10) |
2.96 | 3.59 | 3.57 | |||||||||
| (1) | The per share data was derived by using the weighted average shares outstanding during the period. |
| (2) | The amount shown at this caption is the balancing figure derived from the other figures in the schedule. The amount shown at this caption for a share outstanding throughout the year may not agree with the change in the aggregate gains and losses in portfolio securities for the year because of the timing of sales of the Company’s shares in relation to fluctuating market values for the portfolio. |
| (3) | The per share data for distributions is the actual amount of distributions paid or payable per share of common stock outstanding during the entire period; distributions per share are rounded to the nearest $0.01. |
| (4) | See Note 8 of the consolidated financial statements for further insight into the sources of distributions that contribute to the occurrence of distributions in excess of net investment income. |
F-38
Table of Contents
| (5) | The continuous issuance of common stock may cause an incremental increase in net asset value per share due to the sale of shares at the then prevailing public offering price and the receipt of net proceeds per share by the Company in excess of net asset value per share on each subscription closing date. The per share data was derived by computing (i) the sum of (A) the number of shares issued in connection with subscriptions and/or distribution reinvestment on each share transaction date times (B) the differences between the net proceeds per share and the net asset value per share on each share transaction date, divided by (ii) the total shares outstanding at the end of the period. |
| (6) | The per share impact of the Company’s repurchase of common stock is a reduction to net asset value of less than $0.01 per share during the applicable period. |
| (7) | Total investment return-net price is a measure of total return for shareholders who purchased the Company’s common stock at the beginning of the period, including dividends declared during the period. Total investment return-net price is based on (i) the purchase of one share at the public offering price, net of sales load, on the first day of the period, (ii) the sale at the net asset value per share on the last day of the period, of (A) one share plus (B) any fractional shares issued in connection with the reinvestment of monthly distributions, and (iii) the cash payment for distributions payable, if any, on the last day of the period. The total investment return-net price calculation assumes that (i) monthly cash distributions are reinvested in accordance with the Company’s distribution reinvestment plan and (ii) the fractional shares issued pursuant to the distribution reinvestment plan are issued at the then public offering price, net of sales load, on each monthly distribution payment date. Since there is no public market for the Company’s shares, then the terminal sales price per share is assumed to be equal to net asset value per share on the last day of the period. The Company’s performance changes over time and currently may be different than that shown above. Past performance is no guarantee of future results. Investment performance is presented without regard to sales load that may be incurred by shareholders in the purchase of the Company’s shares of common stock. |
| (8) | Total investment return-net asset value is a measure of the change in total value for shareholders who held the Company’s common stock at the beginning and end of the period, including distributions declared during the period. Total investment return-net asset value is based on (i) the beginning period net asset value per share on the first day of the period, (ii) the net asset value per share on the last day of the period, of (A) one share plus (B) any fractional shares issued in connection with the reinvestment of monthly distributions, and (iii) the value of distributions payable, if any, on the last day of the period. The total investment return-net asset value calculation assumes that (i) monthly cash distributions are reinvested in accordance with the Company’s distribution reinvestment plan and (ii) the fractional shares issued pursuant to the distribution reinvestment plan are issued at the then public offering price, net of sales load, on each monthly distribution payment date. Since there is no public market for the Company’s shares, then terminal market value per share is assumed to be equal to net asset value per share on the last day of the period. The Company’s performance changes over time and currently may be different than that shown above. Past performance is no guarantee of future results. Investment performance is presented without regard to sales load that may be incurred by shareholders in the purchase of the Company’s shares of common stock. |
| (9) | The computation of average net assets and average credit facilities borrowings during the period is based on the daily value of net assets and borrowing balances, respectively. |
| (10) | Asset coverage ratio is equal to (i) the sum of (A) net assets at the end of the period and (B) debt outstanding at the end of the period, divided by (ii) total debt outstanding at the end of the period. For purposes of the asset coverage ratio test applicable to the Company as a business development company, the Company regards the TRS total notional amount at the end of the period, less the total amount of cash collateral posted by Halifax Funding under the TRS, as a senior security for the life of the TRS. These data are presented in Note 4 of the condensed consolidated financial statements. |
11. Revolving Credit Facilities and Borrowings
The following tables present summary information with respect to the Company’s revolving credit facilities as of December 31, 2013 and 2012.
| As of December 31, 2013 | As of December 31, 2012 | |||||||||||||||
| Total Aggregate Principal Amount Committed (1) |
Principal Amount Outstanding |
Total Aggregate Principal Amount Committed (1) |
Principal Amount Outstanding |
|||||||||||||
| Deutsche Bank Credit Facility |
$ | 265,000 | $ | 264,440 | $ | 240,000 | $ | 159,620 | ||||||||
| BNP Credit Facility |
200,000 | 123,000 | - | - | ||||||||||||
| Senior Secured Credit Facility |
320,000(2) | 319,949(3) | - | - | ||||||||||||
|
|
|
|
|
|
|
|
|
|||||||||
| Total |
$ | 785,000 | $ | 707,389 | $ | 240,000 | $ | 159,620 | ||||||||
|
|
|
|
|
|
|
|
|
|||||||||
| (1) | Subject to borrowing base and leverage restrictions. |
| (2) | Provides for a feature that allows the Company, under certain circumstances, to increase the size of the Senior Secured Credit Facility to a maximum of $600,000. |
| (3) | Includes $108,680 denominated in Euros and $33,718 denominated in New Zealand Dollars. |
The weighted average stated interest rate and weighted average maturity, both on aggregate principal amount, of all debt outstanding as of December 31, 2013 were 2.5% and 2.2 years, respectively, and as of December 31, 2012 were 2.3% and 0.6 years, respectively.
Deutsche Bank Credit Facility
On August 22, 2011, CCT Funding entered into a revolving credit facility agreement (including amendments, the “Deutsche Bank Credit Facility”) with Deutsche Bank AG, New York Branch (“Deutsche Bank”). Deutsche Bank is a lender and serves as administrative agent under the Deutsche Bank Credit Facility. On February 11, 2013, CCT Funding, Deutsche Bank, and the other lenders party thereto entered into an amendment (the “Third Amendment”) to the Deutsche Bank Credit Facility.
The Third Amendment amended the Deutsche Bank Credit Facility by providing for, among other things, the extension of a new tranche of loan commitments (the “Tranche D Loans”) permitting additional borrowings in an aggregate amount of up to $100,000. Pursuant to the Third Amendment, Healthcare of Ontario Pension Plan became a Lender under the Deutsche Bank Credit Facility. The Third Amendment reclassified the prior Tranche B Loans as the “Tranche B2 Loans” and the prior Tranche C Loans as the “Tranche B1 Loans.” As amended, loans under the Deutsche Bank Credit Facility will generally bear interest based on a three-month adjusted LIBOR (“Adjusted LIBOR”) for the relevant interest period (except with respect to the Tranche A Loans, which bear interest based on
F-39
Table of Contents
one-month Adjusted LIBOR), plus a spread. Upfront fees and unfunded commitment fees were also incurred with respect to the Tranche B1 Loans, Tranche B2 Loans and Tranche D Loans under the Third Amendment. As of December 31, 2013, the Company has incurred deferred financing costs of $1,338 in connection with arranging and amending the Deutsche Bank Credit Facility.
Under the Deutsche Bank Credit Facility, CCT Funding has made certain representations and warranties and it is required to comply with various covenants, reporting requirements and other customary requirements for credit agreements of this nature. As of December 31, 2013, management believes that the Company was in compliance with the covenants of the Deutsche Bank Credit Facility.
The Tranche A Loans commitment of $75,000 matured on August 22, 2013. The tranches, amounts, maturity dates and interest rates (expressed as a spread to LIBOR) of the Deutsche Bank Credit Facility as of December 31, 2013 were as follows:
| Tranche |
Total Aggregate Principal Amount Committed |
Principal Amount Outstanding |
Maturity Date | LIBOR Spread | ||||||||
| Tranche B1 Loans |
$ | 65,000 | $ | 65,000 | February 11, 2014 | 1.50% | ||||||
| Tranche B2 Loans |
100,000 | 100,000 | February 11, 2015 | 2.33% | ||||||||
| Tranche D Loans |
100,000 | 99,440 | February 11, 2015 | 2.33% | ||||||||
|
|
|
|
|
|||||||||
| Total |
$ | 265,000 | $ | 264,440 | ||||||||
|
|
|
|
|
|||||||||
The components of interest expense, average interest rates (i.e., interest rate in effect plus the spread) and average outstanding balances for the Deutsche Bank Credit Facility were as follows:
| Years Ended December 31, | ||||||||
| 2013 | 2012 | |||||||
| Average Borrowings |
$ | 221,098 | $ | 110,072 | ||||
| Direct Interest Expense |
4,982 | 2,482 | ||||||
| Unused Commitment Fees |
299 | 236 | ||||||
| Amortization of Deferred Financing Costs |
573 | 148 | ||||||
|
|
|
|
|
|||||
| Total Interest Expense |
$ | 5,854 | $ | 2,866 | ||||
|
|
|
|
|
|||||
| Weighted Average Interest Rate |
2.3% | 2.3% | ||||||
BNP Credit Facility
On June 4, 2013, the Company entered into a committed facility arrangement (the “BNP Credit Facility, which became effective on June 12, 2013, with BNP Paribas Prime Brokerage, Inc. (“BNP”) under which the Company may borrow up to $200,000. On August 29, 2013, the Company assigned the agreements under the BNP Credit Facility to Paris Funding. The Company has the right to prepay loans under the BNP Credit Facility in whole or in part at any time. BNP can recall the loans under the BNP Credit Facility with 364 days notice.
Paris Funding pledges certain of its assets as collateral to secure borrowings under the BNP Credit Facility. As of December 31, 2013, Paris Funding had investments with a fair value of $244,981 pledged as collateral under the BNP Credit Facility. Interest is charged at the rate of one month LIBOR plus 1.10% and is payable monthly. On December 30, 2013, the annual commitment fee that Paris Funding pays on any unused commitment amounts increased from 0.55% to 0.75%. As of December 31, 2013, the Company has incurred deferred financing costs of $470 in connection with arranging the BNP Credit Facility.
In connection with the BNP Credit Facility, Paris Funding has made customary representations and warranties and is required to comply with various covenants, reporting requirements and other customary requirements for similar facilities. As of December 31, 2013, management believes that Paris Funding was in compliance with the covenants of the BNP Credit Facility.
Under the terms of the BNP Financing Agreements, BNP has the ability to borrow a portion of the pledged collateral (“Rehypothecated Securities”), subject to certain limits. Paris Funding may receive a fee from BNP in connection with Rehypothecated Securities meeting certain criteria and will continue to receive interest and the scheduled repayment of principal balances on Rehypothecated Securities.
F-40
Table of Contents
The components of interest expense, average interest rates (i.e., interest rate in effect plus the spread) and average outstanding balances for the BNP Credit Facility were as follows:
| Year Ended December 31, 2013 |
||||
| Average Borrowings (1) |
$ | 110,950 | ||
| Direct Interest Expense |
799 | |||
| Unused Commitment Fees |
257 | |||
| Amortization of Deferred Financing Costs |
263 | |||
|
|
|
|||
| Total Interest Expense |
$ | 1,319 | ||
|
|
|
|||
| Weighted Average Interest Rate |
1.3% | |||
| (1) | Average borrowings for the BNP Credit Facility for the year ended December 31, 2013 are calculated since the inception date of the facility, or June 12, 2013. |
Senior Secured Credit Facility
On September 4, 2013, the Company entered into a revolving credit facility (the “Senior Secured Credit Facility”) with certain lenders and JPMorgan Chase Bank, N.A., acting as administrative agent. The Senior Secured Credit Facility consists of loans to be made in dollars and other foreign currencies in an initial aggregate amount of $285,000, with an “accordion” feature that allows the Company, under certain circumstances, to increase the size of the facility to a maximum of $600,000. On October 24, 2013, the aggregate loan commitment under the Senior Secured Credit Facility was increased to $320,000. Availability under the Senior Secured Credit Facility will terminate on September 4, 2016 and the outstanding loans under the Senior Secured Credit Facility will mature on September 4, 2017. The stated borrowing rate under the Senior Secured Credit Facility is based on LIBOR plus an applicable spread of 2.50% or on an “alternate base rate” (which is the highest of a prime rate, the federal funds rate plus 0.50%, or one-month LIBOR plus 1.00%) plus an applicable spread of 1.50%, or, with respect to borrowings in non-LIBOR currencies, on a rate applicable to such currency plus an applicable spread of 2.50%. The Senior Secured Credit Facility is secured by substantially all of the Company’s portfolio investments and its cash and securities accounts excluding those held by CCT Funding and Paris Funding, and provides for a guaranty by certain subsidiaries of the Company. As of December 31, 2013, the Company has incurred deferred financing costs of $3,947 in connection with arranging and amending the Senior Secured Credit Facility.
Under the Senior Secured Credit Facility, the Company has made certain representations and warranties and is required to comply with various covenants, reporting requirements and other customary requirements for similar revolving credit facilities, including ones that require the Company to maintain a certain minimum shareholders’ equity and to maintain certain leverage ratios. The Senior Secured Credit Facility also includes usual and customary events of default for senior secured revolving credit facilities of this nature. As of December 31, 2013, management believes that the Company was in compliance with the covenants of the Senior Secured Credit Facility.
In addition to the covenants described above, borrowings under the Senior Secured Credit Facility (and the incurrence of certain other permitted debt) are subject to compliance with a borrowing base that applies different advance rates to different types of portfolio investments that serve as security and are included in the borrowing base.
The components of interest expense, average interest rates (i.e., interest rate in effect plus the spread) and average outstanding balances for the Senior Secured Credit Facility were as follows:
| Year Ended December 31, 2013 |
||||
| Average Borrowings (1) |
$ | 173,356 | ||
| Direct Interest Expense |
1,588 | |||
| Unused Commitment Fees |
180 | |||
| Amortization of Deferred Financing Costs |
315 | |||
|
|
|
|||
| Total Interest Expense |
$ | 2,083 | ||
|
|
|
|||
| Weighted Average Interest Rate |
2.8% | |||
| (1) | Average borrowings for the Senior Secured Credit Facility are calculated since the inception date of the facility, or September 4, 2013. |
F-41
Table of Contents
| 12. | Guarantees and Commitments |
In the normal course of business, the Company may enter into guarantees on behalf of portfolio companies. Under these arrangements, the Company would be required to make payments to third parties if the portfolio companies were to default on their related payment obligations. The Company has no such guarantees outstanding at December 31, 2013 and December 31, 2012. Unfunded commitments to provide funds to portfolio companies are not reflected on the Company’s consolidated statements of assets and liabilities. The Company’s unfunded commitments may be significant from time to time. Since these commitments may expire without being drawn upon, the total commitment amount does not necessarily represent future cash requirements. The Company intends to use cash flow from normal and early principal repayments and proceeds from borrowings and offerings to fund these commitments. As of December 31, 2013 and 2012, the Company’s unfunded commitments amounted to $17,500 and $1,012, respectively.
| 13. | Federal Income Taxes |
Income and capital gain distributions are determined in accordance with the Code and federal tax regulations, which may differ from amounts determined in accordance with GAAP. The book-to-tax basis differences, which could be material, are primarily due to differing treatments of income and gains on various investment securities held by the Company and expenses incurred by the Company. Permanent book and tax basis differences result in reclassifications to paid-in capital, undistributed net investment income and accumulated undistributed realized gain/(loss). Undistributed net investment income and accumulated undistributed net realized gain/(loss) may include temporary book and tax basis differences which will reverse in subsequent periods.
As of December 31, 2013 and 2012, the Company made the following reclassifications of permanent book and tax basis differences:
| Capital Accounts | 2013 | 2012 | ||||||
| Paid in capital |
$ | (6,502) | $ | (1,209) | ||||
| Undistributed (distributions in excess of) net investment income |
34,673 | 4,249 | ||||||
| Accumulated capital gain |
(28,171) | (3,040) | ||||||
The following table reconciles net increase in net assets resulting from operations to taxable income available for distributions for the years ending December 31, 2013 and 2012:
| Years Ended December 31, | ||||||||
|
|
2013 | 2012 | ||||||
| Net increase in net assets resulting from operations |
$ | 104,957 | $ | 25,654 | ||||
| Net change in unrealized appreciation on investments |
(31,027 | ) | (5,763 | ) | ||||
| Net change in unrealized depreciation on foreign currency translation |
1,530 | 43 | ||||||
| Unearned performance-based incentive fee on unrealized gains |
6,718 | 1,981 | ||||||
| Offering expense |
6,502 | 1,209 | ||||||
| Organization expenses |
(60 | ) | 836 | |||||
| Taxable income from investments on non-accrual status |
1,048 | - | ||||||
| Other book-tax differences |
48 | (4 | ) | |||||
|
|
|
|
|
|||||
| Taxable income available for distributions |
$ | 89,716 | $ | 23,956 | ||||
|
|
|
|
|
|||||
The tax character of shareholder distributions attributable to the fiscal years ended December 31, 2013 and December 31, 2012 were as follows:
| 2013 | 2012 | |||||||||||||||
| Paid Distributions attributable to: | Amount | Percentage | Amount | Percentage | ||||||||||||
| Ordinary income |
$ | 80,667 | 92.7 | %(1) | $ | 22,984 | 98.6 | %(1) | ||||||||
| Realized long term capital gains |
6,338 | 7.3 | % | 337 | 1.4 | % | ||||||||||
|
|
|
|
|
|
|
|
|
|||||||||
| Total |
$ | 87,005 | 100.0 | % | $ | 23,321 | 100.0 | % | ||||||||
|
|
|
|
|
|
|
|
|
|||||||||
| Paid distributions as a percentage of taxable income available for distributions | 97% | 97% | ||||||||||||||
| (1) | Including short term capital gains of $13,358 and $3,123 for the years ended December 31, 2013 and 2012, respectively. |
F-42
Table of Contents
As of December 31, 2013 and 2012, the components of tax basis accumulated earnings were as follows:
| 2013 | 2012 | |||||||
| Undistributed ordinary income – net |
$ | 3,531 | $ | 751 | ||||
| Unrealized gains – net |
35,624 | 4,160 | ||||||
| Other temporary adjustments |
(10,631 | ) | - | |||||
|
|
|
|
|
|||||
| Total accumulated earnings – net |
$ | 28,524 | $ | 4,911 | ||||
|
|
|
|
|
|||||
| 14. | Selected quarterly financial data (unaudited) |
| Quarter Ended | ||||||||||||||||
| December 31, 2013 | September 30, 2013 | June 30, 2013 | March 31, 2013 | |||||||||||||
| Total Investment Income |
$ | 48,151 | $ | 35,538 | $ | 20,535 | $ | 15,349 | ||||||||
| Total Investment Income per Common Share |
0.35 | 0.31 | 0.22 | 0.22 | ||||||||||||
| Net Investment Income |
19,240 | 15,725 | 13,567 | 1,403 | ||||||||||||
| Net Investment Income per Common Share |
0.14 | 0.14 | 0.15 | 0.02 | ||||||||||||
| Net Realized and Unrealized Gain (Loss) |
24,106 | 19,049 | (10,173 | ) | 22,040 | |||||||||||
| Net Realized and Unrealized Gain (Loss) per Common Share |
0.17 | 0.17 | (0.11 | ) | 0.31 | |||||||||||
| Net Increase in Net Assets Resulting from Operations |
43,346 | 34,774 | 3,394 | 23,443 | ||||||||||||
| Basic and Diluted Earnings per Common Share |
0.31 | 0.30 | 0.04 | 0.33 | ||||||||||||
| Net Asset Value per Common Share at End of Quarter |
10.00 | 9.92 | 9.78 | 9.91 | ||||||||||||
| Quarter Ended | ||||||||||||||||
| December 31, 2012 | September 30, 2012 | June 30, 2012 | March 31, 2012 | |||||||||||||
| Total Investment Income |
$ | 14,476 | $ | 11,479 | $ | 6,250 | $ | 3,377 | ||||||||
| Total Investment Income per Common Share |
0.27 | 0.30 | 0.28 | 0.31 | ||||||||||||
| Net Investment Income |
6,545 | 4,297 | 3,714 | 1,135 | ||||||||||||
| Net Investment Income per Common Share |
0.12 | 0.11 | 0.17 | 0.10 | ||||||||||||
| Net Realized and Unrealized Gain (Loss) |
381 | 6,878 | (1,638 | ) | 4,341 | |||||||||||
| Net Realized and Unrealized Gain (Loss) per Common Share |
0.01 | 0.18 | (0.07 | ) | 0.40 | |||||||||||
| Net Increase in Net Assets Resulting from Operations |
6,926 | 11,176 | 2,076 | 5,476 | ||||||||||||
| Basic and Diluted Earnings per Common Share |
0.13 | 0.30 | 0.09 | 0.50 | ||||||||||||
| Net Asset Value per Common Share at End of Quarter |
9.75 | 9.78 | 9.64 | 9.66 | ||||||||||||
| 15. | Subsequent Events |
On January 14, 2014, the Company filed its tender offer statement with the SEC on Schedule TO. The Company offered to repurchase up to 2,612,555 shares of common stock at a cash price of $10.00 per share. The tender offer terminated on February 26, 2014, upon which the Company repurchased 323,324 shares of common stock for an aggregate purchase price of $3,233.
On January 28, 2014, CCT Funding entered into an amendment (the “Fourth Amendment”) to its Deutsche Bank Credit Facility. The Fourth Amendment provided for, among other things, an increase in the maximum borrowings under the Tranche B1 Loans from $65,000 to $140,000. The Fourth Amendment extends the maturity date of the Tranche B1 Loans to January 28, 2015. As amended, the Tranche B1 Loans will bear interest at three-month LIBOR plus 1.80%.
As of March 18, 2014, the total amount borrowed under the Company’s credit facilities was $432,776.
On March 18, 2014, the Company’s board of directors declared a weekly distribution of $0.015483 per share for 13 record dates beginning April 1, 2014 and ending on June 24, 2014.
F-43