Attached files
| file | filename |
|---|---|
| EX-32.1 - CERTIFICATION - Corporate Capital Trust, Inc. | d624213dex321.htm |
| EX-31.1 - CERTIFICATION - Corporate Capital Trust, Inc. | d624213dex311.htm |
| EX-31.2 - CERTIFICATION - Corporate Capital Trust, Inc. | d624213dex312.htm |
| EX-10.32 - AMENDING AGREEMENT, DATED AS OF NOVEMBER 12, 2013 - Corporate Capital Trust, Inc. | d624213dex1032.htm |
UNITED STATES
SECURITIES AND EXCHANGE COMMISSION
Washington, D.C. 20549
FORM 10-Q
| x | QUARTERLY REPORT PURSUANT TO SECTION 13 OR 15 (d) OF THE SECURITIES EXCHANGE ACT OF 1934 |
For the quarterly period ended September 30, 2013
OR
| ¨ | TRANSITION REPORT PURSUANT TO SECTION 13 OR 15 (d) OF THE SECURITIES EXCHANGE ACT OF 1934 |
Commission file number: 814-00827
Corporate Capital Trust, Inc.
(Exact name of registrant as specified in its charter)
| Maryland | 27-2857503 | |
| (State or other jurisdiction of incorporation or organization) |
(I.R.S. Employer Identification No.) |
| CNL Center at City Commons 450 South Orange Avenue Orlando, Florida |
32801 | |
| (Address of principal executive offices) | (Zip Code) |
Registrant’s telephone number, including area code (866) 745-3797
Indicate by check mark whether the registrant (1) has filed all reports required to be filed by Section 13 or 15(d) of the Securities Exchange Act of 1934 during the preceding 12 months (or for such shorter period that the registrant was required to file such reports), and (2) has been subject to such filing requirements for the past 90 days. Yes x No ¨
Indicate by check mark whether the registrant has submitted electronically and posted on its corporate Web site, if any, every Interactive Data File required to be submitted and posted pursuant to Rule 405 of Regulation S-T (§232.405 of this chapter) during the preceding 12 months (or for such shorter period that the registrant was required to submit and post such files). Yes ¨ No ¨
Indicate by check mark whether the registrant is a large accelerated filer, an accelerated filer, a non-accelerated filer, or a smaller reporting company. See definition of “large accelerated filer,” “accelerated filer” and “smaller reporting company” in Rule 12b-2 of the Exchange Act.
| Large accelerated filer | ¨ | Accelerated filer | ¨ | |||||||
| Non-accelerated filer | x | Smaller reporting company | ¨ | |||||||
| Do not check if smaller reporting company | ||||||||||
Indicate by check mark whether the registrant is a shell company (as defined in Rule 12b-2 of the Exchange Act). Yes ¨ No x
The number of shares of common stock of the registrant outstanding as of November 12, 2013 was 140,664,832.
CORPORATE CAPITAL TRUST, INC.
INDEX
| PAGE | ||||||
| PART I. FINANCIAL INFORMATION |
| |||||
| Item 1. | Financial Statements: | |||||
| Condensed Consolidated Statements of Assets and Liabilities (unaudited) | 2 | |||||
| Condensed Consolidated Statements of Operations (unaudited) | 3 | |||||
| Condensed Consolidated Statements of Changes in Net Assets (unaudited) | 4 | |||||
| Condensed Consolidated Statements of Cash Flows (unaudited) | 5 | |||||
| Condensed Consolidated Schedules of Investments (unaudited) | 6 | |||||
| Notes to Condensed Consolidated Financial Statements (unaudited) | 26 | |||||
| Item 2. | Management’s Discussion and Analysis of Financial Condition and Results of Operations | 49 | ||||
| Item 3. | Quantitative and Qualitative Disclosures about Market Risk | 67 | ||||
| Item 4. | Controls and Procedures | 70 | ||||
| PART II. OTHER INFORMATION | ||||||
| Item 1. | Legal Proceedings | 70 | ||||
| Item 1A. | Risk Factors | 70 | ||||
| Item 2. | Unregistered Sales of Equity Securities and Use of Proceeds | 79 | ||||
| Item 3. | Defaults Upon Senior Securities | 79 | ||||
| Item 4. | Mine Safety Disclosures | 79 | ||||
| Item 5. | Other Information | 79 | ||||
| Item 6. | Exhibits | 79 | ||||
| Signatures | 80 | |||||
| Exhibit Index | 81 | |||||
Corporate Capital Trust, Inc. and Subsidiaries
Condensed Consolidated Statements of Assets and Liabilities (unaudited)
(in thousands, except share and per share amounts)
| September 30, 2013 | December 31, 2012 | |||||||
| Assets |
||||||||
| Investments, at fair value (amortized cost of $1,650,444 and $704,630) - including $270,540 and $0 of investments pledged to creditors (Note 11) |
$ | 1,674,766 | $ | 710,871 | ||||
| Cash |
22,652 | 306 | ||||||
| Cash denominated in foreign currency (cost $4,508 and $-, respectively) |
4,555 | — | ||||||
| Collateral on deposit with custodian |
55,021 | 87,974 | ||||||
| Dividends and interest receivable |
24,426 | 9,258 | ||||||
| Receivable for investments sold |
14,410 | 37,704 | ||||||
| Principal receivable |
2,754 | 463 | ||||||
| Unrealized appreciation on derivative instruments |
838 | 1,358 | ||||||
| Deferred offering expense |
4,110 | 2,146 | ||||||
| Prepaid and deferred expenses |
4,934 | 244 | ||||||
|
|
|
|
|
|||||
| Total assets |
1,808,466 | 850,324 | ||||||
|
|
|
|
|
|||||
| Liabilities |
||||||||
| Revolving credit facilities |
$ | 506,426 | $ | 159,620 | ||||
| Payable for investments purchased |
26,112 | 72,435 | ||||||
| Accrued performance-based incentive fees |
8,115 | 2,087 | ||||||
| Accrued investment advisory fees |
2,856 | 1,434 | ||||||
| Unrealized depreciation on derivative instruments |
3,093 | 156 | ||||||
| Accrued reimbursement of expense support |
1,136 | 1,830 | ||||||
| Accrued directors’ fees |
45 | 10 | ||||||
| Other accrued expenses and liabilities |
2,839 | 1,268 | ||||||
|
|
|
|
|
|||||
| Total liabilities |
|
550,622
|
|
|
238,840
|
| ||
|
|
|
|
|
|||||
| Net Assets |
||||||||
| Common stock, $0.001 par value per share, 1,000,000,000 shares authorized, 126,804,102 and 62,728,439 shares issued and
outstanding |
127 | 63 | ||||||
| Paid-in capital in excess of par value |
1,245,840 | 607,351 | ||||||
| Distributions in excess of net investment income |
(10,278) | (3,375) | ||||||
| Accumulated net unrealized appreciation on investments, derivative instruments and foreign currency translation |
22,155 | 7,445 | ||||||
|
|
|
|
|
|||||
| Net assets |
$ | 1,257,844 | $ | 611,484 | ||||
|
|
|
|
|
|||||
| Net asset value per share |
$ | 9.92 | $ | 9.75 | ||||
|
|
|
|
|
|||||
See notes to condensed consolidated financial statements.
2
Corporate Capital Trust, Inc. and Subsidiaries
Condensed Consolidated Statements of Operations (unaudited)
(in thousands, except share and per share amounts)
| For the three months ended | For the nine months ended | |||||||||||||||
| September 30, 2013 |
September 30, 2012 |
September 30, 2013 |
September 30, 2012 |
|||||||||||||
| Investment income |
||||||||||||||||
| Interest income |
$ | 29,104 | $ | 11,223 | $ | 63,845 | $ | 20,182 | ||||||||
| Fee income |
6,433 | 256 | 7,379 | 920 | ||||||||||||
| Dividend income |
1 | — | 198 | 4 | ||||||||||||
|
|
|
|
|
|
|
|
|
|||||||||
|
Total investment income |
|
35,538
|
|
|
11,479
|
|
|
71,422
|
|
|
21,106
|
| ||||
|
|
|
|
|
|
|
|
|
|||||||||
| Operating expenses |
||||||||||||||||
| Investment advisory fees |
8,098 | 2,704 | 19,449 | 5,220 | ||||||||||||
| Performance-based incentive fees |
5,891 | 1,388 | 6,028 | 1,921 | ||||||||||||
| Interest expense |
2,213 | 921 | 5,068 | 1,755 | ||||||||||||
| Offering expense |
1,845 | 404 | 4,492 | 487 | ||||||||||||
| Administrative services |
561 | 351 | 1,461 | 785 | ||||||||||||
| Professional services |
311 | 199 | 979 | 755 | ||||||||||||
| Organization expenses |
— | — | — | 896 | ||||||||||||
| Custodian and accounting fees |
143 | 58 | 358 | 127 | ||||||||||||
| Director fees and expenses |
97 | 36 | 247 | 135 | ||||||||||||
| Other |
654 | 322 | 1,509 | 641 | ||||||||||||
|
|
|
|
|
|
|
|
|
|||||||||
| Total operating expenses |
19,813 | 6,383 | 39,591 | 12,722 | ||||||||||||
| Reimbursement of expense support |
— | 798 | 1,136 | 828 | ||||||||||||
| Expense support |
— | — | — | (1,590) | ||||||||||||
|
|
|
|
|
|
|
|
|
|||||||||
| Net expenses |
19,813 | 7,181 | 40,727 | 11,960 | ||||||||||||
|
|
|
|
|
|
|
|
|
|||||||||
|
Net investment income |
15,725 | 4,298 | 30,695 | 9,146 | ||||||||||||
|
|
|
|
|
|
|
|
|
|||||||||
| Realized and unrealized gain (loss): |
||||||||||||||||
| Net realized gain on investments |
1,314 | 478 | 5,905 | 1,750 | ||||||||||||
| Net realized gain on derivative instruments |
6,998 | — | 9,648 | — | ||||||||||||
| Net realized gain (loss) on foreign currency transactions |
1,050 | (29) | 653 | 14 | ||||||||||||
| Net change in unrealized appreciation on investments |
19,052 | 6,546 | 18,081 | 8,069 | ||||||||||||
| Net change in unrealized depreciation on derivative instruments |
(9,463) | (138) | (3,457) | (211) | ||||||||||||
| Net change in unrealized appreciation (depreciation) on foreign currency translation |
98 | 21 | 86 | (41) | ||||||||||||
|
|
|
|
|
|
|
|
|
|||||||||
|
Net realized and unrealized gain |
|
19,049
|
|
|
6,878
|
|
|
30,916
|
|
|
9,581
|
| ||||
|
|
|
|
|
|
|
|
|
|||||||||
|
Net increase in net assets resulting from operations |
$ | 34,774 | $ | 11,176 | $ | 61,611 | $ | 18,727 | ||||||||
|
|
|
|
|
|
|
|
|
|||||||||
| Net Investment Income Per Share |
$ | 0.14 | $ | 0.11 | $ | 0.33 | $ | 0.39 | ||||||||
|
|
|
|
|
|
|
|
|
|||||||||
| Diluted and Basic Earnings Per Share |
$ | 0.30 | $ | 0.30 | $ | 0.66 | $ | 0.79 | ||||||||
|
|
|
|
|
|
|
|
|
|||||||||
| Weighted Average Shares Outstanding |
115,304,666 | 37,881,506 | 93,148,769 | 23,696,227 | ||||||||||||
| Dividends Declared Per Share |
$ | 0.20 | $ | 0.19 | 0.59 | 0.57 | ||||||||||
See notes to condensed consolidated financial statements.
3
Corporate Capital Trust, Inc. and Subsidiaries
Condensed Consolidated Statements of Changes in Net Assets (unaudited)
(in thousands, except share amounts)
| For the nine months ended | ||||||||
| September 30, 2013 | September 30, 2012 | |||||||
| Operations |
||||||||
| Net investment income |
$ | 30,695 | $ | 9,146 | ||||
| Net realized gain on investments, derivative instruments and foreign currency transactions |
16,206 | 1,764 | ||||||
| Net change in unrealized appreciation on investments, derivative instruments and foreign currency translation |
14,710 | 7,817 | ||||||
|
|
|
|
|
|||||
| Net increase in net assets resulting from operations |
61,611 | 18,727 | ||||||
|
|
|
|
|
|||||
| Distributions to shareholders from |
||||||||
| Net investment income |
(30,695) | (9,152) | ||||||
| Realized gains |
(16,206) | (1,764) | ||||||
| Distributions in excess of net investment income (see Note 8) |
(6,903) | (2,245) | ||||||
|
|
|
|
|
|||||
| Net decrease in net assets resulting from shareholders distributions |
(53,804) | (13,161) | ||||||
|
|
|
|
|
|||||
| Capital share transactions |
||||||||
| Issuance of shares of common stock |
613,980 | 372,910 | ||||||
| Reinvestment of shareholders distributions |
27,215 | 6,816 | ||||||
| Repurchase of shares of common stock |
(2,642) | (458) | ||||||
|
|
|
|
|
|||||
| Net increase in net assets resulting from capital share transactions |
638,553 | 379,268 | ||||||
|
|
|
|
|
|||||
| Total increase in net assets |
646,360 | 384,834 | ||||||
| Net assets at beginning of period |
611,484 | 65,163 | ||||||
|
|
|
|
|
|||||
| Net assets at end of period |
$ | 1,257,844 | $ | 449,997 | ||||
|
|
|
|
|
|||||
| Capital share activity |
||||||||
| Shares issued from subscriptions |
61,616,518 | 38,290,080 | ||||||
| Shares issued from reinvestment of distributions |
2,728,786 | 698,628 | ||||||
| Shares repurchased |
(269,641) | (47,481) | ||||||
|
|
|
|
|
|||||
| Net increase in shares outstanding |
64,075,663 | 38,941,227 | ||||||
|
|
|
|
|
|||||
| Distributions in excess of net investment income at end of period |
$ | (10,278) | $ | (2,245) | ||||
See notes to condensed consolidated financial statements.
4
Corporate Capital Trust, Inc. and Subsidiaries
Condensed Consolidated Statements of Cash Flows (unaudited)
(in thousands)
| For the nine months ended | ||||||||
| September 30, 2013 | September 30, 2012 | |||||||
| Operating Activities: |
||||||||
| Net increase in net assets resulting from operations |
$ | 61,611 | $ | 18,727 | ||||
| Adjustments to reconcile net increase in net assets resulting from operations to net cash used in operating activities: | ||||||||
| Purchases of investments |
(1,443,232) | (598,362) | ||||||
| Increase (decrease) in payable for investments purchased |
(46,307) | 6,054 | ||||||
| Paid-in-kind interest |
(995) | — | ||||||
| Proceeds from sales of investments |
422,376 | 100,188 | ||||||
| Proceeds from principal payments |
78,029 | 16,323 | ||||||
| Net realized gain on investments |
(5,905) | (1,750) | ||||||
| Net change in unrealized appreciation on investments |
(18,081) | (8,069) | ||||||
| Net change in unrealized depreciation on derivative instruments |
3,457 | 211 | ||||||
| Net change in unrealized (appreciation) depreciation on foreign currency translation |
(86) | 41 | ||||||
| Amortization of premium/discount - net |
(586) | (105) | ||||||
| Amortization of deferred financing cost |
665 | 108 | ||||||
| Decrease (increase) in short-term investments, net |
4,499 | (5,226) | ||||||
| Decrease in collateral on deposit with custodian |
32,953 | — | ||||||
| Increase in dividend and interest receivable |
(15,144) | (11,131) | ||||||
| Decrease (increase) in receivable for investments sold |
23,294 | (21,134) | ||||||
| Increase in principal receivable |
(2,291) | (432) | ||||||
| Decrease in receivable from advisors |
— | 565 | ||||||
| Increase in other assets |
(2,061) | (1,597) | ||||||
| Increase in accrued investment advisory fees |
1,422 | 1,687 | ||||||
| Increase in accrued performance-based incentive fees |
6,028 | 1,743 | ||||||
| Increase in accrued directors’ fees |
35 | — | ||||||
| Increase in other accrued expenses and liabilities |
621 | 945 | ||||||
|
|
|
|
|
|||||
| Net cash used in operating activities |
(899,698) | (501,214) | ||||||
|
|
|
|
|
|||||
| Financing Activities: |
||||||||
| Proceeds from issuance of shares of common stock |
613,980 | 372,910 | ||||||
| Payment on repurchase of shares of common stock |
(2,642) | (458) | ||||||
| Distributions paid |
(26,589) | (6,744) | ||||||
| Borrowings under credit facilities |
496,806 | 135,580 | ||||||
| Repayments of credit facility |
(150,000) | — | ||||||
| Deferred financing costs paid |
(5,002) | (61) | ||||||
|
|
|
|
|
|||||
| Net cash provided by financing activities |
926,553 | 501,227 | ||||||
|
|
|
|
|
|||||
| Effect of exchange rate changes on cash |
46 | — | ||||||
|
|
|
|
|
|||||
| Net increase in cash |
26,901 | 13 | ||||||
| Cash and cash denominated in foreign currency, beginning of period |
306 | — | ||||||
|
|
|
|
|
|||||
| Cash and cash denominated in foreign currency, end of period |
$ | 27,207 | $ | 13 | ||||
|
|
|
|
|
|||||
| Supplemental disclosure of cash flow information and non-cash financing activities: |
||||||||
| Cash paid for interest |
$ | 4,172 | $ | 1,194 | ||||
| Dividend distributions reinvested |
$ | 27,215 | $ | 6,816 | ||||
| Deferred financing costs accrued in other accrued expenses and liabilities |
$ | 256 | $ | — | ||||
See notes to condensed consolidated financial statements.
5
Corporate Capital Trust, Inc. and Subsidiaries
Condensed Consolidated Schedule of Investments (unaudited)
As of September 30, 2013
(in thousands, except share amounts)
| Company (a) | Industry | Investments | Interest Rate |
EURIBOR/ Floor |
Maturity Date |
No. Shares/ Amount (b) |
Cost (c) | Fair Value | % of Net Assets |
|||||||||||||||||||||||||||||
| Non-Control/Non-Affiliate Investments(d)—132.4% |
|
|||||||||||||||||||||||||||||||||||||
| Air Distribution Technologies, Inc. | Capital Goods | Senior Debt | L + 800 | 1.25% | 5/11/2020 | $ | 3,454 | $ | 3,408 | $ | 3,532 | 0.3% | ||||||||||||||||||||||||||
| Algeco/Scotsman Holdings S.A.R.L. (LU)(e) |
Consumer Durables & Apparel | Subordinated Debt(f) Subordinated Debt(f)(g)(h) |
|
15.75% PIK 10.75% |
|
|
5/1/2018 10/15/2019 |
|
|
24,473 179 |
|
|
24,243 181 |
|
|
23,983 180 |
|
|
1.9% 0.0% |
| ||||||||||||||||||
|
|
|
|
|
|
|
|||||||||||||||||||||||||||||||||
| 24,424 | 24,163 | 1.9% | ||||||||||||||||||||||||||||||||||||
| Allen Systems Group, Inc. | Software & Services | Senior Debt(g)(h) | 10.50% | 11/15/2016 | 106 | 71 | 63 | 0.0% | ||||||||||||||||||||||||||||||
| American Builders & Contractors Supply Co, Inc. |
Capital Goods | Subordinated Debt(g)(h) | 5.63% | 4/15/2021 | 5,114 | 5,114 | 5,031 | 0.4% | ||||||||||||||||||||||||||||||
| American Casino & Entertainment Properties, LLC | Consumer Services | Senior Debt(i) | L + 1000 | 1.25% | 1/3/2020 | 1,832 | 1,851 | 1,892 | 0.1% | |||||||||||||||||||||||||||||
| American Gaming Systems, LLC | Consumer Services | Senior Debt(j)(k) | L + 1000 | 1.50% | 8/15/2016 | 21,783 | 21,356 | 22,219 | 1.8% | |||||||||||||||||||||||||||||
| American Rock Salt Co., LLC | Materials | Senior Debt(i) | L + 425 | 1.25% | 4/25/2017 | 2,436 | 2,411 | 2,438 | 0.2% | |||||||||||||||||||||||||||||
| Senior Debt(g)(h) | 8.25% | 5/1/2018 | 9,690 | 9,032 | 9,351 | 0.7% | ||||||||||||||||||||||||||||||||
|
|
|
|
|
|
|
|||||||||||||||||||||||||||||||||
| 11,443 | 11,789 | 0.9% | ||||||||||||||||||||||||||||||||||||
| Angelica Corp. | Health Care Equipment & Services | Senior Debt(j) | L + 875 | 1.25% | 7/15/2019 | 50,869 | 50,869 | 51,072 | 4.1% | |||||||||||||||||||||||||||||
| Applied Systems, Inc. | Software & Services | Senior Debt(i) | L + 725 | 1.00% | 6/8/2017 | 5,895 | 5,973 | 5,954 | 0.5% | |||||||||||||||||||||||||||||
| Artesyn Technologies, Inc. | Technology Hardware & Equipment | Senior Debt(g)(k) | 9.75% | 10/15/2020 | 7,067 | 7,067 | 7,067 | 0.6% | ||||||||||||||||||||||||||||||
| Arysta Lifescience SPC, LLC | Food, Beverage & Tobacco | Senior Debt(f)(i) | L + 700 | 1.25% | 11/30/2020 | 16,305 | 16,146 | 16,326 | 1.3% | |||||||||||||||||||||||||||||
| Aspen Dental Management, Inc. | Health Care Equipment & Services | Senior Debt(i) | L + 550 | 1.50% | 10/6/2016 | 6,069 | 6,017 | 5,867 | 0.5% | |||||||||||||||||||||||||||||
| Audatex North America, Inc. | Software & Services | Subordinated Debt(f)(g)(h) | 6.00% | 6/15/2021 | 2,454 | 2,454 | 2,503 | 0.2% | ||||||||||||||||||||||||||||||
| Avaya, Inc. | Technology Hardware & Equipment | Senior Debt(i) | L + 675 | 1.25% | 3/31/2018 | 34,008 | 33,176 | 32,289 | 2.6% | |||||||||||||||||||||||||||||
| Senior Debt(g)(i) | 7.00% | 4/1/2019 | 9,125 | 8,455 | 8,532 | 0.7% | ||||||||||||||||||||||||||||||||
| Senior Debt(g)(i) | 9.00% | 4/1/2019 | 7,048 | 7,035 | 6,837 | 0.5% | ||||||||||||||||||||||||||||||||
|
|
|
|
|
|
|
|||||||||||||||||||||||||||||||||
| 48,666 | 47,658 | 3.8% | ||||||||||||||||||||||||||||||||||||
| Brake Bros Ltd. (UK)(e) | Food & Staples Retailing | Senior Debt(f)(GBP) |
|
L + 325, 3.00% PIK |
|
3/12/2017 | £ | 8,586 | 11,851 | 12,833 | 1.0% | |||||||||||||||||||||||||||
See notes to condensed consolidated financial statements.
6
Corporate Capital Trust, Inc. and Subsidiaries
Condensed Consolidated Schedule of Investments (unaudited) (continued)
As of September 30, 2013
(in thousands, except share amounts)
| Company (a) | Industry | Investments | Interest Rate |
EURIBOR/ LIBOR Floor |
Maturity Date |
No. Shares/ Principal Amount (b) |
Cost (c) | Fair Value | % of Net Assets |
|||||||||||||||||||||||||||||||
|
|
||||||||||||||||||||||||||||||||||||||||
| Caraustar Industries, Inc. | Materials | Senior Debt(i) | L + 625 | 1.25% | 5/1/2019 | $ | 3,657 | $ | 3,631 | $ | 3,705 | 0.3% | ||||||||||||||||||||||||||||
|
|
||||||||||||||||||||||||||||||||||||||||
| Catalina Marketing Corp. | Media | Senior Debt(i) | L + 550 | 9/29/2017 | 8,728 | 8,758 | 8,805 | 0.7% | ||||||||||||||||||||||||||||||||
| Subordinated Debt(g)(h) | 10.50% | 10/1/2015 | 27,154 | 27,292 | 27,222 | 2.2% | ||||||||||||||||||||||||||||||||||
|
|
|
|
|
|
|
|||||||||||||||||||||||||||||||||||
| 36,050 | 36,027 | 2.9% | ||||||||||||||||||||||||||||||||||||||
|
|
||||||||||||||||||||||||||||||||||||||||
| CDW Corp. | Technology Hardware & Equipment | Subordinated Debt(i) | 12.54% | 10/12/2017 | 5,028 | 5,331 | 5,229 | 0.4% | ||||||||||||||||||||||||||||||||
|
|
||||||||||||||||||||||||||||||||||||||||
| Cedar Bay Generating Co., LP | Utilities | Senior Debt(f)(i) | L + 500 | 1.25% | 4/23/2020 | 2,853 | 2,820 | 2,881 | 0.2% | |||||||||||||||||||||||||||||||
|
|
||||||||||||||||||||||||||||||||||||||||
| Cemex Espana S.A. (ES)(e) | Materials | Senior Debt(f)(EUR) | E + 450 | 2/14/2017 | € | 929 | 1,121 | 1,238 | 0.1% | |||||||||||||||||||||||||||||||
|
|
||||||||||||||||||||||||||||||||||||||||
| Cemex Materials, LLC | Materials | Subordinated Debt(g)(i) | 7.70% | 7/21/2025 | $ | 23,312 | 22,934 | 23,895 | 1.9% | |||||||||||||||||||||||||||||||
|
|
||||||||||||||||||||||||||||||||||||||||
| Cemex S.A.B. de C.V. (MX)(e) | Materials | Senior Debt(f) | L + 450 | 2/14/2017 | 3,441 | 3,207 | 3,364 | 0.3% | ||||||||||||||||||||||||||||||||
|
|
||||||||||||||||||||||||||||||||||||||||
| Cengage Learning Acquisitions, Inc. | Media | Senior Debt(i)(l) | L + 550 | 7/5/2017 | 2,701 | 2,028 | 1,988 | 0.2% | ||||||||||||||||||||||||||||||||
| Senior Debt(g)(i)(l) | 11.50% | 4/15/2020 | 12,154 | 12,398 | 9,055 | 0.7% | ||||||||||||||||||||||||||||||||||
|
|
|
|
|
|
|
|||||||||||||||||||||||||||||||||||
| 14,426 | 11,043 | 0.9% | ||||||||||||||||||||||||||||||||||||||
|
|
||||||||||||||||||||||||||||||||||||||||
| Cequel Communications Holdings, LLC | Media | Subordinated Debt(g)(h) | 5.13% | 12/15/2021 | 5,000 | 4,829 | 4,712 | 0.4% | ||||||||||||||||||||||||||||||||
|
|
||||||||||||||||||||||||||||||||||||||||
| Ceridian Corp. | Commercial & Professional Services | Senior Debt(i) | L + 425 | 5/9/2017 | 5,321 | 5,299 | 5,332 | 0.4% | ||||||||||||||||||||||||||||||||
| Senior Debt(g)(h) | 8.88% | 7/15/2019 | 2,123 | 2,123 | 2,431 | 0.2% | ||||||||||||||||||||||||||||||||||
| Subordinated Debt(g)(h) | 11.00% | 3/15/2021 | 16,201 | 17,611 | 18,753 | 1.5% | ||||||||||||||||||||||||||||||||||
|
|
|
|
|
|
|
|||||||||||||||||||||||||||||||||||
| 25,033 | 26,516 | 2.1% | ||||||||||||||||||||||||||||||||||||||
|
|
||||||||||||||||||||||||||||||||||||||||
| CHG Companies, Inc. | Health Care Equipment & Services | Senior Debt(i) | L + 775 | 1.25% | 11/19/2020 | 11,764 | 11,614 | 12,028 | 1.0% | |||||||||||||||||||||||||||||||
|
|
||||||||||||||||||||||||||||||||||||||||
| Commscope, Inc. | Technology Hardware & Equipment | Subordinated Debt(g)(h) |
|
6.63% or 7.38% PIK |
|
6/1/2020 | 5,000 | 4,975 | 4,975 | 0.4% | ||||||||||||||||||||||||||||||
|
|
||||||||||||||||||||||||||||||||||||||||
| CompuCom Systems, Inc. | Software & Services | Subordinated Debt(g)(h) | 7.00% | 5/1/2021 | 9,847 | 9,559 | 9,699 | 0.8% | ||||||||||||||||||||||||||||||||
|
|
||||||||||||||||||||||||||||||||||||||||
| Continental Building Products, LLC | Materials | Senior Debt(i) | L + 350 | 1.00% | 8/28/2020 | 9,226 | 9,181 | 9,234 | 0.7% | |||||||||||||||||||||||||||||||
| Senior Debt(i) | L + 750 | 1.00% | 2/26/2021 | 11,945 | 11,826 | 11,945 | 0.9% | |||||||||||||||||||||||||||||||||
|
|
|
|
|
|
|
|||||||||||||||||||||||||||||||||||
| 21,007 | 21,179 | 1.6% | ||||||||||||||||||||||||||||||||||||||
|
|
||||||||||||||||||||||||||||||||||||||||
| ConvaTec Healthcare E SA (LU)(e) | Health Care Equipment & Services | Subordinated Debt(f)(g)(i) |
|
8.25% or 9.00% PIK |
|
1/15/2019 | 2,545 | 2,520 | 2,545 | 0.2% | ||||||||||||||||||||||||||||||
|
|
||||||||||||||||||||||||||||||||||||||||
See notes to condensed consolidated financial statements.
7
Corporate Capital Trust, Inc. and Subsidiaries
Condensed Consolidated Schedule of Investments (unaudited) (continued)
As of September 30, 2013
(in thousands, except share amounts)
| Company (a) | Industry | Investments | Interest Rate |
EURIBOR/ LIBOR |
Maturity Date |
No. Shares/ Principal Amount (b) |
Cost (c) | Fair Value | % of Net Assets |
|||||||||||||||||||||||||
|
|
||||||||||||||||||||||||||||||||||
| CRC Health Corp. | Health Care Equipment & Services | Senior Debt(i) | L + 450 | 11/16/2015 | $ | 1,184 | $ | 1,143 | $ | 1,190 | 0.1% | |||||||||||||||||||||||
| Subordinated Debt(h) | 10.75% | 2/1/2016 | 6,021 | 6,049 | 6,021 | 0.5% | ||||||||||||||||||||||||||||
|
|
|
|
|
|
|
|||||||||||||||||||||||||||||
| 7,192 | 7,211 | 0.6% | ||||||||||||||||||||||||||||||||
|
|
||||||||||||||||||||||||||||||||||
| CSM Bakery Products (NL)(e) | Food, Beverage & Tobacco | Senior Debt(f)(i) | L + 750 | 1.00% | 7/3/2021 | 15,175 | 15,038 | 15,147 | 1.2% | |||||||||||||||||||||||||
|
|
||||||||||||||||||||||||||||||||||
| CTI Foods Holding Co., LLC | Food, Beverage & Tobacco | Senior Debt | L + 725 | 1.00% | 6/28/2021 | 23,219 | 22,877 | 23,161 | 1.8% | |||||||||||||||||||||||||
|
|
||||||||||||||||||||||||||||||||||
| Cunningham Lindsey U.S., Inc. | Insurance | Senior Debt(k) | L + 800 | 1.25% | 6/10/2020 | 5,178 | 5,131 | 5,167 | 0.4% | |||||||||||||||||||||||||
|
|
||||||||||||||||||||||||||||||||||
| Data Device Corp. | Capital Goods | Senior Debt(i)(k) | L + 650 | 1.50% | 7/11/2018 | 10,750 | 10,559 | 10,535 | 0.8% | |||||||||||||||||||||||||
| Senior Debt | L + 1000 | 1.50% | 7/11/2019 | 8,000 | 7,860 | 7,520 | 0.6% | |||||||||||||||||||||||||||
|
|
|
|
|
|
|
|||||||||||||||||||||||||||||
| 18,419 | 18,055 | 1.4% | ||||||||||||||||||||||||||||||||
|
|
||||||||||||||||||||||||||||||||||
| Digital Insight Corp. | Software & Services | Senior Debt(j) | L + 425 | 1.25% | 8/1/2019 | 14,690 | 14,547 | 14,742 | 1.2% | |||||||||||||||||||||||||
| Senior Debt(j) | L + 825 | 1.25% | 8/1/2020 | 18,351 | 17,992 | 18,424 | 1.5% | |||||||||||||||||||||||||||
|
|
|
|
|
|
|
|||||||||||||||||||||||||||||
| 32,539 | 33,166 | 2.7% | ||||||||||||||||||||||||||||||||
|
|
||||||||||||||||||||||||||||||||||
| Distribution International, Inc. | Retailing | Senior Debt | L + 650 | 1.00% | 7/16/2019 | 48,508 | 48,037 | 48,295 | 3.8% | |||||||||||||||||||||||||
|
|
||||||||||||||||||||||||||||||||||
| DJO Finance, LLC | Health Care Equipment & Services | Senior Debt(i) | 8.75% | 3/15/2018 | 10,863 | 11,545 | 11,814 | 0.9% | ||||||||||||||||||||||||||
|
|
||||||||||||||||||||||||||||||||||
| Easton-Bell Sports, Inc. | Consumer Durables & Apparel | Senior Debt(j)(k) | 11.50% | 12/31/2015 | 14,980 | 14,980 | 14,980 | 1.2% | ||||||||||||||||||||||||||
|
|
||||||||||||||||||||||||||||||||||
| Education Management, LLC | Consumer Services | Senior Debt(f)(i) | L + 700 | 1.25% | 3/30/2018 | 7,020 | 6,856 | 6,904 | 0.5% | |||||||||||||||||||||||||
| Subordinated Debt(f)(i) | 15.00% | 7/1/2018 | 1,299 | 1,308 | 1,390 | 0.1% | ||||||||||||||||||||||||||||
|
|
|
|
|
|
|
|||||||||||||||||||||||||||||
| 8,164 | 8,294 | 0.6% | ||||||||||||||||||||||||||||||||
|
|
||||||||||||||||||||||||||||||||||
| Epicor Software Corp. | Software & Services | Subordinated Debt(g)(i) |
|
9.00% or 9.75% PIK |
|
6/15/2018 | 39,815 | 39,048 | 40,014 | 3.2% | ||||||||||||||||||||||||
|
|
||||||||||||||||||||||||||||||||||
| Eze Software Group | Software & Services | Senior Debt(i) | L + 750 | 1.25% | 4/5/2021 | 12,962 | 12,921 | 13,172 | 1.0% | |||||||||||||||||||||||||
|
|
||||||||||||||||||||||||||||||||||
| Flagstone Foods Holding Corp. | Food & Staples Retailing | Senior Debt(j) | L + 575 | 1.25% | 4/15/2018 | 20,153 | 19,960 | 20,153 | 1.6% | |||||||||||||||||||||||||
|
|
||||||||||||||||||||||||||||||||||
| Gastar Exploration USA, Inc. | Energy | Senior Debt(f)(g)(i) | 8.63% | 5/15/2018 | 1,630 | 1,630 | 1,540 | 0.1% | ||||||||||||||||||||||||||
|
|
||||||||||||||||||||||||||||||||||
| GCI, Inc. | Telecommunication Services | Subordinated Debt(h) | 8.63% | 11/15/2019 | 8,575 | 9,057 | 8,982 | 0.7% | ||||||||||||||||||||||||||
| Subordinated Debt(h) | 6.75% | 6/1/2021 | 14,381 | 13,720 | 13,590 | 1.1% | ||||||||||||||||||||||||||||
|
|
|
|
|
|
|
|||||||||||||||||||||||||||||
| 22,777 | 22,572 | 1.8% | ||||||||||||||||||||||||||||||||
|
|
||||||||||||||||||||||||||||||||||
See notes to condensed consolidated financial statements.
8
Corporate Capital Trust, Inc. and Subsidiaries
Condensed Consolidated Schedule of Investments (unaudited) (continued)
As of September 30, 2013
(in thousands, except share amounts)
| Company (a) | Industry | Investments | Interest Rate |
EURIBOR/ LIBOR |
Maturity Date |
No. Shares/ Principal Amount (b) |
Cost (c) | Fair Value | % of Net Assets |
|||||||||||||||||||||
| Genesys Telecommunications Laboratories, Inc. | Software & Services | Common Stock(j)* Subordinated Debt(j)(EUR) |
|
12.50% |
|
|
1/31/2020 |
|
€ |
448,908 2,044 |
|
$ |
449 2,635 |
|
$ |
690 2,848 |
|
|
0.1 0.2 |
% % | ||||||||||
|
|
|
|
|
|
|
|||||||||||||||||||||||||
| 3,084 | 3,538 | 0.3 | % | |||||||||||||||||||||||||||
| GENEX Services, Inc. | Health Care Equipment & Services | Senior Debt(i) | L + 825 | 1.00% | 1/26/2019 | $ | 21,029 | 20,820 | 21,134 | 1.7 | % | |||||||||||||||||||
| Gibson Guitar Corp. | Consumer Durables & Apparel | Senior Debt(g) | 8.88% | 8/1/2018 | 738 | 738 | 749 | 0.1 | % | |||||||||||||||||||||
| Good Sam Enterprises, LLC | Media | Senior Debt(i) | 11.50% | 12/1/2016 | 12,699 | 13,063 | 13,651 | 1.1 | % | |||||||||||||||||||||
| Griffins Foods, Ltd. (NZ)(e) | Food, Beverage & Tobacco | Subordinated Debt(f)(j)(NZD) | 13.75% PIK | 1/31/2019 | N$ | 44,833 | 35,651 | 37,162 | 3.0 | % | ||||||||||||||||||||
| Guitar Center, Inc. | Retailing | Senior Debt(i) | L + 600 | 4/9/2017 | $ | 23,218 | 22,703 | 22,834 | 1.8 | % | ||||||||||||||||||||
| Gymboree Corp. | Retailing | Subordinated Debt(i) | 9.13% | 12/1/2018 | 3,335 | 3,194 | 3,260 | 0.3 | % | |||||||||||||||||||||
| Hilding Anders (LU)(e) | Consumer Durables & Apparel | Equity Options(f)(j)* | 236,160,807 | 20,013 | 19,987 | 1.6 | % | |||||||||||||||||||||||
| Subordinated Debt(f)(j)(EUR) | 13.00% PIK | 6/30/2021 | € | 78,720 | 86,507 | 86,475 | 6.9 | % | ||||||||||||||||||||||
| 106,520 | 106,462 | 8.5 | % | |||||||||||||||||||||||||||
| Hot Topic, Inc. | Consumer Durables & Apparel | Senior Debt(g)(h)(i) | 9.25% | 6/15/2021 | $ | 30,800 | 31,003 | 31,647 | 2.5 | % | ||||||||||||||||||||
| HUB International, Ltd. | Insurance | Subordinated Debt(g)(h) | 8.13% | 10/15/2018 | 16,708 | 16,767 | 18,650 | 1.5 | % | |||||||||||||||||||||
| IMS Health, Inc. | Health Care Equipment & Services | Subordinated Debt(g)(i) | |
7.38% or 8.13% PIK |
|
9/1/2018 | 1,463 | 1,463 | 1,494 | 0.1 | % | |||||||||||||||||||
| Infor (US), Inc. | Software & Services | Subordinated Debt(i) | 11.50% | 7/15/2018 | 4,549 | 4,922 | 5,254 | 0.4 | % | |||||||||||||||||||||
| Subordinated Debt(h) | 9.38% | 4/1/2019 | 1,241 | 1,399 | 1,387 | 0.1 | % | |||||||||||||||||||||||
| 6,321 | 6,641 | 0.5 | % | |||||||||||||||||||||||||||
| Integra Telecom Holdings, Inc. | Telecommunication Services | Senior Debt(i) | L + 850 | 1.25% | 2/19/2020 | 3,964 | 4,060 | 4,079 | 0.3 | % | ||||||||||||||||||||
| Internet Brands, Inc. | Media | Senior Debt | L + 500 | 1.25% | 3/18/2019 | 36,873 | 35,038 | 37,011 | 2.9 | % | ||||||||||||||||||||
| iPayment, Inc. | Software & Services | Senior Debt(i)(k) | L + 525 | 1.50% | 5/8/2017 | 3,186 | 3,131 | 3,083 | 0.2 | % | ||||||||||||||||||||
| Subordinated Debt(h)(i) | 10.25% | 5/15/2018 | 4,629 | 4,271 | 3,287 | 0.3 | % | |||||||||||||||||||||||
| 7,402 | 6,370 | 0.5 | % | |||||||||||||||||||||||||||
See notes to condensed consolidated financial statements.
9
Corporate Capital Trust, Inc. and Subsidiaries
Condensed Consolidated Schedule of Investments (unaudited) (continued)
As of September 30, 2013
(in thousands, except share amounts)
| Company (a) | Industry | Investments | Interest Rate |
EURIBOR/ LIBOR |
Maturity Date |
No. Shares/ Principal Amount (b) |
Cost (c) | Fair Value | % of Net Assets |
|||||||||||||||||||||
|
|
||||||||||||||||||||||||||||||
| IPC Systems, Inc. | Technology Hardware & Equipment | Senior Debt(i) | L + 650 | 1.25% | 7/31/2017 | $ | 6,388 | $ | 6,280 | $ | 6,261 | 0.5% | ||||||||||||||||||
| Senior Debt(i) | L + 650 | 1.25% | 7/31/2017 | 1,487 | 1,453 | 1,458 | 0.1% | |||||||||||||||||||||||
|
|
|
|
|
|
|
|||||||||||||||||||||||||
| 7,733 | 7,719 | 0.6% | ||||||||||||||||||||||||||||
|
|
||||||||||||||||||||||||||||||
| J. Jill | Retailing | Senior Debt(j) | L + 850 | 1.50% | 4/29/2017 | 8,678 | 8,678 | 8,678 | 0.7% | |||||||||||||||||||||
|
|
||||||||||||||||||||||||||||||
| Jacuzzi Brands, Inc. (LU)(e) | Capital Goods | Senior Debt(j) | L + 650 | 1.25% | 7/3/2019 | 42,196 | 41,353 | 42,239 | 3.4% | |||||||||||||||||||||
|
|
||||||||||||||||||||||||||||||
| JC Penney Corp., Inc. | Retailing | Subordinated Debt(f)(h) | 5.65% | 6/1/2020 | 7,185 | 5,534 | 5,371 | 0.4% | ||||||||||||||||||||||
|
|
||||||||||||||||||||||||||||||
| Jeld-Wen, Inc. | Capital Goods | Senior Debt(g)(i) | 12.25% | 10/15/2017 | 15,634 | 17,748 | 17,784 | 1.4% | ||||||||||||||||||||||
|
|
||||||||||||||||||||||||||||||
| Kerling PLC (UK)(e) | Materials | Senior Debt(f)(g)(EUR) | 10.63% | 2/1/2017 | € | 5,353 | 6,649 | 7,694 | 0.6% | |||||||||||||||||||||
|
|
||||||||||||||||||||||||||||||
| KeyPoint Government Solutions, Inc. | Capital Goods | Senior Debt(j)(k) | L + 600 | 1.25% | 11/13/2017 | $ | 32,521 | 31,969 | 32,521 | 2.6% | ||||||||||||||||||||
|
|
||||||||||||||||||||||||||||||
| Lightower Fiber, LLC | Telecommunication Services | Senior Debt(i) | L + 675 | 1.25% | 4/12/2021 | 3,381 | 3,348 | 3,431 | 0.3% | |||||||||||||||||||||
|
|
||||||||||||||||||||||||||||||
| Live Nation Entertainment, Inc. | Technology Hardware & Equipment | Subordinated Debt(f)(g)(h) | 7.00% | 9/1/2020 | 517 | 539 | 540 | 0.0% | ||||||||||||||||||||||
|
|
||||||||||||||||||||||||||||||
| Maxim Crane L.P. | Capital Goods | Senior Debt(g)(i) | 12.25% | 4/15/2015 | 1,994 | 2,079 | 2,064 | 0.2% | ||||||||||||||||||||||
|
|
||||||||||||||||||||||||||||||
| Misys Ltd. (UK)(e) | Software & Services | Senior Debt(f)(i) | L + 400 | 1.00% | 12/12/2018 | 1,955 | 1,934 | 1,960 | 0.2% | |||||||||||||||||||||
| Senior Debt(f)(i) | 12.00% | 6/12/2019 | 3,000 | 3,385 | 3,470 | 0.3% | ||||||||||||||||||||||||
|
|
|
|
|
|
|
|||||||||||||||||||||||||
| 5,319 | 5,430 | 0.5% | ||||||||||||||||||||||||||||
|
|
||||||||||||||||||||||||||||||
| Mitel US Holdings, Inc. | Technology Hardware & Equipment | Senior Debt(f) | L + 575 | 1.25% | 2/27/2019 | 234 | 239 | 235 | 0.0% | |||||||||||||||||||||
|
|
||||||||||||||||||||||||||||||
| Monarch (LU)(e) | Materials | Senior Debt(f)(i) | L + 700 | 1.25% | 4/3/2020 | 5,416 | 5,391 | 5,565 | 0.4% | |||||||||||||||||||||
|
|
||||||||||||||||||||||||||||||
| New Enterprise Stone & Lime Co., Inc. | Capital Goods | Senior Debt(g)(h) | 5.00%, 8.00% PIK |
3/15/2018 | 10,071 | 10,168 | 10,424 | 0.8% | ||||||||||||||||||||||
|
|
||||||||||||||||||||||||||||||
| NewWave Communications, Inc. | Media | Senior Debt | L + 400 | 1.00% | 4/30/2020 | 5,212 | 5,187 | 5,215 | 0.4% | |||||||||||||||||||||
| Senior Debt | L + 800 | 1.00% | 10/30/2020 | 8,339 | 8,261 | 8,464 | 0.7% | |||||||||||||||||||||||
|
|
|
|
|
|
|
|||||||||||||||||||||||||
| 13,448 | 13,679 | 1.1% | ||||||||||||||||||||||||||||
|
|
||||||||||||||||||||||||||||||
| North American Breweries Holdings, LLC | Food, Beverage & Tobacco | Senior Debt(k) | L + 625 | 1.25% | 12/11/2018 | 4,932 | 4,844 | 4,969 | 0.4% | |||||||||||||||||||||
|
|
||||||||||||||||||||||||||||||
| OneStopPlus, Inc. | Consumer Durables & Apparel | Senior Debt(i) | L + 450 | 1.00% | 2/5/2020 | 722 | 715 | 726 | 0.1% | |||||||||||||||||||||
|
|
||||||||||||||||||||||||||||||
| OpenLink International, Inc. | Software & Services | Senior Debt(k) | L + 625 | 1.50% | 10/30/2017 | 46 | 46 | 46 | 0.0% | |||||||||||||||||||||
|
|
||||||||||||||||||||||||||||||
See notes to condensed consolidated financial statements.
10
Corporate Capital Trust, Inc. and Subsidiaries
Condensed Consolidated Schedule of Investments (unaudited) (continued)
As of September 30, 2013
(in thousands, except share amounts)
| Company (a) | Industry | Investments | Interest Rate |
EURIBOR/ LIBOR |
Maturity Date |
No. Shares/ Principal |
Cost (c) | Fair Value | % of Net Assets |
|||||||||||||||||||||
|
|
||||||||||||||||||||||||||||||
| Packaging Coordinators, Inc. | Materials | Senior Debt(j) | L + 825 | 1.25% | 10/31/2020 | $ | 11,827 | $ | 11,713 | $ | 11,886 | 0.9% | ||||||||||||||||||
|
|
||||||||||||||||||||||||||||||
| Pinnacle Agriculture Holdings, LLC | Materials | Senior Debt(g)(i) | 9.00% | 11/15/2020 | 5,693 | 5,693 | 5,828 | 0.5% | ||||||||||||||||||||||
|
|
||||||||||||||||||||||||||||||
| Polyconcept Investments BV (NL)(e) | Consumer Durables & Apparel | Senior Debt(f)(j) | L + 875 | 1.25% | 6/28/2020 | 46,727 | 46,727 | 46,773 | 3.7% | |||||||||||||||||||||
|
|
||||||||||||||||||||||||||||||
| RedPrairie Corp. | Software & Services | Senior Debt(i) | L + 550 | 1.25% | 12/21/2018 | 7,768 | 7,628 | 7,838 | 0.6% | |||||||||||||||||||||
| Senior Debt(i) | L + 1000 | 1.25% | 12/21/2019 | 18,150 | 18,170 | 18,550 | 1.5% | |||||||||||||||||||||||
|
|
|
|
|
|
|
|||||||||||||||||||||||||
| 25,798 | 26,388 |
|
2.1% |
| ||||||||||||||||||||||||||
|
|
||||||||||||||||||||||||||||||
| Reynolds Group Holdings, Inc. | Materials | Senior Debt(h) | 5.75% | 10/15/2020 | 533 | 533 | 535 | 0.0% | ||||||||||||||||||||||
|
|
||||||||||||||||||||||||||||||
| Roundy’s Supermarkets, Inc. | Food & Staples Retailing | Senior Debt(f)(i) | L + 450 | 1.25% | 2/13/2019 | 1,438 | 1,422 | 1,412 | 0.1% | |||||||||||||||||||||
|
|
||||||||||||||||||||||||||||||
| Ryerson, Inc. | Materials | Senior Debt(i) | 9.00% | 10/15/2017 | 5,814 | 5,814 | 6,017 | 0.5% | ||||||||||||||||||||||
|
|
||||||||||||||||||||||||||||||
| Sabine Oil & Gas, LLC | Energy | Senior Debt(f)(i) | L + 750 | 1.25% | 12/31/2018 | 14,527 | 14,399 | 14,627 | 1.2% | |||||||||||||||||||||
|
|
||||||||||||||||||||||||||||||
| Sabre, Inc. | Transportation | Senior Debt(g)(h) | 8.50% | 5/15/2019 | 13,369 | 13,970 | 14,455 | 1.1% | ||||||||||||||||||||||
|
|
||||||||||||||||||||||||||||||
| SandRidge Energy, Inc. | Energy | Subordinated Debt(f)(h) | 7.50% | 3/15/2021 | 11,233 | 10,547 | 11,345 | 0.9% | ||||||||||||||||||||||
|
|
||||||||||||||||||||||||||||||
| Sanmina Corp. | Technology Hardware & Equipment | Subordinated Debt(f)(g)(h) | 7.00% | 5/15/2019 | 7,879 | 7,869 | 8,293 | 0.7% | ||||||||||||||||||||||
|
|
||||||||||||||||||||||||||||||
| Schaeffler AG (DE)(e) | Automobiles & Components | Senior Debt(f)(g)(h) | 8.50% | 2/15/2019 | 5 | 5 | 6 | 0.0% | ||||||||||||||||||||||
|
|
||||||||||||||||||||||||||||||
| Sedgwick Claims Management Services Holdings, Inc. | Insurance | Senior Debt | L + 700 | 1.00% | 12/15/2018 | 40,735 | 40,537 | 41,550 | 3.3% | |||||||||||||||||||||
|
|
||||||||||||||||||||||||||||||
| Select Medical Corp. | Health Care Equipment & Services | Subordinated Debt(f)(g)(h) | 6.38% | 6/1/2021 | 7,000 | 6,793 | 6,632 | 0.5% | ||||||||||||||||||||||
|
|
||||||||||||||||||||||||||||||
| Sheridan Holdings, Inc. | Health Care Equipment & Services | Senior Debt(i) | L + 775 | 1.25% | 7/1/2019 | 677 | 692 | 682 | 0.1% | |||||||||||||||||||||
|
|
||||||||||||||||||||||||||||||
| Sinclair Television Group, Inc. | Media | Subordinated Debt(h) | 5.38% | 4/1/2021 | 4,961 | 4,961 | 4,713 | 0.4% | ||||||||||||||||||||||
|
|
||||||||||||||||||||||||||||||
| Sonic Automotive, Inc. | Retailing | Subordinated Debt(f)(h) | 5.00% | 5/15/2023 | 493 | 493 | 451 | 0.0% | ||||||||||||||||||||||
|
|
||||||||||||||||||||||||||||||
| Sportsman’s Warehouse, Inc. | Retailing | Senior Debt(j) | L + 600 | 1.25% | 8/20/2019 | 40,312 | 39,913 | 40,614 | 3.2% | |||||||||||||||||||||
| Senior Debt(j) | L + 1075 | 1.25% | 8/20/2019 | 23,713 | 23,203 | 23,891 | 1.9% | |||||||||||||||||||||||
|
|
|
|
|
|
|
|||||||||||||||||||||||||
| 63,116 | 64,505 |
|
5.1% |
| ||||||||||||||||||||||||||
|
|
||||||||||||||||||||||||||||||
| Sprint Corp. | Telecommunication Services | Subordinated Debt(f)(g)(h) | 7.88% | 9/15/2023 | 5,093 | 5,093 | 5,195 | 0.4% | ||||||||||||||||||||||
|
|
||||||||||||||||||||||||||||||
| SquareTwo Financial Corp. | Banks | Senior Debt(h) | 11.63% | 4/1/2017 | 6,309 | 6,586 | 6,624 | 0.5% | ||||||||||||||||||||||
|
|
||||||||||||||||||||||||||||||
See notes to condensed consolidated financial statements.
11
Corporate Capital Trust, Inc. and Subsidiaries
Condensed Consolidated Schedule of Investments (unaudited) (continued)
As of September 30, 2013
(in thousands, except share amounts)
| Company (a) | Industry | Investments | Interest Rate |
EURIBOR/ LIBOR |
Maturity Date |
No. Shares/ Principal Amount (b) |
Cost (c) | Fair Value | % of Net Assets |
|||||||||||||||||||||
|
|
||||||||||||||||||||||||||||||
| Standard Chartered Bank (SG)(e) |
Banks | Subordinated Debt(f)(g)(j)(m) | L + 1600 | 4/1/2014 | $ | 3,310 | $ | 3,328 | $ | 3,378 | 0.3% | |||||||||||||||||||
|
|
||||||||||||||||||||||||||||||
| StoneRiver Holdings, Inc. |
Insurance | Senior Debt | L + 725 | 1.25% | 5/30/2020 | 24,098 | 23,980 | 24,519 | 1.9% | |||||||||||||||||||||
|
|
||||||||||||||||||||||||||||||
| Summit Materials, LLC |
Materials | Subordinated Debt(h) | 10.50% | 1/31/2020 | 462 | 520 | 487 | 0.0% | ||||||||||||||||||||||
|
|
||||||||||||||||||||||||||||||
| Talbots, Inc. |
Retailing | Senior Debt(j) | L + 800 | 1.25% | 8/30/2018 | 50,000 | 50,000 | 50,000 | 4.0% | |||||||||||||||||||||
|
|
||||||||||||||||||||||||||||||
| The TelX Group, Inc. |
Telecommunication Services | Senior Debt(i) | L + 500 | 1.25% | 9/25/2017 | 7,493 | 7,525 | 7,508 | 0.6% | |||||||||||||||||||||
| Subordinated Debt(g)( (j)(k) | 10.00%, 2.00% PIK | 9/26/2019 | 5,490 | 5,938 | 5,819 | 0.5% | ||||||||||||||||||||||||
|
|
|
|
|
|
|
|||||||||||||||||||||||||
| 13,463 | 13,327 |
|
1.1% |
| ||||||||||||||||||||||||||
|
|
||||||||||||||||||||||||||||||
| Towergate Finance PLC (UK)(e) |
Insurance | Subordinated Debt(f)(g)(h)(GBP) | 10.50% | 2/15/2019 | £ | 14,608 | 23,399 | 24,659 | 2.0% | |||||||||||||||||||||
|
|
||||||||||||||||||||||||||||||
| Travelport, LLC |
Software & Services | Senior Debt(i) | L + 800 | 1.50% | 1/31/2016 | $ | 18,868 | 18,505 | 19,505 | 1.5% | ||||||||||||||||||||
| Senior Debt(i) | L + 500 | 1.25% | 6/26/2019 | 6,679 | 6,582 | 6,780 | 0.5% | |||||||||||||||||||||||
|
|
|
|
|
|
|
|||||||||||||||||||||||||
| 25,087 | 26,285 |
|
2.0% |
| ||||||||||||||||||||||||||
|
|
||||||||||||||||||||||||||||||
| VWR Funding, Inc. |
Pharmaceuticals, Biotechnology & Life Sciences | Subordinated Debt(h) | 7.25% | 9/15/2017 | 5,349 | 5,349 | 5,643 | 0.4% | ||||||||||||||||||||||
|
|
||||||||||||||||||||||||||||||
| Websense, Inc. |
Technology Hardware & Equipment | Senior Debt | L + 725 | 1.00% | 12/24/2020 | 32,018 | 31,862 | 32,058 | 2.5% | |||||||||||||||||||||
|
|
||||||||||||||||||||||||||||||
| Willbros United States Holding, Inc. |
Energy | Senior Debt(f) | L + 975 | 1.25% | 8/5/2019 | 33,698 | 32,525 | 33,917 | 2.7% | |||||||||||||||||||||
|
|
||||||||||||||||||||||||||||||
| Wilton Brands, LLC |
Materials | Senior Debt(i) | L + 625 | 1.25% | 8/30/2018 | 12,337 | 12,128 | 12,121 | 1.0% | |||||||||||||||||||||
|
|
||||||||||||||||||||||||||||||
| Zayo Group, LLC |
Telecommunication Services | Senior Debt(h) | 8.13% | 1/1/2020 | 2,260 | 2,388 | 2,472 | 0.2% | ||||||||||||||||||||||
| Subordinated Debt(h) | 10.13% | 7/1/2020 | 5,000 | 5,299 | 5,737 | 0.5% | ||||||||||||||||||||||||
|
|
|
|
|
|
|
|||||||||||||||||||||||||
| 7,687 | 8,209 |
|
0.7% |
| ||||||||||||||||||||||||||
|
|
||||||||||||||||||||||||||||||
| Total Non-Control/Non-Affiliate Investments |
1,641,741 | 1,666,063 |
|
132.4% |
| |||||||||||||||||||||||||
|
|
|
|
|
|
|
|||||||||||||||||||||||||
See notes to condensed consolidated financial statements.
12
Corporate Capital Trust, Inc. and Subsidiaries
Condensed Consolidated Schedule of Investments (unaudited) (continued)
As of September 30, 2013
(in thousands, except share amounts)
| Company (a) | Industry | Investments | Interest Rate |
EURIBOR/ LIBOR Floor |
Maturity Date |
No. Shares/ Principal Amount (b) |
Cost (c) | Fair Value | % of Net Assets |
|||||||||||||||||||||||||
|
|
||||||||||||||||||||||||||||||||||
| Short Term Investments—0.7% | ||||||||||||||||||||||||||||||||||
| Goldman Sachs Financial Square Funds - Prime Obligations Fund FST Preferred Shares |
Short Term Investments(i) | 0.01%(n) | 8,300,879 | $ | 8,301 | $ | 8,301 | 0.7% | ||||||||||||||||||||||||||
|
|
||||||||||||||||||||||||||||||||||
| State Street Institutional Liquid Reserves Fund, Institutional Class | Short Term Investments | 0.06%(n) | 402,303 | 402 | 402 | 0.0% | ||||||||||||||||||||||||||||
|
|
||||||||||||||||||||||||||||||||||
| Total Short Term Investments |
|
8,703
|
|
|
8,703
|
|
|
0.7%
|
| |||||||||||||||||||||||||
|
|
|
|
|
|
|
|||||||||||||||||||||||||||||
| TOTAL INVESTMENTS —133.1%(o) | $ |
|
1,650,444
|
|
|
1,674,766
|
|
|
133.1%
|
| ||||||||||||||||||||||||
|
|
|
|
|
|
|
|||||||||||||||||||||||||||||
| LIABILITIES IN EXCESS OF OTHER ASSETS—(33.1%) |
|
(416,922 |
) |
|
(33.1)% |
| ||||||||||||||||||||||||||||
|
|
|
|
|
|||||||||||||||||||||||||||||||
| NET ASSETS—100.0% |
$ |
1,257,844 |
|
|
100.0% |
| ||||||||||||||||||||||||||||
|
|
|
|
|
|||||||||||||||||||||||||||||||
| Collateral on Deposit with Custodian—4.4% | ||||||||||||||||||||||||||||||||||
|
|
||||||||||||||||||||||||||||||||||
| Bank of Nova Scotia - Certificate of Deposit
|
Short Term Investments
|
0.20%
|
|
10/31/2013
|
|
$
|
55,000
|
|
$
|
|
|
|
55,000
|
|
$
|
|
55,000
|
|
|
4.4%
|
| |||||||||||||
|
|
||||||||||||||||||||||||||||||||||
| Total Collateral on Deposit with Custodian
|
$
|
|
|
|
55,000
|
|
$
|
|
55,000
|
|
|
4.4%
|
| |||||||||||||||||||||
|
|
|
|
|
|
|
|||||||||||||||||||||||||||||
| Derivative Instruments—(0.2%) | ||||||||||||||||||||||||||||||||||
| Foreign currency forward contracts | Foreign currency forward contracts(f) |
N/A | $ | — | $ | (3,093 | ) | (0.3)% | ||||||||||||||||||||||||||
| Total return swaps
|
Total return swaps(f)(j)
|
N/A
|
$
|
|
|
|
—
|
|
$
|
|
838
|
|
|
0.1%
|
| |||||||||||||||||||
|
|
||||||||||||||||||||||||||||||||||
| Total Derivative Instruments
|
$
|
|
|
$
|
|
(2,255
|
)
|
|
(0.2)%
|
| ||||||||||||||||||||||||
|
|
|
|
|
|
|
|||||||||||||||||||||||||||||
| * | Non-income producing security. |
| (a) | Security may be an obligation of one or more entities affiliated with the named company. |
See notes to condensed consolidated financial statements.
13
Corporate Capital Trust, Inc. and Subsidiaries
Condensed Consolidated Schedule of Investments (unaudited) (continued)
As of September 30, 2013
(in thousands, except share amounts)
(b) Denominated in U.S. Dollars unless otherwise noted.
(c) Represents amortized cost for debt securities and cost for common stock and equity options.
(d) Non-Control/Non-Affiliate investments are defined by the Investment Company Act of 1940, as amended (“1940 Act”) as investments that are neither Control Investments nor Affiliate Investments. Controlled investments are defined by the 1940 Act as investments in which more than 25% of the voting securities are owned or where the ability to nominate greater than 50% of the board representation is maintained. Affiliate investments are defined by the 1940 Act as investments in which between 5% and 25% of the voting securities are owned and the investments are not classified as Controlled investments.
(e) A portfolio company domiciled in a foreign country. The jurisdiction of the security issuer may be in a different country than the country of domicile.
(f) The investment is not a qualifying asset as defined in Section 55(a) under the Investment Company Act of 1940, as amended, or the 1940 Act. A business development company may not acquire any asset other than qualifying assets, unless, at the time the acquisition is made, qualifying assets represent at least 70% of the company’s total assets. The Company calculates its compliance with the qualifying assets test on a “look through” basis by disregarding the value of the Company’s total return swaps and treating each loan underlying the total return swaps as either a qualifying asset or non-qualifying asset based on whether the obligor is an eligible portfolio company. On this basis, 75.9% of the Company’s total assets represented qualifying assets as of September 30, 2013.
(g) This security was acquired in a transaction that was exempt from the registration requirements of the Securities Act of 1933, as amended (the “Securities Act”), pursuant to Rule 144A thereunder. This security may be resold only in transactions that are exempt from the registration requirements of the Securities Act, normally to qualified institutional buyers.
(h) Security or portion thereof is held within Paris Funding, LLC and is pledged as collateral supporting the amounts outstanding under the committed facility agreement with BNP Paribas Prime Brokerage, Inc. and eligible to be hypothecated as allowed under Rule 15c2-1(a)(1) of the Exchange Act subject to the limits of the Rehypothecation Agreement.
(i) Security or portion thereof is held within CCT Funding, LLC and is pledged as collateral supporting the amounts outstanding under the revolving credit facility with Deutsche Bank.
(j) Investments classified as Level 3 whereby fair value was determined by the Company’s Board of Directors (see Note 2).
(k) Position or portion thereof unsettled as of September 30, 2013.
(l) Investment was on non-accrual status as of September 30, 2013.
(m) A portfolio company investment structured as a credit-linked floating rate note.
(n) 7-day effective yield as of September 30, 2013.
(o) As of September 30, 2013, the aggregate gross unrealized appreciation for all securities in which there was an excess of value over tax cost was $32,238; the aggregate gross unrealized depreciation for all securities in which there was an excess of tax cost over value was $7,916; the net unrealized appreciation was $24,322; the aggregate cost of securities for Federal income tax purposes was $1,705,444.
Abbreviations:
EUR - Euro; principal amount is denominated in Euros currency. €1 / US $1.353 as of September 30, 2013.
GBP - British Pound Sterling; principal amount is denominated in Pound Sterling. £1 / US $1.619 as of September 30, 2013.
NZD - New Zealand Dollar; principal amount is denominated in New Zealand Dollars. N$1 / US $0.830 as of September 30, 2013.
DE - Germany
ES - Spain
IE - Ireland
LU - Luxembourg
MX - Mexico
See notes to condensed consolidated financial statements.
14
Corporate Capital Trust, Inc. and Subsidiaries
Condensed Consolidated Schedule of Investments (unaudited) (continued)
As of September 30, 2013
(in thousands, except share amounts)
NL - The Netherlands
NZ - New Zealand
SG - Singapore
UK - United Kingdom
L = LIBOR - London Interbank Offered Rate, typically 3-Month
PIK - Payment-in-kind
See notes to condensed consolidated financial statements.
15
Corporate Capital Trust, Inc. and Subsidiaries
Consolidated Schedule of Investments
As of December 31, 2012
(in thousands, except share amounts)
| Company (a) | Industry (n) | Investments | Interest Rate |
EURIBOR/ LIBOR |
Maturity Date |
No. Shares/ Principal |
Cost (c) | Fair Value | % of Net Assets |
|||||||||||||||||||||
|
|
||||||||||||||||||||||||||||||
| Non-Control/Non-Affiliate Investments(d)—114.1% |
|
|||||||||||||||||||||||||||||
| AdvancePierre Foods, Inc. | Food, Beverage & Tobacco | Senior Debt(e) | L + 450 | 1.25% | 7/10/2017 | $ | 3,938 | $ | 3,910 | $ | 3,987 | 0.6% | ||||||||||||||||||
|
|
||||||||||||||||||||||||||||||
| Allen Systems Group, Inc. | Software & Services | Senior Debt(e)(f) | 10.50% | 11/15/2016 | 106 | 66 | 78 | 0.0% | ||||||||||||||||||||||
|
|
||||||||||||||||||||||||||||||
| Alliance Laundry Systems, LLC | Capital Goods | Senior Debt(e) | L + 425 | 1.25% | 12/10/2018 | 3,553 | 3,535 | 3,589 | 0.6% | |||||||||||||||||||||
|
|
||||||||||||||||||||||||||||||
| Ally Financial, Inc. | Banks | Preferred Stocks(g) | 118,908 | 2,996 | 3,124 | 0.5% | ||||||||||||||||||||||||
| Preferred Stocks(g) | 69,800 | 1,804 | 1,860 | 0.3% | ||||||||||||||||||||||||||
|
|
|
|
|
|
|
|||||||||||||||||||||||||
| 4,800 | 4,984 | 0.8% | ||||||||||||||||||||||||||||
|
|
||||||||||||||||||||||||||||||
| Altisource Solutions (LU)(h) | Real Estate | Senior Debt(e)(g) | L + 450 | 1.25% | 11/27/2019 | 7,545 | 7,470 | 7,583 | 1.2% | |||||||||||||||||||||
|
|
||||||||||||||||||||||||||||||
| American Gaming Systems, LLC | Consumer Services | Senior Debt(i) | L + 1000 | 1.50% | 8/15/2016 | 11,974 | 11,524 | 11,974 | 2.0% | |||||||||||||||||||||
| Senior Debt(i) | L + 1000 | 1.50% | 8/15/2016 | 781 | (29 | ) | — | 0.0% | ||||||||||||||||||||||
| Senior Debt(i)(j) | L + 1000 | 1.50% | 8/15/2016 | 781 | 752 | 781 | 0.1% | |||||||||||||||||||||||
|
|
|
|
|
|
|
|||||||||||||||||||||||||
| 12,247 | 12,755 | 2.1% | ||||||||||||||||||||||||||||
|
|
||||||||||||||||||||||||||||||
| American Rock Salt Co., LLC | Materials | Senior Debt(e) | L + 425 | 1.25% | 4/25/2017 | 8,486 | 8,151 | 8,398 | 1.4% | |||||||||||||||||||||
|
|
||||||||||||||||||||||||||||||
| Amkor Technologies, Inc. | Semiconductors & Semiconductor Equipment | Subordinated Debt(e)(g) | 7.38% | 5/1/2018 | 213 | 211 | 220 | 0.0% | ||||||||||||||||||||||
|
|
||||||||||||||||||||||||||||||
| Amsurg Corp. | Health Care Equipment & Services | Subordinated Debt(e)(f)(g) | 5.63% | 11/30/2020 | 943 | 943 | 981 | 0.2% | ||||||||||||||||||||||
|
|
||||||||||||||||||||||||||||||
| Aramark Corp. | Commercial & Professional Services | Subordinated Debt(e) | 8.50% | 2/1/2015 | 2,836 | 2,897 | 2,850 | 0.5% | ||||||||||||||||||||||
|
|
||||||||||||||||||||||||||||||
| Ardagh Packaging Holdings, Ltd. (IE)(h) | Capital Goods | Senior Debt(e)(f)(g) | 7.38% | 10/15/2017 | 100 | 100 | 109 | 0.0% | ||||||||||||||||||||||
|
|
||||||||||||||||||||||||||||||
| Aspect Software, Inc. | Technology Hardware & Equipment | Senior Debt(e) | L + 525 | 1.75% | 5/7/2016 | 4,361 | 4,359 | 4,394 | 0.7% | |||||||||||||||||||||
| Senior Debt(e) | 10.63% | 5/15/2017 | 9,009 | 9,485 | 8,153 | 1.3% | ||||||||||||||||||||||||
|
|
|
|
|
|
|
|||||||||||||||||||||||||
| 13,844 | 12,547 | 2.0% | ||||||||||||||||||||||||||||
|
|
||||||||||||||||||||||||||||||
| Aspen Dental Management, Inc. | Health Care Equipment & Services | Senior Debt(e) | L + 550 | 1.50% | 10/6/2016 | 6,115 | 6,049 | 5,840 | 0.9% | |||||||||||||||||||||
|
|
||||||||||||||||||||||||||||||
| Asset Acceptance Capital Corp. | Diversified Financials | Senior Debt(g)(i) | L + 725 | 1.50% | 11/14/2017 | 919 | 897 | 930 | 0.2% | |||||||||||||||||||||
|
|
||||||||||||||||||||||||||||||
| AssuraMed Holding, Inc. | Health Care Equipment & Services | Senior Debt(e) | L + 800 | 1.25% | 4/24/2020 | 5,147 | 5,045 | 5,207 | 0.8% | |||||||||||||||||||||
|
|
||||||||||||||||||||||||||||||
See notes to condensed consolidated financial statements
16
Corporate Capital Trust, Inc. and Subsidiaries
Consolidated Schedule of Investments (continued)
As of December 31, 2012
(in thousands, except share amounts)
| Company (a)
|
Industry (n)
|
Investments
|
Interest Rate
|
EURIBOR/ LIBOR
|
Maturity
|
No. Shares/ Principal Amount (b)
|
Cost (c)
|
Fair Value
|
% of Net
|
|||||||||||||||||||||
|
|
||||||||||||||||||||||||||||||
| Asurion, LLC | Software & Services | Senior Debt(e) | L + 400 | 1.50% | 5/24/2018 | $ | 3,285 | $ | 3,241 | $ | 3,323 | 0.5% | ||||||||||||||||||
| Senior Debt(e) | L + 750 | 1.50% | 5/24/2019 | 396 | 396 | 409 | 0.1% | |||||||||||||||||||||||
|
|
|
|
|
|
|
|||||||||||||||||||||||||
| 3,637 | 3,732 |
|
0.6% |
| ||||||||||||||||||||||||||
|
|
||||||||||||||||||||||||||||||
| Avaya, Inc. | Technology Hardware & Equipment | Senior Debt(e)(f) | 7.00% | 4/1/2019 | 14,555 | 13,662 | 13,609 | 2.2% | ||||||||||||||||||||||
|
|
||||||||||||||||||||||||||||||
| Bill Barrett Corp. | Energy | Subordinated Debt(e)(g) | 7.63% | 10/1/2019 | 251 | 257 | 265 | 0.0% | ||||||||||||||||||||||
|
|
||||||||||||||||||||||||||||||
| BNY ConvergEX Group, LLC | Diversified Financials | Senior Debt(e)(g) | L + 375 | 1.50% | 12/19/2016 | 110 | 108 | 106 |
|
0.0% |
| |||||||||||||||||||
| Senior Debt(e)(g) | L + 375 | 1.50% | 12/19/2016 | 241 | 239 | 234 | 0.0% | |||||||||||||||||||||||
| Senior Debt(e)(g)(i) | L + 700 | 1.75% | 12/17/2017 | 1,387 | 1,381 | 1,307 | 0.2% | |||||||||||||||||||||||
| Senior Debt(e)(g)(i) | L + 700 | 1.75% | 12/17/2017 | 582 | 579 | 548 | 0.1% | |||||||||||||||||||||||
|
|
|
|
|
|
|
|||||||||||||||||||||||||
| 2,307 | 2,195 |
|
0.3% |
| ||||||||||||||||||||||||||
|
|
||||||||||||||||||||||||||||||
| Bright Horizons Family Solutions, Inc. | Consumer Services | Senior Debt(i) | L + 425 | 1.00% | 5/23/2017 | 1,004 | 999 | 1,014 | 0.2% | |||||||||||||||||||||
|
|
||||||||||||||||||||||||||||||
| Building Materials Corporation of America | Capital Goods | Subordinated Debt(e)(f) | 6.75% | 5/1/2021 | 41 | 44 | 45 |
|
0.0% |
| ||||||||||||||||||||
|
|
||||||||||||||||||||||||||||||
| Caesars Entertainment Operating Co., Inc. | Consumer Services | Senior Debt(e)(g) | 11.25% | 6/1/2017 | 1,023 | 1,075 | 1,096 |
|
0.2% |
| ||||||||||||||||||||
|
|
||||||||||||||||||||||||||||||
| Catalina Marketing Corp. | Media | Senior Debt(e) | L + 550 | 9/29/2017 | 8,432 | 8,356 | 8,466 |
|
1.4% |
| ||||||||||||||||||||
| Subordinated Debt(e)(f) | 10.50% | 10/1/2015 | 20,436 | 20,405 | 20,692 | 3.4% | ||||||||||||||||||||||||
|
|
|
|
|
|
|
|||||||||||||||||||||||||
| 28,761 | 29,158 |
|
4.8% |
| ||||||||||||||||||||||||||
|
|
||||||||||||||||||||||||||||||
| CDW Corp. | Technology Hardware & Equipment | Subordinated Debt(e) | 12.54% | 10/12/2017 | 12,626 | 13,510 | 13,494 | 2.2% | ||||||||||||||||||||||
|
|
||||||||||||||||||||||||||||||
| Celanese US Holdings, LLC | Materials | Subordinated Debt(e)(g) | 4.63% | 11/15/2022 | 2,900 | 2,900 | 3,038 | 0.5% | ||||||||||||||||||||||
|
|
||||||||||||||||||||||||||||||
| Cemex Espana S.A. (ES)(h) | Materials | Senior Debt(e)(g)(j)(EUR) | E + 500 | 2/14/2017 | € | 929 | 1,112 | 1,174 | 0.2% | |||||||||||||||||||||
|
|
||||||||||||||||||||||||||||||
| Cemex Finance, LLC | Materials | Senior Debt(e)(f)(g) | 9.38% | 10/12/2022 | $ | 825 | 825 | 928 | 0.1% | |||||||||||||||||||||
|
|
||||||||||||||||||||||||||||||
| Cemex Finance Europe BV | Materials | Subordinated Debt(g) | 4.75% | 3/5/2014 | € | 419 | 481 | 566 | 0.1% | |||||||||||||||||||||
|
|
||||||||||||||||||||||||||||||
| Cemex Materials, LLC | Materials | Subordinated Debt(e)(f) | 7.70% | 7/21/2025 | $ | 12,670 | 11,742 | 12,828 | 2.1% | |||||||||||||||||||||
|
|
||||||||||||||||||||||||||||||
| Cemex S.A.B. de C.V. (MX)(h) | Materials | Senior Debt(e)(g)(j) | L + 525 | 2/14/2017 | 3,441 | 3,192 | 3,295 | 0.5% | ||||||||||||||||||||||
|
|
||||||||||||||||||||||||||||||
See notes to condensed consolidated financial statements
17
Corporate Capital Trust, Inc. and Subsidiaries
Consolidated Schedule of Investments (continued)
As of December 31, 2012
(in thousands, except share amounts)
| Company (a)
|
Industry (n)
|
Investments
|
Interest
|
EURIBOR/ LIBOR
|
Maturity Date
|
No. Shares/
|
Cost (c)
|
Fair Value
|
% of Net
|
|||||||||||||||||||||
|
|
||||||||||||||||||||||||||||||
| Cengage Learning Acquisitions, Inc. | Media | Senior Debt(e)(f) | 11.50% | 4/15/2020 | 14,622 | 15,000 | 12,611 | 2.1% | ||||||||||||||||||||||
|
|
||||||||||||||||||||||||||||||
| Ceridian Corp. | Commercial & Professional Services | Senior Debt(e) | L + 575 | 5/9/2017 | $ | 11,345 | $ | 11,321 | $ | 11,360 | 1.9% | |||||||||||||||||||
| Senior Debt(e)(f) | 8.88% | 7/15/2019 | 2,123 | 2,123 | 2,303 | 0.4% | ||||||||||||||||||||||||
|
|
|
|
|
|
|
|||||||||||||||||||||||||
| 13,444 | 13,663 |
|
2.3% |
| ||||||||||||||||||||||||||
|
|
||||||||||||||||||||||||||||||
| CHG Companies, Inc. | Health Care Equipment & Services | Senior Debt(e)(j) | L + 375 | 1.25 | % | 11/19/2019 | 3,073 | 3,042 | 3,078 | 0.5% | ||||||||||||||||||||
| Senior Debt(e)(j) | L + 775 | 1.25 | % | 11/19/2020 | 6,663 | 6,530 | 6,708 | 1.1% | ||||||||||||||||||||||
|
|
|
|
|
|
|
|||||||||||||||||||||||||
| 9,572 | 9,786 |
|
1.6% |
| ||||||||||||||||||||||||||
|
|
||||||||||||||||||||||||||||||
| Clear Channel Worldwide Holdings, Inc. | Media | Subordinated Debt(e)(g) | 7.63% | 3/15/2020 | 1,857 | 1,799 | 1,871 | 0.3% | ||||||||||||||||||||||
|
|
||||||||||||||||||||||||||||||
| ClubCorp Club Operations, Inc. | Consumer Services | Senior Debt(e) | L + 375 | 1.50 | % | 11/30/2016 | 136 | 129 | 138 | 0.0% | ||||||||||||||||||||
|
|
||||||||||||||||||||||||||||||
| CNO Financial Group, Inc. | Insurance | Senior Debt(e)(f)(g) | 6.38% | 10/1/2020 | 1,092 | 1,131 | 1,136 | 0.2% | ||||||||||||||||||||||
|
|
||||||||||||||||||||||||||||||
| Commscope, Inc. | Technology Hardware & Equipment | Subordinated Debt(e)(f) | 8.25% | 1/15/2019 | 632 | 666 | 692 | 0.1% | ||||||||||||||||||||||
|
|
||||||||||||||||||||||||||||||
| Continental Airlines, Inc. | Transportation | Senior Debt(e)(g) | 7.34% | 4/19/2014 | 267 | 270 | 275 | 0.0% | ||||||||||||||||||||||
|
|
||||||||||||||||||||||||||||||
| CRC Health Corp. | Health Care Equipment & Services | Senior Debt(e) | L + 450 | 11/16/2015 | 1,199 | 1,145 | 1,160 |
|
0.2% |
| ||||||||||||||||||||
| Subordinated Debt(e) | 10.75% | 2/1/2016 | 1,114 | 1,075 | 1,086 | 0.2% | ||||||||||||||||||||||||
|
|
|
|
|
|
|
|||||||||||||||||||||||||
| 2,220 | 2,246 | 0.4% | ||||||||||||||||||||||||||||
|
|
||||||||||||||||||||||||||||||
| Cunningham Lindsey U.S., Inc. | Insurance | Senior Debt(e) | L + 375 | 1.25 | % | 12/10/2019 | 4,616 | 4,571 | 4,657 | 0.8% | ||||||||||||||||||||
| Senior Debt(e) | L + 800 | 1.25 | % | 6/10/2020 | 6,643 | 6,577 | 6,809 | 1.1% | ||||||||||||||||||||||
|
|
|
|
|
|
|
|||||||||||||||||||||||||
| 11,148 | 11,466 |
|
1.9% |
| ||||||||||||||||||||||||||
|
|
||||||||||||||||||||||||||||||
| Data Device Corp. | Capital Goods | Senior Debt(e) | L + 600 | 1.50 | % | 7/11/2018 | 7,896 | 7,750 | 7,876 | 1.3% | ||||||||||||||||||||
| Senior Debt(i) | L + 1000 | 1.50 | % | 7/11/2019 | 8,000 | 7,847 | 7,840 | 1.3% | ||||||||||||||||||||||
|
|
|
|
|
|
|
|||||||||||||||||||||||||
| 15,597 | 15,716 |
|
2.6% |
| ||||||||||||||||||||||||||
|
|
||||||||||||||||||||||||||||||
| Datatel, Inc. | Software & Services | Senior Debt(e) | L + 500 | 1.25 | % | 7/19/2018 | 394 | 388 | 399 | 0.1% | ||||||||||||||||||||
|
|
||||||||||||||||||||||||||||||
| David’s Bridal, Inc. | Retailing | Senior Debt(e) | L + 375 | 1.25 | % | 10/11/2019 | 2,196 | 2,175 | 2,205 | 0.4% | ||||||||||||||||||||
|
|
||||||||||||||||||||||||||||||
| DJO Finance, LLC | Health Care Equipment & Services | Senior Debt(e) | L + 500 | 1.25 | % | 9/15/2017 | 1,975 | 1,977 | 1,990 | 0.3% | ||||||||||||||||||||
| Senior Debt(e)(f) | 8.75% | 3/15/2018 | 8,188 | 8,639 | 8,945 | 1.5% | ||||||||||||||||||||||||
|
|
|
|
|
|
|
|||||||||||||||||||||||||
| 10,616 | 10,935 | 1.8% | ||||||||||||||||||||||||||||
|
|
||||||||||||||||||||||||||||||
See notes to condensed consolidated financial statements
18
Corporate Capital Trust, Inc. and Subsidiaries
Consolidated Schedule of Investments (continued)
As of December 31, 2012
(in thousands, except share amounts)
| Company (a) | Industry (n) | Investments | Interest Rate |
EURIBOR/ LIBOR |
Maturity Date |
No. Shares/ Principal |
Cost (c) | Fair Value | % of Net Assets |
|||||||||||||||||||||
|
|
||||||||||||||||||||||||||||||
| DuPont Fabros Technology, LP | Real Estate | Subordinated Debt(e)(g) | 8.50% | 12/15/2017 | 100 | 106 | 109 | 0.0% | ||||||||||||||||||||||
|
|
||||||||||||||||||||||||||||||
| E*Trade Financial Corp. | Diversified Financials | Subordinated Debt(e)(g) | 6.75% | 6/1/2016 | $ | 10 | $ | 11 | $ | 11 | 0.0% | |||||||||||||||||||
|
|
||||||||||||||||||||||||||||||
| Easton-Bell Sports, Inc. | Consumer Durables & Apparel | Senior Debt(e) | 9.75% | 12/1/2016 | 1,190 | 1,261 | 1,279 | 0.2% | ||||||||||||||||||||||
|
|
||||||||||||||||||||||||||||||
| Education Management, LLC | Consumer Services | Senior Debt(e)(g) | L + 700 | 1.25 | % | 3/30/2018 | 7,078 | 6,891 | 5,919 | 1.0% | ||||||||||||||||||||
| Subordinated Debt(e)(g) | 8.75% | 6/1/2014 | 5,818 | 5,658 | 4,669 | 0.8% | ||||||||||||||||||||||||
|
|
|
|
|
|
|
|||||||||||||||||||||||||
| 12,549 | 10,588 |
|
1.8% |
| ||||||||||||||||||||||||||
|
|
||||||||||||||||||||||||||||||
| Express, LLC / Express Finance Corp. | Retailing | Subordinated Debt(e)(g) | 8.75% | 3/1/2018 | 707 | 765 | 765 | 0.1% | ||||||||||||||||||||||
|
|
||||||||||||||||||||||||||||||
| Fage Dairy Industry, SA | Food, Beverage & Tobacco | Subordinated Debt(e)(f)(g) | 9.88% | 2/1/2020 | 22 | 22 | 23 | 0.0% | ||||||||||||||||||||||
|
|
||||||||||||||||||||||||||||||
| Fidelity National Information Services, Inc. | Software & Services | Subordinated Debt(e)(g) | 5.00% | 3/15/2022 | 26 | 28 | 28 | 0.0% | ||||||||||||||||||||||
| Subordinated Debt(e)(g) | 7.88% | 7/15/2020 | 114 | 122 | 129 | 0.0% | ||||||||||||||||||||||||
|
|
|
|
|
|
|
|||||||||||||||||||||||||
| 150 | 157 |
|
0.0% |
| ||||||||||||||||||||||||||
|
|
||||||||||||||||||||||||||||||
| Fifth & Pacific Companies, Inc. | Consumer Durables & Apparel | Senior Debt(e)(f)(g) | 10.50% | 4/15/2019 | 1,735 | 1,848 | 1,922 | 0.3% | ||||||||||||||||||||||
|
|
||||||||||||||||||||||||||||||
| FleetPride Corp. | Capital Goods | Senior Debt(e) | L + 400 | 1.25 | % | 11/20/2019 | 588 | 578 | 590 | 0.1% | ||||||||||||||||||||
|
|
||||||||||||||||||||||||||||||
| Freedom Group | Consumer Durables & Apparel | Senior Debt(e) | L + 425 | 1.25 | % | 4/19/2019 | 992 | 987 | 969 | 0.2% | ||||||||||||||||||||
| Senior Debt(e)(f) | 7.88% | 5/1/2020 | 2,667 | 2,870 | 2,747 | 0.4% | ||||||||||||||||||||||||
|
|
|
|
|
|
|
|||||||||||||||||||||||||
| 3,857 | 3,716 |
|
0.6% |
| ||||||||||||||||||||||||||
|
|
||||||||||||||||||||||||||||||
| FTI Consulting, Inc. | Diversified Financials | Subordinated Debt(e)(f)(g) | 6.00% | 11/15/2022 | 2,869 | 2,869 | 2,984 | 0.5% | ||||||||||||||||||||||
|
|
||||||||||||||||||||||||||||||
| GCI, Inc. | Telecommunication Services | Subordinated Debt(e) | 8.63% | 11/15/2019 | 8,575 | 9,103 | 9,111 | 1.5% | ||||||||||||||||||||||
|
|
||||||||||||||||||||||||||||||
| Genesys Telecommunications Laboratories, Inc. | Software & Services | Common Stocks*(i) Subordinated Debt(i)(EUR) |
12.50% | 1/31/2020 | € |
448,908 2,044 |
|
|
449 2,631 |
|
|
453 2,765 |
|
|
0.1% 0.5% |
| ||||||||||||||
|
|
|
|
|
|
|
|||||||||||||||||||||||||
| 3,080 | 3,218 |
|
0.6% |
| ||||||||||||||||||||||||||
|
|
||||||||||||||||||||||||||||||
| Good Sam Enterprises, LLC | Media | Senior Debt(e) | 11.50% | 12/1/2016 | $ | 12,224 | 12,630 | 13,080 | 2.1% | |||||||||||||||||||||
|
|
||||||||||||||||||||||||||||||
| Great Lakes Dredge & Dock Corp. | Capital Goods | Subordinated Debt(e)(g) | 7.38% | 2/1/2019 | 782 | 802 | 839 | 0.1% | ||||||||||||||||||||||
|
|
||||||||||||||||||||||||||||||
| Guitar Center, Inc. | Retailing | Senior Debt(e) | L + 350 | 4/9/2017 | 12,249 | 11,486 | 11,848 | 2.0% | ||||||||||||||||||||||
|
|
||||||||||||||||||||||||||||||
See notes to condensed consolidated financial statements
19
Corporate Capital Trust, Inc. and Subsidiaries
Consolidated Schedule of Investments (continued)
As of December 31, 2012
(in thousands, except share amounts)
| Company (a) | Industry (n) | Investments | Interest Rate |
EURIBOR/ LIBOR |
Maturity Date |
No. Shares/ Principal Amount (b) |
Cost (c) | Fair Value | % of Net Assets |
|||||||||||||||||||||||||||||
|
|
||||||||||||||||||||||||||||||||||||||
| Hamilton Sundstrand Industrial (LU)(h) | Capital Goods | Senior Debt(e)(j) | L + 375 | 1.25% | 12/13/2019 | $ | 1,708 | $ | 1,691 | $ | 1,727 | 0.3% | ||||||||||||||||||||||||||
| Subordinated Debt(e) | 7.75% | 12/15/2020 | 407 | 407 | 421 | 0.1% | ||||||||||||||||||||||||||||||||
|
|
|
|
|
|
|
|||||||||||||||||||||||||||||||||
|
|
2,098 |
|
|
2,148 |
|
|
0.4% |
| ||||||||||||||||||||||||||||||
|
|
||||||||||||||||||||||||||||||||||||||
| Harbor Freight Tools USA, Inc. | Capital Goods | Senior Debt(e) | L + 425 | 1.25% | 11/14/2017 | 5,266 | 5,231 | 5,337 | 0.9% | |||||||||||||||||||||||||||||
|
|
||||||||||||||||||||||||||||||||||||||
| HUB International, Ltd. | Insurance | Senior Debt(e) | L + 450 | 6/13/2017 | 5,091 | 5,052 | 5,139 | 0.8% | ||||||||||||||||||||||||||||||
| Senior Debt(e) | L + 475 | 2.00% | 12/13/2017 | 329 | 329 | 333 | 0.1% | |||||||||||||||||||||||||||||||
| Subordinated Debt(e)(f) | 8.13% | 10/15/2018 | 16,780 | 16,773 | 17,126 | 2.8% | ||||||||||||||||||||||||||||||||
|
|
|
|
|
|
|
|||||||||||||||||||||||||||||||||
|
|
22,154 |
|
|
22,598 |
|
|
3.7% |
| ||||||||||||||||||||||||||||||
|
|
||||||||||||||||||||||||||||||||||||||
| Hubbard Radio, LLC | Media | Senior Debt | L + 725 | 1.50% | 4/30/2018 | 14,670 | 14,800 | 14,963 | 2.4% | |||||||||||||||||||||||||||||
|
|
||||||||||||||||||||||||||||||||||||||
| Hyland Software, Inc. | Software & Services | Senior Debt(e) | L + 425 | 1.25% | 10/25/2019 | 4,718 | 4,695 | 4,738 | 0.8% | |||||||||||||||||||||||||||||
|
|
||||||||||||||||||||||||||||||||||||||
| Immucor, Inc. | Health Care Equipment & Services | Senior Debt(e)(j) | L + 450 | 1.25% | 8/19/2018 | 2,372 | 2,379 | 2,406 | 0.4% | |||||||||||||||||||||||||||||
|
|
||||||||||||||||||||||||||||||||||||||
| IMS Health, Inc. | Health Care Equipment & Services | Subordinated Debt(e)(f)(g) | 6.00% | 11/1/2020 | 1,657 | 1,657 | 1,736 | 0.3% | ||||||||||||||||||||||||||||||
|
|
||||||||||||||||||||||||||||||||||||||
| Ineos US Finance, LLC (UK)(h) | Materials | Senior Debt(e)(f)(g) | 9.00% | 5/15/2015 | 70 | 73 | 74 | 0.0% | ||||||||||||||||||||||||||||||
|
|
||||||||||||||||||||||||||||||||||||||
| Infor (US), Inc. | Software & Services | Senior Debt(e) | L + 400 | 1.25% | 4/5/2018 | 6,310 | 6,352 | 6,379 | 1.0% | |||||||||||||||||||||||||||||
| Subordinated Debt(e)(f) | 11.50% | 7/15/2018 | 4,549 | 4,968 | 5,322 | 0.9% | ||||||||||||||||||||||||||||||||
|
|
|
|
|
|
|
|||||||||||||||||||||||||||||||||
|
|
11,320 |
|
|
11,701 |
|
|
1.9% |
| ||||||||||||||||||||||||||||||
|
|
||||||||||||||||||||||||||||||||||||||
| Interactive Data Corp. | Diversified Financials | Senior Debt(e) | L + 325 | 1.25% | 2/11/2018 | 18 | 17 | 18 | 0.0% | |||||||||||||||||||||||||||||
|
|
||||||||||||||||||||||||||||||||||||||
| iPayment, Inc. | Software & Services | Senior Debt(e) | L + 425 | 1.50% | 5/8/2017 | 1,910 | 1,892 | 1,906 | 0.3% | |||||||||||||||||||||||||||||
| Subordinated Debt(e) | 10.25% | 5/15/2018 | 4,100 | 3,872 | 3,290 | 0.5% | ||||||||||||||||||||||||||||||||
|
|
|
|
|
|
|
|||||||||||||||||||||||||||||||||
|
|
5,764 |
|
|
5,196 |
|
|
0.8% |
| ||||||||||||||||||||||||||||||
|
|
||||||||||||||||||||||||||||||||||||||
| IPC Systems, Inc. | Technology Hardware & Equipment | Senior Debt(e) | L + 650 | 1.25% | 7/31/2017 | 6,307 | 6,185 | 6,179 | 1.0% | |||||||||||||||||||||||||||||
|
|
||||||||||||||||||||||||||||||||||||||
| J. Crew Group, Inc. | Retailing | Subordinated Debt(e) | 8.13% | 3/1/2019 | 1,471 | 1,401 | 1,556 | 0.3% | ||||||||||||||||||||||||||||||
|
|
||||||||||||||||||||||||||||||||||||||
| J. Jill | Retailing | Senior Debt(e)(i) | L + 850 | 1.50% | 4/29/2017 | 10,266 | 10,266 | 10,266 | 1.7% | |||||||||||||||||||||||||||||
|
|
||||||||||||||||||||||||||||||||||||||
| Jeld-Wen, Inc. | Capital Goods | Senior Debt(e)(f) | 12.25% | 10/15/2017 | 15,171 | 17,516 | 17,523 | 2.9% | ||||||||||||||||||||||||||||||
|
|
||||||||||||||||||||||||||||||||||||||
| Kerling PLC (UK)(h) | Materials | Senior Debt(f)(g)(EUR) | 10.63% | 2/1/2017 | € | 5,353 | 6,597 | 6,783 | 1.1% | |||||||||||||||||||||||||||||
|
|
||||||||||||||||||||||||||||||||||||||
| KeyPoint Government Solutions, Inc. | Capital Goods | Senior Debt(e)(i) | L + 600 | 1.25% | 11/13/2017 | $ | 35,000 | 34,284 | 34,650 | 5.7% | ||||||||||||||||||||||||||||
|
|
||||||||||||||||||||||||||||||||||||||
See notes to condensed consolidated financial statements
20
Corporate Capital Trust, Inc. and Subsidiaries
Consolidated Schedule of Investments (continued)
As of December 31, 2012
(in thousands, except share amounts)
| Company (a) | Industry (n) | Investments | Interest Rate |
EURIBOR/ LIBOR |
Maturity Date |
No. Shares/ Principal Amount (b) |
Cost (c) | Fair Value | % of Net Assets |
|||||||||||||||||||||
|
|
||||||||||||||||||||||||||||||
| Mcjunkin Corp. | Energy | Senior Debt(e) | L + 500 | 1.25% | 10/20/2019 | $ | 6,222 | $ | 6,160 | $ | 6,160 | 1.0% | ||||||||||||||||||
|
|
||||||||||||||||||||||||||||||
| MedAssets, Inc. | Health Care Equipment & Services | Subordinated Debt(e)(g) | 8.00% | 11/15/2018 | 489 | 490 | 531 | 0.1% | ||||||||||||||||||||||
|
|
||||||||||||||||||||||||||||||
| MetroPCS Wireless, Inc. | Telecommunication Services | Subordinated Debt(e)(g) | 7.88% | 9/1/2018 | 1,762 | 1,834 | 1,907 | 0.3% | ||||||||||||||||||||||
|
|
||||||||||||||||||||||||||||||
| Misys PLC (UK)(h) | Software & Services | Senior Debt(e)(g) | L + 600 | 1.25% | 12/12/2018 | 1,970 | 1,947 | 1,994 | 0.3% | |||||||||||||||||||||
|
|
||||||||||||||||||||||||||||||
| Mueller Water Products, Inc. | Capital Goods | Subordinated Debt(e)(g) | 7.38% | 6/1/2017 | 1,034 | 895 | 1,067 | 0.2% | ||||||||||||||||||||||
|
|
||||||||||||||||||||||||||||||
| Nara Cable Funding (IE)(h) | Media | Senior Debt(e)(f)(g) | 8.88% | 12/1/2018 | 981 | 831 | 998 | 0.2% | ||||||||||||||||||||||
|
|
||||||||||||||||||||||||||||||
| National Vision, Inc. | Retailing | Senior Debt(e)(i) | L + 575 | 1.25% | 8/2/2018 | 3,039 | 2,995 | 3,084 | 0.5% | |||||||||||||||||||||
|
|
||||||||||||||||||||||||||||||
| NBTY, Inc. | Household & Personal Products | Senior Debt(e) | L + 325 | 1.00% | 10/1/2017 | 26 | 26 | 27 | 0.0% | |||||||||||||||||||||
|
|
||||||||||||||||||||||||||||||
| New Enterprise Stone & Lime Co., Inc. | Capital Goods | Senior Debt(e)(f) | 4.00%, 9.00% PIK |
3/15/2018 | 9,267 | 9,366 | 9,661 | 1.6% | ||||||||||||||||||||||
|
|
||||||||||||||||||||||||||||||
| Nexstar Broadcasting, Inc. | Media | Senior Debt(e)(g) | L + 350 | 1.00% | 12/3/2019 | 953 | 949 | 963 | 0.2% | |||||||||||||||||||||
| Senior Debt(e)(g)(j) | L + 350 | 1.00% | 12/3/2019 | 171 | 170 | 173 | 0.0% | |||||||||||||||||||||||
| Senior Debt(e)(g) | 8.88% | 4/15/2017 | 170 | 176 | 186 | 0.0% | ||||||||||||||||||||||||
|
|
|
|
|
|
|
|||||||||||||||||||||||||
| 1,295 | 1,322 |
|
0.2% |
| ||||||||||||||||||||||||||
|
|
||||||||||||||||||||||||||||||
| North American Breweries, Inc. | Food, Beverage & Tobacco | Senior Debt(e)(j) | L + 625 | 1.25% | 12/28/2018 | 4,969 | 4,870 | 4,994 | 0.8% | |||||||||||||||||||||
|
|
||||||||||||||||||||||||||||||
| Nuveen Investments, Inc. | Diversified Financials | Senior Debt(e)(g) | L + 700 | 1.25% | 2/28/2019 | 6,967 | 7,072 | 7,120 | 1.2% | |||||||||||||||||||||
|
|
||||||||||||||||||||||||||||||
| Ocwen Financial Corp. | Banks | Senior Debt(e)(g)(j) | L + 550 | 1.50% | 9/1/2016 | 14,119 | 13,977 | 14,224 | 2.3% | |||||||||||||||||||||
|
|
||||||||||||||||||||||||||||||
| Office Depot, Inc. | Retailing | Senior Debt(e)(f)(g) | 9.75% | 3/15/2019 | 5,743 | 5,649 | 6,030 | 1.0% | ||||||||||||||||||||||
|
|
||||||||||||||||||||||||||||||
| Petco Animal Supplies, Inc. | Retailing | Senior Debt(e) | L + 325 | 1.25% | 11/24/2017 | 119 | 114 | 120 | 0.0% | |||||||||||||||||||||
|
|
||||||||||||||||||||||||||||||
| Pharmaceutical Product Development, Inc. | Pharmaceuticals, Biotechnology & Life Sciences | Senior Debt(e) | L + 500 | 1.25% | 12/5/2018 | 801 | 791 | 815 | 0.1% | |||||||||||||||||||||
|
|
||||||||||||||||||||||||||||||
| Prestige Brands, Inc. | Pharmaceuticals, Biotechnology & Life Sciences | Subordinated Debt(e)(g) | 8.13% | 2/1/2020 | 602 | 642 | 670 | 0.1% | ||||||||||||||||||||||
|
|
||||||||||||||||||||||||||||||
| Realogy Corp. | Real Estate | Senior Debt(e)(g) | L + 425 | 10/10/2016 | 4,126 | 3,916 | 4,145 | 0.6% | ||||||||||||||||||||||
|
|
||||||||||||||||||||||||||||||
See notes to condensed consolidated financial statements
21
Corporate Capital Trust, Inc. and Subsidiaries
Consolidated Schedule of Investments (continued)
As of December 31, 2012
(in thousands, except share amounts)
| Company (a) | Industry (n) | Investments | Interest Rate |
EURIBOR/ LIBOR |
Maturity Date |
No. Shares/ Principal Amount (b) |
Cost (c) | Fair Value | % of Net Assets |
|||||||||||||||||||||
|
|
||||||||||||||||||||||||||||||
| RedPrairie Corp. | Software & Services | Senior Debt(e)(j) | L + 550 | 1.25% | 12/15/2018 | $ | 13,766 | $ | 13,490 | $ | 13,785 | 2.3% | ||||||||||||||||||
| Senior Debt(e)(j) | L + 1000 | 1.25% | 12/15/2019 | 10,729 | 10,515 | 10,854 | 1.8% | |||||||||||||||||||||||
|
|
|
|
|
|
|
|||||||||||||||||||||||||
| 24,005 | 24,639 |
|
4.1% |
| ||||||||||||||||||||||||||
|
|
||||||||||||||||||||||||||||||
| Reynolds Group Holdings, Inc. | Capital Goods | Senior Debt(e)(f) | 5.75% | 10/15/2020 | 533 | 533 | 550 | 0.1% | ||||||||||||||||||||||
|
|
||||||||||||||||||||||||||||||
| Rocket Software, Inc. | Software & Services | Senior Debt(e)(j) | L + 450 | 1.25% | 2/8/2018 | 4,177 | 4,166 | 4,204 | 0.7% | |||||||||||||||||||||
|
|
||||||||||||||||||||||||||||||
| Roundy’s Supermarkets, Inc. | Food & Staples Retailing | Senior Debt(e)(g) | L + 450 | 1.25% | 2/13/2019 | 4,465 | 4,440 | 4,212 | 0.7% | |||||||||||||||||||||
|
|
||||||||||||||||||||||||||||||
| Ryerson, Inc. | Materials | Senior Debt(e)(f) | 9.00% | 10/15/2017 | 6,755 | 6,756 | 6,873 | 1.1% | ||||||||||||||||||||||
|
|
||||||||||||||||||||||||||||||
| Sabre, Inc. | Transportation | Senior Debt(e)(j) | L + 600 | 1.25% | 12/29/2017 | — | (1) | — | 0.0% | |||||||||||||||||||||
| Senior Debt(e)(f) | 8.50% | 5/15/2019 | 8,879 | 9,107 | 9,456 | 1.5% | ||||||||||||||||||||||||
|
|
|
|
|
|
|
|||||||||||||||||||||||||
| 9,106 | 9,456 |
|
1.5% |
| ||||||||||||||||||||||||||
|
|
||||||||||||||||||||||||||||||
| Sanmina Corp. | Technology Hardware & Equipment | Subordinated Debt(e)(f)(g) | 7.00% | 5/15/2019 | 7,879 | 7,868 | 8,037 | 1.3% | ||||||||||||||||||||||
|
|
||||||||||||||||||||||||||||||
| Schaeffler AG (DE)(h) | Automobiles & Components | Senior Debt(e)(g)(j) | L + 475 | 1.25% | 1/27/2017 | 3,086 | 3,095 | 3,121 | 0.5% | |||||||||||||||||||||
| Senior Debt(e)(f)(g) | 8.50% | 2/15/2019 | 5 | 5 | 5 | 0.0% | ||||||||||||||||||||||||
|
|
|
|
|
|
|
|||||||||||||||||||||||||
| 3,100 | 3,126 | 0.5% | ||||||||||||||||||||||||||||
|
|
||||||||||||||||||||||||||||||
| Sedgwick Claims Management Services | Insurance | Senior Debt(e)(i) | L + 350 | 1.50% | 12/31/2016 | 113 | 108 | 113 | 0.0% | |||||||||||||||||||||
| Holdings, Inc. | Senior Debt(e)(i) | L + 750 | 1.50% | 5/30/2017 | 1,339 | 1,318 | 1,359 | 0.3% | ||||||||||||||||||||||
|
|
|
|
|
|
|
|||||||||||||||||||||||||
| 1,426 | 1,472 |
|
0.3% |
| ||||||||||||||||||||||||||
|
|
||||||||||||||||||||||||||||||
| Sidera Networks, Inc. | Media | Senior Debt(e) | L + 450 | 1.50% | 8/26/2016 | 2,632 | 2,494 | 2,635 | 0.4% | |||||||||||||||||||||
|
|
||||||||||||||||||||||||||||||
| Sinclair Television Group, Inc. | Media | Subordinated Debt(e) | 8.38% | 10/15/2018 | 27 | 28 | 30 | 0.0% | ||||||||||||||||||||||
|
|
||||||||||||||||||||||||||||||
| Sirius XM Radio, Inc. | Media | Subordinated Debt(e)(f)(g) | 5.25% | 8/15/2022 | 9 | 9 | 9 | 0.0% | ||||||||||||||||||||||
|
|
||||||||||||||||||||||||||||||
| SkillSoft Corp. | Software & Services | Subordinated Debt(e) | 11.13% | 6/1/2018 | 1,369 | 1,444 | 1,514 | 0.2% | ||||||||||||||||||||||
|
|
||||||||||||||||||||||||||||||
| Smile Brands Group, Inc. | Health Care Equipment & Services | Senior Debt(e) | L + 525 | 1.75% | 12/21/2017 | 3,793 | 3,807 | 3,566 | 0.6% | |||||||||||||||||||||
|
|
||||||||||||||||||||||||||||||
| SNL Financial, LLC | Commercial & Professional Services | Senior Debt(e) | L + 425 | 1.25% | 10/23/2018 | 5,667 | 5,650 | 5,672 | 0.9% | |||||||||||||||||||||
|
|
||||||||||||||||||||||||||||||
| Springleaf Financial Funding Co. | Diversified Financials | Senior Debt(e)(g) | L + 425 | 1.25% | 5/10/2017 | 2,552 | 2,316 | 2,542 | 0.4% | |||||||||||||||||||||
|
|
||||||||||||||||||||||||||||||
| Standard Chartered Bank (SG)(h) | Banks | Subordinated Debt(f)(g)(i)(k) | L + 1600 | 4/1/2014 | 3,310 | 3,335 | 3,443 | 0.6% | ||||||||||||||||||||||
|
|
||||||||||||||||||||||||||||||
See notes to condensed consolidated financial statements
22
Corporate Capital Trust, Inc. and Subsidiaries
Consolidated Schedule of Investments (continued)
As of December 31, 2012
(in thousands, except share amounts)
| Company (a) | Industry (n) | Investments | Interest Rate |
EURIBOR/ LIBOR |
Maturity Date |
No. Shares/ Principal Amount (b) |
Cost (c) | Fair Value | % of Net Assets |
|||||||||||||||||||
|
|
||||||||||||||||||||||||||||
| Supervalu, Inc. | Food & Staples Retailing | Subordinated Debt(e)(g) | 7.25% | 5/1/2013 | $ | 3,503 | $ | 3,485 | $ | 3,534 | 0.6% | |||||||||||||||||
| Subordinated Debt(e)(g) | 7.50% | 11/15/2014 | 5,397 | 5,235 | 5,235 | 0.9% | ||||||||||||||||||||||
|
|
|
|
|
|
|
|||||||||||||||||||||||
| 8,720 | 8,769 | 1.5% | ||||||||||||||||||||||||||
|
|
||||||||||||||||||||||||||||
| The Gymboree Corp. | Retailing | Senior Debt(e) | L + 350 | 1.50% | 2/23/2018 | 17,904 | 17,247 | 16,539 | 2.7% | |||||||||||||||||||
| Subordinated Debt(e) | 9.13% | 12/1/2018 | 12,818 | 12,135 | 11,408 | 1.9% | ||||||||||||||||||||||
|
|
|
|
|
|
|
|||||||||||||||||||||||
| 29,382 | 27,947 | 4.6% | ||||||||||||||||||||||||||
|
|
||||||||||||||||||||||||||||
| The Manitowoc Co., Inc. | Capital Goods | Subordinated Debt(e)(g) | 5.88% | 10/15/2022 | 183 | 184 | 183 | 0.0% | ||||||||||||||||||||
|
|
||||||||||||||||||||||||||||
| The Neiman Marcus Group, Inc. | Retailing | Senior Debt(e) | L + 350 | 1.25% | 5/16/2018 | 189 | 183 | 189 | 0.0% | |||||||||||||||||||
|
|
||||||||||||||||||||||||||||
| The SI Organization, Inc. | Capital Goods | Senior Debt(e) | L + 325 | 1.25% | 11/22/2016 | 186 | 176 | 186 | 0.0% | |||||||||||||||||||
|
|
||||||||||||||||||||||||||||
| The TelX Group, Inc. | Telecommunication Services | Senior Debt(e) | L + 500 | 1.25% | 9/23/2017 | 9,550 | 9,606 | 9,657 | 1.6% | |||||||||||||||||||
|
|
||||||||||||||||||||||||||||
| Tomkins Air Distribution | Capital Goods | Senior Debt(e) | L + 800 | 1.25% | 5/11/2020 | 3,454 | 3,403 | 3,541 | 0.6% | |||||||||||||||||||
|
|
||||||||||||||||||||||||||||
| Towergate Finance PLC (UK)(h) | Insurance | Subordinated Debt(f)(g)(GBP) | 10.50% | 2/15/2019 | £ | 4,125 | 6,280 | 6,835 | 1.1% | |||||||||||||||||||
|
|
||||||||||||||||||||||||||||
| TransUnion, LLC | Diversified Financials | Subordinated Debt(e) | 11.38% | 6/15/2018 | $ | 1,403 | 1,541 | 1,634 | 0.3% | |||||||||||||||||||
|
|
||||||||||||||||||||||||||||
| Univar, Inc. | Materials | Senior Debt(e) | L + 350 | 1.50% | 6/30/2017 | 953 | 929 | 952 | 0.2% | |||||||||||||||||||
|
|
||||||||||||||||||||||||||||
| Verisure Holding AB (SE)(h) | Commercial & Professional Services | Senior Debt(f)(g)(EUR) | 8.75% | 9/1/2018 | € | 397 | 484 | 571 | 0.1% | |||||||||||||||||||
|
|
||||||||||||||||||||||||||||
| Vision Solutions, Inc. | Commercial & Professional Services | Senior Debt(e)(i) | L + 450 | 1.50% | 7/23/2016 | $ | 1,275 | 1,263 | 1,272 | 0.2% | ||||||||||||||||||
|
|
||||||||||||||||||||||||||||
| VWR Funding, Inc. | Pharmaceuticals, Biotechnology & Life Sciences | Senior Debt(e) Subordinated Debt(e)(f) |
L + 425 7.25% |
|
4/3/2017 9/15/2017 |
|
|
146 5,349 |
|
|
140 5,349 |
|
|
147 5,616 |
|
|
0.0% 0.9% |
| ||||||||||
|
|
|
|
|
|
|
|||||||||||||||||||||||
| 5,489 | 5,763 | 0.9% | ||||||||||||||||||||||||||
|
|
||||||||||||||||||||||||||||
| Warner Chilcott Co., LLC (IE) | Pharmaceuticals, Biotechnology & Life Sciences | Subordinated Debt(e)(g)(h) | 7.75% | 9/15/2018 | 1,225 | 1,220 | 1,305 | 0.2% | ||||||||||||||||||||
|
|
||||||||||||||||||||||||||||
| Wastequip, LLC | Materials | Senior Debt(e)(i) | L + 675 | 1.50% | 6/15/2018 | 11,228 | 10,970 | 11,453 | 1.9% | |||||||||||||||||||
|
|
||||||||||||||||||||||||||||
| West Corp. | Software & Services | Subordinated Debt(e) | 7.88% | 1/15/2019 | 1,575 | 1,560 | 1,630 | 0.3% | ||||||||||||||||||||
|
|
||||||||||||||||||||||||||||
| Wilton Brands, LLC | Materials | Senior Debt(e) | L + 625 | 1.25% | 8/30/2018 | 12,824 | 12,581 | 12,984 | 2.1% | |||||||||||||||||||
|
|
||||||||||||||||||||||||||||
See notes to condensed consolidated financial statements
23
Corporate Capital Trust, Inc. and Subsidiaries
Consolidated Schedule of Investments (continued)
As of December 31, 2012
(in thousands, except share amounts)
| Company (a) | Industry (n) | Investments | Interest Rate |
EURIBOR/ LIBOR Floor |
Maturity Date |
No. Shares/ Principal Amount (b) |
Cost (c) | Fair Value | % of Net Assets |
|||||||||||||||||||||||||
|
|
||||||||||||||||||||||||||||||||||
| Zayo Group, LLC | Telecommunication Services | Senior Debt(e) | 8.13% | 1/1/2020 | $ | 2,260 | $ | 2,401 | $ | 2,514 | 0.4% | |||||||||||||||||||||||
| Subordinated Debt(e) | 10.13% | 7/1/2020 | 5,000 | 5,324 | 5,688 | 0.9% | ||||||||||||||||||||||||||||
|
|
|
|
|
|
|
|||||||||||||||||||||||||||||
| 7,725 | 8,202 | 1.3% | ||||||||||||||||||||||||||||||||
|
|
||||||||||||||||||||||||||||||||||
| Total Non-Control/Non-Affiliate Investments |
|
691,427 | 697,668 | 114.1% | ||||||||||||||||||||||||||||||
|
|
|
|
|
|
|
|||||||||||||||||||||||||||||
| Short Term Investments—2.2% |
|
|||||||||||||||||||||||||||||||||
| Goldman Sachs Financial Square Funds - Prime Obligations Fund | Short Term Investments(e) | 0.08% | (l) | 2,049,281 | 2,050 | 2,050 | 0.4% | |||||||||||||||||||||||||||
|
|
||||||||||||||||||||||||||||||||||
| State Street Institutional Liquid Reserves Fund | Short Term Investments | 0.16% | (l) | 11,152,887 | 11,153 | 11,153 | 1.8% | |||||||||||||||||||||||||||
|
|
||||||||||||||||||||||||||||||||||
| Total Short Term Investments |
|
13,203 | 13,203 | 2.2% | ||||||||||||||||||||||||||||||
|
|
|
|
|
|
|
|||||||||||||||||||||||||||||
| TOTAL INVESTMENTS —116.3%(m) |
|
$ | 704,630 | 710,871 | 116.3% | |||||||||||||||||||||||||||||
|
|
|
|
|
|
|
|||||||||||||||||||||||||||||
| LIABILITIES IN EXCESS OF OTHER ASSETS—(16.3%) |
|
(99,387) | (16.3)% | |||||||||||||||||||||||||||||||
| NET ASSETS—100.0% |
|
$ | 611,484 | 100.0% | ||||||||||||||||||||||||||||||
| Derivative Instruments—0.20% |
|
|||||||||||||||||||||||||||||||||
| Total return swaps (Note 4) (g) | Total return swaps | N/A | 1/15/2016 | N/A | $ | — | $ | 1,349 | 0.2% | |||||||||||||||||||||||||
|
|
||||||||||||||||||||||||||||||||||
| Foreign currency forward contracts (Note 4) (g) | Foreign currency forward contracts | N/A | 1/2013 | N/A | — | (147) | (0.0)% | |||||||||||||||||||||||||||
|
|
||||||||||||||||||||||||||||||||||
| Total Derivative Instruments |
|
— | $ | 1,202 | 0.2% | |||||||||||||||||||||||||||||
|
|
|
|
|
|
|
|||||||||||||||||||||||||||||
| * | Non-income producing security. |
| (a) | Security may be an obligation of one or more entities affiliated with the named company. |
| (b) | Denominated in U.S. Dollars unless otherwise noted. |
| (c) | Represents amortized cost for debt securities and cost for common stock. |
See notes to condensed consolidated financial statements
24
Corporate Capital Trust, Inc. and Subsidiaries
Consolidated Schedule of Investments (continued)
As of December 31, 2012
(in thousands, except share amounts)
| (d) | Non-Control/Non-Affiliate investments are defined by the Investment Company Act of 1940, as amended (“1940 Act”) as investments that are neither Control Investments nor Affiliate Investments. Controlled investments are defined by the 1940 Act as investments in which more than 25% of the voting securities are owned or where the ability to nominate greater than 50% of the board representation is maintained. Affiliate investments are defined by the 1940 Act as investments in which between 5% and 25% of the voting securities are owned and the investments are not classified as Controlled investments. |
| (e) | Security or portion thereof is held within CCT Funding, LLC and is pledged as collateral supporting the amounts outstanding under the revolving credit facility with Deutsche Bank. |
| (f) | This security was acquired in a transaction that was exempt from the registration requirements of the Securities Act of 1933, as amended (the “Securities Act”), pursuant to Rule 144A thereunder. This security may be resold only in transactions that are exempt from the registration requirements of the Securities Act, normally to qualified institutional buyers. |
| (g) | The investment is not a qualifying asset as defined in Section 55(a) under the Investment Company Act of 1940, as amended, or the 1940 Act. A business development company may not acquire any asset other than qualifying assets, unless, at the time the acquisition is made, qualifying assets represent at least 70% of the company’s total assets. The Company calculates its compliance with the qualifying assets test on a “look through” basis by disregarding the value of the Company’s total return swaps and treating each loan underlying the total return swaps as either a qualifying assets or non-qualifying asset based on whether the obligor is an eligible portfolio company. On this basis, 79.3% of the Company’s total assets represented qualifying assets as of December 31, 2012. |
| (h) | A portfolio company domiciled in a foreign country. |
| (i) | Investments classified as Level 3 whereby fair value was determined by the Company’s Board of Directors (see Note 2). |
| (j) | Position or portion thereof unsettled as of December 31, 2012. |
| (k) | A portfolio company investment structured as a credit-linked floating rate note. |
| (l) | 7-day effective yield as of December 31, 2012. |
| (m) | As of December 31, 2012, the aggregate gross unrealized appreciation for all securities in which there was an excess of value over tax cost was $15,000; the aggregate gross unrealized depreciation for all securities in which there was an excess of tax cost over value was $8,759; the net unrealized appreciation was $6,241; the aggregate cost of securities for Federal income tax purposes was $704,630. |
| (n) | Unaudited. |
Abbreviations:
EUR - Euro; principal amount is denominated in Euros currency. €1 / US $1.320 as of December 31, 2012.
GBP - British Pound Sterling; principal amount is denominated in Pound Sterling. £1 / US $1.624 as of December 31, 2012.
DE - Germany
ES - Spain
IE - Ireland
LU - Luxembourg
MX - Mexico
SE - Sweden
SG - Singapore
UK - United Kingdom
L = LIBOR - London Interbank Offered Rate, typically 3-Month
PIK - Payment-in-kind
See notes to condensed consolidated financial statements
25
CORPORATE CAPITAL TRUST, INC. AND SUBSIDIARIES
Notes to Condensed Consolidated Financial Statements ($ amounts in thousands, except share and per share amounts)
| 1. | Principal Business and Organization |
Corporate Capital Trust, Inc. (the “Company”) was incorporated under the general corporation laws of the State of Maryland on June 9, 2010. The Company is a non-diversified closed-end management investment company and it is regulated as a business development company (“BDC”) under the Investment Company Act of 1940 (the “40 Act”). The Company’s investment objective is to provide its shareholders with current income and, to a lesser extent, long-term capital appreciation, by investing primarily in the debt of privately owned U.S. companies with a focus on originated transactions sourced through the networks of its advisors. The Company commenced business operations on June 17, 2011 and it commenced investment operations on July 1, 2011.
The Company is externally managed by CNL Fund Advisors Company (“CNL”) and KKR Asset Management LLC (“KKR”) (collectively the “Advisors”), which are responsible for sourcing potential investments, analyzing and conducting due diligence on prospective investment opportunities, structuring investments and monitoring the Company’s investment portfolio on an ongoing basis. Both Advisors are registered as investment advisers with the Securities and Exchange Commission (“SEC”). CNL also provides the administrative services necessary for the Company to operate.
The Company is currently selling shares of its common stock pursuant to a registration statement on Form N-2 (as amended and supplemented, the “Registration Statement”) and it is offering to sell, on a continuous basis, 150 million shares of common stock for approximately $1.7 billion (the “Offering”). The Registration Statement was declared effective by the SEC on April 4, 2011 and the Company commenced its Offering. On June 21, 2013, the Company filed a registration statement on Form N-2 (Registration No. 333-189544) with the SEC in connection with the proposed offering of up to 200 million additional shares of common stock (the “Follow-On Offering”). The Follow-On Offering was not yet declared effective by the SEC as of September 30, 2013.
As of September 30, 2013, the Company had three wholly owned financing subsidiaries. CCT Funding LLC (“CCT Funding”) and Paris Funding LLC (“Paris Funding”) were established on July 15, 2011 and August 13, 2013, respectively, both for the purpose of arranging secured, revolving credit facilities with banks and to borrow money to invest in portfolio companies. Halifax Funding LLC (“Halifax Funding”) was established on October 11, 2012 for the purpose of entering into total return swaps (“TRS”).
| 2. | Significant Accounting Policies |
Basis of Presentation and Principles of Consolidation - The accompanying financial statements of the Company are prepared in accordance with the instructions to Form 10-Q and accounting principles generally accepted in the United States of America (“GAAP”). In the opinion of management, all material adjustments, consisting solely of normal recurring accruals, considered necessary for the fair presentation of financial statements for the interim periods, have been included. The results of operations for interim periods are not indicative of results to be expected for the full year.
Certain financial information that is normally included in annual financial statements, including certain financial statement footnotes, prepared in accordance with GAAP, is not required for interim reporting purposes and has been condensed or omitted herein. These financial statements should be read in conjunction with the Company’s financial statements and notes related thereto included in the Company’s Annual Report on Form 10-K for the year ended December 31, 2012, which was filed with the SEC on March 18, 2013. The condensed consolidated financial statements include the accounts of the Company and its wholly owned subsidiaries.
Use of Estimates - The preparation of condensed consolidated financial statements in conformity with GAAP requires management to make estimates and assumptions that affect (i) the reported amounts of assets and liabilities at the date of the condensed consolidated financial statements, (ii) the reported amounts of income and expenses during the reported period and (iii) disclosure of contingent assets and liabilities at the date of the condensed consolidated financial statements. Actual results could differ from those estimates.
Cash and Cash Equivalents - Cash and cash equivalents consist of demand deposits, foreign currency, and highly liquid investments with original maturities of three months or less.
Valuation of Investments - The Company measures the value of its investments in accordance with Accounting Standards Codification Topic 820, Fair Value Measurements and Disclosure (“ASC Topic 820”), issued by the Financial Accounting Standards Board (“FASB”). Fair value is the price that would be received to sell an asset or paid to transfer a liability in an orderly transaction between market participants at the measurement date.
ASC Topic 820 also defines hierarchical levels directly related to the amount of subjectivity associated with the inputs to fair valuations of these assets and liabilities, and the hierarchical levels are described as follows:
26
Level 1 – Quoted prices are available in active markets for identical investments as of the reporting date. Publicly listed equities and debt securities, publicly listed derivatives, money market fund/ short term investment funds and foreign currency are generally included in Level 1. The Company does not adjust the quoted price for these investments.
Level 2 – Pricing inputs are other than quoted prices in active markets, which are either directly or indirectly observable as of the reporting date, and fair value is determined through the use of models or other valuation methodologies. In certain cases, debt and equity securities are valued on the basis of prices from orderly transactions for similar investments in active markets between market participants and provided by reputable dealers or independent pricing services. In determining the value of a particular investment, pricing services may use certain information with respect to transactions in such investments, quotations from dealers, pricing matrices, market transactions in comparable investments, and various relationships between investments. Investments generally included in this category are corporate bonds and loans, convertible debt indexed to publicly listed securities, foreign currency forward contracts and certain over-the-counter derivatives.
Level 3 – Pricing inputs are unobservable for the investment and include situations where there is little, if any, market activity for the investment. The inputs into the determination of fair value require significant judgment or estimation. Investments generally included in this category are total return swap agreements, corporate bonds and loans, common and preferred stock investments, and equity options that lack observable market pricing.
In certain cases, the inputs used to measure fair value may fall into different levels of the fair value hierarchy. In such cases, an investment’s level within the fair value hierarchy is based on the lowest level of input that is significant to the fair value measurement. The Company’s assessment of the significance of a particular input to the fair value measurement in its entirety requires judgment, and it considers factors specific to the investment.
Investments for which market quotations are readily available are valued using market quotations, which are generally obtained from independent pricing services, broker-dealers or market makers. With respect to the Company’s portfolio investments for which market quotations are not readily available, the Company’s board of directors is responsible for determining in good faith the fair value in accordance with the valuation policy approved by the board of directors, based on, among other things, the input of the Company’s investment adviser, audit committee and independent third-party valuation firms under a valuation policy and a consistently applied valuation process. The Company’s board of directors has the final responsibility for reviewing and approving, in good faith, the Company’s determination of the fair value of its investments.
The board of directors makes this fair value determination on a quarterly basis and any other time when a decision regarding the fair value of the portfolio investments is required. A determination of fair value involves subjective judgments and estimates. Due to the inherent uncertainty of determining the fair value of portfolio investments that do not have a readily available market value, the fair value of the investments may differ significantly from the values that would have been used had a readily available market value existed for such investments, and the differences could be material. Further, such investments are generally less liquid than publicly traded securities. If the Company was required to liquidate a portfolio investment that does not have a readily available market value in a forced or liquidation sale, the Company could realize significantly less than the value recorded by Company.
The Company and its Advisers undertake a multi-step valuation process each quarter for debt and equity securities whose market prices are not otherwise readily available, as described below:
| • | The quarterly valuation process initially begins with each portfolio company or investment being initially valued by KKR (internal valuation) and/or the Company’s independent third party valuation firm (external valuation) that provides a valuation range. |
| • | Valuation recommendations are formulated and documented by KKR and reviewed by KKR’s valuation committee. The KKR valuation committee then provides its valuation recommendation for each investment, along with supporting documentation, to CNL and the Company where the valuation recommendations and internal/external valuation documentation are reviewed by CNL and the Company’s management. |
| • | The Company’s audit committee then reviews the valuation recommendations and supporting documentation. |
| • | The Company’s board of directors then discusses the investment valuation recommendations with the Advisors and determines the fair value of these investments in good faith. |
Depending on the relative liquidity in the markets for certain assets, the Company may transfer assets to Level 3 if it determines that observable quoted prices, obtained directly or indirectly, are not available. The valuation techniques used for the assets and liabilities that are valued using Level 3 of the fair value hierarchy are described below.
27
Corporate Debt Securities and Corporate Loans, at Estimated Fair Value: Corporate debt securities and corporate loans, at estimated fair value are initially valued at transaction price and are subsequently valued using market data for similar instruments (e.g., recent transactions or indicative broker quotes), comparisons to benchmark derivative indices or valuation models. Valuation models are based on yield analysis and discounted cash flow techniques, where the key inputs are based on relative value analyses and the assignment of risk-adjusted discounted rates, based on the analysis of similar instruments from similar issuers. In addition, an illiquidity discount is applied where appropriate.
Equity Investments, at Estimated Fair Value: Equity investments, at estimated fair value, are initially valued at transaction price and are subsequently valued using observable market prices, if available, or internally developed models in the absence of readily observable market prices. Valuation models are generally based on market and income (discounted cash flow) approaches, in which various internal and external factors are considered. Factors include key financial inputs and recent public and private transactions for comparable investments. Key inputs used for the discounted cash flow approach include the weighted average cost of capital and assumed inputs used to calculate terminal values, such as earnings before interest, taxes, depreciation and amortization (“EBIDTA”) exit multiples. The fair value recorded for a particular investment will generally be within the range suggested by the two approaches. Upon completion of the valuations conducted, an illiquidity discount is applied where appropriate.
Total Return Swaps, at Estimated Fair Value: The Company values its TRS in accordance with the TRS agreements between the Company (or its wholly owned subsidiary) and the TRS counter-party, which collectively established the TRS. Pursuant to the TRS agreements, the value of the TRS is based on (i) the increase or decrease in the value of the TRS reference assets relative to the notional amounts, together with (ii) accrued interest income and fee income, (iii) TRS financing costs on the TRS settled notional amount, and (iv) certain other expenses incurred under the TRS. The TRS reference assets are valued pursuant to the valuation algorithm specified in the TRS Agreements, including reliance on indicative bid prices provided by independent third-party pricing services. Bid prices reflect the highest price that market participants may be willing to pay. On a quarterly basis, the Company’s management reviews, tests and compares (i) the indicative bid prices assigned to each TRS reference asset by the TRS counter-party, based on the inputs provided by third-party pricing services with (ii) pricing inputs that are independently sourced by the Company’s management and/or its Advisors from third-party pricing services. Additionally, the Company’s management reviews the calculations of both collected and accrued interest, TRS financing costs, and realized gains and losses that also determine the aggregate fair value of the TRS. For additional disclosures on the Company’s TRS, including quantitative disclosures of the current period conclusions of the fair value components, refer to Note 4.
Key unobservable inputs that have a significant impact on the Company’s Level 3 valuations as described above are included in Note 5. The Company utilizes several unobservable pricing inputs and assumptions in determining the fair value of its Level 3 investments. These unobservable pricing inputs and assumptions may differ by asset and in the application of the Company’s valuation methodologies. The reported fair value estimates could vary materially if the Company had chosen to incorporate different unobservable pricing inputs and other assumptions.
Security Transactions, Realized/Unrealized Gains or Losses, and Income Recognition - Security transactions are recorded on a trade-date basis. The Company measures realized gains or losses from the repayment or sale of investments using the specific identification method. The amortized cost basis of investments includes (i) the original cost and (ii) adjustments for the accretion/amortization of market discounts and premiums, original issue discount and loan origination fees. The Company reports changes in fair value of investments that are measured at fair value as a component of net change in unrealized appreciation (depreciation) on investments in the condensed consolidated statements of operations.
Interest income is recorded on an accrual basis and includes amortization of premiums to par value and accretion of discounts to par value. Discounts and premiums to par value on securities purchased are accreted/amortized into interest income over the life of the respective security using the effective interest method. Premiums and discounts are determined based on the cash flows expected to be collected for a particular investment. In its role as the Company’s investment adviser, KKR may provide assistance to portfolio companies and in return may receive fees for capital structuring services. KKR is obligated to remit to the Company any earned capital structuring fees based on the pro-rata portion of the Company’s investment. These fees are generally non-recurring and are recognized as earned revenue by the Company upon closing of the associated investment. Loan origination, closing, commitment and other fees received directly from borrowers in connection with the closing of investments are accreted over the contractual life of the loan based on the effective interest method as interest income. Upon prepayment of a debt investment, any prepayment penalties and unamortized loan fees and discounts are recorded as interest income.
The Company has investments in debt securities which contain a contractual payment-in-kind, or PIK, interest provision. If the borrower elects to pay, or is obligated to pay, PIK interest, and if deemed collectible in management’s judgment, then the PIK interest is computed at the contractual rate specified in the investment’s credit agreement, the computed PIK interest is added to the investment’s principal balance, and the computed PIK interest is recorded as interest income.
28
Dividend income on preferred equity securities is recorded as dividend income on an accrual basis to the extent that such amounts are payable by the portfolio company and are expected to be collected. Dividend income on common equity securities is recorded on the record date for private portfolio companies or on the ex-dividend date for publicly traded portfolio companies.
Loans or debt securities are placed on non-accrual status when principal or interest payments are at least 90 days past due or when there is reasonable doubt that principal or interest will be collected. Generally, accrued interest is reversed when a loan or a debt security is placed on non-accrual status. Interest payments received on non-accrual loans or debt securities may be recognized as income or applied to principal depending upon management’s judgment. Non-accrual loans and debt securities are restored to accrual status when past due principal and interest is paid and, in management’s judgment, are likely to remain current. The Company may make exceptions to this treatment if the loan has sufficient collateral value and is in the process of collection.
Derivative Instruments - The Company’s derivative instruments include foreign currency forward contracts and total return swaps. The Company marks the value of its derivative instruments to market value through net change in unrealized appreciation (depreciation) on derivative instruments in the condensed consolidated statements of operations. Unrealized appreciation (depreciation) on the TRS is composed of the net accrued interest income and accrued interest expense owed and the overall change in fair value of the TRS reference assets. Realized gains and losses that occur upon the cash settlement of the derivative instruments are included in net realized gain (loss) on derivative instruments in the condensed consolidated statements of operations. Realized gains and losses on the TRS are composed of any realized gains or losses on the TRS reference assets and the net interest received or paid on the quarterly TRS settlement date.
Deferred Financing Costs - Deferred financing costs represent fees and other direct costs incurred in connection with arranging the Company’s borrowings and total return swaps. These amounts are initially recorded as prepaid and deferred expenses on the condensed consolidated statements of assets and liabilities and then subsequently amortized over the contractual term of the credit facilities and total return swap agreements as interest expense.
Paid In Capital - The Company records the proceeds from the sale of its common stock on a net basis to (i) capital stock and (ii) paid in capital in excess of par value, excluding all commissions and marketing support fees.
Foreign Currency Translation, Transactions and Gains/Losses - Foreign currency amounts are translated into U.S. dollars on the following basis: (i) at the exchange rate on the last business day of the reporting period for the fair value of investment securities, other assets and liabilities; and (ii) at the rates of exchange prevailing on the respective recording dates for the purchase and sale of investment securities, income, expenses, gains and losses.
Net assets and fair values are presented based on the applicable foreign exchange rates described above and the Company does not isolate that portion of the results of operations resulting from changes in foreign exchange rates on investments from the fluctuations arising from changes in fair values of investments held; therefore the fluctuations related to foreign exchange rate conversion are included with the net realized gain (loss) and unrealized appreciation (depreciation) on investments.
Net realized foreign exchange gains or losses arise from activity in foreign currency forward contracts, sales of foreign currency, currency gains or losses realized between the trade and settlement dates on securities transactions, and the difference between the amounts of dividends, interest, and foreign withholding taxes recorded by the Company and the U.S. dollar equivalent of the amounts actually received or paid by the Company. Unrealized appreciation (depreciation) from currency translation for foreign currency forward contracts is included in net change in unrealized appreciation (depreciation) on derivative instruments on the condensed consolidated statements of operations. Unrealized appreciation (depreciation) from foreign currency translation for other receivables or payables is presented as net change in unrealized appreciation (depreciation) on foreign currency translation in the condensed consolidated statements of operations. Unrealized appreciation (depreciation) on foreign currency forward contracts is included with unrealized appreciation (depreciation) on derivative instruments on the condensed consolidated statements of assets and liabilities.
Management Fees - The Company accrues for the base management fee (recorded as investment advisory fees) and performance-based incentive fees, including (i) a subordinated incentive fee on income and (ii) an incentive fee on capital gains. The Company records the liability for the incentive fee on capital gains based on a hypothetical liquidation of its investment portfolio at the end of each reporting period. Therefore the accrual for incentive fee on capital gains includes the recognition of incentive fee on both net realized gains and net unrealized appreciation, if any, although any such incentive fee associated with net unrealized appreciation is neither earned nor payable to the Advisors until net unrealized appreciation is realized as net realized gains. Additionally the determination of whether the accrued incentive fee associated with net realized gains is earned and payable to the Advisors can only be made at the end of the calendar year. The two components of performance-based incentive fees are combined and expensed on the condensed consolidated statements of operations and accrued on the condensed consolidated statements of assets and liabilities as accrued performance-based incentive fees.
Organization and Offering Expenses - Organization expenses, including reimbursement payments to Advisors, are expensed on the Company’s condensed consolidated statements of operations. Continuous offering expenses, including reimbursement payments to
29
Advisors, but excluding commission and marketing support fees, are accumulated monthly and capitalized on the condensed consolidated statements of assets and liabilities as deferred offering expenses and then subsequently expensed over a 12-month period.
Earnings per Share - Earnings per share is calculated based upon the weighted average number of shares of common stock outstanding during the reporting period.
Distributions - Distributions are generally declared by the Company’s board of directors each calendar quarter and recognized as distribution liabilities on the record date. Distributions are paid monthly. The Company has adopted a distribution reinvestment plan that provides for reinvestment of distributions on behalf of shareholders. Shareholders who have elected to participate in the distribution reinvestment plan will have their cash distribution automatically reinvested in additional shares of common stock at a price per share equivalent to the public offering price on the distribution payment date, net of commissions and marketing support fees.
Federal Income Taxes - The Company has elected to be treated for federal income tax purposes, and intends to maintain its qualification as a regulated investment company (“RIC”) under Subchapter M of the Internal Revenue Code (the “Code”). Generally, a RIC is not subject to federal income taxes on distributed income and gains if it distributes at least 90% of “Investment Company Taxable Income,” as defined in the Code. The Company intends to distribute sufficient dividends to maintain its RIC status each year and it does not anticipate paying a material level of federal income taxes in the future.
The Company is also generally subject to nondeductible federal excise taxes if it does not distribute an amount at least equal to the sum (i) 98% of net ordinary income, (ii) 98.2% of the Company’s capital gains in excess of capital losses for the one-year period generally ending on October 31 of the calendar year and (iii) any ordinary income and net capital gains for preceding years that were not distributed during such years and on which the Company paid no federal income tax. The Company, at its discretion, may carry forward taxable income in excess of calendar year distributions and pay a 4% excise tax on this excess taxable income.
The Company recognizes in its condensed consolidated financial statements the effect of a tax position when it is more likely than not, based on the technical merits, that the position will be sustained upon examination. Tax benefits of positions not deemed to meet the more-likely-than-not threshold would be recorded as a tax expense in the current year. The Company did not have any uncertain tax positions that met the recognition or measurement criteria of ASC 740-10-25, Income Taxes – Overall –Recognition, nor did it have any unrecognized tax benefits as of the periods presented herein. Although the Company files federal and state tax returns, its major tax jurisdiction is federal.
Book and tax basis differences relating to permanent book and tax differences are reclassified among the Company’s capital accounts, as appropriate at year-end. Additionally, the tax character of distributions is determined in accordance with the Code which differs from GAAP.
Recent Accounting Pronouncements - In January 2013, the FASB clarified the scope of offsetting disclosure requirements which require an entity to disclose information about offsetting and related arrangements to enable users of its financial statements to evaluate the effect or potential effect of netting arrangements on an entity’s financial position, including the effect or potential effect of rights of setoff associated with certain financial instruments and derivative instruments. The guidance is effective for fiscal years beginning on or after January 1, 2013, and interim periods within those annual periods, with retrospective disclosures required for all comparative periods presented. The guidance did not have a material impact on the condensed consolidated financial statements.
| 3. | Investments |
The Company is engaged in a strategy to invest primarily in the debt of privately owned U.S. companies. The primary investment concentrations include (i) senior debt securities and (ii) subordinated debt securities. The fair value of senior and subordinated debt investments will generally fluctuate with, among other things, changes in prevailing interest rates, the general supply of, and demand for, debt capital among private and public companies, general domestic and global economic conditions, the condition of certain financial markets, developments or trends in any particular industry and changes in the financial condition and credit quality of each security’s issuer.
30
Investment purchases, sales and principal payments/paydowns are summarized below for the three and nine months ended September 30, 2013 and 2012, respectively. These purchase and sale amounts exclude short-term investments (i.e. money market fund investments) and derivative instruments.
| Three Months Ended September 30, |
Nine Months Ended September 30, |
|||||||||||||||
| 2013 | 2012 | 2013 | 2012 | |||||||||||||
| Investment purchases, at cost |
$ | 658,024 | $ | 253,861 | $ | 1,443,232 | $ | 598,362 | ||||||||
| Investment sales, proceeds |
133,874 | 61,376 | 422,376 | 100,188 | ||||||||||||
| Principal payments/paydown proceeds |
18,333 | 6,922 | 78,029 | 16,323 | ||||||||||||
The Company’s investment portfolio may contain debt investments that are in the form of lines of credit, unfunded delayed draw loan commitments, or revolving credit facilities which require the Company to provide funding when requested by portfolio companies in accordance with the terms of the underlying loan agreements. As of September 30, 2013, the Company’s unfunded loan commitments amounted to $69,342. The Company maintains sufficient liquidity in the form of cash, short term investments, short term receivables and/or borrowing capacity under its credit facilities to fund such unfunded loan commitments should the need arise.
As of September 30, 2013, debt investments on non-accrual status represented 0.9% and 0.7% of total investments on a cost and fair value basis, respectively.
As of September 30, 2013, the Company’s investment portfolio consisted of the following:
| Percentage of | Percentage of | |||||||||||||||
| Asset Category | Cost | Fair Value | Portfolio | Net Assets | ||||||||||||
| Senior debt securities |
$ | 1,182,583 | $ | 1,198,582 | 71.9 | % | 95.2 | % | ||||||||
| Subordinated debt securities |
438,696 | 446,804 | 26.8 | 35.5 | ||||||||||||
|
|
|
|
|
|
|
|
|
|||||||||
| Total debt securities |
1,621,279 | 1,645,386 | 98.7 | 130.7 | ||||||||||||
| Common stock |
449 | 690 | 0.1 | 0.1 | ||||||||||||
| Equity options |
20,013 | 19,987 | 1.2 | 1.6 | ||||||||||||
|
|
|
|
|
|
|
|
|
|||||||||
| Total equity securities |
20,462 | 20,677 | 1.3 | 1.7 | ||||||||||||
|
|
|
|
|
|
|
|
|
|||||||||
| Subtotal |
1,641,741 | 1,666,063 | 100.0 | % | 132.4 | |||||||||||
|
|
|
|||||||||||||||
| Short term investments |
8,703 | 8,703 | 0.7 | |||||||||||||
|
|
|
|
|
|
|
|||||||||||
| Total investments |
$ | 1,650,444 | $ | 1,674,766 | 133.1 | % | ||||||||||
|
|
|
|
|
|
|
|||||||||||
As of December 31, 2012, the Company’s investment portfolio consisted of the following:
| Percentage of | Percentage of | |||||||||||||||
| Asset Category | Cost | Fair Value | Portfolio | Net Assets | ||||||||||||
| Senior debt securities |
$ | 519,196 | $ | 522,443 | 74.9 | % | 85.4 | % | ||||||||
| Subordinated debt securities |
166,981 | 169,788 | 24.3 | 27.8 | ||||||||||||
|
|
|
|
|
|
|
|
|
|||||||||
| Total debt securities |
686,177 | 692,231 | 99.2 | 113.2 | ||||||||||||
| Common stock |
449 | 453 | 0.1 | 0.1 | ||||||||||||
| Preferred stock |
4,801 | 4,984 | 0.7 | 0.8 | ||||||||||||
|
|
|
|
|
|
|
|
|
|||||||||
| Total equity securities |
5,250 | 5,437 | 0.8 | 0.9 | ||||||||||||
|
|
|
|
|
|
|
|
|
|||||||||
| Subtotal |
691,427 | 697,668 | 100.0 | % | 114.1 | |||||||||||
|
|
|
|||||||||||||||
| Short term investments |
13,203 | 13,203 | 2.2 | |||||||||||||
|
|
|
|
|
|
|
|||||||||||
| Total investments |
$ | 704,630 | $ | 710,871 | 116.3 | % | ||||||||||
|
|
|
|
|
|
|
|||||||||||
31
The industry composition, geographic dispersion, and local currencies of the Company’s investment portfolio at fair value, excluding short-term investments and derivative instruments, as of September 30, 2013 and December 31, 2012 was as follows:
| Industry Composition |
September 30, 2013 | December 31, 2012 | ||||||
| Consumer Durables & Apparel |
13.5 | % | 1.0 | % | ||||
| Retailing |
12.2 | 9.2 | ||||||
| Software & Services |
10.8 | 9.1 | ||||||
| Capital Goods |
7.9 | 13.7 | ||||||
| Media |
7.3 | 11.0 | ||||||
| Health Care Equipment & Services |
7.2 | 6.2 | ||||||
| Materials |
6.9 | 9.9 | ||||||
| Insurance |
6.9 | 6.2 | ||||||
| Technology Hardware & Equipment |
6.8 | 7.8 | ||||||
| Food, Beverage & Tobacco |
5.8 | 1.3 | ||||||
| Energy |
3.7 | 0.9 | ||||||
| Telecommunication Services |
3.4 | 4.1 | ||||||
| Food & Staples Retailing |
2.1 | 1.9 | ||||||
| Remaining Industries |
5.5 | 17.7 | ||||||
|
|
|
|
|
|||||
| Total |
100.0 | % | 100.0 | % | ||||
|
|
|
|
|
|||||
| Geographic Dispersion (1) |
||||||||
| United States |
79.7 | % | 94.4 | % | ||||
| Luxembourg |
10.9 | 1.3 | ||||||
| Netherlands |
3.7 | — | ||||||
| United Kingdom |
3.0 | 2.2 | ||||||
| Remaining Countries |
2.7 | 2.1 | ||||||
|
|
|
|
|
|||||
| Total |
100.0 | % | 100.0 | % | ||||
|
|
|
|
|
|||||
| Local Currency |
||||||||
| U.S. Dollar |
88.4 | % | 97.3 | % | ||||
| Euro |
5.9 | 1.7 | ||||||
| British Pound Sterling |
2.3 | 1.0 | ||||||
| New Zealand Dollar |
2.2 | - | ||||||
| Swedish Krona |
1.2 | - | ||||||
|
|
|
|
|
|||||
| Total |
100.0 | % | 100.0 | % | ||||
|
|
|
|
|
|||||
| (1) | The geographic dispersion is determined by the portfolio company’s country of domicile or the foreign jurisdiction of the security issuer. |
During the nine months ended September 30, 2013, the Company did not hold any non-controlled investments where it owned 5% or more of a portfolio company’s outstanding voting securities as investments in “affiliated” companies. In addition, the Company did not hold any investments in “controlled” companies where it owned more than 25% of a portfolio company’s outstanding voting securities.
| 4. | Derivative Instruments |
The following is a summary of the fair value and location of the Company’s derivative instruments on the condensed consolidated statements of assets and liabilities:
| Fair Value | ||||||||||
| Derivative Instrument | Statement Location | September 30, 2013 | December 31, 2012 | |||||||
|
|
|
|
|
|
||||||
| Foreign currency forward contracts | Unrealized appreciation (depreciation) on derivative instruments | $ | (3,093 | ) | $ | (147 | ) | |||
| TRS | Unrealized appreciation on derivative instruments | 838 | 1,349 | |||||||
|
|
|
|
|
|||||||
| Total |
$ | (2,255 | ) | $ | 1,202 | |||||
|
|
|
|
|
|||||||
32
Realized and unrealized gains and losses on derivative instruments recorded by the Company for the three and nine months ended September 30, 2013 are in the following location on the condensed consolidated statements of operations:
| Realized Gain (Loss) | ||||||||||
| Derivative Instrument | Statement Location | Three Months Ended September 30, 2013 |
Nine Months Ended September 30, 2013 |
|||||||
|
|
|
|
|
|
|
|||||
| Foreign currency forward contracts |
Net realized loss on derivative instruments |
$ | (316 | ) | $ | (191 | ) | |||
| TRS |
Net realized gain on derivative instruments |
7,314 | 9,839 | |||||||
|
|
|
|
|
|||||||
| Total |
$ | 6,998 | $ | 9,648 | ||||||
|
|
|
|
|
|||||||
| Unrealized Gain (Loss) | ||||||||||
| Derivative Instrument | Statement Location | Three Months Ended September 30, 2013 |
Nine Months Ended September 30, 2013 |
|||||||
|
|
|
|
|
|
|
|||||
| Foreign currency forward contracts |
Net change in unrealized depreciation on derivative instruments |
$ | (4,343 | ) | $ | (2,946 | ) | |||
| TRS |
Net change in unrealized depreciation on derivative instruments |
(5,120 | ) | (511 | ) | |||||
|
|
|
|
|
|||||||
| Total |
$ | (9,463 | ) | $ | (3,457 | ) | ||||
|
|
|
|
|
|||||||
There were no realized gains or losses on derivative instruments during the three or nine months ended September 30, 2012. Unrealized gains and losses on derivative instruments recorded by the Company for the three and nine months ended September 30, 2012 are in the following location on the condensed consolidated statements of operations:
| Unrealized Gain (Loss) | ||||||||||
| Derivative Instrument | Statement Location | Three Months Ended September 30, 2012 |
Nine Months Ended September 30, 2012 |
|||||||
|
|
|
|
|
|
|
|||||
| Foreign currency forward contracts |
Net change in unrealized appreciation (depreciation) on derivative instruments |
$ | (138 | ) | $ | (211 | ) | |||
|
|
|
|
|
|||||||
| Total |
$ | (138 | ) | $ | (211 | ) | ||||
|
|
|
|
|
|||||||
Foreign Currency Forward Contracts:
The Company may enter into foreign currency forward contracts from time to time to facilitate settlement of purchases and sales of investments denominated in foreign currencies and to economically hedge the impact that an adverse change in foreign exchange rates would have on the value of the Company’s investments denominated in foreign currencies. A foreign currency forward contract is a commitment to purchase or sell a foreign currency at a future date at a negotiated forward rate. These contracts are marked-to-market by recognizing the difference between the contract exchange rate and the current market exchange rate as unrealized appreciation or depreciation. Realized gains or losses are recognized when forward contracts are settled. Risks may arise as a result of the potential inability of the counterparties to meet the terms of their contracts; the Company attempts to limit counterparty risk by only dealing with well known counterparties.
At September 30, 2013, the details of the Company’s open foreign currency forward contracts were as follows:
| Amount and | US$ Value at | US$ Value at | Unrealized | |||||||||||||||||
| Foreign Currency |
Settlement Date | Transaction | Settlement Date | September 30, 2013 | Depreciation | |||||||||||||||
| EUR | Jan. 14, 2014 | € | 2,100 Sold | $ | 2,745 | $ | 2,842 | $ | (97) | |||||||||||
| EUR | Jan. 10, 2014 | € | 8,100 Sold | 10,747 | 10,961 | (214) | ||||||||||||||
| GBP | Jan. 10, 2014 | £ | 15,100 Sold | 23,701 | 24,428 | (727) | ||||||||||||||
| GBP | Jan. 10, 2014 | £ | 8,498 Sold | 13,484 | 13,747 | (263) | ||||||||||||||
| NZD | Oct. 29, 2013 | N$ | 44,833 Sold | 35,376 | 37,168 | (1,792) | ||||||||||||||
|
|
|
|
|
|
|
|||||||||||||||
| Total | $ | 86,053 | $ | 89,146 | $ | (3,093) | ||||||||||||||
|
|
|
|
|
|
|
|||||||||||||||
At December 31, 2012, the details of the Company’s open foreign currency forward contracts were as follows:
33
| Amount and | US$ Value at | US$ Value at | Unrealized | |||||||||||||||||
| Foreign Currency | Settlement Date | Transaction | Settlement Date | December 31, 2012 | Appreciation | |||||||||||||||
| EUR | Jan. 3, 2013 | € | 2,300 Sold | $ | 2,918 | $ | 3,036 | $ | (118) | |||||||||||
| EUR | Jan. 31, 2013 | € | 6,242 Sold | 8,249 | 8,240 | 9 | ||||||||||||||
| GBP | Jan. 18, 2013 | £ | 4,255 Sold | 6,874 | 6,912 | (38) | ||||||||||||||
|
|
|
|
|
|
|
|||||||||||||||
| Total | $ | 18,041 | $ | 18,188 | $ | (147) | ||||||||||||||
|
|
|
|
|
|
|
|||||||||||||||
Options:
The Company holds equity options in certain portfolio companies to enhance investment returns in connection with its primary lending activities. In purchasing options, the Company bears the risk of an unfavorable change in the value of the underlying equity interest. The aggregate fair value of options as of September 30, 2013 represents 1.6% of the Company’s net assets. The Company did not hold any equity options as of December 31, 2012.
Total Return Swaps:
On November 15, 2012, Halifax Funding entered into the TRS with the Bank of Nova Scotia (“BNS” or “counterparty”).
The TRS arrangement with BNS consists of a set of TRS agreements. Pursuant to the terms of the TRS, Halifax Funding may select a portfolio of single-name corporate loans and/or bonds (each a “TRS reference asset” and together the “TRS reference assets”) with a maximum aggregate notional amount of $500,000. Under the terms of the TRS agreements, each TRS reference asset included in the TRS portfolio constitutes a separate total return swap transaction, although all calculations, payments and transfers required to be made under the TRS agreements are calculated and treated on an aggregate basis, based upon all such transactions.
Halifax Funding receives quarterly from BNS (i) all collected interest and fees generated by TRS reference assets and (ii) realized gains from the sale or repayment of TRS reference assets, if any. Halifax Funding pays to BNS (i) interest on the TRS settled notional amount at a rate equal to the three-month LIBOR+0.80% per annum if the initial investment amount (i.e. posted collateral) equals or exceeds 50% of the TRS trade basis notional amount, or three-month LIBOR+1.00% if the initial investment amount is less than 50% of the TRS trade basis notional amount and (ii) realized losses, if any. In addition, upon the termination of the TRS arrangement, Halifax Funding will either receive from BNS any net realized gain, or pay to BNS any net realized loss, in the liquidation of TRS reference assets.
Halifax Funding posts collateral in the form of certificates of deposit held by a custodian. Generally, the required collateral amount is at least 40% of the notional amount of each TRS reference asset at the time that such TRS reference asset is confirmed for acquisition by the counterparty. Halifax Funding may be required to post additional collateral, on a dollar-for-dollar basis, in the event of depreciation in the value of TRS reference assets after such value decreases below a specified amount. Halifax Funding is required to post additional collateral to ensure that the collateral market value, as solely determined by BNS, is at least equal to 25% of the value of the TRS portfolio.
The obligations of Halifax Funding under the TRS agreements are non-recourse to the Company and the Company’s exposure to the TRS is limited to the amount of collateral that is posted pursuant to the terms of the TRS agreements. The Company has no contractual obligation to post any collateral or to make any interest payments to BNS. The Company may, but is not obligated to, increase its equity investment in Halifax Funding for the purpose of funding additional collateral or payment obligations for which Halifax Funding may become obligated during the term of the TRS agreements. If the Company does not make any such additional equity investment in Halifax Funding and Halifax Funding fails to meet its obligations under the TRS agreements, then BNS will have the right to terminate the TRS and use the collateral posted by Halifax Funding with the custodian to offset any amount owed to BNS. The Company may terminate the TRS at any time upon providing at least 30 days notice prior to the proposed settlement date of the TRS reference assets related to such termination. In the event of an early termination of the TRS, Halifax Funding would be required to pay an early termination fee based on the maximum spread amount to be earned by BNS over the life of the TRS Agreements. Halifax Funding would have been required to pay an early termination fee of $5,694 if the TRS had been terminated as of September 30, 2013. In the absence of an early termination as just described, the TRS will terminate on January 15, 2016.
As of September 30, 2013, Halifax Funding had selected 24 underlying debt positions with a total notional amount of $58,502 and had posted $55,021 in collateral, which is recorded as collateral on deposit with custodian on the condensed consolidated statements of assets and liabilities. The TRS settled notional amount as of September 30, 2013 was $58,836. The settled notional amount as of September 30, 2013 includes unsettled deletions of reference assets of $334.
As of December 31, 2012, Halifax Funding had selected 54 underlying debt positions with a total notional amount of $164,012 and had posted $87,974 in collateral, which is recorded as collateral on deposit with custodian on the condensed consolidated statements of assets and liabilities. The TRS settled notional amount as of December 31, 2012 was $105,014.
34
The following table summarizes the fair value components of the TRS portfolio as of September 30, 2013 and December 31, 2012, as determined by the Company’s board of directors:
| September 30, 2013 | December 31, 2012 | |||||||
| Spread interest income |
$ | 1,668 | $ | 938 | ||||
| Net realized loss |
(249 | ) | (345 | ) | ||||
| Net unrealized appreciation (depreciation) of reference assets |
(581 | ) | 756 | |||||
|
|
|
|
|
|||||
| TRS Total fair value |
$
|
838
|
|
$
|
1,349
|
| ||
|
|
|
|
|
|||||
The following is a summary of the TRS reference assets as of September 30, 2013:
| Company (a) | Industry | Investment | Interest Rate |
LIBOR Floor |
Maturity Date |
Notional Amount |
Fair Value |
Unrealized Appreciation (Depreciation) |
||||||||||||||||
| American Rock Salt Co., LLC |
Materials | Senior Debt | L + 425 | 1.25 | % | 4/25/2017 | $ | 3,720 | $ | 3,730 | $ 10 | |||||||||||||
| Avaya, Inc. |
Technology Hardware & Equipment | Senior Debt | L + 675 | 1.25 | % | 3/31/2018 | 2,580 | 2,464 | (116 | ) | ||||||||||||||
| Bon-Ton Department Stores, Inc. |
Retailing | Senior Debt (b) | 8.00% | 6/15/2021 | 3,777 | 3,535 | (242 | ) | ||||||||||||||||
| Builders FirstSource, Inc. |
Capital Goods | Senior Debt (b) | 7.63% | 6/1/2021 | 2,649 | 2,656 | 7 | |||||||||||||||||
| Cequel Communications Holdings, LLC |
Media | Subordinated Debt | 5.13% | 12/15/2021 | 3,007 | 2,812 | (195 | ) | ||||||||||||||||
| Ceridian Corp. |
Commercial & Professional Services | Senior Debt | 8.88% | 7/15/2019 | 4,456 | 4,555 | 99 | |||||||||||||||||
| Clearwater Paper Corp. |
Materials | Subordinated Debt (b) | 4.50% | 2/1/2023 | 1,587 | 1,412 | (175 | ) | ||||||||||||||||
| Commscope, Inc. |
Technology Hardware & Equipment | Subordinated Debt | 6.63% or 7.38% PIK |
6/1/2020 | 3,908 | 3,883 | (25 | ) | ||||||||||||||||
| Continental Building Products, LLC |
Materials | Senior Debt | L + 350 | 1.00 | % | 8/28/2020 | 1,990 | 1,996 | 6 | |||||||||||||||
| Heartland Dental Care, LLC |
Pharmaceuticals, Biotechnology & Life Sciences | Senior Debt | L + 500 | 1.25 | % | 12/21/2018 | 5,974 | 6,028 | 54 | |||||||||||||||
| Internet Brands, Inc. |
Media | Senior Debt | L + 500 | 1.25 | % | 3/18/2019 | 117 | 115 | (2 | ) | ||||||||||||||
| IPC Systems, Inc. |
Technology Hardware & Equipment | Senior Debt | L + 650 | 1.25 | % | 7/31/2017 | 2,971 | 3,002 | 31 | |||||||||||||||
| Maxim Crane L.P. |
Capital Goods | Senior Debt | 12.25% | 4/15/2015 | 1,309 | 1,285 | (24 | ) | ||||||||||||||||
| Misys Ltd. |
Software & Services | Senior Debt (b) | 12.00% | 6/12/2019 | 2,898 | 3,223 | 325 | |||||||||||||||||
| Misys Ltd. |
Software & Services | Senior Debt (b) | L + 400 | 1.00 | % | 5/30/2018 | 1,408 | 1,379 | (29 | ) | ||||||||||||||
| Neenah Paper, Inc. |
Materials | Subordinated Debt (b) | 5.25% | 5/15/2021 | 2,227 | 2,121 | (106 | ) | ||||||||||||||||
| NEP Group, Inc. |
Media | Senior Debt | L + 825 | 1.25 | % | 7/22/2020 | 1,315 | 1,352 | 37 | |||||||||||||||
| RedPrairie Corp. |
Software & Services | Senior Debt | L + 550 | 1.25 | % | 12/21/2018 | 1,070 | 1,098 | 28 | |||||||||||||||
| RedPrairie Corp. |
Software & Services | Senior Debt | L + 1000 | 1.25 | % | 12/21/2019 | 1,830 | 1,732 | (98 | ) | ||||||||||||||
| Sanmina Corp. |
Technology Hardware & Equipment | Subordinated Debt (b) | 7.00% | 5/15/2019 | 472 | 481 | 9 | |||||||||||||||||
| Select Medical Corp. |
Health Care Equipment & Services | Subordinated Debt (b) | 6.38% | 6/1/2021 | 2,674 | 2,527 | (147 | ) | ||||||||||||||||
| Summit Materials, LLC |
Materials | Subordinated Debt | 10.50% | 1/31/2020 | 585 | 611 | 26 | |||||||||||||||||
| The TelX Group, Inc. |
Telecommunication Services | Senior Debt | L + 500 | 1.25 | % | 9/25/2017 | 4,950 | 4,887 | (63 | ) | ||||||||||||||
| Travelport, LLC |
Software & Services | Senior Debt | L + 500 | 1.25 | % | 6/26/2019 | 1,028 | 1,037 | 9 | |||||||||||||||
| Total |
$ | 58,502 | $ | 57,921 | $(581 | ) | ||||||||||||||||||
|
|
|
|||||||||||||||||||||||
(a) Security may be an obligation of one or more entities affiliated with the named company.
(b) The investment is not a qualifying asset as defined in Section 55(a) under the 1940 Act.
(c) Reference asset position or portion thereof unsettled as of September 30, 2013.
35
The following is a summary of the TRS reference assets as of December 31, 2012:
| Company (a) | Industry | Investment | Interest Rate |
LIBOR Floor |
Maturity Date |
Notional Amount |
Fair Value |
Unrealized Appreciation (Depreciation) |
||||||||||||||||
| Block Communications, Inc. |
Media | Subordinated Debt | 7.25% | 2/1/2020 | $ | 114 | $ | 114 | $ | - | ||||||||||||||
| California Pizza Kitchen, Inc. |
Food & Staples Retailing | Senior Debt | L+550 | 1.25 | % | 7/7/2017 | 4,263 | 4,241 | (22) | |||||||||||||||
| Camp International Holding Co. |
Software & Services | Senior Debt | L+400 | 1.25 | % | 5/31/2019 | 2,173 | 2,172 | (1) | |||||||||||||||
| Catalina Marketing Corp. |
Media | Subordinated Debt | 10.50% | 10/1/2015 | 7,000 | 6,871 | (129) | |||||||||||||||||
| CCC Information Services, Inc. |
Software & Services | Senior Debt (c) | L+470 | 1.25 | % | 12/14/2019 | 1,510 | 1,521 | 11 | |||||||||||||||
| Charter Communications Operating, LLC |
Media | Subordinated Debt (b) | 7.25% | 10/30/2017 | 625 | 622 | (3) | |||||||||||||||||
| CHG Companies, Inc. |
Health Care Equipment & Services | Senior Debt (c) | L+375 | 1.25 | % | 11/19/2019 | 6,913 | 6,971 | 58 | |||||||||||||||
| Clear Channel Communications, Inc. |
Media | Subordinated Debt (b) | 6.50% | 11/15/2022 | 2,236 | 2,342 | 106 | |||||||||||||||||
| Clear Channel Communications, Inc. |
Media | Subordinated Debt (b) | 6.50% | 11/15/2022 | 6,111 | 6,411 | 300 | |||||||||||||||||
| Continental Airlines, Inc. |
Transportation | Senior Debt (b) | 8.31% | 10/2/2019 | 605 | 569 | (36) | |||||||||||||||||
| First American Payment Systems, LP |
Software & Services | Senior Debt | L+450 | 1.25 | % | 10/12/2018 | 8,950 | 8,914 | (36) | |||||||||||||||
| FleetPride Corp. |
Capital Goods | Senior Debt (c) | L+400 | 1.25 | % | 11/19/2019 | 4,522 | 4,518 | (4) | |||||||||||||||
| Fly Leasing, Ltd. |
Transportation | Senior Debt (b)(c) | L+450 | 1.25 | % | 8/8/2018 | 4,193 | 4,177 | (16) | |||||||||||||||
| GCI Inc. |
Telecommunication Services | Subordinated Debt | 6.75% | 6/1/2021 | 6,644 | 6,577 | (67) | |||||||||||||||||
| Gymboree Corporation |
Retailing | Senior Debt | L+350 | 1.50 | % | 2/23/2018 | 4,097 | 3,885 | (212) | |||||||||||||||
| Hamilton Sundstrand Industrial |
Capital Goods | Senior Debt | L+375 | 1.25 | % | 12/13/2019 | 7,920 | 8,060 | 140 | |||||||||||||||
| Heartland Dental Care |
Pharmaceuticals, Biotechnology & Life Sciences | Senior Debt (c) | L+500 | 1.25 | % | 12/21/2018 | 4,203 | 4,203 | - | |||||||||||||||
| Hilcorp Energy I LP |
Energy | Subordinated Debt (b) | 8.00% | 2/15/2020 | 1,817 | 1,808 | (9) | |||||||||||||||||
| Hubbard Radio, LLC |
Media | Senior Debt (c) | L+375 | 1.50 | % | 4/28/2017 | 494 | 495 | 1 | |||||||||||||||
| Husky Injection Molding Systems, Ltd. |
Capital Goods | Senior Debt (b)(c) | L+450 | 1.25 | % | 7/2/2018 | 1,256 | 1,249 | (7) | |||||||||||||||
| Immucor, Inc. |
Health Care Equipment & Services | Senior Debt (c) | L+450 | 1.25 | % | 8/19/2018 | 48 | 48 | - | |||||||||||||||
| IPC Systems, Inc. |
Technology Hardware & Equipment | Senior Debt | L+650 | 7/31/2017 | 3,951 | 3,898 | (53) | |||||||||||||||||
| Jo-Ann Stores, Inc. |
Retailing | Senior Debt (c) | L+350 | 1.25 | % | 3/16/2018 | 23 | 23 | - | |||||||||||||||
| Kinetic Concepts, Inc. |
Health Care Equipment & Services |
Senior Debt (c) | L+425 | 1.25 | % | 5/4/2018 | 1,971 | 1,971 | - | |||||||||||||||
| Kinetic Concepts, Inc. |
Health Care Equipment & Services |
Senior Debt (c) | L+375 | 1.25 | % | 11/4/2016 | 1,313 | 1,312 | (1) | |||||||||||||||
| Local TV Finance, LLC |
Media | Senior Debt (c) | L+400 | 5/7/2015 | 372 | 370 | (2) | |||||||||||||||||
| Lord & Taylor Holdings, LLC |
Retailing | Senior Debt (c) | L+450 | 1.25 | % | 1/11/2019 | 34 | 34 | - | |||||||||||||||
| MedAssets, Inc. |
Health Care Equipment & Services | Senior Debt (b) | L+275 | 1.25 | % | 12/13/2019 | 2,341 | 2,347 | 6 | |||||||||||||||
| MGM Resorts International |
Consumer Services | Senior Debt (b) | L+325 | 1.00 | % | 12/20/2019 | 7,231 | 7,340 | 109 | |||||||||||||||
| Misys PLC |
Software & Services | Senior Debt (b) | 12.00% | 6/12/2019 | 5,982 | 5,979 | (3) | |||||||||||||||||
| NPC International, Inc. |
Consumer Services | Senior Debt (c) | L+325 | 1.25 | % | 12/28/2018 | 1,636 | 1,624 | (12) | |||||||||||||||
| NuSil Technology LLC |
Materials | Senior Debt (c) | L+375 | 1.25 | % | 4/7/2017 | 502 | 501 | (1) | |||||||||||||||
| Nuveen Investments, Inc. |
Diversified Financials | Senior Debt (b)(c) | L+550 | 5/13/2017 | 7,059 | 7,065 | 6 | |||||||||||||||||
| Nuveen Investments, Inc. |
Diversified Financials | Senior Debt (b) | L+600 | 1.25 | % | 5/13/2017 | 285 | 283 | (2) | |||||||||||||||
| Nuveen Investments, Inc. |
Diversified Financials | Senior Debt (b) | L+550 | 5/13/2017 | 26 | 26 | - | |||||||||||||||||
| PQ Corp. |
Materials | Senior Debt | L+425 | 1.25 | % | 5/8/2017 | 5,582 | 5,588 | 6 | |||||||||||||||
| PVH Corp. |
Consumer Durables & Apparel | Senior Debt (b)(c) | L+250 | 0.75 | % | 12/19/2019 | 1,473 | 1,488 | 15 | |||||||||||||||
| RedPrairie Corp. |
Software & Services | Senior Debt (c) | L+550 | 1.25 | % | 12/21/2018 | 1,078 | 1,097 | 19 | |||||||||||||||
| Roofing Supply Group, LLC |
Retailing | Senior Debt (c) | L+375 | 1.25 | % | 5/31/2019 | 90 | 90 | - | |||||||||||||||
| Sabre, Inc. |
Transportation | Senior Debt (c) | L+575 | 12/29/2017 | 4,399 | 4,397 | (2) | |||||||||||||||||
| Sabre, Inc. |
Transportation | Senior Debt (c) | L+600 | 1.25 | % | 12/29/2017 | 2,212 | 2,212 | - | |||||||||||||||
| Savers, Inc. |
Retailing | Senior Debt (c) | L+375 | 1.25 | % | 7/9/2019 | 205 | 205 | - | |||||||||||||||
| Scitor Corp. |
Capital Goods | Senior Debt (c) | L+350 | 1.50 | % | 2/15/2017 | 22 | 22 | - | |||||||||||||||
| SGS International, Inc. |
Media | Senior Debt | L+375 | 1.25 | % | 10/17/2019 | 5,515 | 5,543 | 28 | |||||||||||||||
| Skilled Healthcare Group, Inc. |
Health Care Equipment & Services | Senior Debt (b) | L+525 | 1.50 | % | 4/9/2016 | 15 | 15 | - | |||||||||||||||
| Spectrum Brands, Inc. |
Household & Personal Products | Senior Debt (b) | L+325 | 1.25 | % | 12/17/2019 | 1,525 | 1,552 | 27 | |||||||||||||||
| Tempur-Pedic International, Inc. |
Commercial & Professional Services | Senior Debt (b)(c) | L+400 | 1.00 | % | 11/14/2019 | 6,852 | 7,000 | 148 | |||||||||||||||
| Terex Corp. |
Capital Goods | Subordinated Debt (b) | 6.00% | 5/15/2021 | 4,626 | 4,857 | 231 | |||||||||||||||||
| The TelX Group, Inc. |
Telecommunication Services | Senior Debt (c) | L+500 | 1.25 | % | 9/23/2017 | 7,019 | 6,999 | (20) | |||||||||||||||
| Tomkins Air Distribution |
Capital Goods | Senior Debt | L+375 | 1.25 | % | 11/9/2018 | 5,949 | 6,058 | 109 | |||||||||||||||
| USI Holdings Corp. |
Insurance | Subordinated Debt | 7.75% | 1/15/2021 | 1,076 | 1,063 | (13) | |||||||||||||||||
| USI Holdings Corp. |
Insurance | Senior Debt (c) | L+400 | 1.25 | % | 12/27/2019 | 1,919 | 1,940 | 21 | |||||||||||||||
| West Corp. |
Software & Services | Subordinated Debt | 8.63% | 10/1/2018 | 6,030 | 6,096 | 66 | |||||||||||||||||
| West Corp. |
Software & Services | Senior Debt (c) | L+425 | 1.25 | % | 7/15/2016 | 5 | 5 | - | |||||||||||||||
|
|
|
|||||||||||||||||||||||
| Total |
$ | 164,012 | $ | 164,768 | $ | 756 | ||||||||||||||||||
|
|
|
|||||||||||||||||||||||
| (a) | Security may be an obligation of one or more entities affiliated with the named company. |
| (b) | The investment is not a qualifying asset as defined in Section 55(a) under the 1940 Act. |
| (c) | Reference asset position or portion thereof unsettled as of December 31, 2012. |
36
| 5. | Fair Value of Financial Instruments |
The Company’s investments were categorized in the fair value hierarchy as follows as of September 30, 2013 and December 31, 2012:
| September 30, 2013 | ||||||||||||||||
|
Description |
Level 1 | Level 2 | Level 3 | Total | ||||||||||||
| Senior debt securities |
$ | — | $ | 800,391 | $ | 398,191 | $ | 1,198,582 | ||||||||
| Subordinated debt securities |
— | 311,121 | 135,683 | 446,804 | ||||||||||||
| Common stock |
— | — | 690 | 690 | ||||||||||||
| Equity Options |
— | — | 19,987 | 19,987 | ||||||||||||
|
|
|
|
|
|
|
|
|
|||||||||
| Subtotal |
— | 1,111,512 | 554,551 | 1,666,063 | ||||||||||||
| Short term investments |
8,703 | — | — | 8,703 | ||||||||||||
|
|
|
|
|
|
|
|
|
|||||||||
| Total investments |
$ | 8,703 | $ | 1,111,512 | $ | 554,551 | $ | 1,674,766 | ||||||||
|
|
|
|
|
|
|
|
|
|||||||||
| Derivative Type |
Level 1 | Level 2 | Level 3 | Total | ||||||||||||
| Assets |
||||||||||||||||
| Total return swaps |
$ | — | $ | — | $ | 838 | $ | 838 | ||||||||
| Liabilities |
||||||||||||||||
| Foreign currency forward contracts |
— | (3,093 | ) | — | (3,093 | ) | ||||||||||
|
|
|
|
|
|
|
|
|
|||||||||
| Total |
$ | — | $ | (3,093 | ) | $ | 838 | $ | (2,255 | ) | ||||||
|
|
|
|
|
|
|
|
|
|||||||||
| December 31, 2012 | ||||||||||||||||
|
Description |
Level 1 | Level 2 | Level 3 | Total | ||||||||||||
| Senior debt securities |
$ | — | $ | 435,852 | $ | 86,591 | $ | 522,443 | ||||||||
| Subordinated debt securities |
— | 163,580 | 6,209 | 169,789 | ||||||||||||
| Common stock |
— | — | 453 | 453 | ||||||||||||
| Preferred stock |
4,984 | — | — | 4,984 | ||||||||||||
|
|
|
|
|
|
|
|
|
|||||||||
| Subtotal |
4,984 | 599,432 | 93,253 | 697,669 | ||||||||||||
| Short term investments |
13,202 | — | — | 13,202 | ||||||||||||
|
|
|
|
|
|
|
|
|
|||||||||
| Total investments |
$ | 18,186 | $ | 599,432 | $ | 93,253 | $ | 710,871 | ||||||||
|
|
|
|
|
|
|
|
|
|||||||||
|
Derivative Type |
Level 1 | Level 2 | Level 3 | Total | ||||||||||||
| Assets |
||||||||||||||||
| Foreign currency forward contracts |
$ | — | $ | 9 | $ | — | $ | 9 | ||||||||
| Total return swaps |
— | — | 1,349 | 1,349 | ||||||||||||
| Liabilities |
||||||||||||||||
| Foreign currency forward contracts |
— | (156 | ) | — | (156 | ) | ||||||||||
|
|
|
|
|
|
|
|
|
|||||||||
| Total |
$ | — | $ | (147 | ) | $ | 1,349 | $ | 1,202 | |||||||
|
|
|
|
|
|
|
|
|
|||||||||
At September 30, 2013, the Company held 21 distinct investment positions that were classified as Level 3, representing an aggregate fair value of $554,551 and 33.1% of the total investment portfolio. The ranges of unobservable inputs used in the fair value measurement of the Company’s Level 3 investments as of September 30, 2013 were as follows:
| Asset Group | Fair Value (1) | Valuation Techniques (2) | Unobservable Inputs | Range (Weighted Average) (3) | Impact to Valuation from an Increase in Input (4) | |||||||
| Senior Debt |
$ | 398,191 | Discounted Cash Flow | Discount Rate | 6.84% –12.93% (10.21%) | Decrease | ||||||
| Market Yield | 5.89% – 9.29% (7.68%) | Decrease | ||||||||||
| Yield Premium | 0.00% – 4.00% (2.05%) | Decrease | ||||||||||
| Weighted Average Cost of Capital | 6.30% – 13.00% (9.94%) | Decrease | ||||||||||
| EBITDA Multiple | 5.00x – 12.50x (8.44x) | Increase | ||||||||||
| Subordinated Debt |
3,378 | Broker Quote | Bid Price | 102.05(102.05) | Increase | |||||||
| 132,305 | Discounted Cash Flow | Discount Rate | 11.31% –14.72% (14.15%) | Decrease | ||||||||
| Market Yield | 6.12% – 11.44% (10.63%) | Decrease | ||||||||||
| Yield Premium | 4.00% (4.00%) | Decrease | ||||||||||
| Weighted AverageCost of Capital | 8.70% – 13.95% (13.27%) | Decrease | ||||||||||
| EBITDA Multiple | 8.50x – 12.00x (9.04x) | Increase | ||||||||||
| Common Stock |
690 | Market Comparables | EBITDA Multiple | 10.00x (10.00x) | Increase | |||||||
| Equity Options |
19,987 | Discounted Cash Flow | EBITDA Multiple | 10.34x (10.34x) | Increase | |||||||
| Illiquidity Discount | 5.00% (5.00%) | Decrease | ||||||||||
| Discount Rate | 15.00% (15.00%) | Decrease | ||||||||||
| Total |
$ | 554,551 | ||||||||||
|
|
|
|||||||||||
| (1) | The TRS was valued in accordance with the TRS agreements as discussed in Note 2. |
| (2) | For the assets and investment that have more than one valuation technique, the Company may rely on the stated techniques individually or in the aggregate based on a weight ascribed to each valuation technique, ranging from 0 – 100%. Indicative broker quotes obtained for valuation purposes are reviewed by the Company relative to other valuation techniques. |
| (3) | Weighted average amounts are based on the estimated fair values. |
37
| (4) | This column represents the directional change in the fair value of the Level 3 investments that would result from an increase to the corresponding unobservable input. A decrease to the input would have the opposite effect. Significant changes in these inputs in isolation could result in significantly higher or lower fair value measurements. |
At December 31, 2012, the Company held 18 distinct investment positions that were classified as Level 3, representing an aggregate fair value of $93,252 and 13.1% of the total investment portfolio. The ranges of unobservable inputs used in the fair value measurement of the Company’s Level 3 investments as of December 31, 2012 were as follows:
| Asset Group | Fair Value (1) | Valuation Techniques (2) | Unobservable Inputs | Range (Weighted Average) (3) | Impact to Valuation from an Increase in Input (4) | |||||||
| Senior Debt |
$ | 18,681 | Broker Quotes | Broker Quote Mid Price | 94.25 - 102(100.98) | Increase | ||||||
|
|
| |||||||||||
| 67,910 | Broker Quotes\Market Comparables | Broker Quote Mid Price Yield |
98 - 101.5(98.55) | Increase | ||||||||
| 5.0 - 11.9%(8.91%) | Decrease | |||||||||||
|
Discount Margin |
437 -1069 bps (808 bps) | Decrease | ||||||||||
| Illiquidity Discount | 1.0 - 4.0%(2.29%) | Decrease | ||||||||||
| Subordinated Debt |
6,208 | Broker Quotes\Market Comparables | Broker Quote Mid Price Yield |
104.02(104.02) | Increase | |||||||
| 12.0 - 13.0%(12.54%) | Decrease | |||||||||||
| Discount Margin | 1071 - 1250 bps (1170 bps) | Decrease | ||||||||||
| EBITDA Multiple | 9.6x (9.6x) | Increase | ||||||||||
| Illiquidity Discount | 2%(2%) | Decrease | ||||||||||
| Common Stock |
453 | Market Comparables/ Discounted Cash Flow |
Forward EBITDA Multiple | 9.8x (9.8x) | Increase | |||||||
|
LTM EBITDA Multiple |
12.9x (12.9x) | Increase | ||||||||||
|
Illiquidity Discount |
15%(15%) | Decrease | ||||||||||
| Weighted Average Cost of Capital | 12.2%(12.2%) | Decrease | ||||||||||
| Total |
$ | 93,252 | ||||||||||
|
|
|
|||||||||||
| (1) | The TRS was valued in accordance with the TRS agreements as discussed in Note 2. |
| (2) | For the assets and investment that have more than one valuation technique, the Company may rely on the stated techniques individually or in the aggregate based on a weight ascribed to each valuation technique, ranging from 0 – 100%. Indicative broker quotes obtained for valuation purposes are reviewed by the Company relative to other valuation techniques. |
| (3) | Weighted average amounts are based on the estimated fair values. |
| (4) | This column represents the directional change in the fair value of the Level 3 investments that would result from an increase to the corresponding unobservable input. A decrease to the input would have the opposite effect. Significant changes in these inputs in isolation could result in significantly higher or lower fair value measurements. |
The above tables represent the significant unobservable inputs as they relate to the Company’s determination of fair values for the majority of its investments categorized within Level 3 as of September 30, 2013 and December 31, 2012. In addition to the techniques and inputs noted in the tables above, according to the Company’s valuation policy, it may also use other valuation techniques and methodologies when determining the Company’s fair value estimates. Any significant increases or decreases in these unobservable inputs would result in significant increases or decreases in the fair value of the Company’s investments.
Investments that do not have a readily available market value are valued utilizing a market comparables approach, an income approach (i.e. discounted cash flow approach), or both approaches, as appropriate. The market comparables approach uses prices, including third-party indicative broker quotes, and other relevant information generated by market transactions involving identical or comparable assets or liabilities (including a business). The income approach uses valuation techniques to convert future amounts (for example, cash flows or earnings) that are discounted based on a required or expected discount rate to derive a single present value amount. The measurement is based on the value indicated by current market expectations about those future amounts. In following these approaches, the types of factors that the Company may take into account in fair value pricing our investments include, as relevant: available current market data, including an assessment of the credit quality of the security issuer, relevant and applicable market trading and transaction comparables, applicable market yields and multiples, illiquidity discounts, security covenants, call protection provisions, information rights, the nature and realizable value of any collateral, the portfolio company’s ability to make payments, its earnings and cash flows, the markets in which the portfolio company does business, comparisons of financial ratios of peer companies that are public, M&A comparables, and enterprise values, among other factors.
38
The following is a reconciliation for the three months ended September 30, 2013 of investments for which Level 3 inputs were used in determining fair value:
| Senior Debt | Subordinated | Common | Equity | Total Return | ||||||||||||||||||||
| Securities | Debt Securities | Stock | Option | Swaps | Total | |||||||||||||||||||
| Fair Value Balance as of July 1, 2013 |
$ 165,663 | $ 11,814 | $ 624 | $ - | $ 5,958 | $ 184,059 | ||||||||||||||||||
| Additions |
237,706 | 122,127 | - | 20,013 | - | 379,846 | ||||||||||||||||||
| Net realized gain |
58 | - | - | - | 7,314 | 7,372 | ||||||||||||||||||
| Net change in unrealized appreciation (depreciation) (1) |
4,171 | 1,712 | 66 | (26) | (5,120) | 803 | ||||||||||||||||||
| Sales or repayments |
(1,629) | - | - | - | (7,314) | (8,943) | ||||||||||||||||||
| Net discount accretion |
62 | 30 | - | - | - | 92 | ||||||||||||||||||
| Transfers out of Level 3 |
(7,840) | - | - | - | - | (7,840) | ||||||||||||||||||
| Transfers into Level 3 |
- | - | - | - | - | - | ||||||||||||||||||
|
|
|
|
|
|
|
|
|
|
|
|
|
|||||||||||||
| Fair Value Balance as of September 30, 2013 |
$ 398,191 | $ 135,683 | $ 690 | $ 19,987 | $ 838 | $ 555,389 | ||||||||||||||||||
|
|
|
|
|
|
|
|
|
|
|
|
|
|||||||||||||
| Change in net unrealized appreciation (depreciation) in investments still held as of September 30, 2013 (1) |
$ 4,164 | $ 1,712 | $ 66 | $ (26) | $ (5,119) | $ 771 | ||||||||||||||||||
| (1) | Amount is included in the related amount on investments and derivative instruments in the condensed consolidated statements of operations. |
The following is a reconciliation for the nine months ended September 30, 2013 of investments for which Level 3 inputs were used in determining fair value:
| Senior Debt | Subordinated | Common | Equity | Total Return | ||||||||||||||||||||
| Securities | Debt Securities | Stock | Options | Swaps | Total | |||||||||||||||||||
| Fair Value Balance as of January 1, 2013 |
$ 86,591 | $ 6,208 | $ 453 | $ - | $1,349 | $ 94,601 | ||||||||||||||||||
| Additions |
340,525 | 128,065 | - | 20,013 | - | 488,603 | ||||||||||||||||||
| Net realized gain |
118 | - | - | - | 9,839 | 9,957 | ||||||||||||||||||
| Net change in unrealized appreciation (depreciation) (1) |
3,551 | 1,381 | 237 | (26) | (511) | 4,632 | ||||||||||||||||||
| Sales or repayments |
(8,030) | - | - | - | (9,839) | (17,869) | ||||||||||||||||||
| Net discount accretion |
711 | 29 | - | - | - | 740 | ||||||||||||||||||
| Transfers out of Level 3 |
(25,275) | - | - | - | - | (25,275) | ||||||||||||||||||
| Transfers into Level 3 |
- | - | - | - | - | - | ||||||||||||||||||
|
|
|
|
|
|
|
|
|
|
|
|
|
|||||||||||||
| Fair Value Balance as of September 30, 2013 |
$ 398,191 | $ 135,683 | $ 690 | $ 19,987 | $ 838 | $ 555,389 | ||||||||||||||||||
|
|
|
|
|
|
|
|
|
|
|
|
|
|||||||||||||
| Change in net unrealized appreciation (depreciation) in investments still held as of September 30, 2013 (1) |
$ 4,112 | $ 1,381 | $ 237 | $ (26) | $(511) | $ 5,193 | ||||||||||||||||||
| (1) | Amount is included in the related amount on investments and derivative instruments in the condensed consolidated statements of operations. |
39
The following is a reconciliation for the three months ended September 30, 2012 of investments for which Level 3 inputs were used in determining fair value:
| Senior Debt | Subordinated | Common | ||||||||||||||
| Securities | Debt Securities | Stock | Total | |||||||||||||
| Fair Value Balance as of July 1, 2012 |
$ 16,901 | $ 7,060 | $ 480 | $ 24,441 | ||||||||||||
| Additions |
19,022 | - | - | 19,022 | ||||||||||||
| Net realized gain |
104 | - | - | 104 | ||||||||||||
| Net change in unrealized appreciation (1) |
835 | 150 | 81 | 1,066 | ||||||||||||
| Sales or repayments |
(2,962) | - | - | (2,962) | ||||||||||||
| Net discount accretion |
34 | (1) | - | 33 | ||||||||||||
| Transfers out of Level 3 |
(4,295) | (1,105) | - | (5,400) | ||||||||||||
| Transfers into Level 3 |
24,950 | - | - | 24,950 | ||||||||||||
|
|
|
|
|
|
|
|
|
|||||||||
| Fair Value Balance as of September 30, 2012 |
$ 54,589 | $ 6,104 | $ 561 | $ 61,254 | ||||||||||||
|
|
|
|
|
|
|
|
|
|||||||||
| Change in net unrealized appreciation |
$ 811 | $ 166 | $ 81 | $ 1,058 | ||||||||||||
| (1) | Amount is included in the related amount on investments in the condensed consolidated statement of operations. |
The following is a reconciliation for the nine months ended September 30, 2012 of investments for which Level 3 inputs were used in determining fair value:
| Senior Debt | Subordinated | Common | ||||||||||||||
| Securities | Debt Securities | Stock | Total | |||||||||||||
| Fair Value Balance as of January 1, 2012 |
$ 4,652 | $ 963 | $ - | $ 5,615 | ||||||||||||
| Additions |
33,207 | 7,090 | 449 | 40,746 | ||||||||||||
| Net realized gain |
105 | 12 | - | 117 | ||||||||||||
| Net change in unrealized appreciation (1) |
979 | 144 | 112 | 1,235 | ||||||||||||
| Sales or repayments |
(5,254) | (998) | - | (6,252) | ||||||||||||
| Net discount accretion |
44 | (2) | - | 42 | ||||||||||||
| Transfers out of Level 3 |
(4,295) | (1,105) | - | (5,400) | ||||||||||||
| Transfers into Level 3 |
25,151 | - | - | 25,151 | ||||||||||||
|
|
|
|
|
|
|
|
|
|||||||||
| Fair Value Balance as of September 30, 2012 |
$ 54,589 | $ 6,104 | $ 561 | $ 61,254 | ||||||||||||
|
|
|
|
|
|
|
|
|
|||||||||
| Change in net unrealized appreciation |
$ 983 | $ 137 | $ 112 | $ 1,232 | ||||||||||||
| (1) | Amount is included in the related amount on investments in the condensed consolidated statement of operations. |
No securities were transferred into the Level 3 hierarchy and seven were transferred out of the Level 3 hierarchy during the nine months ended September 30, 2013. These investments were transferred at fair value as of the beginning of the quarter in which they were transferred. The classification transfers between Level 2 and Level 3 were based on the observed changes in liquidity based on information supplied by a third party pricing source, whereby such liquidity information is routinely reviewed no less frequently than monthly. All realized and unrealized gains and losses are included in earnings (changes in net assets) and are reported as separate line items within the Company’s condensed consolidated statements of operations.
The carrying value of cash and foreign currency is classified as Level 1 with respect to the fair value hierarchy. The carrying value of the Company’s collateral on deposit with custodian and credit facilities approximate their fair value and they would be classified as Level 2 with regards to the fair value hierarchy.
40
| 6. | Agreements and Related Party Transactions |
CNL, certain CNL affiliates, and KKR receive compensation for advisory services and/or reimbursement of expenses in connection with (i) the performance and supervision of administrative services and (ii) the offering of the Company’s common stock. Related party fees, expenses and reimbursement of expenses incurred in the three and nine month period ended September 30, 2013 and the three and nine month period ended September 30, 2012 are summarized below:
| Three Months Ended September 30, |
Nine Months Ended September 30, |
|||||||||||||||||
|
Related Party |
Source Agreement & Description |
2013 | 2012 | 2013 | 2012 | |||||||||||||
| CNL Securities Corp. |
Managing Dealer Agreement: Selling commissions and marketing support fees |
$ 23,054 | $ 16,309 | $ 62,832 | $ 38,945 | |||||||||||||
| CNL and KKR |
Investment Advisory Agreement: Base management fees (investment advisory fees) |
8,098 | 2,704 | 19,449 | 5,220 | |||||||||||||
| CNL and KKR |
Investment Advisory Agreement: Performance-based incentive fees(1) |
1,707 | - | 1,707 | - | |||||||||||||
| CNL and KKR |
Investment Advisory Agreement: Organization and offering expenses reimbursement(2) |
2,464 | 1,312 | 6,456 | 2,927 | |||||||||||||
| CNL |
Administrative Services Agreement: Administrative and compliance services |
414 | 263 | 1,104 | 582 | |||||||||||||
| (1) | During the nine months ended September 30, 2013, the Company recorded performance-based incentive fee expense of $6,028, comprised of (i) $4,321 expense provision for incentive fee on capital gains and (ii) $1,707 expense provision for subordinated incentive fee on income. During the nine months ended September 30, 2012, the Company recorded performance-based incentive fee expense of $1,921, comprised entirely of expense provision for incentive fee on capital gains. The incentive fee on capital gains was accrued based on the hypothetical liquidation of the investment portfolio as of the end of each reporting period. The incentive fee on capital gains was not earned by the Advisors or payable to the Advisors as of September 30, 2013 or 2012. |
| (2) | The Advisors received reimbursement payments for offering expenses in the amount of $6,176 in the nine months ended September 30, 2013, including $437 that was recorded as reimbursement payable at December 31, 2012. The Company recorded a reimbursement payable to the Advisors in the amount of $717 for offering expenses as of September 30, 2013 which is included in other accrued expenses and liabilities on the condensed consolidated statements of assets and liabilities. The Advisors received reimbursement payments for organization and offering expenses in the amount of $2,570 in the nine months ended September 30, 2012, including $896 for organization expenses and $1,674 for offering expenses. The Company recorded a reimbursement payable to the Advisors in the amount of $357 for offering expenses as of September 30, 2012 which is included in other accrued expenses and liabilities on the condensed statements of assets and liabilities. As of September 30, 2013, the outstanding unreimbursed Offering expenses, net of reimbursement payable, amounted to $582. |
The Company entered into a managing dealer agreement with CNL Securities Corp., an affiliate of CNL. CNL Securities Corp. serves as the managing dealer of the Offering and Follow-On Offering and in connection therewith receives selling commissions of up to 7% of gross offering proceeds and a marketing support fee of up to 3% of gross offering proceeds. All or any portion of these fees may be reallowed to participating brokers. The Company will pay a maximum sales load of 10% of gross offering proceeds for all combined selling commissions and marketing support fees.
The Company entered into an investment advisory agreement with CNL (together with one amendment, the “Investment Advisory Agreement”) for the overall management of the Company’s investment activities. The Company and CNL have entered into a sub-advisory agreement with KKR (the “Sub-Advisory Agreement”), under which KKR is responsible for the day-to-day management of the Company’s investment portfolio. CNL compensates KKR for advisory services that it provides to the Company with 50% of the base management fees and performance-based incentive fees that CNL receives under the Investment Advisory Agreement. CNL earns a base management fee equal to an annual rate of 2% of the Company’s average gross assets at the end of the two most recently completed months and it is computed and paid monthly. Gross assets include assets purchased with borrowed funds, TRS unrealized depreciation or appreciation and collateral posted with custodian in connection with TRS, but exclude deferred offering expense. CNL also earns a performance-based incentive fee that is comprised of the following two parts:
| (i) | a subordinated incentive fee on pre-incentive fee net investment income, that is paid quarterly if earned, and it is computed as the sum of (A) 100% of quarterly pre-incentive fee net investment income in excess of 1.75% of average adjusted capital up to a limit of 0.4375% of average adjusted capital, and (B) 20% of pre-incentive fee net investment income in excess of 2.1875% of average adjusted capital and |
| (ii) | an incentive fee on capital gains that is paid annually if earned, and it is equal to 20% of (A) all realized gains on a cumulative basis from inception, net of (i) all realized losses on a cumulative basis, (ii) unrealized depreciation at year end and (iii) disregarding any net realized gains associated with the TRS interest spread (which represents the difference between (a) the interest and fees received on total return swaps, and (b) the financing fees paid to the total return swaps counterparty), and subtracting (B) the aggregate amount of any previously paid incentive fee on capital gains. |
The terms of the Investment Advisory Agreement entitle CNL (and indirectly KKR) to receive up to 5% of gross proceeds in connection with the Offering as reimbursement for organization and offering expenses incurred by the Advisors on behalf of the Company. Beginning February 1, 2012, the Company implemented an initial reimbursement rate of 0.75% of gross offering proceeds to initiate the reimbursement of organization and offering expenses incurred by the Advisors. Beginning March 1, 2013, the Company changed the reimbursement rate to 1% of gross offering proceeds.
41
The Company entered into an administrative services agreement with CNL (the “Administrative Services Agreement”) whereby CNL performs, and oversees the performance of, various administrative services on behalf of the Company. Administrative services may include transfer agency oversight and supervisory services, shareholder communication services, general ledger accounting services, calculating the Company’s net asset value, maintaining required corporate and financial records, financial reporting for the Company and its subsidiaries, internal audit services, reporting to the Company’s board of directors and lenders, preparing and filing income tax returns, preparing and filing SEC reports, preparing, printing and disseminating shareholder reports, overseeing the payment of the Company’s expenses and shareholder distributions, administering the quarterly share repurchase programs, compliance services, and management and oversight of service providers in their performance of administrative and professional services rendered for the Company. CNL may also enter into agreements with its affiliates for the performance of select administrative services. The Company reimburses CNL for the professional services and expenses it incurs in performing its administrative obligations on behalf of the Company.
On June 7, 2011, the Company entered into an Expense Support and Conditional Reimbursement Agreement (the “Expense Support Agreement”) with CNL and KKR pursuant to which CNL and KKR jointly and severally agreed to pay to the Company all operating expenses (an “Expense Support Payment”) during the Expense Support Payment Period between June 17, 2011 to December 31, 2011. On December 16, 2011, the Company and the Advisors entered into an amendment to the Expense Support Agreement, effective January 1, 2012, that extended the terminal date of the Expense Support Payment Period to March 31, 2012 and reduced the Reimbursement Ratio from 100% to 65% of the Company’s Operating Expenses. The Amendment also redefined Operating Expenses as all operating costs and expenses paid or incurred by the Company, as determined under GAAP, including base advisory fees payable pursuant to the Investment Advisory Agreement, and excluding (i) performance-based incentive fees payable pursuant to the Investment Advisory Agreement, (ii) organization and offering expenses, and (iii) all interest costs related to borrowings for such period. On March 16, 2012, the Company and the Advisors entered into an amendment and restatement of the Expense Support Agreement, effective April 1, 2012, that extended the terminal date of the Expense Support Payment Period to June 30, 2012 and reduced the Reimbursement Ratio from 65% to 25% of the Company’s Operating Expenses. Expense support payments ceased on July 1, 2012.
During the term of the Expense Support Agreement, the Advisors are entitled to an annual year-end reimbursement payment by the Company for unreimbursed Expense Support Payments made under the Expense Support Agreement (a “Reimbursement Payment”), but such Reimbursement Payments may only be paid (i) within three years after the year in which such Expense Support Payments are attributable, and (ii) to the extent that it would not cause the Company’s Other Operating Expenses (Operating Expenses excluding base management fees and including a Reimbursement Payment) to exceed 1.75% of average net assets attributable to common shares as of the end of any such calendar year (the “Reimbursement Limit Percentage”). The Company records the liability for the Reimbursement Payments based on a hypothetical liquidation of its investment portfolio at the end of each reporting period.
Presented below is a summary of Expense Support Payments and the associated terminal eligibility dates for Reimbursement Payments for the years ending December 31, 2011 and December 31, 2012.
| Expense Support | Reimbursement | Unreimbursed | Reimbursement | |||||||||||||
| Payments Received | Payments | Expense | Payments | |||||||||||||
| Period Ended | from Advisors | to Advisors | Support Payments(1) | Eligibility through | ||||||||||||
| December 31, 2011 |
$ | 1,376 | $ | 1,376 | $ | — | — | |||||||||
| December 31, 2012 |
1,590 | 454 | 1,136 | December 31, 2015 | ||||||||||||
|
|
|
|
|
|
|
|||||||||||
| Total |
$ | 2,966 | $ | 1,830 | $ | 1,136 | ||||||||||
|
|
|
|
|
|
|
|||||||||||
| (1) | As of September 30, 2013 the Company has accrued $1,136 for Reimbursement Payment to Advisors. |
Indemnification - The Investment Advisory Agreement and the Sub-Advisory Agreement provide certain indemnification to the Advisors, their directors, officers, persons associated with the Advisors, and their affiliates. The managing dealer agreement provides certain indemnification to the managing dealer and each participating broker and their respective officers, directors, partners, employees, associated persons, agents and control persons. As of September 30, 2013, management believes that the risk of incurring any losses for such indemnification is remote.
42
| 7. | Earnings Per Share |
The following information sets forth the computation of basic and diluted net increase in net assets from operations per share (earnings per share).
| Basic and Diluted Net Increase (Decrease) in Net Assets Per Share | ||||||||||||||||
| Three Months Ended September 30, |
Nine Months Ended September 30, |
|||||||||||||||
| 2013 | 2012 | 2013 | 2012 | |||||||||||||
| Net increase in net assets resulting from operations |
$ | 34,774 | $ | 11,176 | $ | 61,611 | $ | 18,727 | ||||||||
| Weighted average shares outstanding |
115,304,666 | 37,881,506 | 93,148,769 | 23,696,227 | ||||||||||||
| Basic/diluted net increase in net assets from operations per share (1) |
$ | 0.30 | $ | 0.30 | $ | 0.66 | $ | 0.79 | ||||||||
(1) Diluted and basic net increase in net assets from operations per share were equivalent in each period because there were no common stock equivalents outstanding in each period.
| 8. | Distributions |
The Company’s board of directors declared distributions for 39 record dates in the nine months ended September 30, 2013. Declared distributions are paid monthly. The total of declared distributions and the sources of distribution payments for the nine months ended September 30, 2013 are presented in the table below.
| Declared Distributions |
Per Share | Amount | Allocation | |||||||||
| For three months ended March 31, 2013 (13 record dates) |
$0.20 | $13,735 | ||||||||||
| For three months ended June 30, 2013 (13 record dates) |
0.19 | 17,807 | ||||||||||
| For three months ended September 30, 2013 (13 record dates) |
0.20 | 22,262 | ||||||||||
|
|
|
|
|
|||||||||
| Total Declared Distributions for the nine months ended September 30, 2013 |
$0.59 | $53,804 | 100.0 | % | ||||||||
|
|
|
|
|
|||||||||
| From Net Investment Income |
$0.33 | $30,695 | 57.1 | |||||||||
| From Realized Gains |
0.18 | 16,206 | 30.1 | |||||||||
| Distributions in Excess of Net Investment Income |
0.08 | 6,903 | 12.8 | |||||||||
Sources of distributions, other than net investment income and realized gains, include the ordinary income component of prior year tax basis accumulated earnings and adjustments made to GAAP net investment income to arrive at taxable income available for distributions. The following table summarizes the primary sources of differences between net investment income and taxable income available for distributions that contribute to distributions in excess of net investment income for the nine months ended September 30, 2013.
| For the nine months ended September 30, 2013 |
Amount | |||
| Ordinary income component of tax basis accumulated earnings |
$ | 819 | ||
| Estimated unearned performance-based incentive fee |
3,543 | |||
| Offering expenses |
4,492 | |||
| Deferred loan fees recognized as taxable income |
1,929 | |||
| Net change in unrealized depreciation on total return swaps |
(511) | |||
| Net change in unrealized depreciation on foreign currency forward contracts |
(2,946) | |||
|
|
|
|||
| Total(1) |
$ | 7,326 | ||
|
|
|
|||
| (1) | The above table does not present all adjustments to calculate taxable income available for distributions. A final determination of taxable income, taxable income available for distributions and the tax classifications of the 2013 calendar year paid distributions, is made annually at the end of the year. |
On September 24, 2013, the Company’s board of directors declared distributions of $0.015004 per share per week for the time period beginning on October 1, 2013 through and including November 26, 2013.
| 9. | Share Transactions |
On January 29, 2013 and May 7, 2013, the Company’s board of directors increased the public offering price per share of common stock under the Offering to $11.05 and $11.10, respectively, to ensure that the associated net offering price per share, exclusive of sales load, equaled or exceeded the net asset value per share on each subsequent subscription closing date and distribution reinvestment date.
43
The following table summarizes the total shares issued and proceeds received in connection with the Company’s Offering for the nine months ended September 30, 2013 and September 30, 2012.
| Nine Months Ended | ||||||||||||||||||||
| September 30, 2013 | September 30, 2012 | |||||||||||||||||||
| Shares | Amount | Shares | Amount | |||||||||||||||||
| Gross Proceeds from Offering |
61,616,518 | $ | 676,812 | 38,290,080 | $ | 411,855 | ||||||||||||||
| Commissions and Marketing Support Fees |
— | (62,832) | — | (38,945) | ||||||||||||||||
|
|
|
|
|
|
|
|
|
|||||||||||||
| Net Proceeds to Company |
61,616,518 | 613,980 | 38,290,080 | 372,910 | ||||||||||||||||
| Reinvestment of Distributions |
2,728,786 | 27,215 | 698,628 | 6,816 | ||||||||||||||||
|
|
|
|
|
|
|
|
|
|||||||||||||
| Net Proceeds from Offering |
64,345,304 | $ | 641,195 | 38,988,708 | $ | 379,726 | ||||||||||||||
|
|
|
|
|
|
|
|
|
|||||||||||||
| Average Net Proceeds Per Share |
$9.96 | $9.74 | ||||||||||||||||||
As of September 30, 2013, the Company has sold 127,124,408 shares of common stock through the Offering, including reinvestment of distributions, for total gross proceeds of $1,375,392.
The Company conducts quarterly tender offers pursuant to its share repurchase program. The Company currently limits the number of shares to be repurchased during any calendar year to the number of shares it can repurchase with the proceeds it receives from the issuance of shares of its common stock under its distribution reinvestment plan. At the discretion of the Company’s board of directors, the Company may also use cash on hand, cash available from borrowings and cash from the sale of investments as of the end of the applicable period to repurchase shares. The Company will limit repurchases in each quarter to 2.5% of the weighted average number of shares of common stock outstanding in the prior four calendar quarters. The Company’s board of directors may amend, suspend or terminate the share repurchase program upon 30 days notice.
The following table is a summary of the share repurchases completed during the nine months ended September 30, 2013:
| Repurchase Date |
Total Number of Shares Offered to Repurchase |
Total Number of Shares Purchased |
Total Consideration |
No. of Shares Purchased/ Total Offer |
Price Paid per Share |
|||||||||||||||
| February 20, 2013 |
785,106 | 84,074 | $ | 818 | 11% | $ | 9.73 | |||||||||||||
| May 24, 2013 |
1,158,737 | 68,788 | 682 | 6% | 9.91 | |||||||||||||||
| August 27, 2013 |
1,596,287 | 116,779 | $ | 1,142 | 7% | 9.78 | ||||||||||||||
|
|
|
|
|
|
|
|||||||||||||||
| Total |
3,540,130 | 269,641 | $ | 2,642 | 8% | |||||||||||||||
|
|
|
|
|
|
|
|||||||||||||||
| 10. | Financial Highlights |
The following per share data and financial ratios have been derived from information provided in the financial statements. The following is a schedule of financial highlights for one share of common stock during the nine months ended September 30, 2013 and September 30, 2012.
44
| For the nine months ended September 30, | ||||||||
| 2013 | 2012 | |||||||
| OPERATING PERFORMANCE PER SHARE |
||||||||
| Net Asset Value, Beginning of Period |
$ | 9.75 | $ | 9.21 | ||||
| Net Investment Income, Before Expense Support/Reimbursement(1) |
0.34 | 0.32 | ||||||
| Expense Support/ Reimbursement(1) |
(0.01) | 0.07 | ||||||
|
|
|
|
|
|||||
| Net Investment Income(1) |
0.33 | 0.39 | ||||||
| Net Realized and Unrealized Gain(1)(2) |
0.38 | 0.66 | ||||||
|
|
|
|
|
|||||
| Net Increase Resulting from Investment Operations |
0.71 | 1.05 | ||||||
| Distributions from Net Investment Income(3) |
(0.33) | (0.39) | ||||||
| Distributions from Realized Gains(3) |
(0.18) | (0.08) | ||||||
| Distributions in Excess of Net Investment Income(3)(4) |
(0.08) | (0.10) | ||||||
| Net Decrease Resulting from Distributions to Common Shareholders |
(0.59) | (0.57) | ||||||
| Issuance of common stock above net asset value(5) |
0.05 | 0.09 | ||||||
| Repurchases of common stock(6) |
— | — | ||||||
|
|
|
|
|
|||||
| Net Increase Resulting from Capital Share Transactions |
0.05 | 0.09 | ||||||
|
|
|
|
|
|||||
| Net Asset Value, End of Period |
$ | 9.92 | $ | 9.78 | ||||
|
|
|
|
|
|||||
| INVESTMENT RETURNS |
||||||||
| Total Investment Return-Net Price(7) |
6.72% | 12.30% | ||||||
| Total Investment Return-Net Asset Value(8) |
7.87% | 12.50% | ||||||
| RATIOS/SUPPLEMENTAL DATA (all amounts in thousands except ratios) |
||||||||
| Net Assets, End of Period |
$ | 1,257,844 | $ | 449,997 | ||||
| Average Net Assets(9) |
$ | 919,575 | $ | 228,786 | ||||
| Average Credit Facilities Borrowings(9) |
$ | 251,700 | $ | 86,870 | ||||
| Shares Outstanding, End of Period |
126,804 | 46,014 | ||||||
| Weighted Average Shares Outstanding |
93,149 | 23,696 | ||||||
| Ratios to Average Net Assets:(9) |
||||||||
| Total Operating Expenses Before Expense Support/Reimbursement |
4.31% | 5.92% | ||||||
| Total Operating Expenses After Expense Support/Reimbursement |
4.43% | 5.23% | ||||||
| Net Investment Income |
3.34% | 4.00% | ||||||
| Portfolio Turnover Rate |
39% | 30% | ||||||
| Asset Coverage Ratio(10) |
3.47 | 3.80 | ||||||
| (1) | The per share data was derived by using the weighted average shares outstanding during the period. |
| (2) | The amount shown at this caption is the balancing figure derived from the other figures in the schedule. The amount shown at this caption for a share outstanding throughout the year may not agree with the change in the aggregate gains and losses in portfolio securities for the year because of the timing of sales of the Company’s shares in relation to fluctuating market values for the portfolio. |
| (3) | The per share data for distributions is the actual amount of distributions paid or payable per share of common stock outstanding during the entire period; distributions per share are rounded to the nearest $0.01. |
| (4) | See Note 8 of the condensed consolidated financial statements for further insight into the sources of distributions that contribute to the occurrence of distributions in excess of net investment income. |
| (5) | The continuous issuance of common stock may cause an incremental increase in net asset value per share due to the sale of shares at the then prevailing public offering price and the receipt of net proceeds per share by the Company in excess of net asset value per share on each subscription closing date. The per share data was derived by computing (i) the sum of (A) the number of shares issued in connection with subscriptions and/or distribution reinvestment on each share transaction date times (B) the differences between the net proceeds per share and the net asset value per share on each share transaction date, divided by (ii) the total shares outstanding at the end of the period. |
| (6) | The per share impact of the Company’s repurchase of common stock is a reduction to net asset value of less than $0.01 per share during the applicable period. |
45
| (7) | Total investment return-net price is a measure of total return for shareholders who purchased the Company’s common stock at the beginning of the period, including dividends declared during the period. Total investment return-net price is based on (i) the purchase of one share at the public offering price, net of sales load, on the first day of the period, (ii) the sale at the net asset value per share on the last day of the period, of (A) one share plus (B) any fractional shares issued in connection with the reinvestment of monthly distributions, and (iii) the cash payment for distributions payable, if any, on the last day of the period. The total investment return-net price calculation assumes that (i) monthly cash distributions are reinvested in accordance with the Company’s distribution reinvestment plan and (ii) the fractional shares issued pursuant to the distribution reinvestment plan are issued at the then public offering price, net of sales load, on each monthly distribution payment date. Since there is no public market for the Company’s shares, then the terminal sales price per share is assumed to be equal to net asset value per share on the last day of the period. The Company’s performance changes over time and currently may be different than that shown above. Past performance is no guarantee of future results. Investment performance is presented without regard to sales load that may be incurred by shareholders in the purchase of the Company’s shares of common stock. |
| (8) | Total investment return-net asset value is a measure of the change in total value for shareholders who held the Company’s common stock at the beginning and end of the period, including dividends declared during the period. Total investment return-net asset value is based on (i) the beginning period net asset value per share on the first day of the period, (ii) the net asset value per share on the last day of the period, of (A) one share plus (B) any fractional shares issued in connection with the reinvestment of monthly distributions, and (iii) the value of distributions payable, if any, on the last day of the period. The total investment return-net asset value calculation assumes that (i) monthly cash distributions are reinvested in accordance with the Company’s distribution reinvestment plan and (ii) the fractional shares issued pursuant to the distribution reinvestment plan are issued at the then public offering price, net of sales load, on each monthly distribution payment date. Since there is no public market for the Company’s shares, then terminal market value per share is assumed to be equal to net asset value per share on the last day of the period. The Company’s performance changes over time and currently may be different than that shown above. Past performance is no guarantee of future results. Investment performance is presented without regard to sales load that may be incurred by shareholders in the purchase of the Company’s shares of common stock. |
| (9) | The computation of average net assets and average credit facilities borrowings during the period is based on the daily value of net assets and borrowing balances, respectively. Ratios are not annualized. |
| (10) | Asset coverage ratio is equal to (i) the sum of (A) net assets at the end of the period and (B) debt outstanding at the end of the period, divided by (ii) total debt outstanding at the end of the period. For purposes of the asset coverage ratio test applicable to the Company as a business development company, the Company regards the TRS total notional amount at the end of the period, less the total amount of cash collateral posted by Halifax Funding under the TRS, as a senior security for the life of the TRS. These data are presented in Note 4 of the condensed consolidated financial statements. |
| 11. | Revolving Credit Facilities and Borrowings |
The following table presents summary information with respect to the Company’s outstanding credit facilities as of September 30, 2013.
| As of September 30, 2013 | ||||||||
| Total Aggregate Principal Amount Committed (1) |
Principal Amount Outstanding |
|||||||
|
|
|
|||||||
| Deutsche Bank Credit Facility |
$ | 265,000 | $ | 264,440 | ||||
| BNP Credit Facility |
200,000 | 125,000 | ||||||
| Senior Secured Credit Facility |
285,000 | (2) | 116,986 | (3) | ||||
|
|
|
|
|
|||||
| Total |
$ | 750,000 | $ | 506,426 | ||||
|
|
|
|
|
|||||
| (1) | Subject to borrowing base and leverage restrictions. |
| (2) | Provides for a feature that allows the Company, under certain circumstances, to increase the size of the Revolving Credit Facility to a maximum of $600,000 as of September 30, 2013. |
| (3) | Includes $106,986 denominated in Euros. |
The weighted average stated interest rate and weighted average maturity, both on aggregate principal amount of all debt outstanding as of September 30, 2013 were 2.2% and 1.7 years, respectively.
Deutsche Bank Credit Facility
On February 11, 2013, CCT Funding, Deutsche Bank AG, New York Branch, (“Deutsche Bank”), and the other lenders party thereto entered into an amendment (the “Third Amendment”) to the multi-lender, revolving credit facility (“the Deutsche Bank Credit Facility”) that CCT Funding originally entered into with Deutsche Bank on August 22, 2011. Deutsche Bank is a lender and serves as administrative agent under the Deutsche Bank Credit Facility.
The Third Amendment amended the Deutsche Bank Credit Facility by providing for, among other things, the extension of a new tranche of loan commitments (the “Tranche D Loans”) permitting additional borrowings in an aggregate amount of up to $100,000. Pursuant to the Third Amendment, Healthcare of Ontario Pension Plan became a Lender under the Deutsche Bank Credit Facility. The Third Amendment reclassified the prior Tranche B Loans as the “Tranche B2 Loans” and the prior Tranche C Loans as the “Tranche B1 Loans.” As amended, loans under the Deutsche Bank Credit Facility will generally bear interest based on a three-month adjusted LIBOR (“Adjusted LIBOR”) for the relevant interest period (except with respect to the Tranche A Loans, which bear interest based on
46
one-month Adjusted LIBOR), plus a spread. Upfront fees and unfunded commitment fees were also incurred with respect to the Tranche B1 Loans, Tranche B2 Loans and Tranche D Loans under the Third Amendment. As of September 30, 2013, the Company has incurred deferred financing costs of $1,338 in connection with arranging and amending the Deutsche Bank Credit Facility.
Under the Deutsche Bank Credit Facility, CCT Funding has made certain representations and warranties and it is required to comply with various covenants, reporting requirements and other customary requirements for credit agreements of this nature. As of September 30, 2013, management believes that the Company was in compliance with the covenants of the Deutsche Bank Credit Facility.
The components of interest expense, average interest rates (i.e., interest rate in effect plus the spread) and average outstanding balances for the Deutsche Bank Credit Facility were as follows:
| For the three months ended: | For the nine months ended: | |||||||
|
|
|
|||||||
| September 30, 2013 | ||||||||
| Average Borrowings |
$ | 198,897 | $ | 206,492 | ||||
| Direct Interest Expense |
1,115 | 3,385 | ||||||
| Unused Commitment Fees |
142 | 298 | ||||||
| Amortization of Deferred Financing Costs |
113 | 442 | ||||||
|
|
|
|
|
|||||
| Total Interest Expense |
$ | 1,370 | $ | 4,125 | ||||
|
|
|
|
|
|||||
| Weighted Average Interest Rate |
2.2 | % | 2.2 | % | ||||
BNP Credit Facility
On June 4, 2013, the Company entered into a committed facility arrangement (the “BNP Credit Facility, which became effective on June 12, 2013, with BNP Paribas Prime Brokerage, Inc. (“BNP”) under which the Company may borrow up to $200,000. On August 29, 2013, the Company assigned the agreements under the BNP Credit Facility to Paris Funding. The Company has the right to prepay loans under the BNP Credit Facility in whole or in part at any time. BNP can recall the loans under the BNP Credit Facility with 364 days notice.
Paris Funding pledges certain of its assets as collateral to secure borrowings under the BNP Credit Facility. As of September 30, 2013, Paris Funding has investments with a fair value of $270,540 pledged as collateral under the BNP Credit Facility. Interest is charged at the rate of one month LIBOR plus 1.10% and is payable monthly. Paris Funding also pays an annual commitment fee of 0.55% on any unused commitment amounts. As of September 30, 2013, the Company has incurred deferred financing costs of $477 in connection with arranging the BNP Credit Facility.
In connection with the BNP Credit Facility, Paris Funding has made customary representations and warranties and is required to comply with various covenants, reporting requirements and other customary requirements for similar facilities. As of September 30, 2013, management believes that Paris Funding was in compliance with the covenants of the BNP Credit Facility.
Under the terms of the BNP Financing Agreements, BNP has the ability to borrow a portion of the pledged collateral (“Rehypothecated Securities”), subject to certain limits. Paris Funding receives a fee from BNP in connection with any Rehypothecated Securities and will continue to receive interest and the scheduled repayment of principal balances on Rehypothecated Securities.
The components of interest expense, average interest rates (i.e., interest rate in effect plus the spread) and average outstanding balances for the BNP Credit Facility were as follows:
| For the three months ended: | For the nine months ended: | |||||||
|
|
|
|||||||
| September 30, 2013 | ||||||||
| Average Borrowings (1) |
$ | 105,707 | $ | 99,324 | ||||
| Direct Interest Expense |
347 | 394 | ||||||
| Unused Commitment Fees |
133 | 151 | ||||||
| Amortization of Deferred Financing Costs |
115 | 136 | ||||||
|
|
|
|
|
|||||
| Total Interest Expense |
$ | 595 | $ | 681 | ||||
|
|
|
|
|
|||||
| Weighted Average Interest Rate |
1.3 | % | 1.3 | % | ||||
| (1) | Average borrowings for the BNP Credit Facility for the nine months ended September 30, 2013 are calculated since the inception date of the facility, or June 12, 2013. |
47
Senior Secured Credit Facility
On September 4, 2013, the Company entered into a credit facility (the “Senior Secured Credit Facility”) with certain lenders and JPMorgan Chase Bank, N.A., acting as administrative agent. The Senior Secured Credit Facility consists of loans to be made in dollars and other foreign currencies in an initial aggregate amount of $285 million, with an “accordion” feature that allows the Company, under certain circumstances, to increase the size of the facility to a maximum of $600 million. Availability under the Senior Secured Credit Facility will terminate on September 4, 2016 and the outstanding loans under the Senior Secured Credit Facility will mature on September 4, 2017. The stated borrowing rate under the Senior Secured Credit Facility is based on LIBOR plus an applicable spread of 2.50% or on an “alternate base rate” (which is the highest of a prime rate, the federal funds rate plus 0.50%, or one-month LIBOR plus 1.00%) plus an applicable spread of 1.50%, or, with respect to borrowings in non-LIBOR currencies, on a rate applicable to such currency plus an applicable spread of 2.50%. The Senior Secured Credit Facility is secured by substantially all of the Company’s portfolio investments and its cash and securities accounts excluding those held by CCT Funding and Paris Funding, and provides for a guaranty by certain subsidiaries of the Company. As of September 30, 2013, the Company has incurred deferred financing costs of $3,747 in connection with arranging the Senior Secured Credit Facility.
Under the Senior Secured Credit Facility, the Company has made certain representations and warranties and is required to comply with various covenants, reporting requirements and other customary requirements for similar revolving credit facilities, including ones that require the Company to maintain a certain minimum shareholders’ equity and to maintain certain leverage ratios. The Senior Secured Credit Facility also includes usual and customary events of default for senior secured revolving credit facilities of this nature.
In addition to the covenants described above, borrowings under the Senior Secured Credit Facility (and the incurrence of certain other permitted debt) will be subject to compliance with a borrowing base that will apply different advance rates to different types of assets in the Company’s portfolio.
The components of interest expense, average interest rates (i.e., interest rate in effect plus the spread) and average outstanding balances for the Senior Secured Credit Facility were as follows:
| For the three and nine months ended September 30, 2013 |
||||
| Average Borrowings (1) |
$ | 48,772 | ||
| Direct Interest Expense |
95 | |||
| Unused Commitment Fees |
82 | |||
| Amortization of Deferred Financing Costs |
65 | |||
|
|
|
|||
| Total Interest Expense |
$ | 242 | ||
|
|
|
|||
| Weighted Average Interest Rate |
2.7 | % | ||
| (1) | Average borrowings for the Senior Secured Credit Facility are calculated since the inception date of the facility, or September 4, 2013. |
| 12. | Guarantees and Commitments |
In the normal course of business, the Company may enter into guarantees on behalf of portfolio companies. Under these arrangements, the Company would be required to make payments to third parties if the portfolio companies were to default on their related payment obligations. The Company has no such guarantees outstanding at September 30, 2013 and December 31, 2012. As of September 30, 2013, the Company’s unfunded commitments amounted to $69,342.
| 13. | Subsequent Events |
On October 9, 2013, the Company filed its tender offer statement with the SEC on Schedule TO. The Company is offering to repurchase up to 2,084,159 shares of common stock at a cash price of $9.91 per share.
On October 24, 2013, the aggregate loan commitment under the JPMorgan Credit Facility was increased to $320,000.
On November 1, 2013, the Follow-On Offering was declared effective by the SEC.
As of November 12, 2013, the total amount borrowed under the Company’s credit facilities was $561,426.
48
Item 2. Management’s Discussion and Analysis of Financial Condition and Results of Operations
The information contained in this section should be read in conjunction with our unaudited condensed consolidated financial statements and related notes thereto appearing elsewhere in this quarterly report on Form 10-Q. In this report, “we”, “our”, “us” and “our company” refer to Corporate Capital Trust, Inc.
STATEMENT REGARDING FORWARD LOOKING INFORMATION
The following information contains statements that constitute forward-looking statements, within the meaning of Section 27A of the Securities Act of 1933, as amended, and Section 21E of the Securities Exchange Act of 1934, as amended (the “Exchange Act”). These statements generally are characterized by the use of terms such as “may,” “should,” “plan,” “anticipate,” “estimate,” “intend,” “predict,” “believe” and “expect” or the negative of these terms or other comparable terminology. Although we believe that the expectations reflected in such forward-looking statements are based upon reasonable assumptions, our actual results could differ materially from those set forth in the forward-looking statements. Some factors that might cause such a difference include the following: the current global economic downturn, increased direct competition, changes in government regulations or accounting rules, changes in local, national and global capital market conditions, our ability to obtain or access credit lines or credit facilities on satisfactory terms, changes in interest rates, availability of proceeds from our offering of shares, our ability to identify suitable investments, our ability to close on identified investments, inaccuracies of our accounting estimates, our ability to locate suitable borrowers to borrow from us on favorable terms to us, and the ability of such borrowers to make payments to us under their respective loans terms and conditions with us. Given these uncertainties, we caution you not to place undue reliance on such statements, which apply only as of the date hereof. We undertake no obligation to publicly release the results of any revisions to these forward-looking statements that may be made to reflect future events or circumstances or to reflect the occurrence of unanticipated events. The forward-looking statements should be read in light of the risk factors identified in the “Risk Factors” section of our annual report on Form 10-K filing for the year ended December 31, 2012.
CRITICAL ACCOUNTING POLICIES AND ESTIMATES
Our discussion and analysis of our financial condition and results of operations are based upon our condensed consolidated financial statements which have been prepared in accordance with GAAP. The preparation of these condensed consolidated financial statements requires management to make estimates and assumptions that affect the reported amounts of assets, liabilities, revenues and expenses. Changes in the economic environment, financial markets and any other parameters used in determining such estimates could cause actual results to differ.
Our critical accounting policies are described in the notes to the condensed consolidated financial statements. Accordingly see Note 2 to the condensed consolidated financial statements for a description of critical accounting policies. We consider these accounting policies critical because they involve management judgments and assumptions, require estimates about matters that are inherently uncertain and because they are important for understanding and evaluating our reported financial results. These judgments will affect the reported amounts of assets and liabilities and our disclosure of contingent assets and liabilities at the dates of the financial statements and the reported amounts of revenue and expenses during the reporting periods. With different estimates or assumptions, materially different amounts could be reported in our financial statements.
RECENT ACCOUNTING PRONOUNCEMENTS
See Note 2 to the condensed consolidated financial statements for a description of recently issued accounting pronouncements. We do not believe that any recently issued but not yet effective accounting pronouncements, if adopted, would have a material effect on our condensed consolidated financial statements.
EXECUTIVE OVERVIEW
We are a non-diversified closed-end management investment company that has elected to be treated as a business development company under the 1940 Act. Formed as a Maryland corporation on June 9, 2010, we are externally managed by CNL Fund Advisors Company (“CNL”) and KKR Asset Management LLC (“KKR”), collectively, the “Advisors”, which are responsible for sourcing potential investments, conducting due diligence on prospective investments, analyzing investment opportunities, structuring investments and monitoring our portfolio on an ongoing basis. Both Advisors are registered as investment advisers with the Securities and Exchange Commission (the “SEC”). CNL also provides the administrative services necessary for us to operate.
We are currently offering and selling shares of our common stock pursuant to a registration statement on Form N-2 (the “Follow-On Registration Statement”) covering our follow-on continuous public offering of up to 209 million shares of common stock for an approximate maximum offering amount of $2.3 billion (the “Follow-On Offering”). We filed the Follow-On Registration Statement on June 21, 2013, and it was declared effective by the SEC on November 1, 2013.
49
Immediately prior to the commencement of the Follow-On Offering, we terminated our initial continuous public, which covered up to 150 million shares of common stock for an approximate maximum offering amount of $1.6 billion (the “Initial Offering”). The Initial Offering commenced on April 4, 2011 upon the effectiveness of the related registration statement on Form N-2 (Registration No. 333-189544) that we filed with the SEC (as amended and supplemented, the “Initial Offering Registration Statement”).
Investment Objective and Investment Program
Our investment objective is to provide our shareholders with current income and, to a lesser extent, long-term capital appreciation. We intend to meet our investment objective by investing primarily in the debt of privately owned U.S. companies (also referred to as “portfolio companies”) with a focus on originated transactions sourced through the networks of our Advisors. A substantial portion of our portfolio consists of senior and subordinated debt, which we believe offer potential opportunities for superior risk-adjusted returns and income generation. Our debt investments may take the form of corporate loans or bonds, may be secured or unsecured and may, in some cases, be accompanied by warrants, options or other forms of equity participation. We may also potentially purchase common or preferred equity interests in our portfolio companies.
As of September 30, 2013, our investment program consisted of two main components. First, since the inception of our investment activities we have been engaged in the direct purchase of debt securities primarily issued by portfolio companies, and these debt securities were acquired through both secondary market and primary issuance transactions. We refer to this investment component as our “Investment Portfolio” in this report. Second, beginning in November 2012, we have been increasing our economic exposure to portfolio companies by entering into a total return swap arrangement (“the TRS”) with a commercial bank counterparty and directing the creation of a portfolio of underlying corporate bonds and loans that serve as reference assets under the TRS. We refer to this investment component as our portfolio of TRS reference assets or “TRS Portfolio” in this report. In the case of our TRS Portfolio, we receive all: (i) realized income and fees and (ii) realized capital gains generated by TRS reference assets. In return, we must pay quarterly to the TRS counterparty a payment consisting of: (i) realized capital losses and (ii) financing costs that are based on a floating interest rate and the notional amount of TRS reference assets. At the end of the TRS contract life, we will receive additional economic benefit if the net value of the TRS Portfolio appreciates relative to its notional amount. Conversely, we will be required to pay the counterparty the amount, if any, by which the net value of the portfolio of TRS reference assets declines relative to its notional amount. We do not own, or have physical custody of, the TRS reference assets. The TRS reference assets are not direct investments by us.
On May 23, 2013 we were granted exemptive relief by the SEC which expanded our ability to co-invest in privately negotiated transactions with other investment funds affiliated with KKR (the “Co-Investment Transactions”). Accordingly, our Advisors are able to pursue and access investment opportunities where:
| (i) | the business terms for investing debt and equity capital in the portfolio company are negotiated in all respects, |
| (ii) | KKR or one or more of its affiliates is directly sourcing and negotiating the business terms of the Co-Investment Transaction, and |
| (iii) | we can establish and liquidate our investment position alongside other investment funds that are managed by KKR or that represent affiliates of KKR. |
Our Advisors expect that these Co-Investment Transactions will represent an increasing portion of the Investment Portfolio and therefore we can expect some of the following changes as a result of more emphasis on Co-Investment Transactions as another means to invest in the debt securities issued by portfolio companies:
| • | An increase in the proportion of debt investments of portfolio companies that are originated directly by KKR and its affiliates as primary market negotiated transactions, and a commensurate reduction in the proportion of our portfolio that is comprised of debt investments that are acquired and liquidated through secondary market transactions, thereby altering the liquidity characteristics of our Investment Portfolio; |
| • | An increase in the average amount invested per portfolio company as a result of (i) a reduction in the overall number of portfolio companies held in the Investment Portfolio and (ii) the likely increase in the average amount of capital that is committed to primary market negotiated transactions, including Co-Investment Transactions, thereby altering the investment diversification and concentration characteristics of our Investment Portfolio; |
| • | An increase in the number of investments and the proportion of our portfolio that will rely on valuation inputs that are unobservable and where initially there is little, if any, market activity for the Co-Investment Transaction, thereby relying to a greater extent on the Company’s board of directors to determine in good |
50
| faith the fair value of an increasing number of our investments, including Co-Investment Transactions in accordance with the our valuation policies and procedures; |
| • | The addition of new borrowing arrangements, including secured credit facilities and unsecured debt issuance, to finance our investment allocation of Co-Investment Transactions with borrowed capital in addition to equity capital available to us, while adhering to the borrowing limitations that already apply to us and other business development companies pursuant to the 1940 Act. |
The level of our investment activity can and does vary substantially from period to period depending on many factors, including: the demand for debt from creditworthy privately owned U.S. companies, the level of merger, acquisition and refinancing activity involving private companies, the availability of credit to finance transactions, the general economic environment, the competitive investment environment for the types of investments we currently seek and intend to seek in the future, the amount of equity capital we raise from offering common stock in our company and the amount of capital we may borrow under our revolving credit facilities.
As a business development company, we are required to comply with certain regulatory requirements. For instance, we may not acquire any assets other than “qualifying assets” specified in the 1940 Act unless, at the time the acquisition is made, at least 70% of our total assets are qualifying assets (with certain limited exceptions). Qualifying assets include investments in “eligible portfolio companies.” Under the relevant SEC rules, the term “eligible portfolio company” includes all private companies, companies whose securities are not listed on a national securities exchange, and certain public companies that have listed their securities on a national securities exchange and have a market capitalization of less than $250 million. These rules also permit us to include as qualifying assets certain follow-on investments in companies that were eligible portfolio companies at the time of initial investment but that no longer meet the definition of eligible portfolio company at the time of the follow-on investment.
Revenues
We generate revenue primarily in the form of interest on the debt securities of portfolio companies that we acquire and hold for investment purposes. Our investments in debt securities generally have an expected maturity of three to ten years, although we have no lower or upper constraint on maturity, and we typically earn interest at a fixed or floating rate. Interest on our debt securities is generally payable to us quarterly or semi-annually. In some cases, our debt investments feature payment-in-kind provisions where earned interest results in the increase in the outstanding balance of the investment and there may be partial or no cash payments for accrued interest. Any outstanding principal amount of our debt securities and any accrued but unpaid interest will generally become due at the maturity date. In addition, we may generate revenue in the form of prepayment fees, commitment fees, origination fees, and payments from loan arrangement agents and our Advisors in connection with our lending activities, and fees for providing significant managerial assistance. While the reference assets underlying the total return swap agreements generate interest income and fees, such amounts, net of the financing amounts we pay quarterly to the TRS counterparty, are recorded as realized gains pursuant to GAAP when payable to us.
Operating Expenses
Our primary operating expenses include the payment of a base management fee and, depending on our operating results, performance-based incentive fees, reimbursable expenses under the investment advisory agreement, interest expense and financing fees, amortization of deferred offering expenses, fund administrative expenses, and third-party expenses incurred under the administrative services agreement and custody/accounting agreements. The base management fee and performance-based incentive fees compensate the Advisors for their efforts and resources in identifying, evaluating, negotiating, closing and monitoring our investments. We bear all other costs and expenses of our operations and investment transactions.
51
FINANCIAL AND OPERATING HIGHLIGHTS
| ($ in millions except per share data) | ||||
|
|
||||
| At September 30, 2013 |
||||
|
|
|
|
||
| Total consolidated assets |
$ | 1,808.47 | ||
| Adjusted total assets (Total consolidated assets net of payable for investments purchased) |
$ | 1,782.35 | ||
| Investment in portfolio companies |
$ | 1,666.06 | ||
| Borrowings - credit facilities |
$ | 506.43 | ||
| Borrowings - TRS deemed senior securities |
$ | 3.48 | ||
| Net assets |
$ | 1,257.84 | ||
| Average net assets |
$ | 919.58 | ||
| Average credit facility borrowings |
$ | 251.70 | ||
| Net asset value per share |
$ | 9.92 | ||
| Leverage ratio (Borrowings/Adjusted total assets) as of September 30, 2013 |
29% | |||
| Weighted average asset coverage ratio (nine months ended September 30, 2013) |
3.77 | |||
| Portfolio Activity for the Nine Months Ended September 30, 2013 |
||||
|
|
|
|
||
| Cost of investments purchased |
$ | 1,443.23 | ||
| Sales, principal payments and paydown proceeds |
$ | 500.41 | ||
| Net investment income |
$ | 30.69 | ||
| Net realized gains on investments, derivative instruments and foreign currency transactions |
$ | 16.21 | ||
| Net change in unrealized appreciation on investments, derivative instruments and foreign currency translation |
$ | 14.71 | ||
| Net increase in net assets from operations |
$ | 61.61 | ||
| Total distributions declared |
$ | 53.80 | ||
| Net investment income before incentive fees per share |
$ | 0.39 | ||
| Net investment income per share |
$ | 0.33 | ||
| Earnings per share |
$ | 0.66 | ||
| Distributions declared per share outstanding for the entire period |
$ | 0.59 | ||
| Common Stock Offering Summary for the Nine Months Ended September 30, 2013 |
||||
|
|
|
|
||
| Gross proceeds |
$ | 676.81 | ||
| Net proceeds to Company |
$ | 641.20 | ||
| Average net proceeds per share |
$ | 9.96 | ||
| Shares issued in connection with common stock offering |
61.62 | |||
BUSINESS ENVIRONMENT
The Federal Reserve’s decision in mid-September to maintain some level of quantitative easing came amid cautionary signs in the U.S. economy including high unemployment, rising mortgage rates, and restrictive fiscal policy. As the majority of investors priced in expectations of a modest tapering of the Fed’s bond buying program, the Federal Reserve’s decision came as a surprise and caused the 10-year Treasury yield to fall, reversing some of the rise in interest rates experienced over the past six months. We believe the next few months will be characterized by a period of continued uncertainty and volatility as was experienced for the first half of 2013.
The uncertainty around future U.S. monetary policy has impacted interest rates and contributed to mixed monthly returns and net fund flows out of the high yield space. In contrast, loan funds, which are less sensitive to changes in interest rates, offered a more attractive value and over the past year have experienced record-setting inflows, primarily from retail investors. This has led to meaningful loan spread compression. As technical dynamics quickly change, fundamentals and robust credit underwriting remain a priority and in the third quarter of 2013 we focused on directly originated transactions. This resulted in a higher percentage of second lien and unsecured loan originations and an increase in our weighted average coupon spread on our floating interest rate loan portfolio.
Despite uncertainty and expected short-term volatility, we maintain our constructive stance on corporate credit based on the underlying fundamentals. Through conducting rigorous due diligence and directly structuring investments we believe we are positioning the portfolio to protect principal and generate attractive risk-adjusted returns. We believe that our flexibility to make investments with a long-term perspective provides us with the opportunity to generate favorable returns on invested capital and expands the types of investments that we may consider.
52
PORTFOLIO AND INVESTMENT ACTIVITY
Portfolio Investment Activity for the Three Months Ended September 30, 2013
The following table summarizes our investment activity for the three months ended September 30, 2013, excluding our short term investments.
| Investment Activity Summary for the Three Months Ended September 30, 2013 ($ in millions) |
||||||||
|
|
||||||||
| Investment Portfolio | TRS Portfolio | |||||||
| Total Fair Value |
$ | 1,666.06 | $ | 57.92 | ||||
| Incremental Investment Activity |
$ | 658.02 | $ | 3.02 | ||||
| Investment Sales |
$ | (133.87 | ) | $ | (31.95 | ) | ||
| No. Portfolio Companies |
111 | 22 | ||||||
| Portfolio Company Additions |
26 | 2 | ||||||
| Portfolio Company Exits |
(13 | ) | (10 | ) | ||||
| No. Debt Investments |
134 | 24 | ||||||
| Debt Investment Additions |
41 | 4 | ||||||
| Debt Investment Exits |
(28 | ) | (12 | ) | ||||
| No. Equity/Other Investments |
2 | — | ||||||
While the Investment Portfolio and the TRS Portfolio are accounted for, and presented as, two distinct portfolios, the two portfolios had 18 debt investment positions and 16 portfolio companies in common as of September 30, 2013. The fair value of our Investment Portfolio, excluding our short term investments, increased by 46% during the three months ended September 30, 2013 primarily due to an increase in Co-Investment Transactions; the fair value of our TRS Portfolio decreased by 58% during the same period, primarily due to continued deletion and liquidation of reference assets in the TRS Portfolio. The utilization of the TRS has declined since March 31, 2013 in order to provide us with additional liquidity with which to fund our Co-Investment Transactions, which cannot serve as TRS reference assets.
The following information consists of additional segmentation analysis of our Investment Portfolio and TRS Portfolio based on asset categories and debt investment characteristics. However, our investment program is not managed with any specific asset category target goals.
The next table summarizes the composition of our Investment Portfolio and our TRS Portfolio based on fair value as of September 30, 2013, excluding our short term investments.
| Fair Value Summary as of September 30, 2013 ($ in thousands) | ||||||||||||||||
| Asset Category | Investment Portfolio at Fair Value |
Percentage of Investment Portfolio |
TRS Portfolio at Fair Value |
Percentage of TRS Portfolio |
||||||||||||
| Senior debt securities: |
||||||||||||||||
| First lien |
$ | 597,903 | 35.9 | % | $ | 25,736 | 44.4 | % | ||||||||
| Second lien |
557,994 | 33.5 | 11,126 | 19.2 | ||||||||||||
| Secured bonds |
42,685 | 2.5 | 7,211 | 12.5 | ||||||||||||
|
|
|
|
|
|
|
|
|
|||||||||
| Total senior debt securities |
1,198,582 | 71.9 | 44,073 | 76.1 | ||||||||||||
| Subordinated debt securities |
446,804 | 26.8 | 13,848 | 23.9 | ||||||||||||
|
|
|
|
|
|
|
|
|
|||||||||
| Total debt securities |
1,645,386 | 98.7 | 57,921 | 100.0 | ||||||||||||
| Common stock |
690 | 0.1 | — | — | ||||||||||||
| Equity options |
19,987 | 1.2 | — | — | ||||||||||||
|
|
|
|||||||||||||||
| Total |
$ | 1,666,063 | 100.0 | % | $ | 57,921 | 100.0 | % | ||||||||
|
|
|
|
|
|
|
|
|
|||||||||
53
The next table summarizes the composition of our Investment Portfolio based on amortized cost and the TRS Portfolio based on notional amount as of September 30, 2013. The primary investment concentrations include (i) senior debt and (ii) subordinated debt securities. The debt investments in our Investment Portfolio were purchased at an average price of 97.9% of par value.
| Investment Portfolio Cost and TRS Notional Amount Summary as of September 30,
2013 ($ in thousands) |
||||||||||||||||
| Asset Category | Investment Portfolio at Amortized Cost |
Percentage of Investment Portfolio |
TRS Portfolio at Notional Amount |
Percentage of TRS Portfolio |
||||||||||||
| Senior debt securities: |
||||||||||||||||
| First lien |
$ | 590,799 | 36.0 | % | $ | 25,808 | 44.1 | % | ||||||||
| Second lien |
549,961 | 33.5 | 11,129 | 19.0 | ||||||||||||
| Secured bonds |
41,823 | 2.6 | 7,105 | 12.2 | ||||||||||||
|
|
|
|
|
|
|
|
|
|||||||||
| Total senior debt securities |
1,182,583 | 72.1 | 44,042 | 75.3 | ||||||||||||
| Subordinated debt securities |
438,696 | 26.7 | 14,460 | 24.7 | ||||||||||||
|
|
|
|
|
|
|
|
|
|||||||||
| Total debt securities |
1,621,279 | 98.8 | 58,502 | 100.0 | ||||||||||||
| Common stock |
449 | 0.0 | — | — | ||||||||||||
| Equity options |
20,013 | 1.2 | — | — | ||||||||||||
|
|
|
|
|
|
|
|
|
|||||||||
| Total |
$ | 1,641,741 | 100.0 | % | $ | 58,502 | 100.0 | % | ||||||||
|
|
|
|
|
|
|
|
|
|||||||||
The next table presents a summary of interest rate and maturity statistics for the debt investments, based on par value, in our Investment Portfolio and the TRS Portfolio as of September 30, 2013.
|
|
Investment Portfolio as of | TRS Portfolio as of | ||||||
| Floating interest rate debt investments: |
September 30, 2013 |
December 31, 2012 |
September 30, 2013 |
December 31, 2012 | ||||
| Percent of portfolio |
60.8% | 57.8% | 50.0% | 74.2% | ||||
| Percent of floating rate debt investments with interest rate floors |
93.7% | 87.3% | 100.0% | 87.0% | ||||
| Weighted average interest rate floor |
1.2% | 1.3% | 1.2% | 1.2% | ||||
| Weighted average coupon spread |
722bps | 595bps | 553bps | 433bps | ||||
| Weighted average years to maturity |
5.5 | 5.2 | 4.9 | 5.8 | ||||
|
|
||||||||
| Fixed interest rate debt investments: |
||||||||
| Percent of portfolio |
39.2% | 42.2% | 50.0% | 25.8% | ||||
| Weighted average coupon rate |
10.1% | 9.5% | 7.7% | 8.3% | ||||
| Weighted average years to maturity |
6.0 | 5.6 | 6.9 | 7.0 | ||||
All of our floating interest rate debt investments have index reset frequencies of less than twelve months with the majority resetting at least quarterly. The three-month LIBOR, the most prevalent index employed among our floating interest rate debt investments, ranged between 0.248% and 0.274% during the three months ended September 30, 2013 and the terminal value was 0.249% on September 30, 2013.
The number of debt investment positions that feature payment-in-kind (PIK) for some or all of the borrowers’ interest payment obligation has increased to 10 debt investments as of September 30, 2013, or 13.5% of our Investment Portfolio. Of these, six borrowers have elected to use their PIK option, or 10.6% of our investment portfolio as of September 30, 2013 as measured at estimated fair value. We estimate that PIK represents approximately 16% of the estimated future coupon payments over the next 12 months associated with all debt investments in our Investment Portfolio as of September 30, 2013, not including coupon payments of reference assets that are associated with the TRS.
As discussed above in the overview of our Investment Program, we noted the increasing focus on originated debt investments, including Co-Investment Transactions, as a main element of the investment strategy at the present time. In the third quarter ending September 30, 2013, the following highlights are associated with this investment focus on originated debt investments:
54
| • | A total of six investments which together represent $333.23 million at original cost were directly originated in the three months ended September 2013, which was approximately 50.6% of total investment activity for the quarter. Five of these originated investments were classed as Co-Investment Transactions as defined under the SEC exemptive relief provisions, representing $291.04 million of invested capital at original cost. The average originated deal size, based on original cost and measured at the portfolio company level, was $55.54 million as compared to an average of $12.26 million for all other portfolio companies held in our Investment Portfolio. |
| • | In total we have invested $382 million in originated investments which now represent 22.9% of our total Investment Portfolio as of September 30, 2013, as compared to 4.1% at June 30, 2013, as measured on the basis of estimated fair value. |
| • | The investment diversification and concentration characteristics of our Investment Portfolio have shifted; our average amount invested per portfolio company has increased to $15.1 million as of September 30, 2013, up from $5.6 million as of December 31, 2012, as measured on the basis of estimated fair value, while the number of Portfolio company positions has decreased from 126 as of December 31, 2012 to 111 as of September 30, 2013. |
| • | The fair valuation leveling has shifted in our Investment Portfolio, whereby as of September 30, 2013, 33.1% of our total Investment Portfolio at fair value relied on unobservable valuation inputs (i.e. Level 3) , as compared to 13.1% classified as Level 3 as of December 31, 2012. |
| • | A third credit facility was added in the three months ended September 30, 2013 in the initial amount $285 million of committed borrowing capacity which will enable us to borrow investment capital to invest alongside our equity capital in the investment program that is focused on originated transactions. |
As of September 30, 2013, our Investment Portfolio of 111 portfolio companies was diversified across 20 industry classifications, as compared to our Investment Portfolio as of December 31, 2012 that consisted of 126 portfolio companies diversified across 23 distinct industry classifications. As of September 30, 2013, the TRS Portfolio consisted of 22 portfolio companies diversified across 10 distinct industry classifications, as compared to our TRS Portfolio as of December 31, 2012 that consisted of 47 portfolio companies diversified across 18 distinct industry classifications. The next table presents a diversification summary of our Investment Portfolio and TRS Portfolio arranged by industry classifications at September 30, 2013 and December 31, 2012.
|
|
Investment Portfolio as of | TRS Portfolio as of | ||||||||||||||
| Industry Classification |
September 30, 2013 | December 31, 2012 | September 30, 2013 | December 31, 2012 | ||||||||||||
| Consumer Durables & Apparel |
13.5% | 1.0% | — % | 0.9% | ||||||||||||
| Retailing |
12.2 | 9.2 | 6.1 | 2.6 | ||||||||||||
| Software & Services |
10.8 | 9.1 | 14.6 | 15.6 | ||||||||||||
| Capital Goods |
7.9 | 13.7 | 6.8 | 15.0 | ||||||||||||
| Media |
7.3 | 11.0 | 7.4 | 13.8 | ||||||||||||
| Health Care Equipment & Services |
7.2 | 6.2 | 4.4 | 7.7 | ||||||||||||
| Materials |
6.9 | 9.9 | 17.0 | 3.7 | ||||||||||||
| Insurance |
6.9 | 6.2 | — | 1.8 | ||||||||||||
| Technology Hardware & Equipment |
6.8 | 7.8 | 17.0 | 2.4 | ||||||||||||
| Food, Beverage & Tobacco |
5.8 | 1.3 | — | — | ||||||||||||
| Energy |
3.7 | 0.9 | — | 1.1 | ||||||||||||
| Telecommunication Services |
3.4 | 4.1 | 8.4 | 8.2 | ||||||||||||
| Food & Staples Retailing |
2.1 | 1.9 | — | 2.6 | ||||||||||||
| Remaining Industries |
5.5 | 17.7 | 18.3 | 24.6 | ||||||||||||
|
|
|
|
|
|
|
|
|
|||||||||
| Total |
100.0% | 100.0% | 100.0% | 100.0% | ||||||||||||
|
|
|
|
|
|
|
|
|
|||||||||
Our Investment Portfolio may contain loans that are in the form of lines of credit, unfunded delayed draw loan commitments or revolving credit facilities, which require us to provide funding when requested by portfolio companies in accordance with the terms of the underlying loan agreements. As of September 30, 2013, we had five unfunded loan commitments (four portfolio companies) that totaled $69.34 million. We maintain sufficient liquidity in the form of cash on hand, cash proceeds from unsettled liquidated investments, and borrowing capacity under our revolving credit facilities to fund such unfunded loan commitments should the need arise.
We neither “control” nor are we an “affiliated person” (each as defined in the 1940 Act) of any of our portfolio companies. Under the 1940 Act, we generally would be presumed to “control” a portfolio company if we own beneficially, either directly or through one or more controlled companies, 25% or more of its voting securities; and generally would be an “affiliated person” of a portfolio company if we directly or indirectly own or otherwise control 5% or more of its voting securities.
55
LIQUIDITY AND CAPITAL RESOURCES
Offering of Common Stock
On June 23, 2010, we filed our Registration Statement with the SEC to register the Initial Offering. The Initial Offering, which relates to the offer and sale on a continuous basis of up to 150 million of shares of common stock, commenced on April 4, 2011 when the Registration Statement was declared effective. We raised net proceeds of $234.51 million and $641.19 million during the three and nine months ending September 30, 2013, respectively. As of September 30, 2013, we have raised net proceeds of $1,250.33 million through the sale of 127.12 million shares of common stock since we commenced our Offering, including the reinvestment of distributions into shares of our common stock. On June 21, 2013, we filed a registration statement in connection with the Follow-On Offering of a maximum of 200 million additional shares to be offered between late 2013 and 2016. The Follow-On Offering registration statement was declared effective by the SEC on November 1, 2013.
Credit Facilities
We borrow funds to invest alongside the equity capital proceeds of our Initial Offering and Follow-On Offering to increase our investment positions in portfolio companies and to further diversify the number of portfolio company investment positions. We may issue “senior securities,” including borrowing money from banks or other financial institutions only in amounts such that our asset coverage, as defined in the 1940 Act, equals at least 200% after such borrowing incurrence or issuance of our corporate debt securities, if any.
Deutsche Bank Credit Facility
In 2011, our wholly-owned special purpose financing subsidiary CCT Funding LLC (“CCT Funding”) entered into a revolving credit facility agreement as amended, the “Deutsche Bank Credit Facility”) with Deutsche Bank AG, New York Branch (“Deutsche Bank”). At the time CCT Funding initially entered into the Deutsche Bank Credit Facility, Deutsche Bank was the sole initial lender. On February 11, 2013, CCT Funding, Deutsche Bank and a second lender entered into an amendment (the “Third Amendment”) to the Deutsche Bank Credit Facility. The Third Amendment amended the Deutsche Bank Credit Facility by providing for, among other things, the extension of a new tranche of loan commitments (the “Tranche D Loans”) permitting additional borrowings in an aggregate amount of up to $100.00 million. Pursuant to the Third Amendment, Healthcare of Ontario Pension Plan became a Lender under the Deutsche Bank Credit Facility.
CCT Funding has appointed us to manage its investment portfolio pursuant to the terms of an investment management agreement. CCT Funding’s obligations to the lenders under the Deutsche Bank Credit Facility are secured by a first priority security interest in substantially all of the assets of CCT Funding. The obligations of CCT Funding under the revolving credit facility are non-recourse to us. Approximately 30% of our total Investment Portfolio, including money market investments, was held as collateral at CCT Funding under the Deutsche Bank Credit Facility as of September 30, 2013.
During the three months ended September 30, 2013, the Tranche A Loans matured and were repaid in full. The Deutsche Bank Credit Facility currently provides for borrowings in an aggregate amount up to $265.00 million. We have incurred costs of $1.34 million in connection with arranging and amending the Deutsche Bank Credit Facility, primarily consisting of upfront commitment and legal fees. We have recorded these costs as deferred financing costs on our condensed consolidated statement of assets and liabilities and we amortize these costs to interest expense over the life of the credit facility. As of September 30, 2013, $0.71 million of such deferred financing costs had yet to be amortized to interest expense.
As of September 30, 2013, $65.00 million was borrowed and outstanding as Tranche B1 Loans, $100.00 million was borrowed and outstanding as Tranche B2 Loans and $94.44 million was borrowed and outstanding as Tranche D loans. The unused commitment balance was $0.56 million under the Tranche D Loans commitments. For the three months and nine months ending September 30, 2013, our all-in cost of financing for the Deutsche Bank Credit Facility, including fees and expenses, was 2.76% and 2.68%, respectively.
BNP Credit Facility
On June 4, 2013, we entered into a committed facility arrangement (the “BNP Credit Facility”), which became effective on June 12, 2013, with BNP Paribas Prime Brokerage, Inc. (“BNP”) under which we may borrow up to $200 million. On August 29, 2013 we assigned the agreements under the BNP Credit Facility to Paris Funding LLC (“Paris Funding”), our newly created wholly-owned special purpose financing subsidiary. The BNP Credit Facility is secured by certain assets in our portfolio that have been pledged as collateral. The amount of assets that we are required to pledge is determined in accordance with the margin requirements of the BNP Credit Facility. Approximately 16% of our total
56
Investment Portfolio, including money market investments, was pledged as collateral under the BNP Credit Facility as of September 30, 2013. Interest is charged at the annual rate of one month LIBOR plus 1.10% and is payable monthly. We also pay an annual commitment fee of 0.55% on any unused commitment amounts. If, at any date after December 30, 2013, the outstanding debt financing under the BNP Credit Facility is less than 80% of BNP’s total commitment amount, then the annual commitment fee on any unused commitment amounts will increase from 0.55% to 0.75%.
As of September 30, 2013, $125.00 million was borrowed and outstanding under the BNP Credit Facility. For the three months and nine months ending September 30, 2013, our all-in cost of financing for the BNP Credit Facility, including fees and expenses, was 2.25% and 2.27%, respectively. We have incurred costs of $0.48 million in connection with arranging the BNP Credit Facility, primarily consisting of upfront commitment and legal fees. We have recorded these costs as deferred financing costs on our condensed consolidated statement of assets and liabilities and we amortize these costs to interest expense over the initial term of the credit facility. As of September 30, 2013, $0.34 million of such deferred financing costs had yet to be amortized to interest expense.
Senior Secured Credit Facility
On September 4, 2013 (the “Closing Date”), we entered into a senior secured revolving credit agreement (the “Senior Secured Credit Agreement”) with certain lenders and JPMorgan Chase Bank, N.A. (“JPMorgan”), acting as as administrative agent. The Senior Secured Credit Agreement provides for a revolving credit facility (the “Senior Secured Credit Facility”) consisting of loans to be made in dollars and other foreign currencies in an initial aggregate amount of $285 million. The Senior Secured Credit Facility includes an “accordion” feature that allows us, under certain circumstances, to increase the size of the facility to a maximum of $600 million.
The Senior Secured Credit Facility is secured by substantially all of our portfolio investments and our cash and securities accounts excluding those held by our subsidiaries, and provides for a guaranty by certain of our subsidiaries. Borrowings under the Senior Secured Credit Facility are subject to compliance with a borrowing base that applies different advance rates to different types of assets in our portfolio. The stated borrowing rate under the Senior Secured Credit Facility is based on LIBOR plus an applicable spread of 2.50%, or on an “alternate base rate” (which is the highest of a prime rate, the federal funds rate plus 0.50%, or one-month LIBOR plus 1.00%) plus an applicable spread of 1.50%, or, with respect to borrowings in non-LIBOR currencies, on a rate applicable to such currency plus an applicable spread of 2.50%. We also pay an annual commitment fee on any unused commitment amounts of between 0.375% and 1.00%, which varies depending on total utilization.
As of September 30, 2013, $116.99 million was borrowed and outstanding under the Senior Secured Credit Facility, including $106.99 million of foreign currency borrowings. We have incurred costs of $3.75 million in connection with arranging the Senior Secured Credit Facility, primarily consisting of upfront commitment and legal fees. We have recorded these costs as deferred financing costs on our condensed consolidated statement of assets and liabilities and we amortize these costs to interest expense over the initial term of the credit facility. As of September 30, 2013, $3.68 million of such deferred financing costs had yet to be amortized to interest expense.
As of September 30, 2013, the ratio of total credit facility borrowings-to-adjusted total assets was 28%. (Adjusted total assets is equal to total consolidated assets excluding payable for investments purchased.) We will continue to draw on the revolving credit facilities and combine borrowed funds with equity capital to increase and expand our investment positions in portfolio companies. Additionally, we may further increase the aggregate borrowing commitment in the future beyond the current amount of $750.00 million that is available to us from our revolving credit facilities, and/or we may add additional credit arrangements. See “Note 11 Revolving Credit Facilities and Borrowings” in our condensed consolidated financial statements for additional disclosures regarding our credit facilities.
Total Return Swaps
On November 15, 2012, Halifax Funding LLC, (“Halifax Funding”) our wholly-owned, special purpose financing subsidiary, entered into a TRS arrangement with The Bank of Nova Scotia (“BNS”). Our TRS arrangement with BNS consists of a set of agreements (namely, an ISDA 2002 Master Agreement, together with the Schedule thereto and Credit Support Annex to such Schedule, by and between Halifax Funding LLC and BNS, and a Confirmation Letter Agreement by and between Halifax Funding and BNS, and a tri-party custodian agreement (the “BNS Custodian Agreement”) between Halifax Funding and BNS and The Bank of Nova Scotia Trust Company of New York (“BNS Trust”), each dated as of November 15, 2012), and are collectively referred to herein as the TRS Agreements. Under the terms of the TRS Agreements, each reference asset in the TRS portfolio constitutes a separate total return swap transaction, although all calculations, payments and transfers required to be made under the TRS are calculated and treated on an aggregate basis, based upon all such transactions.
Effective July 22, 2013, BNS Trust resigned as custodian in connection with the TRS, and the BNS Custodian Agreement was terminated without any early termination penalties incurred by us or Halifax Funding. The resignation of BNS Trust was made in connection with broader decision by BNS to discontinue its custody business operations in the
57
United States. In connection with the termination of the BNS Custodian Agreement, Halifax Funding and BNS entered into a Control Agreement dated as of July 22, 2013 (the “Control Agreement”) with State Street Bank and Trust Company, as custodian (the “Custodian”). Pursuant to an amendment to the TRS, the Custodian succeeds BNS Trust as the custodian in connection with the TRS.
Pursuant to the terms of the TRS Agreements, Halifax Funding may select single-name corporate loans and bonds and create a TRS portfolio with a maximum aggregate notional amount of $500.00 million. Halifax Funding is required to initially collateralize a specified percentage of each loan or bond (generally, at least 40% of the notional amount of such loan or bond) in accordance with margin requirements stipulated in the TRS Agreements.
Pursuant to Halifax Funding’s limited liability company operating agreement, we act as the manager of Halifax Funding and exercise Halifax Funding’s rights under the TRS, including selecting the specific loans or bonds to be included in, or deleted from, the TRS Portfolio. The loans and/or bonds selected by Halifax Funding for purposes of inclusion in the TRS Portfolio are selected by us in accordance with our investment objective. Each selected loan or bond, and the TRS Portfolio taken as a whole, must also meet criteria described in the TRS Agreements. BNS, as calculation agent, determines whether each loan or bond complies with the TRS portfolio criteria. Halifax Funding receives quarterly from BNS all collected interest and fees from the portfolio of TRS reference assets. Halifax Funding pays to BNS interest at a rate equal to the three-month LIBOR+0.80% per annum if the initial investment amount (i.e., posted collateral) equals or exceeds 50% of the notional amount, or three-month LIBOR+1.00% if the initial investment amount is less than 50% of the TRS notional amount. In addition, upon the sale or repayment of any TRS reference asset, Halifax Funding will either receive from BNS the realized gain in the value of such reference asset relative to its notional amount, or pay to BNS any realized loss in the value of the reference asset relative to its notional amount. The required amount of collateral may exceed 50% of the notional amount in the event that reference asset(s) or groupings of assets exceed certain portfolio concentration thresholds. As of September 30, 2013, the posted collateral equals 94% of the total notional amount, as compared to 54% as of December 31, 2012. The increase in the amount of posted collateral in relation to the total notional amount is due to concentration thresholds that have been exceeded as the reference assets have been deleted from the TRS Portfolio.
Under the terms of the TRS Agreements, Halifax Funding may be required to post additional collateral, on a dollar-for-dollar basis, in the event of depreciation in the value of the portfolio of TRS reference assets after such value decreases below a specified amount. The minimum additional collateral that Halifax Funding is required to post pursuant to the TRS Agreements is equal to the amount required to ensure that the value of the TRS credit support is equal to 25% of the value of the TRS Portfolio.
The obligations of Halifax Funding under the TRS Agreements are non-recourse to us and our exposure under the TRS Agreements is limited to the amount of collateral that is posted pursuant to the terms of the TRS Agreements. We have no contractual obligation to post any collateral or to make any payments on behalf of Halifax Funding to BNS. We may, but are not obligated to, increase our equity capital investment in Halifax Funding for the purpose of funding any additional collateral or payment obligations for which Halifax Funding may become obligated during the term of the TRS Agreements. If we do not make any such additional equity capital investment in Halifax Funding and Halifax Funding fails to meet its obligations under the TRS Agreements, then BNS will have the right to terminate the TRS Agreements and seize the collateral posted by Halifax Funding. In the event of an early termination of the TRS, Halifax Funding would be required to pay an early termination fee.
All collateral required to be posted under the TRS Agreements is held in the custody of the Custodian. The Custodian will maintain and perform certain custodial services with respect to the collateral pursuant to the Control Agreement among us, Halifax Funding, BNS, and the Custodian. The Control Agreement and the obligations of the Custodian will continue until BNS has notified the Custodian in writing that all obligations of the Halifax Funding under the TRS Agreements have been satisfied.
In connection with the TRS Agreements, Halifax Funding has made customary representations and warranties and is required to comply with various covenants, financial reporting requirements and other customary requirements for similar facilities. In addition to customary events of default and termination events, the TRS Agreements contain the following additional termination events, among others: (a) the occurrence of an event that materially and adversely affects us and that BNS reasonably believes could also materially impair Halifax Funding’s ability to perform its obligations under the TRS Agreements; (b) a regulatory or judicial authority’s initiation of a proceeding for financial fraud or criminal wrongdoing against us that is reasonably likely to adversely impact the risk profile of an investment in or loan to Halifax Funding; (c) specified material reductions in Halifax Funding’s net asset value, including if, at any time, such net asset value declines to less than 50% of its net asset value in effect either as of the last day of the preceding calendar year or as of the date of the TRS Agreements; (d) Halifax Funding’s material amendment to, or material failure to comply with, its investment strategies or restrictions, to the extent that, in light of such amendment or non-compliance, BNS reasonably expects Halifax Funding to be unable to observe its obligations under the TRS Agreements; and (e) if, at any time, out of a group of seven specifically
58
identified key KKR personnel, fewer than four continue to be partners, members, directors or employees of KKR or serve investment or risk assessment roles in respect of KKR. Additionally, on November 12, 2013, Halifax Funding and BNS amended the TRS Agreements to add, among other revisions, an additional termination event, namely the incurrence by Halifax Funding of any indebtedness or financial obligation exceeding $2.50 million.
For purposes of the asset coverage ratio test applicable to us under the 1940 Act as a business development company, we treat the difference between (i) the TRS notional amount, and (ii) the actual amount of cash collateral posted by Halifax Funding under the TRS, as a senior security for the life of the TRS Agreements. Further, for purposes of determining our compliance with the 70% qualifying asset requirement of Section 55(a) under the 1940 Act, we treat a TRS reference asset as a qualifying asset if the obligor associated with the TRS reference asset is an eligible portfolio company and as a non-qualifying asset if the obligor is not an eligible portfolio company.
Distributions Paid and Declared
We pay our monthly distributions in the form of cash. Shareholders may elect to reinvest their distributions as additional shares of our common stock under our distribution reinvestment plan. Any distributions reinvested under our distribution reinvestment plan remain taxable to the U.S. shareholder.
The following table reflects the cash distributions per share and the total amount of distributions that we have declared on our common stock during the three and nine months ended September 30, 2013:
| Per Share | Amount ($ millions) |
|||||||
| For the three months ended September 30, 2013 |
$ 0.195052 | $ | 22.26 | |||||
| For the nine months ended September 30, 2013 |
0.585156 | 53.80 | ||||||
Approximately 51% of the distributions we paid in the nine-month period ended September 30, 2013 were reinvested in shares of our common stock at the prevailing net offering price per share at the time of distribution payments and represent an additional source of capital to invest in portfolio companies. See Note 8 to the condensed consolidated financial statements for a discussion of the sources of distributions on a GAAP basis. Paid distributions that exceed taxable income available for distributions are recorded as a return of capital to our shareholders and that final determination is conducted after the end of the calendar year. The next table presents potential additional sources of taxable income available for distributions, estimated as of September 30, 2013; events subsequent to September 30, 2013 may materially alter the year-end book-tax adjustments that ultimately determine the sources of required and paid distributions.
| For the nine months ended September 30, 2013 |
Amount ($ millions) |
|||
| Ordinary income component of tax basis accumulated earnings |
$ | 0.82 | ||
| Deferred loan fees recognized as taxable income |
1.93 | |||
| Estimated unearned performance-based incentive fees |
3.54 | |||
| Offering expenses |
4.49 | |||
| Net change in unrealized depreciation on total return swaps |
(0.51 | ) | ||
| Net change in unrealized depreciation on foreign currency forward contracts |
(2.95 | ) | ||
|
|
|
|||
| Total of other sources available for distributions (1) |
$ | 7.32 | ||
|
|
|
|||
| (1) The above table does not present all adjustments to calculate taxable income available for distributions. The final determination of taxable income, as well as the tax classifications of the 2013 calendar year paid distributions, is made annually at the end of the year. See Note 8 to the condensed consolidated financial statements. |
We estimate that 100% of our distributions paid in the nine months ended September 30, 2013 were covered by estimated taxable income available for distributions. We routinely disclose the sources of paid distributions to our shareholders on periodic reports that accompany (i) quarterly account statements and (ii) monthly distribution checks that are prepared and sent directly by our transfer agent to our shareholders. We do not expect to use equity capital or borrowed funds to pay distributions to shareholders nor do we expect our shareholders to incur a return of capital on a tax basis in connection with paid distributions in 2013.
On September 24, 2013, our board of directors declared a distribution of $0.015004 per share for nine record dates beginning October 2, 2013 and ending on November 26, 2013. The distributions will be paid to shareholders at the end of each month.
RESULTS OF OPERATIONS
RESULTS COMPARISONS FOR THE THREE MONTHS ENDED SEPTEMBER 30, 2013 AND 2012
Set forth below are our results of operations for the three months ended September 30, 2013 and September 30, 2012. The growth of our Investment Portfolio since September 30, 2012 is primarily due to the increase in equity capital from
59
our Initial Offering, and this increase in both (i) capital available for investment, including borrowed funds, and (ii) investment activity contributed to significant increases in investment income, operating expenses, net investment income and net assets between the comparative periods, as discussed below.
Investment income
Investment income for the three months ended September 30, 2013 and 2012 was $35.54 million and $11.48 million, respectively. The largest component of investment income was interest income of $29.10 million and $11.22 million for the three months ended September 30, 2013 and 2012, respectively. The increase in interest income is due primarily to the growth of our Investment Portfolio over the last year. Incremental amounts of equity capital that we received as net proceeds from our Initial Offering on a weekly basis were deployed throughout the three-month period ended September 30, 2013 in the acquisition of investment securities issued by portfolio companies. We also generated fee income of $6.43 million during the three months ended September 30, 2013, earned as structuring service fees in connection with Co-Investment Transactions. We earned fee income of $0.26 million during the three months ended September 30, 2012. We expect our Investment Portfolio to continue to grow during the remainder of 2013 and into 2014 and, accordingly, we believe that reported investment income for the three months ended September 30, 2013 is not representative of our stabilized performance or our future performance. We expect further increases in investment income in future periods due to (i) an increase in our weighted average coupon spread that has resulted from our recent focus on Co-Investment Transactions, (ii) a growing base of investments in portfolio companies that we expect to result from the expected increases in equity capital available to us for investment purposes from our Follow-On Offering and (iii) additional structuring service fees that may be earned on Co-Investment Transactions. The interest income earned by the TRS reference assets is not included in investment income in the condensed consolidated statements of operations, but rather it is included in the fair value of the TRS, and eventually recorded as part of realized gain or loss on derivative instruments in connection with quarterly TRS settlement payments.
Operating expenses
Our total operating expenses were $19.81 million and $6.38 million for the three months ended September 30, 2013 and 2012, respectively. Our operating expenses included $8.10 million and $2.70 million in base management fees attributed to the investment advisory services of our Advisors for the three months ended September 30, 2013 and 2012, respectively. Our Advisors are also eligible to receive incentive fees based on performance. We recorded performance-based incentive fee expense of $5.89 million and $1.39 million for the three months ended September 30, 2013 and 2012, respectively. The performance-based incentive fee expense for the three months ended September 30, 2013 was comprised of subordinated incentive fees on income of $1.71 million and incentive fees on capital gains of $4.18 million. The performance-based incentive fee expense for the three months ended September 30, 2012 was comprised entirely of incentive fees on capital gains. The incentive fees on capital gains were directly attributable to our net realized and unrealized gains of $19.05 million and $6.88 million in the three months ended September 30, 2013 and 2012, respectively, since our accrual for incentive fees on capital gains tracks the overall changes in our realized and unrealized gains (losses). As discussed in “Note 6. Agreements and Related Party Transactions” in our condensed consolidated financial statements, the calculation of performance-based incentive fees disregards any net realized and unrealized gains associated with the TRS interest spread. See the Results Comparisons for the Nine Months Ended September 30, 2013 and 2012 for a discussion of whether the cumulative performance-based incentive fees were earned and payable to our Advisors.
The following table illustrates the calculation of the income incentive fee for the three months ending September 30, 2013:
| For the three months ended September 30, 2013 |
||||||||
| Amount | Percent of Average Adjusted Capital |
|||||||
| Average Adjusted Capital |
$ | 1,128.54 | ||||||
| Net Investment Income |
$ | 15.73 | ||||||
| Add Back: Performance-Based Incentive Fees |
5.89 | |||||||
|
|
|
|||||||
| Pre-Incentive Fees Net Investment Income |
21.62 | 1.91% | ||||||
| Catch-Up Subordinated Incentive Fees on Income |
(1.71 | ) | (0.15)% | |||||
|
|
|
|
|
|||||
| Preference Return to Shareholders (Net Investment Income) (1) |
$ | 19.91 | 1.76% | |||||
|
|
|
|
|
|||||
(1) Preference return rate is 1.7644% = 7%*(92 days/365 days)
We recorded interest expense of $2.21 million and $0.92 million for the three months ended September 30, 2013 and 2012, respectively, primarily in connection with borrowings under our revolving credit facilities. The increase in interest
60
expense is primarily attributable to the increase in our weighted average debt outstanding to $318.92 million during the three months ended September 30, 2013 as compared to $135.85 million during the three months ended September 30, 2012.
Our other operating expenses for the three months ended September 30, 2013 and 2012 include $1.85 million and $0.40 million in offering expense, $0.56 million and $0.35 million in administrative services expenses, $0.31 million and $0.20 million in professional services expense, $0.14 million and $0.06 million in custodian and accounting fees, $0.10 million and $0.04 million in director fees and expenses and $0.65 million and $0.32 million in other expenses, respectively.
As our asset base and number of shareholders have grown, our general and administrative expenses have increased accordingly, but at a slower rate compared to the growth rate in the asset base. We expect certain variable operating expenses to continue to increase due to the anticipated growth in the size of our asset base and the number of active shareholder accounts. During the three months ended September 30, 2013, the annualized ratio of core operating expenses (excluding investment advisory fees, interest expense, organization and offering expenses, and including net expense support) to average net assets was 0.62%, as compared to 1.91% for the three months ended September 30, 2012. The annualized ratio of core operating expenses to average net assets for the three months ended September 30, 2012 is the result of our accrual of $0.80 million for probable reimbursement of the Advisors’ Expense Support Payments (as defined and discussed below under “—Contractual Obligations —Expense Support Agreement”). Incentive fees and interest expense, among other things, may also increase or decrease our overall operating expenses and expense ratios relative to comparative periods depending on portfolio performance, an increase or reduction in borrowed funds, and changes in LIBOR base interest rates, among other factors.
Expense Support Payments and Reimbursement Payments - We accrued $0.80 million as probable Reimbursement Payment obligation for the three months ended September 30, 2012. The provisions of the Expense Support Agreement that provide for Expense Support Payments from the Advisors to us were not extended beyond June 30, 2012, and therefore there were no Expense Support Payments from the Advisors for the three months ended September 30, 2013. Additionally, we paid $1.83 million and accrued $1.14 million for the three months ended March 31, 2013 as probable Reimbursement Payment obligation relative to the cumulative Expense Support Payments of $2.97 million. Accordingly, our payments and accrual of Reimbursement Payments equals 100% of cumulative Expense Support Payments as of September 30, 2013 and there were no further accruals of Reimbursement Payments during the three months ended September 30, 2013. (See “—Contractual Agreements, —Expense Support Agreement,” below for further details about the Expense Support Agreement. Also see “Note 6. Agreements and Related Party Transactions” included within our condensed consolidated financial statements for additional disclosures regarding the Expense Support Payments and Reimbursement Payments.)
Net investment income
Our net investment income totaled $15.73 million ($0.14 per share) and $4.30 million ($0.11 per share) for the three months ended September 30, 2013 and 2012, respectively. The primary drivers of variation in net investment income per share are (i) variations in performance-based incentive fees and (ii) the accrual of expense support reimbursement payments from Advisors in the three months ended September 2012. The table below shows net investment income and net investment income per share for the three months ended September 30, 2013 and 2012, before the effects of unearned performance-based incentive fees and expense support, which we refer to as adjusted net investment income (non-GAAP).
| For the three months ended September 30, ($ millions) | ||||||||||
| 2013 | 2012 | |||||||||
| Net Investment Income (GAAP) |
$ | 15.73 | $ | 4.30 | ||||||
| Estimated unearned performance-based incentive fees |
3.41 | 1.39 | ||||||||
| Reimbursement of expense support |
- | 0.80 | ||||||||
|
|
|
|
|
|||||||
| Adjusted Net Investment Income (non-GAAP) |
$ | 19.14 | $ | 6.49 | ||||||
|
|
|
|
|
|||||||
| Net Investment Income Per Share |
$ | 0.14 | $ | 0.11 | ||||||
| Adjusted Net Investment Income Per Share |
$ | 0.17 | $ | 0.17 | ||||||
Net realized gain
We sold investments and received principal payments of $133.87 million and $18.33 million, respectively, during the three months ended September 30, 2013, from which we realized net gains of $1.31 million. Our net realized gain on derivative instruments of $7.00 million for the three months ended September 30, 2013 was comprised of a $7.31 million realized gain on the TRS and a $0.31 million realized loss on foreign currency forward contracts. The net realized gain on foreign currency transactions was an additional $1.05 million. We sold investments and received principal payments of $61.38 million and $6.92 million, respectively, during the three months ended September 30, 2012, from which we realized a net gain of $0.48 million. We also realized a net loss on foreign currency transactions of $0.03 million during the three months ended September 30, 2012.
61
Net unrealized appreciation or depreciation
For the three months ended September 30, 2013, the net change in unrealized appreciation on investments totaled $19.05 million, the net change in unrealized depreciation on derivative instruments totaled $9.46 million and the net change in unrealized appreciation on foreign currency translation totaled $0.10 million. The change in unrealized appreciation on investments was primarily driven by price increases in our fixed rate debt investments, which resulted from a decrease in the US Treasury note interest yield during the three months ended September 30, 2013. The net change in unrealized depreciation on derivative instruments consisted of net unrealized depreciation on the TRS of $5.12 million and net unrealized depreciation on foreign currency forward contracts of $4.34 million. The net change in TRS unrealized depreciation consisted of (i) a decrease in spread interest income of $3.60 million, (ii) realized losses on the TRS reference assets of $3.09 million and (iii) unrealized appreciation on the TRS reference assets of $1.57 million. The decrease in spread interest income is due primarily to the decreased number of reference assets in the TRS Portfolio. For the three months ended September 30, 2012, there was an increase in net unrealized appreciation of $6.43 million, comprised of a change in net unrealized appreciation on investments of $6.55 million, a net change in net unrealized depreciation on derivative instruments of $0.14 million and a change in net unrealized appreciation on foreign currency translation of $0.02 million.
Net increase in net assets resulting from operations
For the three months ended September 30, 2013 and 2012, the net increase in net assets resulting from operations was $34.77 million and $11.18 million, respectively.
RESULTS COMPARISONS FOR THE NINE MONTHS ENDED SEPTEMBER 30, 2013 AND 2012
Investment income
Investment income for the nine months ended September 30, 2013 and 2012 was $71.42 million and $21.11 million, respectively. The largest component of investment income was interest income of $63.85 million and $20.18 million for the nine months ended September 30, 2013 and 2012, respectively. The increase in investment income is due primarily to the growth of our Investment Portfolio over the last year. Incremental amounts of equity capital that we received as net proceeds from our Initial Offering on a weekly basis were deployed throughout the nine-month period ended September 30, 2013 in the acquisition of investment securities issued by portfolio companies. We also generated fee income of $7.38 million during the nine months ended September 30, 2013, in the form of structuring service fees earned on Co-Investment Transactions. We earned fee income of $0.92 million during the nine months ended September 30, 2012. We expect our Investment Portfolio to continue to grow during the remainder of 2013 and into 2014 and, accordingly, we believe that reported investment income for the nine months ended September 30, 2013 is not representative of our stabilized performance or our future performance. We expect further increases in investment income in future periods due to (i) an increase in our weighted average coupon spread that has resulted from our recent focus on Co-Investment Transactions, (ii) a growing base of portfolio company investments that we expect to result from the expected increases in equity capital available to us for investment purposes from our Follow-On Offering and borrowed capital, and (iii) additional structuring service fees earned on Co-Investment Transactions. The interest income earned by the TRS reference assets is not included in investment income in the condensed consolidated statements of operations, but rather it is included in the TRS fair value, and eventually recorded as part of realized gain or loss on derivative instruments in connection with quarterly TRS settlement payments.
Operating expenses
Our total operating expenses were $39.59 million and $12.72 million for the nine months ended September 30, 2013 and 2012, respectively. Our operating expenses included $19.45 million and $5.22 million in base management fees attributed to the investment advisory services of our Advisors for the nine months ended September 30, 2013 and 2012, respectively. Our Advisors are also eligible to receive incentive fees based on performance. We recorded performance-based incentive fee expense of $6.03 million and $1.92 million for the nine months ended September 30, 2013 and 2012, respectively. The performance-based incentive fee expense for the nine months ended September 30, 2013 is comprised of subordinated incentive fees on income of $1.71 million, earned in the third quarter of 2013, and incentive fees on capital gains of $4.32 million. The performance-based incentive fee expense for the nine months ended September 30, 2012 is comprised entirely of incentive fees on capital gains. Additionally, during 2013 we implemented a change in the computation of performance-based incentive fees that effectively reduces the amount of incentive fees on capital gains that the Advisors can earn from the TRS investment. As discussed in “Note 6. Agreements and Related Party Transactions” in our condensed consolidated financial statements, the calculation of performance-based incentive fees disregards any net realized and unrealized gains associated with the TRS interest spread. A portion of performance-based incentive fees on capital gains is accrued with respect to net unrealized appreciation in our investment portfolio and derivative instruments, although the performance-based incentive fee on capital gains with respect to such net unrealized appreciation is not payable by us unless and until the net unrealized appreciation is actually realized in a cumulative amount that exceeds any unrealized depreciation that is recorded in our investment portfolio. The actual amount of incentive fees on capital gains that are due and payable to
62
the Advisors is determined at the end of the calendar year. As of December 31, 2012 the Advisors had not received, nor earned, any payment of incentive fees on capital gains since the inception of the Company.
The following table illustrates the amount of the recorded incentive fee on capital gains that would potentially be payable to the Advisors if (i) the cumulative net realized gains were to remain unchanged, and (ii) the unrealized depreciation in the investment portfolio was to remain unchanged through the end of the current year. However, the relativity between cumulative net realized gains and unrealized depreciation have the potential to change materially based on (i) subsequent investment disposition activity and (ii) changes in market values of investments contributing to unrealized depreciation in the portfolio.
| As of September 30, 2013 |
Amount ($ millions) |
|||
| Cumulative net realized gains since inception (a) |
$ | 11.80 | ||
| Less: Unrealized depreciation in investment portfolio (b) |
7.91 | |||
|
|
|
|||
| Excess cumulative net realized gains potentially eligible for earned incentive fees |
$ | 3.89 | ||
|
|
|
|||
| Potential for earned performance-based incentive fee on net realized gains (1) |
$ | 0.78 | ||
| (1) | The actual incentive fee on capital gains that may be earned and payable to the Advisors, as determined at the end of the year, is 20% of the excess, if any, of (a) over (b), less any prior period payments of incentive fees on capital gain, if any. Prior period payments of incentive fees on capital gains are equal to $0. |
We recorded interest expense of $5.07 million and $1.75 million for the nine months ended September 30, 2013 and 2012, respectively, primarily in connection with borrowings under our revolving credit facilities. The increase in interest expense is primarily attributable to the increase in our weighted average debt outstanding to $251.70 million during the nine months ended September 30, 2013 as compared to $86.87 million the nine months ended September 30, 2012.
Our other operating expenses for the nine months ended September 30, 2013 and 2012 include $4.49 million and $0.49 million in offering expense, $1.46 million and $0.78 million in administrative services expenses, $0.98 million and $0.75 million in professional services expense, $0.36 million and $0.13 million in custodian and accounting fees, $0.24 million and $0.14 million in director fees and expenses and $1.51 million and $0.64 million in other expenses, respectively. We also incurred organization expenses of $0.90 million during the nine months ended September 30, 2012.
As our asset base and number of shareholders have grown, our general and administrative expenses have increased, but at a slower rate compared to the growth rate in the asset base. We expect certain variable operating expenses to continue to increase because of the anticipated growth in the size of our asset base and the number of open shareholder accounts. During the nine months ended September 30, 2013, the ratio of annualized core operating expenses (excluding investment advisory fees, interest expense and reimbursement of organization and offering expenses, and including net expense support) to average net assets was 0.83%, as compared to 1.50% for the nine months ended September 30, 2012. We generally expect core operating expenses to decline as a percentage of our net assets during periods of asset growth over the next several calendar quarters. Incentive fees and interest expense, among other things, may also increase or decrease our overall operating expenses and expense ratios relative to comparative periods depending on portfolio performance, an increase or reduction in borrowed funds, and changes in benchmark interest rates such as LIBOR, among other factors.
Expense Support Payments and Reimbursement Payments - Expense Support Payments from the Advisors were $1.59 million and we accrued $0.83 million as probable Reimbursement Payment obligation for the nine months ended September 30, 2012. The provisions of the Expense Support Agreement that provide for Expense Support Payments from the Advisors to us were not extended beyond June 30, 2012, and therefore there were no Expense Support Payments from the Advisors for the nine months ended September 30, 2013. Additionally, we paid $1.83 million and accrued $1.14 million for the nine months ended September 30, 2013 as probable Reimbursement Payment obligation relative to the cumulative Expense Support Payments of $2.97 million. Accordingly, our payments and accrual of reimbursement of Expense Support Payments equals 100% of cumulative Expense Support Payments as of September 30, 2013. (See “—Contractual Agreements, —Expense Support Agreement,” below for further details about the Expense Support Agreement. Also see “Note 6. Agreements and Related Party Transactions” included within our condensed consolidated financial statements for additional disclosures regarding the Expense Support Payments and Reimbursement Payments.)
Net investment income
Our net investment income totaled $30.69 million ($0.33 per share) and $9.15 million ($0.39 per share) for the nine months ended September 30, 2013 and 2012, respectively. The primary drivers of the decrease in net investment income per share are (i) accrued reimbursement of expense support payable to the Advisors in the nine month period ended September 30, 2013 and (ii) the receipt of expense support payments from Advisors in the nine months ended September 2012. The decline in net investment income per share can also be partly attributed to the TRS Portfolio, which is not a contributor to GAAP net investment income since the TRS Portfolio collected and accrued interest income and TRS financing charges are
63
included in the TRS fair value, and eventually recorded as part of realized gain or loss on derivative instruments in connection with quarterly TRS settlement payments. The table below shows net investment income and net investment income per share for the nine months ended September 30, 2013 and 2012, before the effects of unearned performance-based incentive fees and expense support, which we refer to as adjusted net investment income (non-GAAP).
| For the nine months ended September 30, ($ millions) |
||||||||
| 2013 | 2012 | |||||||
| Net Investment Income (GAAP) |
$ | 30.69 | $ | 9.15 | ||||
| Estimated unearned performance-based incentive fees |
3.54 | 1.92 | ||||||
| Reimbursement of expense support |
1.14 | 0.83 | ||||||
| Expense support |
- | (1.59 | ) | |||||
|
|
|
|
|
|||||
| Adjusted Net Investment Income (non-GAAP) |
$ | 35.37 | $ | 10.31 | ||||
|
|
|
|
|
|||||
| Net Investment Income Per Share |
$ | 0.33 | $ | 0.39 | ||||
| Adjusted Net Investment Income Per Share |
$ | 0.38 | $ | 0.43 | ||||
Net realized gain
We sold investments and received principal payments of $422.38 million and $78.03 million, respectively, during the nine months ended September 30, 2013, from which we realized net gains of $5.91 million. Our net realized gain on derivative instruments of $9.65 million for the nine months ended September 30, 2013 was comprised of a $9.84 million realized gain on the TRS and a $0.19 million realized loss on foreign currency forward contracts. The net realized gain on foreign currency transactions was $0.65 million. We sold investments and received principal payments of $100.19 million and $16.32 million, respectively, during the nine months ended September 30, 2012, from which we realized a net gain of $1.75 million. We also realized a net gain on foreign currency transactions of $0.01 million during the nine months ended September 30, 2012.
Net unrealized appreciation or depreciation
For the nine months ended September 30, 2013, the net change in unrealized appreciation on investments totaled $18.08 million, the net change in unrealized depreciation on derivative instruments totaled $3.46 million and the net change in unrealized appreciation on foreign currency translation totaled $0.09 million. The change in unrealized appreciation on investments was primarily driven by price increases in our fixed rate debt investments, which resulted from a decrease in the US Treasury note interest yield. The net change in unrealized depreciation on derivative instruments consisted of net unrealized depreciation on the TRS Portfolio of $0.51 million and net unrealized depreciation on foreign currency forward contracts of $2.95 million. The net change in TRS unrealized depreciation consisted of (i) spread interest income of $0.73 million, (ii) realized gains on the TRS reference assets of $0.10 million and (iii) unrealized depreciation on the TRS reference assets of $1.34 million. The overall decline in the value of the TRS is due primarily to the decreased number of reference assets in the TRS Portfolio. For the nine months ended September 30, 2012, the net change in unrealized appreciation on investments was $8.07 million, the net change in unrealized depreciation on derivative instruments was $0.21 million and the net change in unrealized depreciation on foreign currency translation was $0.04 million.
Net increase in net assets resulting from operations
For the nine months ended September 30, 2013 and 2012, the net increase in net assets resulting from operations was $61.61 million and $18.73 million, respectively.
Net Assets, Net Asset Value per Share and Total Investment Returns
Net assets increased $646.36 million during the nine months ended September 30, 2013. The most significant increase in net assets during the nine months ended September 30, 2013 was attributable to capital transactions including (i) new issuance of shares of common stock, and (ii) reinvestment of distributions in the combined amount of $641.19 million. Net investment income contributed $30.69 million to the growth in net assets during the nine months ended September 30, 2013. Other increases in net assets were attributable to (i) unrealized appreciation on investments, derivative instruments and foreign currency translation of $14.71 million and (ii) net realized gains of $16.21 million. Distributions to shareholders in the amount of $53.80 million and the repurchase of shares of common stock in the amount of $2.64 million contributed to a reduction in net assets during the nine months ended September 30, 2013.
Net assets increased $384.83 million during the nine months ended September 30, 2012. The most significant increase in net assets during the nine months ended September 30, 2012 was attributable to capital transactions including (i) new issuance of shares of common stock, and (ii) reinvestment of distributions in the combined amount of $379.72 million. Net investment income contributed $9.15 million to the growth in net assets during the nine months ended September 30, 2012. Other increases in net assets were attributable to (i) unrealized appreciation on investments and foreign currency translation of $7.82 million and (ii) net realized gains of $1.76 million. Distributions to shareholders in the amount of $13.16 million and the repurchase of shares of common stock in the amount of $0.46 million contributed to a reduction in net assets during the nine months ended September 30, 2012.
64
Our net asset value per share was $9.92 and $9.75 on September 30, 2013 and December 31, 2012, respectively. After considering (i) the overall appreciation in net asset value per share, (ii) paid distributions of approximately $0.59 per share, and (iii) the assumed reinvestment of those distributions at 90% of the prevailing offering price per share, then the total investment return was 7.9% for shareholders who held our shares over the entire nine-month period ending September 30, 2013.
Initial shareholders who subscribed to the Initial Offering in June 2011 with an initial investment of $10,000 and an initial purchase price equal to $9.00 per share (public offering price net of sales load) have seen the value of their investment grow by 31.4% (see chart below), or an annualized return of 12.7%. Initial shareholders who subscribed to the Initial Offering in June 2011 with an initial investment of $10,000 and an initial purchase price equal to $10.00 per share (the initial public offering price) have registered a total investment return of 18.2%, or an annualized return of 7.6%. The S&P/LSTA Leveraged Loan Index, a primary measure of senior debt covering the U.S. leveraged loan market which currently consists of approximately 1,100 credit facilities throughout numerous industries, and the Merrill Lynch US High Yield Master II Index, a primary measure of subordinated debt consisting of approximately 2,000 high yield corporate bonds, registered cumulative total returns of approximately 12.4% and 19.8% in the period from June 17, 2011 to September 30, 2013, respectively.
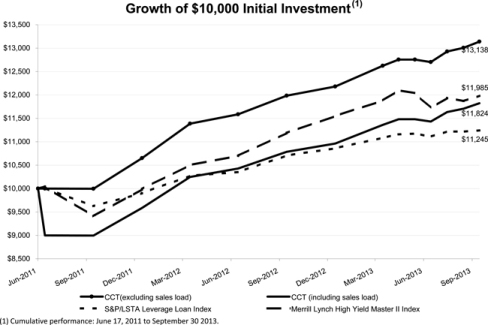
The calculations for the Growth of $10,000 Initial Investment are based upon the following assumptions: (i) an initial investment of $10,000 in our common stock at the beginning of the period, at a share price of $10.00 per share (including sales load) and $9.00 per share (excluding sales load), (ii) the reinvestment of monthly distributions in accordance with our distribution reinvestment plan (iii) the sale of the entire investment position at the net asset value per share on the last day of the period; and (iv) the cash payment for distributions payable to shareholders, if any, on the last day of the period.
Our shares are illiquid investments for which there is not a secondary market, and we do not expect a secondary market in our shares to develop in the future. You should not expect to be able to resell your shares regardless of how we perform. If you are able to sell your shares, you will likely receive less than your purchase price. Our net asset value, cumulative returns and annualized returns — which are based in part upon determinations of fair value of Level 3 investments by our board of directors, not active market quotations — are inherently uncertain. Past performance is not a guarantee of future results.
OFF-BALANCE SHEET ARRANGEMENTS
We had no off-balance sheet arrangements as of September 30, 2013.
CONTRACTUAL OBLIGATIONS
Investment Advisory Agreements – We have entered into the Investment Advisory Agreement with CNL for the overall management of our investment activities. We and CNL have also entered into the Sub-Advisory Agreement with KKR, under which KKR is responsible for the day-to-day management of our investment portfolio. CNL compensates KKR for advisory services that it provides to the Company with 50% of the base management fees and performance-based incentive fees that CNL receives under the Investment Advisory Agreement. Pursuant to the Investment Advisory Agreement, CNL earns a management fee equal to an annual rate of 2% of our average gross assets (including assets
65
purchased with borrowed funds and unsettled trades, unrealized appreciation or depreciation on total return swaps and collateral posted with custodian in connection with TRS, but excluding deferred offering expense), and an incentive fee based on our performance. The incentive fee is comprised of the following two parts:
| (i) | a subordinated incentive fee on pre-incentive fee net investment income, that is paid quarterly if earned, and it is computed as the sum of (A) 100% of quarterly pre-incentive fee net investment income in excess of 1.75% of average adjusted capital up to a limit of 0.4375% of average adjusted capital, and (B) 20% of pre-incentive fee net investment income in excess of 2.1875% of average adjusted capital, and |
| (ii) | an incentive fee on capital gains that is paid annually if earned, and it is equal to 20% of (A) all realized gains on a cumulative basis from inception, net of (i) all realized losses on a cumulative basis, (ii) unrealized depreciation at year-end and (iii) disregarding any net realized gains associated with the TRS interest spread (which represents the difference between (a) the interest and fees received on total return swaps, and (b) the financing fees paid to the total return swaps counterparty), and subtracting (B) the aggregate amount of any previously paid incentive fee on capital gains. |
The terms of the Investment Advisory Agreement entitle CNL (and indirectly KKR) to receive up to 5% of gross proceeds in connection with the Initial Offering and the Follow-On as reimbursement for organization and offering expenses incurred by the Advisors on our behalf. The Advisors waived our requirement to reimburse them for organization and offering expenses for the period from June 17, 2011 through January 31, 2012. The waiver of the reimbursement requirements did not reduce the amount of organization and offering expenses incurred by the Advisors that are eligible for reimbursement in future periods. Beginning February 1, 2012, we implemented an expense reimbursement rate equal to 0.75% of gross Initial Offering proceeds to initiate the reimbursement of organization and offering expenses incurred by the Advisors. The reimbursement rate was increased to 1.0% of gross Initial Offering proceeds on March 1, 2013. As of September 30, 2013, the Advisors have been reimbursed in the amounts of $0.90 million for organization expenses and $9.81 million for offering expenses, including any payable balances for reimbursement of offering expenses. As of September 30, 2013, the Advisors carried a balance of approximately $0.58 million for expenses incurred on our behalf in connection with the Initial Offering, net of (i) incremental offering expenses incurred by the Advisors on our behalf and (ii) our reimbursement payments to the Advisors and any payable balances for reimbursement of offering expenses.
The Advisors have continued to incur offering expenses on our behalf throughout the remainder of Initial Offering period and the reimbursement of the Advisor for offering expenses they incur on our behalf is expected to continue through the termination date of the Initial Offering. We expect the final reimbursement rate to be at or below 1.0% of gross offering proceeds for the Initial Offering. Through September 30, 2013, the Advisors have incurred $0.58 million of offering expenses on our behalf in connection with the Follow-On Offering. We expect to begin to reimburse the Advisors for these expenses during the fourth quarter of 2013. See “Note 6. Agreements and Related Party Transactions” in our condensed consolidated financial statements for expanded discussion of the Investment Advisory Agreements.
Expense Support Agreement - We are party to an Expense Support and Conditional Reimbursement Agreement with CNL and KKR (as amended, the “Expense Support Agreement”) pursuant to which CNL and KKR jointly and severally agreed to reimburse us for a specified percentage of our operating expenses (an “Expense Support Payment”) during the Expense Support Payment Period beginning on June 17, 2011 and ending of June 30, 2012. As of June 30, 2012, the Advisors had incurred $2.97 million of Expense Support Payments.
During the term of the Expense Support Agreement, the Advisors are entitled to an annual year-end reimbursement payment by us for unreimbursed Expense Support Payments made under the Agreement (a “Reimbursement Payment”), but such Reimbursement Payments may only be made within three years after the calendar year in which such Expense Support Payments are made. No Reimbursement Payment may be paid by us to the extent that it would cause our Other Operating Expenses (Other Operating Expenses is equal to Operating Expenses, but excluding base advisory fees and including a Reimbursement Payment) to exceed 1.75% of average net assets attributable to common shares as of the calendar year-end (the “Reimbursement Limit Percentage”). During the nine months ended September 30, 2013, we made a Reimbursement Payment of $1.83 million. As of September 30, 2013, the Advisors have been reimbursed $1.83 million of Expense Support payments and we have accrued an additional $1.14 million for probable Reimbursement Payment obligation. As of September 30, 2013, all Expense Support Payments received from the Advisors have been either repaid or accrued for probable reimbursement.
66
Revolving Credit Facilities –As discussed above under “Financial Condition, Liquidity and Capital Resources – Credit Facilities,” we, either directly or through our wholly-owned subsidiaries have entered into several revolving credit facilities. As of September 30, 2013, the credit facilities provided for borrowings in an aggregate amount up to $750.00 million on a committed basis and $506.43 million was borrowed and outstanding under the credit facilities. (See “— Liquidity and Capital Resources — Credit Facilities” above and “Note 11. Revolving Credit Facilities and Borrowings” in our condensed consolidated financial statements for expanded discussion of the revolving credit facilities.)
A summary of our significant contractual payment obligations for the repayment of outstanding borrowings and interest expense and other fees related to the credit facilities at September 30, 2013 is as follows:
| Total | < 1 year | 1-3 years | 3-5 years | After 5 years | ||||||||||||||||
| Deutsche Bank Credit Facility (1) |
$ | 264.44 | $ | 65.00 | $ | 199.44 | $ | — | $ | — | ||||||||||
| BNP Credit Facility (2) |
125.00 | 125.00 | — | — | — | |||||||||||||||
| Senior Secured Credit Facility (3) |
116.99 | — | — | 116.99 | — | |||||||||||||||
| Interest and Credit Facility Fees Payable |
0.54 | 0.48 | 0.06 | — | — | |||||||||||||||
|
|
|
|
|
|
|
|
|
|
|
|||||||||||
| TOTAL |
$ | 506.97 | $ | 190.48 | $ | 199.50 | $ | 116.99 | $ | — | ||||||||||
|
|
|
|
|
|
|
|
|
|
|
|||||||||||
| (1) | At September 30, 2013 our unused commitment amount was $0.56 million under the Deutsche Bank Credit Facility. |
| (2) | At September 30, 2013 our unused commitment amount was $75.00 million under the BNP Credit Facility. |
| (3) | At September 30, 2013 our unused commitment amount was $168.01 million under the Senior Secured Credit Facility. |
The maturity structure of our Investment Portfolio of debt investments at September 30, 2013, based on par amounts, is as follows:
| Total | < 1 year | 1-3 years | 3-5 years | After 5 years | ||||||||||||||||
| Investment Portfolio Debt Investments (1) |
$ | 1,656.75 | $ | 3.31 | $ | 91.98 | $ | 434.45 | $ | 1,127.01 | ||||||||||
| (1) | Par amounts denominated in foreign currencies are converted to U.S. Dollars using the applicable exchange rate at September 30, 2013. |
The maturity schedule presented above does not include consideration of partial paydown of principal. Call provisions and refinancings may also lead to earlier return of principal balances to the extent the Company does not participate in the refinancings.
| Item 3. | Quantitative and Qualitative Disclosures about Market Risks |
Interest Rate Risk
We are subject to financial market risks, in particular changes in interest rates. Future changes in interest rates will likely have effects on the interest income we earn on our portfolio investments, the fair value of our fixed income investments, the interest rates and interest expenses associates with the money we borrow for investment purposes, and the fair value of loan balances.
Subject to the requirements of the 1940 Act, we may hedge against interest rate fluctuations by using standard hedging instruments such as futures, options and forward contracts. Although hedging activities may insulate us against adverse changes in interest rates, they may also limit our ability to participate in the benefits of lower interest rates. During the period from January 1, 2013 to September 30, 2013, we did not engage in interest rate hedging activities.
As of September 30, 2013, approximately 60.8% of our portfolio of debt investments, or approximately $1,006.80 million measured at par value, featured floating or variable interest rates. The variable interest rate debt investments are usually based on three-month LIBOR (the base rate) and typically have durations of three months after which the base rates are reset to then prevailing three-month LIBOR. At September 30, 2013, approximately 93.7% of our portfolio of variable interest rate debt investments, or approximately $943.73 million measured at par value, featured minimum base rates, or base rate floors, and the weighted average base rate floor for such investments was 1.2%. Variable interest rate investments that feature a base rate floor generally reset to the then prevailing three-month LIBOR only if the reset base rate exceeds the base rate floor on the applicable interest rate reset date, in which cases we may benefit through an increase in interest income from such interest rate adjustments. At September 30, 2013, we held an aggregate investment position of $63.07 million at par value in variable interest rate debt investments that featured variable interest rates without any minimum base rates, or approximately 6.3% of our portfolio of variable interest rate debt investments. In the case of these “no base rate floor” variable interest debt investments held in our portfolio, we may benefit from increases in the base rates that may subsequently result in an increase in interest income from such interest rate adjustments.
Because we borrow money to make investments, our net investment income is partially dependent upon the difference between the interest rate at which we invest borrowed funds and the interest rate at which we borrow funds. In
67
periods of rising interest rates and when we have borrowed capital with floating interest rates, then our interest expense would increase, which could increase our financing costs and reduce our net investment income, especially to the extent we continue to acquire and hold fixed-rate debt investments. As a result, there can be no assurance that a significant change in market interest rates will not have a material adverse effect on our net investment income. Pursuant to the amended terms of our Deutsche Bank Credit Facility as discussed above (see “— Financial Condition, Liquidity and Capital Resources — Credit Facilities”), CCT Funding borrows at a floating base rate of (i) three-month LIBOR plus 1.50% for Tranche B1 Loans ($65.00 million loan balance outstanding), (ii) three-month LIBOR plus 2.325% for Tranche B2 Loans ($100.00 million loan balance outstanding) and (iii) three-month LIBOR plus 2.325% for Tranche D Loans ($99.44 million loan balance outstanding and $0.56 million unused commitment). Pursuant to the terms of our BNP Credit Facility, Paris Funding borrows at a floating base rate of one-month LIBOR plus 1.10% for the credit facility borrowings ($125.00 million loan balance outstanding and $75.00 million unused commitment). Pursuant to the terms of our Senior Secured Credit Facility, we borrow at a rate based on LIBOR plus an applicable spread of 2.50% or on an “alternate base rate” (which is the highest of a prime rate, the federal funds rate plus 0.50%, or one-month LIBOR plus 1.00%) plus an applicable spread of 1.50%, or, with respect to borrowings in non-LIBOR currencies, on a rate applicable to such currency plus an applicable spread of 2.50% ($116.99 million loan balance outstanding and $168.01 million unused commitment). Therefore, if we were to completely draw down the unused Tranche D Loans commitment amount in our Deutsche Bank facility, the maximum commitment amount in our BNP facility and the maximum commitment in our Senior Secured Credit Facility under the same interest election as our current U.S. Dollar borrowing, we expect that our weighted average direct interest cost will increase by approximately 16 bps, as compared to our current weighted average direct interest cost for borrowed funds. We expect that any further expansion of the current revolving credit facilities, or any future credit facilities that we or any subsidiary may enter into, will also be based on a floating base rate. As a result, we are subject to continuous risks relating to changes in market interest rates.
Under the terms of the TRS agreements between Halifax Funding and BNS, Halifax Funding pays interest to BNS at a floating rate based on three-month LIBOR in exchange for the right to receive the economic benefits of a portfolio of TRS reference assets having a maximum aggregate notional amount of $500.00 million.
Assuming that the consolidated schedule of investments as of September 30, 2013 was to remain constant with regards to the investment portfolio and no actions were taken to alter the existing interest rate sensitivity or investment portfolio allocations, the upper section of the table below presents an estimated and hypothetical increase in interest income due to an immediate and persistent 12-month increase in the base rates associated with our debt investments featuring variable interest rates.
The middle section of the table below also presents sensitivity analysis for a persistent 12-month increase in the base interest rates that apply to our floating rate credit facility and the associated increase in interest expense, as well as the net effect of change in interest rates on the TRS unrealized appreciation (depreciation). For persistent LIBOR increases of less than 150 basis points, the increase in interest expense eclipses the hypothetical increase in interest income associated with our floating rate debt investments; for a persistent LIBOR increase greater than 150 basis points, the hypothetical increase in interest income associated with our floating rate debt investments begins to provide a positive contribution to net interest income, in both cases assuming that the consolidated schedule of investments as of September 30, 2013 was to remain constant with regards to the Investment Portfolio and no actions were taken to alter the existing interest rate sensitivity or investment portfolio allocations.
68
| ($ amounts in millions except per share data) | ||||||||||||||||||||||
| Par Amount |
Weighted Avg. Floor |
Increases in LIBOR | ||||||||||||||||||||
| +50 bps | +100 bps | +150 bps | +200 bps | |||||||||||||||||||
|
|
||||||||||||||||||||||
| No base rate floor |
$ | 63.07 | $ | 0.281 | $ | 0.562 | $ | 0.843 | $ | 1.124 | ||||||||||||
| Base rate floor |
$ | 943.73 | 1.2% | 0.000 | 0.479 | 4.377 | 8.461 | |||||||||||||||
|
|
||||||||||||||||||||||
| Increase in Floating Rate Interest Income |
0.281 | 1.041 | 5.220 | 9.585 | ||||||||||||||||||
|
|
||||||||||||||||||||||
| LIBOR + Spread | ||||||||||||||||||||||
|
|
||||||||||||||||||||||
| Deutsche Bank Credit Facility Tranche B1 Loans |
$ | 65.00 | L(90) + 150 bps | $ | (0.325 | ) | $ | (0.650 | ) | $ | (0.975 | ) | $ | (1.300) | ||||||||
| Deutsche Bank Credit Facility Tranche B2 Loans |
$ | 100.00 | L(90) + 232.5 bps | (0.500 | ) | (1.000 | ) | (1.500 | ) | (2.000) | ||||||||||||
| Deutsche Bank Credit Facility Tranche D Loans |
$ | 99.44 | L(90) + 232.5 bps | (0.497 | ) | (0.994 | ) | (1.492 | ) | (1.989) | ||||||||||||
| BNP Credit Facility |
$ | 125.00 | L(30) + 110 bps | (0.625 | ) | (1.250 | ) | (1.875 | ) | (2.500) | ||||||||||||
| Senior Secured Credit Facility USD Loan |
$ | 10.00 | L(30) + 250 bps | (0.050 | ) | (0.100 | ) | (0.150 | ) | (0.200) | ||||||||||||
| Senior Secured Credit Facility Euro Loan |
$ | 106.99 | L(30) + 250 bps | (0.535 | ) | (1.070 | ) | (1.604 | ) | (2.140) | ||||||||||||
|
|
||||||||||||||||||||||
| Increase to Floating Rate Interest Expense |
(2.532 | ) | (5.064 | ) | (7.596 | ) | (10.129) | |||||||||||||||
|
|
||||||||||||||||||||||
| Change in Floating Rate Net Interest Income, before TRS |
|
(2.251 | ) | (4.023 | ) | (2.376 | ) | (0.544) | ||||||||||||||
| Net change in TRS unrealized appreciation (depreciation) (1) |
|
(0.294 | ) | (0.581 | ) | (0.757 | ) | (0.933) | ||||||||||||||
|
|
||||||||||||||||||||||
| Overall Change in Floating Rate Net Interest Income, including TRS |
$ | (2.545 | ) | $ | (4.604 | ) | $ | (3.133 | ) | $ | (1.477) | |||||||||||
|
|
||||||||||||||||||||||
| Change in Floating Rate Net Interest Income Per Share Outstanding as of September 30, 2013 |
$ | (0.02 | ) | $ | (0.04 | ) | $ | (0.02 | ) | $ | (0.01) | |||||||||||
| (1) | Pursuant to the TRS Agreements, Halifax Funding receives from BNS all collected interest and fees derived from the TRS reference assets and pays to BNS interest at a rate equal to three-month LIBOR+80 bps per annum on the settled notional amount of TRS reference assets. As of September 30, 2013, 50.0% of the TRS reference assets, or approximately $28.95 million measured at par value, featured floating or variable interest rates. At September 30, 2013, 100% of the TRS reference assets with variable interest rates featured minimum base rate floors, or approximately $28.95 million measured at par value, and the weighted average base rate floor for such TRS reference assets was 1.2%. As of September 30, 2013, the total notional amount of the portfolio of TRS reference assets was $58.50 million, and the settled notional amount was $58.84 million. For the purpose of presenting this net interest sensitivity analysis, we have assumed that all TRS reference assets are settled as of September 30, 2013 and that the TRS notional amount would equal $58.84 million upon which the financing payments to BNS are based. |
The interest rate sensitivity analysis presented above does not consider the potential impact of the changes in value of our debt investments and the net asset value of our common stock in the event of sudden increases in interest rates associated with high yield corporate bonds. Approximately 39.2% of our debt investment portfolio is invested in fixed interest rate, high yield corporate debt investments. Rising market interest rates will most likely lead to value declines for high yield corporate bonds and a decline in the net asset value of our common stock, while declining market interest rates will most likely lead to an increase in bond values.
As of September 30, 2013, approximately 74.3% of our fixed interest rate debt investments, or approximately $491.23 million measured at fair value have prices that are generally available from third party pricing services. We consider these debt investments to be one of the more liquid subsets of our Investment Portfolio since these types of assets are generally broadly syndicated and owned by a wide group of institutional investors and investment funds. Additionally this group of assets is susceptible to revaluation, or changes in bid-ask values in, response to sudden changes in expected rates of return associated with these investments. We have other fixed interest rate investments in the less liquid subset of our Investment Portfolio that are not included in this analysis .
We have computed a duration of approximately 4.5 for this subset of our total portfolio. This implies that a sudden increase in the market’s expected rate of return of 100 basis points for this subset of our Investment Portfolio may result in a reduction in value of approximately 4.5%, all other financial and market factors assuming to remain unchanged. A 4.5% decrease in the valuation of this investment portfolio subset would equate to a decrease of $0.17 per share, or a 1.7% decline in net asset value relative to $9.92 net asset value per share as of September 30, 2013.
69
Foreign Currency Risk
From time to time, we may make investments that are denominated in a foreign currency through which we may be subject to foreign currency exchange risk. As of September 30, 2013, 13.6% of our portfolio of debt investments, or approximately $229.68 million measured at par value was denominated in foreign currencies, of which 51.3% was denominated in Euros. The remaining foreign currency investments are denominated in British Pound Sterling, New Zealand Dollars and Swedish Krona. We may use derivative instruments from time to time, including foreign currency forward contracts, to manage the impact of fluctuations in foreign currency exchange rates. As of September 30, 2013, the net contractual notional balance of our foreign currency forward contracts totaled $86.05 million, all of which related to certain of our foreign currency denominated debt investments. In order to further reduce our exposure to fluctuations in exchange rates, we also have outstanding borrowings in Euros under our Senior Secured Credit Facility. The U.S. Dollar equivalent of our Euro borrowings was $106.99 million as of September 30, 2013. Fluctuations in exchange rates therefore impact our financial condition and results of operations, as reported in U.S. dollars. During the nine months ended September 30, 2013, the foreign currency translation adjustment recorded in our condensed consolidated statements of operations was net unrealized appreciation of $0.09 million. Our foreign currency forward contracts had unrealized depreciation $2.95 million during the nine months ended September 30, 2013. The unrealized foreign currency losses were primarily as a result of changes in the exchange rates between the Euro and the U.S. dollar and between the New Zealand Dollar and the U.S. Dollar. We do not isolate that portion of the results of operations resulting from changes in foreign exchange rates on investments from fluctuations arising from changes in fair values of investments held; therefore the fluctuations related to foreign exchange rate conversion are included with the net realized gain (loss) and unrealized appreciation (depreciation) on investments.
| Item 4. | Controls and Procedures |
Evaluation of Disclosure Controls and Procedures
Pursuant to Rule 13a-15(b) under the Exchange Act of 1934, under the supervision and with the participation of our management, including our principal executive officer and principal financial officer, we conducted an evaluation of the effectiveness of our disclosure controls and procedures (as defined under Rule 13a-15(e) under the Exchange Act) as of the end of the period covered by this report. Based upon that evaluation, our management, including our principal executive officer and principal financial officer, concluded that our disclosure controls and procedures are effective as of the end of the period covered by this report.
We believe, however, that a controls system, no matter how well designed and operated, cannot provide absolute assurance that the objectives of the controls systems are met, and no evaluation of controls can provide absolute assurance that all control issues and instances of fraud or error, if any, within a company have been detected.
Changes in Internal Control over Financial Reporting
In the most recent fiscal quarter, there was no change in our internal controls over financial reporting (as defined under Rule 13a-15(f) under the Exchange Act) that has materially affected, or is reasonably likely to materially affect, our internal controls over financial reporting.
| Item 1. | Legal Proceedings - None |
| Item 1A. | Risk Factors |
There have been no material changes to the risk factors previously disclosed in response to Item 1A. to Part 1 of our Annual Report on Form 10-K for the fiscal year ended December 31, 2012, except for the following:
70
Risks related to our business
The lack of liquidity in our investments may adversely affect our business.
We may acquire our portfolio company investments from privately held companies in directly negotiated transactions. Substantially all of these securities are subject to legal and other restrictions on resale or are otherwise less liquid than publicly traded securities. We typically would be unable to exit these investments unless and until the portfolio company has a liquidity event such as a sale, refinancing, or initial public offering of the company.
The illiquidity of our investments may make it difficult or impossible for us to sell such investments if the need arises. In addition, if we are required to liquidate all or a portion of our portfolio quickly, we may realize significantly less than the value at which we have previously recorded our investments, which could have a material adverse effect on our business, financial condition and results of operations.
Moreover, securities purchased by us that are liquid at the time of purchase may subsequently become illiquid due to events relating to the issuer of the securities, market events, economic conditions or investor perceptions.
Our access to confidential information may restrict our ability to take action with respect to some investments, which, in turn, may negatively affect our results of operations.
We, directly or through our Advisors, may obtain confidential information about the companies in which we have invested or may invest. If we do possess confidential information about such companies, there may be restrictions on our ability to make, dispose of, increase the amount of, or otherwise take action with respect to, an investment in those companies. The impact of these restrictions on our ability to take action with respect to our investments could have an adverse effect on our results of operations.
71
The following revised risk factor disclosures were included in our registration statement on Form N-2 that was declared effective by the SEC on November 1, 2013.
The amount of any distributions we may make is uncertain. We may not be able to pay you distributions, or be able to sustain distributions at any particular level, and our distributions may not grow over time, and our distributions may be reduced. We have not established any limit on the extent to which we may use borrowings, if any, or offering proceeds to fund distributions (which may reduce the amount of capital we ultimately invest in portfolio companies) and there can be no assurance that we will be able to sustain distributions at any particular level.
We pay distributions out of assets legally available for distribution. However, we cannot assure you that we will achieve investment results that will allow us to make a targeted level of cash distributions or year-to-year increases in cash distributions. Our ability to pay distributions might be adversely affected by the impact of the risks described in this report. In addition, the inability to satisfy the asset coverage test applicable to us as a business development company can limit our ability to pay distributions. Distributions from offering proceeds or from borrowings also could reduce the amount of capital we ultimately invest in interests of portfolio companies. We cannot assure you that we will continue to pay distributions to our shareholders in the future.
Our distributions may exceed our earnings; therefore, portions of the distributions that we pay may represent a return of capital to you, which will lower your tax basis in your shares and reduce the amount of funds we have for investment in portfolio companies. We have not established any limit on the extent to which we may use borrowings, if any, or offering proceeds to fund distributions (which may reduce the amount of capital we ultimately invest in portfolio companies).
In the event that we encounter delays in locating suitable investment opportunities, we may pay our distributions from offering proceeds or from borrowings in anticipation of future cash flow, which may constitute a return of your capital and will lower your tax basis in your shares. Distributions from offering proceeds or from borrowings also could reduce the amount of capital we ultimately invest in interests of portfolio companies.
Risks related to our Advisors and their respective affiliates
The time and resources that individuals associated with the Advisors devote to us may be diverted, and we may face additional competition due to the fact that neither CNL nor KKR is prohibited from raising money for or managing another entity that makes the same types of investments that we target.
The Advisors currently manage other investment entities and are not prohibited from raising money for and managing future investment entities that make the same types of investments as those we target. As a result, the time and resources that our Advisors devote to us may be diverted, and during times of intense activity in other programs they may devote less time and resources to our business than is necessary or appropriate. In addition, we may compete with any such investment entity for the same investors and investment opportunities.
The Advisors will experience conflicts of interest in connection with the management of our business affairs.
Our Advisors will experience conflicts of interest in connection with the management of our business affairs, relating to the allocation of investment opportunities by the Advisors and its affiliates; compensation to the Advisors; services that may be provided by the Advisors and its affiliates to issuers in which we invest; investments by us and other clients of the Advisors, subject to the limitations of the 1940 Act; the formation of additional investment funds by the Advisors; differing recommendations given by the Advisors to us versus other clients; the Advisors’ use of information gained from issuers in our portfolio to investments by other clients, subject to applicable law; and restrictions on the Advisors’ use of “inside information” with respect to potential investments by us.
72
The Advisors have incentives to favor their respective other accounts and clients over us, which may result in conflicts of interest that could be harmful to us.
Because our Advisors manage assets for other investment companies, pooled investment vehicles and/or other accounts (including institutional clients, pension plans and certain high net worth individuals), certain conflicts of interest are present. For instance, an Advisor may receive fees from certain accounts that are higher than the fees received by the Advisor from us, or receive a performance-based fee on certain accounts. In those instances, a portfolio manager for the Advisor has an incentive to favor the higher and/or performance-based fee accounts over us. In addition, a conflict of interest exists to the extent an Advisor has proprietary investments in certain accounts, where its portfolio managers or other employees have personal investments in certain accounts or when certain accounts are investment options in the Advisor’s employee benefit plans. The Advisor has an incentive to favor these accounts over us.
An Advisor’s actions on behalf of its other accounts and clients may be adverse to us and our investments and harmful to us.
Each of our Advisors manages assets for accounts other than us, including private funds (for purposes of this section, “Advisor Funds”). Actions taken by an Advisor on behalf of its Advisor Funds may be adverse to us and our investments which could harm our performance. For example, we may invest in the same credit obligations as other Advisor Funds, although, to the extent permitted under the 1940 Act, our investments may include different obligations of the same issuer. Decisions made with respect to the securities held by one Advisor Fund may cause (or have the potential to cause) harm to the different class of securities of the issuer held by other Advisor Funds (including us). As a further example, an Advisor may manage accounts that engage in short sales of (or otherwise take short positions in) securities or other instruments of the type in which we invest, which could harm our performance for the benefit of the accounts taking short positions, if such short positions cause the market value of the securities to fall.
Our Advisors will face restrictions on their use of inside information about existing or potential investments that they acquire through their relationships with other advisory clients, and those restrictions may limit the freedom of our Advisors to enter into or exit from investments for us, which could have an adverse effect on our results of operations.
The members, officers, directors, employees, principals or affiliates of our Advisors may come into possession of material, non-public information. The possession of such information may limit the ability of our Advisors to buy or sell a security or otherwise to participate in an investment opportunity. In certain circumstances, employees of our Advisors may serve as board members or in other capacities for portfolio or potential portfolio companies, which could restrict our ability to trade in the securities of such companies. For example, if personnel of an Advisor come into possession of material non-public information with respect to our investments, such personnel will be restricted by our Advisor’s information-sharing policies and procedures or by law or contract from sharing such information with our management team, even where the disclosure of such information would be in our best interests or would otherwise influence decisions taken by the members of the management team with respect to that investment. This conflict and these procedures and practices may limit the freedom of our Advisors to enter into or exit from potentially profitable investments for us which could have an adverse effect on our results of operations. Accordingly, there can be no assurance that we will be able to fully leverage the resources and industry expertise of our Advisors’ other businesses. Additionally, there may be circumstances in which one or more individuals associated with and Advisor will be precluded from providing services to us because of certain confidential information available to those individuals or to other parts of the Advisor.
Our ability to enter into transactions with our affiliates will be restricted.
We are prohibited under the 1940 Act from participating in certain transactions with certain of our affiliates without the prior approval of a majority of the independent directors and, in some cases, the SEC. Any person that owns, directly or indirectly, 5% or more of our outstanding voting securities will be our affiliate for purposes of the 1940 Act, and we will generally be prohibited from buying or selling any securities from or to such affiliate, absent the prior approval of our board of directors and, in some cases, the SEC. The 1940 Act also prohibits certain “joint” transactions with certain of our affiliates, which in certain circumstances could include investments in the same portfolio company (whether at the same or different times to the extent the transaction involves jointness), without prior approval of our board of directors and, in some cases, the SEC. If a person acquires more than 25% of our voting securities, we will be prohibited from buying or selling any security from or to such person or certain of that person’s affiliates, or entering into prohibited joint transactions with such persons, absent the prior approval of the SEC. Similar restrictions limit our ability to transact business with our officers or directors or their affiliates. The SEC has interpreted the business development company regulations governing transactions with affiliates to prohibit
73
certain joint transactions involving entities that share a common investment adviser. As a result of these restrictions, we may be prohibited from buying or selling any security from or to any portfolio company that is controlled by a fund managed by either of our Advisors or their respective affiliates without the prior approval of the SEC, which may limit the scope of investment opportunities that would otherwise be available to us.
We may, however, invest alongside our Advisors’ and their respective affiliates’ other clients, including other entities they manage, which we refer to as affiliates’ other clients, in certain circumstances where doing so is consistent with applicable law and SEC staff interpretations and guidance. We may also invest alongside the other clients of our Advisors, as otherwise permissible under regulatory guidance, applicable regulations and the Advisors’ allocation policies. It is our policy to base our board of directors’ determinations as to the amount of capital available for investment on such factors as: the amount of cash on-hand, existing commitments and reserves the targeted leverage level, the targeted asset mix and diversification requirements and other investment policies and restrictions set by our board of directors or imposed by applicable laws, rules, regulations or interpretations. However, we can offer no assurance that investment opportunities will be allocated to us fairly or equitably in the short-term or over time.
In situations where co-investment with affiliates’ other clients is not permitted under the 1940 Act and related rules, existing or future staff guidance, or the terms and conditions of exemptive relief granted to us by the SEC (as discussed below), our Advisors will need to decide which client or clients will proceed with the investment. Generally, we will not have an entitlement to make a co-investment in these circumstances and, to the extent that another client elects to proceed with the investment, we will not be permitted to participate. Moreover, except in certain circumstances, we are unable to invest in any issuer in which an affiliates’ other client holds a controlling interest.
We and our Advisors applied for exemptive relief from the SEC under the 1940 Act to allow us additional latitude to co-invest alongside our Advisors’ and their respective affiliates. On May 21, 2013, the SEC issued a final order granting the requested exemptive relief. The exemptive relief permits us to participate in certain transactions originated by the Advisors or their respective affiliates. However, affiliates of our Advisors whose primary business includes the origination of investments may engage in investment advisory businesses with client accounts that compete with us, and those affiliates have no obligation to make their originated investment opportunities available to our Advisors or to us.
Risks related to our investments
Our investments in portfolio companies may be risky, and we could lose all or part of our investment.
We pursue a strategy focused on investing primarily in the debt of privately owned U.S. companies with a focus on originated transactions sourced through the networks of our Advisors.
| • | Senior Debt. When we invest in senior debt, we generally seek to take a security interest in the available assets of the portfolio company, including equity interests in any of its subsidiaries. There is a risk that the collateral securing our investments may decrease in value over time or lose its entire value, may be difficult to sell in a timely manner, may be difficult to appraise and may fluctuate in value based upon the success of the business and market conditions, including as a result of the inability of the portfolio company to raise additional capital. Also, in some circumstances, our lien could be subordinated to claims of other creditors. In addition, deterioration in a portfolio company’s financial condition and prospects, including its inability to raise additional capital, may be accompanied by deterioration in the value of the collateral for the loan. Consequently, the fact that a loan is secured does not guarantee that we will receive principal and interest payments according to the loan’s terms, or at all, or that we will be able to collect on the loan should we be forced to enforce our remedies. |
| • | Subordinated Debt. Our subordinated debt investments are generally subordinated to senior debt and are generally unsecured. This may result in a heightened level of risk and volatility or a loss of principal, which could lead to the loss of the entire investment. These investments may involve additional risks that could adversely affect our investment returns. To the extent interest payments associated with such debt are deferred, such debt may be subject to greater fluctuations in valuations, and such debt could subject us and |
74
our shareholders to non-cash income. Since we will not receive any principal repayments prior to the maturity of some of our subordinated debt investments, such investments will be of greater risk than amortizing loans.
| • | Equity Investments. We expect to make selected equity investments. In addition, when we invest in senior and subordinated debt, we may acquire warrants or options to purchase equity securities or benefit from other types of equity participation. Our goal is ultimately to dispose of these equity interests and realize gains upon our disposition of such interests. However, the equity interests we receive may not appreciate in value and, in fact, may decline in value. Accordingly, we may not be able to realize gains from our equity interests, and any gains that we do realize on the disposition of any equity interests may not be sufficient to offset any other losses we experience. |
Most debt securities in which we invest will not be rated by any rating agency and, if they were rated, they would be rated as below investment grade quality. Debt securities rated below investment grade quality are generally regarded as having predominantly speculative characteristics and may carry a greater risk with respect to a borrower’s capacity to pay interest and repay principal.
To the extent original issue discount constitutes a portion of our income, we will be exposed to risks associated with the deferred receipt of cash representing such income.
Our investments may include original issue discount instruments. To the extent original issue discount constitutes a portion of our income, we will be exposed to typical risks associated with such income being required to be included in taxable and accounting income prior to receipt of cash, including the following:
| • | Original issue discount instruments may have unreliable valuations because the accruals require judgments about collectability. |
| • | Original issue discount instruments may create heightened credit risks because the inducement to trade higher rates for the deferral of cash payments typically represents, to some extent, speculation on the part of the borrower. |
| • | For accounting purposes, cash distributions to shareholders representing original issue discount income do not come from paid-in capital, although they may be paid from the offering proceeds. Thus, although a distribution of original issue discount income comes from the cash invested by the shareholders, the 1940 Act does not require that shareholders be given notice of this fact. |
| • | In the case of payment-in-kind, or “PIK,” “toggle” debt, the PIK election has the simultaneous effects of increasing the investment income, thus increasing the potential for realizing incentive fees. |
| • | Original issue discount creates risk of non-refundable cash payments to the Advisors based on non-cash accruals that may never be realized. |
The TRS and any other derivative transactions into which we may enter expose us to certain risks, including market risk, liquidity risk and other risks associated with the use of leverage.
As of November 2012, our wholly owned special purpose financing subsidiary, Halifax Funding, became a party to a total return swap arrangement, or TRS, with The Bank of Nova Scotia, referred to as the counterparty. Pursuant to the TRS, we periodically receive any income generated by TRS reference assets underlying the TRS and collected by the counterparty. We also receive the realized gains from the liquidation of TRS reference assets over the life of the TRS. Correspondingly, if there is a net realized loss from the liquidation of TRS reference assets over the life of the TRS, we are required to periodically pay the counterparty the amount of such net realized losses. Pursuant to the terms of the TRS arrangement, we must pay the counterparty a series of floating rate periodic payments over the life of the TRS. These periodic payments are based on the settled notional amounts of the underlying TRS reference assets.
75
The TRS effectively adds leverage to our portfolio by providing us investment and economic exposure to a security or portfolio of securities without our owning, investing directly in, or taking physical custody of such security or portfolio of securities.
The TRS is subject to market risk, liquidity risk and risk of imperfect correlation between the value of the TRS and the TRS reference assets underlying the TRS. In addition, because the TRS is a form of synthetic leverage, it is subject to risks associated with the use of leverage. Moreover, we may incur certain costs in connection with the TRS that could in the aggregate be significant.
The TRS is subject to the risk that the counterparty will default on its payment obligations under the TRS arrangement or that one party will otherwise not be able to meet its contractual obligations to the other. Under the TRS, we make periodic payments based on a variable interest rate and have to post collateral to secure our obligations to the counterparty. In addition, by making periodic payments based on a variable interest rate, we bear the risk of depreciation with respect to the value of the TRS reference assets underlying the TRS and may be required under the terms of the TRS to post additional collateral on a dollar-for-dollar basis in the event the value of the TRS reference assets underlying the TRS depreciates in a material amount relative to any cash collateral previously posted by us.
If the counterparty chooses to exercise its termination rights under the TRS, it is possible that, because of adverse market conditions existing at the time of such termination, we will owe more to the counterparty (or will be entitled to receive less from the counterparty) than we would otherwise have if we controlled the timing of such termination.
For purposes of determining our compliance with the asset coverage ratio test applicable to us as a business development company, we will treat the outstanding notional amount of the TRS and any further total return swap to which we are a party, less the actual amount of any cash collateral posted by us under the TRS and such further total return swap, as a senior security for the life of that instrument. Further, for purposes of determining our compliance with the 70% qualifying assets requirement of Section 55(a) under the 1940 Act, we will treat each loan or bond underlying the TRS and any further total return swap to which we are a party as a qualifying asset if the obligor on such loan is an eligible portfolio company and as a non-qualifying asset if the obligor is not an eligible portfolio company.
We may be subject to lender liability judgments.
A number of U.S. judicial decisions have upheld judgments obtained by borrowers against lending institutions on the basis of various evolving legal theories, collectively termed “lender liability.” Generally, lender liability is founded on the premise that a lender has violated a duty (whether implied or contractual) of good faith, commercial reasonableness and fair dealing, or a similar duty owed to the borrower or has assumed an excessive degree of control over the borrower resulting in the creation of a fiduciary duty owed to the borrower or its other creditors or shareholders. Because of the nature of our investments in portfolio companies (including that, as a business development company, we may be required to provide managerial assistance to those portfolio companies), we may be subject to allegations of lender liability.
The agreements governing each of our revolving credit facilities contain various covenants which, if not complied with, could accelerate repayment under the relevant facility, thereby materially and adversely affecting our liquidity, financial condition, results of operations and our ability to pay distributions to our shareholders.
Each of our wholly owned, special purpose financing subsidiaries (CCT Funding, Halifax Funding and Paris Funding), is party to a revolving or term credit facility with one or more lenders. We or either of our special purpose financing subsidiaries may become party to such facilities in the future. The agreements governing these facilities currently, and are likely to continue to, contain default provisions such as:
| • | the failure to make principal payments when due or interest payments within three business days of when due; |
| • | borrowings under the facility exceeding the applicable advance rates; |
| • | the purchase by us or the relevant financing subsidiary, as applicable, of certain ineligible assets; |
| • | the insolvency or bankruptcy of us or the relevant financing subsidiary; |
76
| • | the decline of our or the relevant financing subsidiary’s, as applicable, net asset value below a specified threshold; and |
| • | fraud or other illicit acts by us, KKR or CNL in our or their respective investment advisory capacities. |
An event of default under the relevant facility may result, among other things, in the termination of the availability of further funds under the facility and an accelerated maturity date for all amounts outstanding under the facility. This could disrupt our business, reduce our revenues and, by delaying any dividends allowed to us under the facility until the lender has been paid in full, reduce our liquidity and cash flow and impair our ability to grow our business, make distribution payments to our shareholders and maintain our status as a RIC.
The agreements governing each facility would require us or the relevant financing subsidiary, as applicable, to comply with certain operational covenants. These covenants may, for example, require us or the relevant financing subsidiary, as applicable, to, among other things, maintain eligible assets with an aggregate equity value, net of borrowing balance, equal to or exceeding specified amounts under the facility. In addition, under the relevant facility, the occurrence of certain “Super-Collateralization Events” may result in an increase of the collateral equity value that we or the relevant financing subsidiary, as applicable, is required to maintain. Super-Collateralization Events would include, among other things:
| • | certain key employees ceasing to be directors, principals, officers or investment managers of KKR; |
| • | the bankruptcy or insolvency of KKR or CNL; |
| • | KKR or CNL ceasing to act as sub-advisor or advisor for us or CCT Funding; |
| • | our ceasing to act as the relevant financing subsidiary’s investment manager, becoming bankrupt or insolvent, defaulting on certain material agreements or failing to maintain a net asset value above a specified threshold; and |
| • | fraud or other illicit acts by us, KKR or CNL in our or their respective investment advisory capacities. |
A decline in the value of assets owned by us or the relevant financing subsidiary, as applicable or the occurrence of a Super-Collateralization Event under the relevant facility could result in our being required to retain, acquire or contribute to the relevant financing subsidiary, as applicable, additional assets, which would likely disrupt our business and impact our ability to meet our investment objectives and pay distributions to our shareholders.
The failure to meet collateral requirements under the relevant facility or the occurrence of any other event of default that results in the termination of such facility may force us to liquidate positions at a time and/or at a price that is disadvantageous to us and could result in losses. In addition, upon the occurrence of an event of default under the relevant facility, the related lender would have the right to the assets pledged as collateral supporting the amounts outstanding under the facility and could sell such assets in order to satisfy amounts due under the facility.
Each borrowing under any facility will be subject to the satisfaction of certain conditions. We cannot assure you that we or the relevant financing subsidiary, as applicable, will be able to borrow funds under the relevant facility at any particular time or at all. See “Management’s Discussion and Analysis of Financial Condition and Results of Operations—Liquidity and Capital Resources” for a more detailed discussion of the terms of our credit facilities.
To the extent that we borrow money, the potential for gain or loss on amounts invested in us will be magnified and may increase the risk of investing in us. Borrowed money may also adversely affect the return on our assets, reduce cash available for distribution to our shareholders, and result in losses.
The use of borrowings, also known as leverage, increases the volatility of investments by magnifying the potential for gain or loss on invested equity capital. Since we use leverage to partially finance our investments, through borrowing from banks and other lenders, you will experience increased risks of investing in our common stock. If the value of our assets decreases, leveraging will cause net asset value to decline more sharply than it otherwise would if we had not borrowed and employed leverage. Similarly, any decrease in our income would cause net income to decline more sharply than it would have if we had not borrowed and employed leverage. Such a decline could negatively affect our ability to make distributions to our shareholders. In addition, our shareholders will bear the burden of any increase in our expenses as a result of our use of leverage, including interest expenses and any increase in the management or incentive fees payable to the Advisors.
77
The amount of leverage that we employ depends on our Advisors’ and our board of directors’ assessment of market and other factors at the time of any proposed borrowing. There can be no assurance that leveraged financing will be available to us on favorable terms or at all. However, to the extent that we use leverage to finance our assets, our financing costs will reduce cash available for distributions to shareholders. Moreover, we may not be able to meet our financing obligations and, to the extent that we cannot, we risk the loss of some or all of our assets to liquidation or sale to satisfy the obligations. In such an event, we may be forced to sell assets at significantly depressed prices due to market conditions or otherwise, which may result in losses.
As a business development company, we are required to meet a coverage ratio of total assets to total borrowings and other senior securities, which include all of our borrowings and any preferred stock that we may issue in the future, of at least 200%. If this ratio declines below 200%, we cannot incur additional debt and could be required to sell a portion of our investments to repay some debt when it is disadvantageous to do so. This could have a material adverse effect on our operations, and we may not be able to make distributions.
As of December 31, 2011 and December 31, 2012, $25.34 million and $159.62 million, respectively, was borrowed and outstanding under our credit facility. As of December 31, 2012 the weighted average interest rate for all amounts borrowed and outstanding under the credit facility was 2.26%.
Illustration. The following table illustrates the effect of leverage on returns from an investment in our common stock assuming various annual returns, net of expenses. The calculated results in the table are hypothetical and actual returns may be higher or lower than those presented in the table. The calculated results are based on the following assumptions:
| • | $741.67 million in income earning total assets at beginning of 2013 (i.e., assumed total assets for the purpose of this illustration is equal to investments at fair value as of December 31, 2012 and reduced by the amount of payables for investments purchased plus the TRS reference assets at fair value); |
| • | $159.62 million in senior securities from the credit facility outstanding for 2013; |
| • | $76.04 million in deemed senior securities from the TRS for 2013; |
| • | an unused credit facility commitment balance of $15.38 million for 2013 and a commitment fee of 0.50% on unused credit facility commitment balances; |
| • | $611.49 million in net assets attributable to common stock; and |
| • | a current effective interest rate of 2.239%, which includes the impact of the TRS, for 2013. |
In order to compute the “corresponding return to shareholders,” the “assumed return on our portfolio (net of expenses)” is multiplied by the assumed total assets to obtain an assumed return to us. The accrued interest expense is calculated by adding (i) the product of the assumed current effective interest rate times the assumed debt outstanding, and (ii) the product of the commitment fee times the assumed unused credit facility commitment balance. The accrued interest expense as so calculated is then subtracted from the assumed return to us in order to determine the return available to shareholders. The return available to shareholders is then divided by the total amount of net assets attributable to common stock to determine the “corresponding return to shareholders.” The amortization of deferred credit facility financing costs is not considered in accrued interest expense; actual interest payments may be different.
| Assumed return on our portfolio (net of expenses) |
-10.00 | % | -5.00 | % | 0.00 | % | 5.00 | % | 10.00 | % | 0.80 | % | ||||||||||||
| Corresponding return to shareholders |
-13.00 | % | -6.94 | % | -0.88 | % | 5.19 | % | 11.25 | % | 0.00 | % |
The illustrative results in the table above indicate that an assumed -5.0% annual return on our earning assets in 2013 would hypothetically result in a -6.94% return to shareholders of our common stock. Likewise, an assumed 5.0% annual return on our earning assets in 2013 would hypothetically result in a 5.19% return to shareholders of our common stock. Finally, our portfolio must hypothetically earn an annual return of 0.8% in 2013 in order to cover annual interest payments on the assumed level of debt outstanding in 2013.
78
Risks related to an investment in our common stock
Investors will not know the purchase price per share at the time they submit their subscription agreements and could receive fewer shares of common stock than anticipated if our board of directors determines to increase the offering price to comply with the requirement that we avoid selling shares below net asset value.
The purchase price at which you purchase shares will be determined at each closing date to ensure that the sales price is equal to or greater than the then-current net asset value of our shares, after deducting selling commissions and marketing support fees. As a result, your purchase price may be higher than the prior subscription closing price per share, and therefore you may receive a smaller number of shares than if you had subscribed at the prior subscription closing price.
Because our Managing Dealer is an affiliate of CNL, its due diligence review of us is not considered independent. The absence of an independent due diligence review increases the risks and uncertainty you face as a shareholder.
Our Managing Dealer, CNL Securities Corp., is an affiliate of CNL. As a result, its due diligence review and investigation of us and this report cannot be considered to be an independent review. Therefore, you do not have the benefit of an independent review and investigation of our offering of the type normally performed by an unaffiliated, independent underwriter in an underwritten public securities offering. You should not rely on your own broker-dealer to make an independent review and investigation of the terms of our offering. Because you should not rely on your broker-dealer, you will not have the benefit of any independent review and evaluation of the terms of our offering by the Managing Dealer. In addition, we do not, and do not expect to, have research analysts reviewing our performance or our securities on an ongoing basis. Therefore, you will not have an independent review of our performance and the value of our common stock relative to other publicly traded companies.
The price that the investor pays for our shares may not reflect the current net asset value of our company at the time of his or her subscription.
If our net asset value increases above our net proceeds per share as stated in this report, we will sell our shares at a higher price as necessary to ensure that shares are not sold at a net price, after deduction of selling commissions and marketing support fees, that is below our net asset value per share. Also we will file a supplement to the prospectus with the SEC, or amend our registration statement, if our net asset value per share: (i) declines more than 10% from the net asset value per share as of the effective date of our registration statement or (ii) increases to an amount that is greater than the net proceeds per share as stated in the prospectus. Therefore, the net proceeds per share, net of all sales load, from a new investor may be in excess of the then current net asset value per share.
In addition, if the net asset value per share were to decline below 97.5% of the public offering price, net of sales load, for ten continuous business days (for this purpose, any day on which the principal stock markets in the United States are open for business), then, unless and until our board of directors determines otherwise, we will voluntarily suspend selling shares in our offering until the net asset value per share is greater than 97.5% of the public offering price, net of sales load.
| Item 2. | Unregistered Sales of Equity Securities and Use of Proceeds - None |
| Item 3. | Defaults Upon Senior Securities - None |
| Item 4. | Mine Safety Disclosures – Not applicable |
| Item 5. | Other Information - None |
| Item 6. | Exhibits |
The exhibits required by this item are set forth in the Exhibit Index attached hereto and are filed or incorporated as part of this report.
79
Pursuant to the requirements of the Securities Exchange Act of 1934, as amended, the registrant has duly caused this report to be signed on its behalf by the undersigned thereunto duly authorized, on the 14th day of November, 2013.
| CORPORATE CAPITAL TRUST, INC. | ||
| By: | /s/ Andrew A. Hyltin | |
| ANDREW A. HYLTIN | ||
| Chief Executive Officer | ||
| (Principal Executive Officer) | ||
| By: | /s/ Paul S. Saint-Pierre | |
| PAUL S. SAINT-PIERRE | ||
| Chief Financial Officer | ||
| (Principal Financial Officer) | ||
80
The following exhibits are filed or incorporated as part of this report.
| 3.1 |
Second Amended and Restated Articles of Incorporation of the Registrant. (Incorporated by reference to Exhibit 3.1 to the Company’s Current Report on Form 8-K filed on May 8, 2012.) | |
| 3.2 |
Amended and Restated Bylaws of the Registrant. (Incorporated by reference to Exhibit 2(b) filed with Pre-Effective Amendment No. 3 to the Company’s registration statement on Form N-2 (File No. 333-167730) filed on March 29, 2011.) | |
| 10.1 |
Form of Managing Dealer Agreement by and between the Registrant and CNL Securities Corp. (Incorporated by reference to Exhibit 2(h)(1) filed with Pre-Effective Amendment No. 1 to the Company’s registration statement on Form N-2 (File No. 333-189544) filed on October 16, 2013.) | |
| 10.2 |
Form of Participating Broker Agreement. (Incorporated by reference to Exhibit 2(h)(2) filed with Pre-Effective Amendment No. 1 to the Company’s registration statement on Form N-2 (File No. 333-189544) filed on October 16, 2013.) | |
| 10.3 |
Form of Distribution Reinvestment Plan. (Incorporated by reference to Exhibit 2(e) filed with Pre-Effective Amendment No. 2 to the Company’s registration statement on Form N-2 (File No. 333-167730) filed on February 18, 2011.) | |
| 10.4 |
Form of Intellectual Property License Agreement by and between the Registrant and CNL Intellectual Properties, Inc. (Incorporated by reference to Exhibit 2(k)(3) filed with Pre-Effective Amendment No. 2 to the Company’s registration statement on Form N-2 (File No. 333-167730) filed on February 18, 2011.) | |
| 10.5 |
Administrative Services Agreement by and between the Registrant and CNL Fund Advisors Company. (Incorporated by reference to Exhibit 2(k)(2) filed with Pre-Effective Amendment No. 3 to the Company’s registration statement on Form N-2 (File No. 333-167730) filed on March 29, 2011.) | |
| 10.6 |
Custodian Agreement. (Incorporated by reference to Exhibit 2(j) filed with Pre-Effective Amendment No. 3 to the Company’s registration statement on Form N-2 (File No. 333-167730) filed on March 29, 2011.) | |
| 10.7 |
Investment Advisory Agreement by and between the Registrant and CNL Fund Advisors Company. (Incorporated by reference to Exhibit 2(g)(1) filed with Pre-Effective Amendment No. 3 to the Company’s registration statement on Form N-2 (File No. 333-167730) filed on March 29, 2011.) | |
| 10.8 |
Sub-Advisory Agreement by and among the Registrant, CNL Fund Advisors Company and KKR Asset Management LLC. (Incorporated by reference to Exhibit 2(g)(2) filed with Pre-Effective Amendment No. 3 to the Company’s registration statement on Form N-2 (File No. 333-167730) filed on March 29, 2011.) | |
| 10.9 |
Amended and Restated Escrow Agreement by and among the Registrant, UMB Bank N.A., and CNL Securities Corp. (Incorporated by reference to Exhibit 10.10 to the Company’s Quarterly Report on Form 10-Q filed on August 12, 2011.) | |
| 10.10 |
Limited Liability Company Agreement of CCT Funding LLC. (Incorporated by reference to Exhibit 10.13 to the Company’s Quarterly Report on Form 10-Q filed on November 10, 2011.) | |
| 10.11 |
Credit Agreement between CCT Funding LLC and Deutsche Bank AG, New York Branch. (Incorporated by reference to Exhibit 10.14 to the Company’s Quarterly Report on Form 10-Q filed on November 10, 2011.) (Confidential portions of this exhibit have been omitted pursuant to a request for confidential treatment and filed separately with the SEC.) | |
81
| 10.12 |
Custodial Agreement among the Registrant, CCT Funding LLC, Deutsche Bank AG, New York Branch and Deutsche Bank Trust Company Americas. (Incorporated by reference to Exhibit 10.15 to the Company’s Quarterly Report on Form 10-Q filed on November 10, 2011.) (Confidential portions of this exhibit have been omitted pursuant to a request for confidential treatment and filed separately with the SEC.) | |
| 10.13 |
Asset Contribution Agreement between the Registrant and CCT Funding LLC. (Incorporated by reference to Exhibit 10.16 to the Company’s Quarterly Report on Form 10-Q filed on November 10, 2011.) | |
| 10.14 |
Security Agreement between CCT Funding LLC and Deutsche Bank AG, New York Branch. (Incorporated by reference to Exhibit 10.17 to the Company’s Quarterly Report on Form 10-Q filed on November 10, 2011.) | |
| 10.15 |
Investment Management Agreement between the Registrant and CCT Funding LLC. (Incorporated by reference to Exhibit 10.18 to the Company’s Quarterly Report on Form 10-Q filed on November 10, 2011.) | |
| 10.16 |
First Amendment to Credit Agreement between CCT Funding LLC and Deutsche Bank AG, New York Branch. (Incorporated by reference to Exhibit 10.17 to the Company’s Annual Report on Form 10-K filed on March 16, 2012.) (Confidential portions of this exhibit have been omitted pursuant to a request for confidential treatment and filed separately with the SEC.) | |
| 10.17 |
Amended and Restated Expense Support and Conditional Reimbursement Agreement by and among the Registrant, CNL Fund Advisors Company and KKR Asset Management LLC. (Incorporated by reference to Exhibit 10.18 to the Company’s Annual Report on Form 10-K filed on March 16, 2012.) | |
| 10.18 |
Amendment No. 1 to Investment Advisory Agreement by and between the Registrant and CNL Fund Advisors Company. (Incorporated by reference to Exhibit 10.19 to the Company’s Annual Report on Form 10-K filed on March 16, 2012.) | |
| 10.19 |
Second Amendment to Credit Agreement between CCT Funding LLC and Deutsche Bank AG, New York Branch. (Incorporated by reference to Exhibit 10.1 to the Company’s Current Report on Form 8-K filed on August 24, 2012.) (Confidential portions of this exhibit have been omitted pursuant to a request for confidential treatment and filed separately with the SEC.) | |
| 10.20 |
ISDA 2002 Master Agreement, together with the Schedule thereto and Credit Support Annex to such Schedule, each dated as of November 15, 2012, by and between Halifax Funding LLC and The Bank of Nova Scotia. (Incorporated by reference to Exhibit 10.1 to the Company’s Current Report on Form 8-K filed on November 21, 2012.) | |
| 10.21 |
Confirmation Letter Agreement, dated as of November 15, 2012, by and between Halifax Funding LLC and The Bank of Nova Scotia. (Incorporated by reference to Exhibit 10.2 to the Company’s Current Report on Form 8-K filed on November 21, 2012.) | |
| 10.22 |
Amendment to Amended and Restated Expense Support and Conditional Reimbursement Agreement by and among the Registrant, CNL Fund Advisors Company and KKR Asset Management LLC. (Incorporated by reference to Exhibit 10.1 to the Company’s Current Report on Form 8-K filed on January 7, 2013.) | |
| 10.23 |
Third Amendment to Credit Agreement between CCT Funding LLC, the lenders referred to therein and Deutsche Bank AG, New York Branch. (Incorporated by reference to Exhibit 10.1 to the Company’s Current Report on Form 8-K filed on February 14, 2013.) (Confidential portions of this exhibit have been omitted pursuant to a request for confidential treatment and filed separately with the SEC.) | |
| 10.24 |
U.S. PB Agreement, dated as of June 4, 2013, by and between Corporate Capital Trust, Inc. and BNP Paribas Prime Brokerage, Inc. (Incorporated by reference to Exhibit 10.2 to the Company’s Current Report on Form 8-K filed on June 18, 2013.) | |
82
| 10.25 |
Special Custody and Pledge Agreement, dated as of June 4, 2013, by and between Corporate Capital Trust, Inc., BNP Paribas Prime Brokerage, Inc. and State Street Bank and Trust Company. (Incorporated by reference to Exhibit 10.3 to the Company’s Current Report on Form 8-K filed on June 18, 2013.) | |
| 10.26 |
Control Agreement, dated as of July 22, 2013 ,by and among Halifax Funding LLC, The Bank of Nova Scotia, and State Street Bank and Trust Company (Incorporated by reference to Exhibit 10.1 to the Company’s Current Report on Form 8-K filed on July 26, 2013.) | |
| 10.27 |
Amending Agreement, dated as of July 22, 2013, by and among Corporate Capital Trust, Inc., Halifax Funding LLC, The Bank of Nova Scotia, and The Bank of Nova Scotia Trust Company of New York (Incorporated by reference to Exhibit 10.2 to the Company’s Current Report on Form 8-K filed on July 26, 2013.) | |
| 10.28 |
Amended and Restated Committed Facility Agreement, dated as of August 29, 2013, by and between Paris Funding LLC and BNP Paribas Prime Brokerage, Inc. (Incorporated by reference to Exhibit 10.1 to the Company’s Current Report on Form 8-K filed on September 5, 2013.) | |
| 10.29 |
Senior Secured Revolving Credit Agreement, dated as of September 4, 2013, among the Registrant, as borrower, the lenders from time to time party thereto, JPMorgan Chase Bank, N.A., as administrative agent, and ING Capital LLC as syndication agent (Incorporated by reference to Exhibit 10.1 to the Company’s Current Report on Form 8-K filed on September 10, 2013.) | |
| 10.30 |
Guarantee and Security Agreement, dated as of September 4, 2013, and entered into among the Registrant, as borrower, and JPMorgan Chase Bank, N.A., as administrative agent and as collateral agent, and the other parties thereto (Incorporated by reference to Exhibit 10.1 to the Company’s Current Report on Form 8-K filed on September 10, 2013.) | |
| 10.31 |
Control Agreement, dated as of September 4, 2013, among the Registrant, as borrower, JPMorgan Chase Bank, N.A., as collateral agent, and State Street Bank and Trust Company, as custodian (Incorporated by reference to Exhibit 10.1 to the Company’s Current Report on Form 8-K filed on September 10, 2013.) | |
| 10.32 |
Amending Agreement, dated as of November 12, 2013, by and between Halifax Funding LLC and The Bank of Nova Scotia (filed herewith.) | |
| 31.1 |
Certification of Chief Executive Officer of Corporate Capital Trust, Inc., Pursuant to Rule 13a-14(a), as Adopted Pursuant to Section 302 of the Sarbanes-Oxley Act of 2002. (Filed herewith.) | |
| 31.2 |
Certification of Chief Financial Officer of Corporate Capital Trust, Inc., Pursuant to Rule 13a-14(a), as Adopted Pursuant to Section 302 of the Sarbanes-Oxley Act of 2002. (Filed herewith.) | |
| 32.1 |
Certification of Chief Executive Officer and Chief Financial Officer of Corporate Capital Trust, Inc., Pursuant to 18 U.S.C. Section 1350, as Adopted Pursuant to Section 906 of the Sarbanes-Oxley Act of 2002. (Filed herewith.) | |
83