Attached files
| file | filename |
|---|---|
| 8-K - DNB FINANCIAL CORPORATION FORM 8-K - DNB FINANCIAL CORP /PA/ | dnb8k.htm |

Investor Overview Presentation

Forward-looking statements:
Certain statements contained in this presentation are forward-looking in nature. These include all statements
about DNB's plans, objectives, expectations and other statements that are not historical facts, and usually use
words such as "expect," "anticipate," "believe" and similar expressions. Such statements represent
management's current beliefs, based upon information available at the time the statements are made, with
regard to the matters addressed. All forward-looking statements are subject to risks and uncertainties that
could cause DNB's actual results or financial condition to differ materially from those expressed in or implied
by such statements. Factors of particular importance to DNB include, but are not limited to: (1) changes in
general, national or regional economic conditions; (2) changes in interest rates; (3) changes in loan default
and charge-off rates; (4) changes in deposit levels; (5) changes in levels of income and expense in non-
interest income and expense related activities; (6) residential mortgage and secondary market activity; (7)
changes in accounting and regulatory guidance applicable to banks; (8) price levels and conditions in the
public securities markets generally; (9) competition and its effect on pricing, spending, third-party
relationships and revenues; and (10) changes in regulation resulting from or relating to financial reform
legislation. DNB does not undertake any obligation to update or revise any forward-looking statements,
whether as a result of new information, future events or otherwise.
Non-GAAP Financial Measures:
This presentation includes non-GAAP financial measures. Information about any such non-GAAP financial
measures, including a reconciliation of those measures to GAAP, can be found in the presentation and/or in
our SEC reports available on our website at http://investors.dnbfirst.com/.
This presentation includes non-GAAP financial measures. Information about any such non-GAAP financial
measures, including a reconciliation of those measures to GAAP, can be found in the presentation and/or in
our SEC reports available on our website at http://investors.dnbfirst.com/.
FORWARD-LOOKING STATEMENTS & ADDITIONAL
INFORMATION
INFORMATION
2

I. Corporate Overview/Compelling Investment Opportunity (Pages 4-9)
II. Strong Market Drives Opportunity (Pages 10-21)
III. Consistent Performance, Stable Growth & Financial Trends (Pages 22-38)
IV. The Differentiators: Operationally Unique (Pages 39-43)
V. Experienced Management and Board Leadership (Pages 43-47)
VI. Invest in DNBF (Pages 48-51)
TABLE OF CONTENTS
3

CORPORATE OVERVIEW
Founded: 1860, The oldest National Bank in the greater Philadelphia Region
Headquarters: Downingtown, Chester County, Pennsylvania
NASDAQ Ticker: DNBF
Total Assets: $661 million
Deposits: $559 million
Total Equity: $59 million
Branch Offices: 13
Share Price: $20.75
Market Cap: $57 million
Shares Outstanding: 2.8 million
Snapshot December 31, 2013
4

COMPELLING INVESTMENT OPPORTUNITY
Snapshot December 31, 2013
• High quality footprint in affluent Chester and Delaware Counties, Pennsylvania
• Book value per share has grown from $16.08 in 4Q 2012 to $16.55 in 4Q 2013
• High level of low cost core deposits - Cost of Deposits - .29%
• Increasing momentum in non-Interest income which has grown and now generates $1 million
per quarter with about 28% coming from wealth management
• Strong culture of expense control and quality underwriting
• High levels of liquidity will contribute to higher margins over time, given recent market
volatility
• Nimble, opportunistic balance sheet management philosophy
5

COMPELLING INVESTMENT OPPORTUNITY
• Serving growing, diversified and affluent markets in Chester and Delaware Counties,
Pennsylvania
Pennsylvania
• Well capitalized, highly liquid, with clean, conservative balance sheet
• Well positioned to grow to $1 billion-plus in assets
• Low-cost core deposits funds lending and protect margins
• Non-Interest income has grown, with significant contributions from a carefully constructed
investment portfolio and enhanced wealth management services
investment portfolio and enhanced wealth management services
• Proven established management team generating results since 2007
• Historic quarterly cash dividend
• Value opportunity with stock trading below peers
• Focus on Relationship Banking
6

HISTORICAL STOCK PRICE AND PRICE TO
EARNINGS RATIOS COMPARED TO PEERS
7

HISTORICAL STOCK PRICE AND PRICE TO
TANG. BOOK RATIOS COMPARED TO PEERS
8

• Successful balance sheet restructure in early 2010 - ahead of the curve
• Purchased Boothwyn, PA branch in June 2012
• Opened Mortgage Banking Unit January 2014
• One of the 19 banks nationwide to be named to KBW Honor Roll for 3 successive years
• Increased dividend in first quarter 2013
KEY INITIATIVES & MILESTONES
o Significantly reduced funding costs
o Repositioned assets for growth
o Margin expansion
9

Strong Market Drives Opportunity
10

ESTABLISHED PRESENCE IN ATTRACTIVE
SOUTHEASTERN PENNSYLVANIA MARKET
SOUTHEASTERN PENNSYLVANIA MARKET
11

BANKING MARKET OVERVIEW
|
County
|
# of
Branches |
Total Deposits
in Market ($000) |
*Total
Population 2012 (Actual) |
*Population
Change 2011- 2012 (%) |
*Projected
Population Change 2012- 2017 (%) |
*Median HH
Income 2012 ($) |
*Projected
HH Income Change 2012- 2017 (%) |
|
Chester
|
187
|
10,919,200
|
506,575
|
0.74%
|
5.33%
|
86,184
|
13.27%
|
|
Delaware
|
173
|
11,548,800
|
561,098
|
0.12%
|
0.82%
|
64,242
|
24.60%
|
|
County
|
# of
Branches |
2013 Total
Deposits in Market ($000) |
Notes
|
|
Chester
|
10
|
512,400
|
|
|
Delaware
|
3
|
49,700
|
Media-limited service LPO
Boothwyn-purchased June 2012
|
Ø Tremendous growth opportunities in our market.
12
*Source - most recent U.S. Census Bureau Data

MARKET OVERVIEW AND DEMOGRAPHICS
Largest Market: Chester County, PA
• Fast Growing: Population 506,575 in 2012, representing an increase of 73,074 from the 2000
Census (2013 data not available)
Census (2013 data not available)
• Best Educated in PA: Of the population 25 years or older, 93% are high school graduates, 48%
have a bachelor’s degree or higher and 19% have a graduate or professional degree (U.S. Census
Bureau)
have a bachelor’s degree or higher and 19% have a graduate or professional degree (U.S. Census
Bureau)
• Most Affluent County in PA: Median Household Income is $86,184, significantly above U.S.
average of $51,413 (highest income county in the state)
average of $51,413 (highest income county in the state)
• Unemployment rate at 5.3% (as of November 2013), below the PA state average of 6.8% and the
national average of 6.6% (U.S. Bureau of Labor Statistics)
national average of 6.6% (U.S. Bureau of Labor Statistics)
• Diverse Economy: Top three industries by size; 34% services, 15% manufacturing and 11% retail
(Chester County Economic Development Council)
(Chester County Economic Development Council)
• In excess of 7,100 businesses (over $500,000 in sales)
• Median age of 38 is ideal for expansion of banking services to the X and Y generations
13

Growing Banking Presence: Delaware County, PA
• Population 561,098 in 2012, representing an increase of 7,689 from the 2000 Census (2013 data
not available)
not available)
• Of the population 25 years or older, 92% are high school graduates, 35% have a bachelor’s degree
or higher, and 15% have a graduate or professional degree (U.S. Census Bureau)
or higher, and 15% have a graduate or professional degree (U.S. Census Bureau)
• Median Household Income is $64,242, above U.S. average of $51,413
• Unemployment rate at 6.8% (as of November 2013), equal to the PA state average of 6.8% and
above the national average of 6.6% (U.S. Bureau of Labor Statistics)
above the national average of 6.6% (U.S. Bureau of Labor Statistics)
• Fifth most populous county in the state of PA, conducive for expanded banking services growth
• In excess of 7,200 businesses (over $500,000 in sales)
• Median age of 39 is ideal for expansion of banking services to the X and Y generations
MARKET OVERVIEW AND DEMOGRAPHICS
14

• Continue to attract low cost core deposits
• Grow fee revenue as a percentage of total revenues by investing in new business lines, building
full client relationships and maximizing significant untapped cross-sell potential
full client relationships and maximizing significant untapped cross-sell potential
• Build relationship banking in retail and commercial while providing a consistent DNB First
customer experience
customer experience
• Maximize the potential of technology, social media and mobile delivery
• Capture additional business with wealth management, insurance and Mortgage Banking
• Capture lending opportunities with underserved small and mid-sized business market
• Explore accretive Bank & non-Bank acquisition opportunities in Delaware and Chester counties,
as well as in contiguous markets
as well as in contiguous markets
STRATEGY TO SERVE OUR MARKETS AND
GROW
GROW
15

17
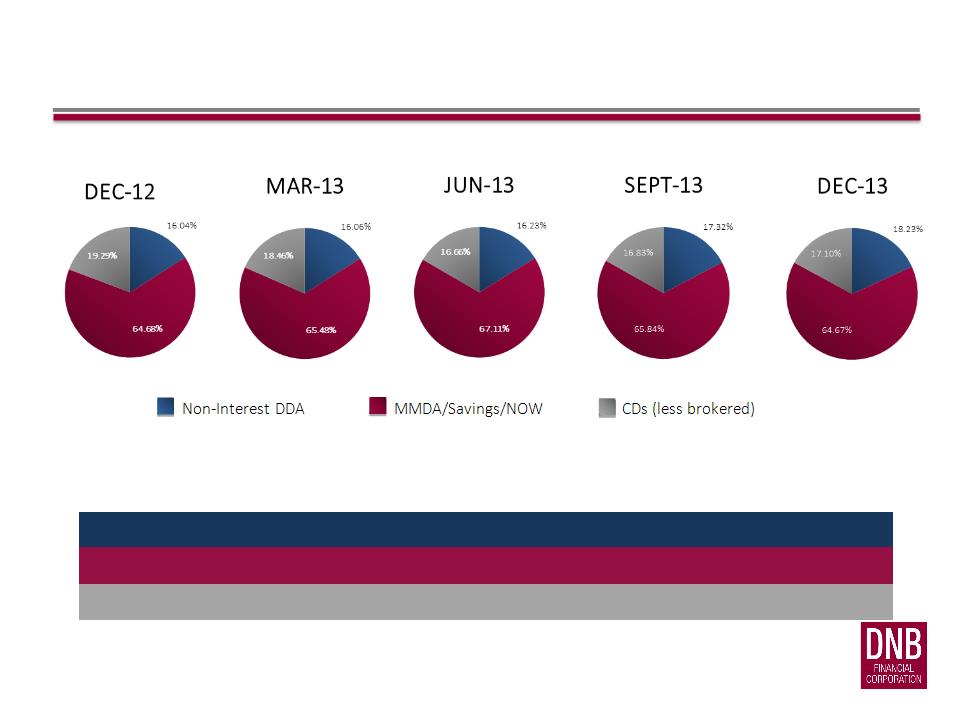
BALANCED DEPOSIT MIX:
STRONG CORE DEPOSIT GROWTH
|
|
Dec-12
|
Mar-13
|
Jun-13
|
13-Sep
|
13-Dec
|
|
|
|
|
|
|
|
|
Non Interest DDA
|
16.04%
|
16.06%
|
16.23%
|
17.32%
|
18.23%
|
|
MMDA/Savings/NOW
|
64.68%
|
65.48%
|
67.11%
|
65.84%
|
64.67%
|
|
CDs (less brokered)
|
19.29%
|
18.46%
|
16.66%
|
16.83%
|
17.10%
|

HIGH LEVEL OF LOW
COST CORE DEPOSITS
18

DETAILED LOAN PORTFOLIO COMPOSITION
|
Loan Type
|
$ Balance
|
Percent
|
|
Commercial RE OO
|
82,657
|
19.90%
|
|
Commercial RE NOO
|
84,537
|
20.35%
|
|
Residential 1-4
|
62,893
|
15.14%
|
|
Commercial & Industrial
|
53,207
|
12.81%
|
|
Residential 5+
|
28,759
|
6.92%
|
|
SBA/USDA Guaranteed
|
35,340
|
8.51%
|
|
Construction
|
22,483
|
5.41%
|
|
Home Equity LOC
|
21,685
|
5.22%
|
|
Municipal/Govt/Non-Profit
|
6,813
|
1.64%
|
|
Home Equity
|
8,348
|
2.01%
|
|
Consumer
|
7,515
|
1.81%
|
|
Farmland
|
1,116
|
0.27%
|
|
Leases
|
2
|
0.00%
|
|
Total
|
415,354
|
100.00%
|
Snapshot December 31, 2013
19

20
BALANCED LOAN PORTFOLIO
|
|
|
Dec-12
|
Mar-13
|
Jun-13
|
Sept-13
|
Dec-13
|
|
Construction
|
|
3.85%
|
3.89%
|
4.37%
|
4.54%
|
5.41%
|
|
Residential RE
|
|
29.02%
|
28.62%
|
28.82%
|
29.07%
|
29.29%
|
|
Commercial RE
|
|
48.76%
|
50.03%
|
49.48%
|
49.42%
|
48.76%
|
|
C&I
|
|
13.04%
|
12.94%
|
12.94%
|
12.86%
|
12.81%
|
|
Consumer
|
|
2.20%
|
2.12%
|
2.11%
|
1.87%
|
1.81%
|
|
Miscellaneous
|
|
3.13%
|
2.40%
|
2.28%
|
2.24%
|
1.92%
|
|
|
|
|
|
|
|
|
|
Residential RE loans include 1-4, 5+, Home Equity and Home Equity LOC
|
|
|
||||
|
Commercial RE loans include OO, NOO and SBA/USDA Guaranteed
|
|
|
||||

LOAN PORTFOLIO
21

DNB’s Financial Strength, Consistent
Performance, Stable Growth and Financial Trends
22

EXECUTIVE SUMMARY
23
*Adjusted net income available to common shareholders is a non-gaap measure. Due to significant disparity of the provision expense for the 3rd quarter 2013
($1,600,000) compared to the other quarters presented ($375,000 in the 2nd and 4th quarters of 2013, and $180,000 in the 4th quarter of 2012 and 1st
quarter 2013), management believes that this non-gaap measure is useful to readers as a comparative tool as it assumes for the 3rd quarter 2013 a provision
expense that is more in line with the other quarters ($375,000), as well as a normalized tax rate of 25%.
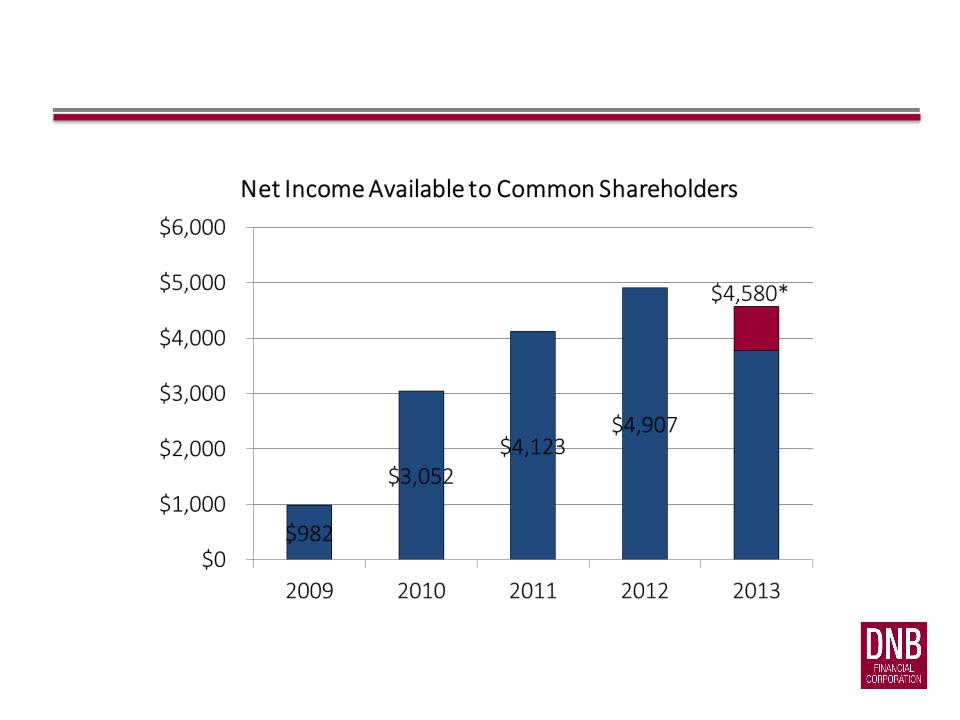
EARNINGS & PER SHARE DATA
24
*Adjusted net income available to common shareholders is a non-gaap measure. Due to significant disparity of the provision expense
for the 3rd quarter 2013 ($1,600,000) compared to the other quarters presented ($375,000 in the 2nd and 4th quarters of 2013, and
$180,000 in the 4th quarter of 2012 and 1st quarter 2013), management believes that this non-gaap measure is useful to readers as a
comparative tool as it assumes for the 3rd quarter 2013 a provision expense that is more in line with the other quarters ($375,000), as
well as a normalized tax rate of 25%.
$3,771

EARNINGS & PER SHARE DATA
25
*Adjusted net income available to common shareholders is a non-gaap measure. Due to significant disparity of the provision
expense for the 3rd quarter 2013 ($1,600,000) compared to the other quarters presented ($375,000 in the 2nd and 4th
quarters of 2013, and $180,000 in the 4th quarter of 2012 and 1st quarter 2013), management believes that this non-gaap
measure is useful to readers as a comparative tool as it assumes for the 3rd quarter 2013 a provision expense that is more in
line with the other quarters ($375,000), as well as a normalized tax rate of 25%.

EARNINGS & PER SHARE DATA
26
EXECUTIVE SUMMARY
|
Performance Ratios
|
2012 Q4
|
2013 Q1
|
2013 Q2
|
2013 Q3
|
ADJ 2013 Q3*
|
2013 Q4
|
|
Return on average assets
|
0.83%
|
0.74%
|
0.76%
|
.20%
|
.69%
|
.70%
|
|
Return on average equity
|
9.26%
|
8.32%
|
8.60%
|
2.28%
|
7.82%
|
7.86%
|
|
Return on average tangible equity
|
9.31%
|
8.36%
|
8.65%
|
2.29%
|
7.85%
|
7.89%
|
|
Net interest margin
|
3.55%
|
3.32%
|
3.35%
|
3.21%
|
3.21%
|
3.31%
|
|
Efficiency ratio
|
66.64%
|
69.43%
|
66.98%
|
70.84%
|
70.84%
|
70.15%
|
27
*Adjusted net income available to common shareholders is a non-gaap measure. Due to significant disparity of the provision expense for the 3rd
quarter 2013 ($1,600,000) compared to the other quarters presented ($375,000 in the 2nd and 4th quarters of 2013, and $180,000 in the 4th quarter
of 2012 and 1st quarter 2013), management believes that this non-gaap measure is useful to readers as a comparative tool as it assumes for the 3rd
quarter 2013 a provision expense that is more in line with the other quarters ($375,000), as well as a normalized tax rate of 25%.

PERFORMANCE RATIOS
28
*Adjusted net income available to common shareholders is a non-gaap measure. Due to significant disparity of the provision expense
for the 3rd quarter 2013 ($1,600,000) compared to the other quarters presented ($375,000 in the 2nd and 4th quarters of 2013, and
$180,000 in the 4th quarter of 2012 and 1st quarter 2013), management believes that this non-gaap measure is useful to readers as a
comparative tool as it assumes for the 3rd quarter 2013 a provision expense that is more in line with the other quarters ($375,000), as
well as a normalized tax rate of 25%.
for the 3rd quarter 2013 ($1,600,000) compared to the other quarters presented ($375,000 in the 2nd and 4th quarters of 2013, and
$180,000 in the 4th quarter of 2012 and 1st quarter 2013), management believes that this non-gaap measure is useful to readers as a
comparative tool as it assumes for the 3rd quarter 2013 a provision expense that is more in line with the other quarters ($375,000), as
well as a normalized tax rate of 25%.
0.60%

PERFORMANCE RATIOS
29
*Adjusted net income available to common shareholders is a non-gaap measure. Due to significant disparity of the provision
expense for the 3rd quarter 2013 ($1,600,000) compared to the other quarters presented ($375,000 in the 2nd and 4th quarters of
2013, and $180,000 in the 4th quarter of 2012 and 1st quarter 2013), management believes that this non-gaap measure is useful to
readers as a comparative tool as it assumes for the 3rd quarter 2013 a provision expense that is more in line with the other quarters
($375,000), as well as a normalized tax rate of 25%.
6.75%

PERFORMANCE RATIOS
30

PERFORMANCE RATIOS
31
EXECUTIVE SUMMARY
|
Asset Quality Ratios
|
2012 Q4
|
2013 Q1
|
2013 Q2
|
2013 Q3
|
2013 Q4
|
|
Net Charge-offs to average loans
|
-0.10%
|
-0.11%
|
0.82%
|
4.03%
|
0.06%
|
|
Non-performing loans/Total loans
|
2.63%
|
4.05%
|
2.60%
|
1.40%
|
1.38%
|
|
Allowance for credit loss/Total loans
|
1.72%
|
1.77%
|
1.72%
|
1.08%
|
1.11%
|
|
Allowance for credit loss/Non-performing loans
|
65.54%
|
43.76%
|
65.94%
|
77.04%
|
80.73%
|
32

ASSET QUALITY RATIOS
33

ASSET QUALITY RATIOS
34

ASSET QUALITY RATIOS
35

EXECUTIVE SUMMARY
|
Capital Ratios
|
2012 Q4
|
2013 Q1
|
2013 Q2
|
2013 Q3
|
2013 Q4
|
|
Total equity/Total assets
|
8.87%
|
8.98%
|
8.60%
|
8.89%
|
8.86%
|
|
Tangible equity/Tangible assets
|
8.83%
|
8.94%
|
8.58%
|
8.87%
|
8.84%
|
|
Tangible common equity/Tangible assets
|
6.80%
|
6.92%
|
6.63%
|
6.87%
|
6.87%
|
|
Tier 1 leverage ratio
|
10.50%
|
10.48%
|
10.42%
|
10.39%
|
10.61%
|
|
Tier 1 risk-based capital ratio
|
14.63%
|
14.74%
|
15.22%
|
15.18%
|
15.35%
|
|
Total risk-based capital ratio
|
15.88%
|
15.99%
|
16.47%
|
16.16%
|
16.40%
|
36

CAPITAL RATIOS
37

CAPITAL RATIOS
38

The Differentiators: Operationally Unique
39

ENTERPRISE RISK MANAGEMENT
• Led by William Hieb, President & Chief Risk and Credit Officer
• Integration across financial, operational, strategic and compliance
• Committee-driven decision-making process
• Management
• Board of Directors
• Internal Control Redundancies
• Accountability
40

ENTERPRISE RISK MANAGEMENT
• Corporate goal of building and maintaining a fortress balance sheet
• Strong asset quality
• Strong levels of liquidity with contingency planning
• Superior ALCO process
41

PROACTIVE INVESTMENT
PORTFOLIO MANAGEMENT
• Three tiered/segmented investment portfolio
o Liquidity
o Intermediate
o Income
• Manage liquidity and cash flows better
• Maneuverability - Asset mix shifts
• Opportunistic
• Facilitates strong earnings
• Consistent with ERM
42

Experienced Management and Board Leadership
43

EXPERIENCED MANAGEMENT TEAM
William S. Latoff - Chairman & Chief Executive Officer
42 years experience in finance, public accounting, real estate and automotive industries. Director since 1998, Chairman of the Board since 2003 and CEO since 2004.
Chairman of the Executive and Board Loan Committees. Currently serves as Director and past Chairman of the Chester Country Industrial Development Authority,
Chairman of the Chester County Library Trust Board, Member of the Nominating Committee for the Federal Reserve Bank of Philadelphia, Member of the American
Bankers Association's Public Affairs Committee, Member of the Pennsylvania Business Council Roundtable and The Chester County Chamber of Business and Industry,
where he serves on the Nominating Committee. Previously served on the Board of Directors of Keystone Financial and on the Board of Elmwood Federal Savings Bank,
Chairman Emeritus of the Chester County Historical Society, Member of the Chester County Economic Development Council and former Board Member, Past Chairman
of the Pennsylvania Bankers Public Affairs Committee and a former member of the Government Relations Policy Committee. Prior experience: Significant Real Estate
Development experience, Bliss & Company, Ltd., Certified Public Accountants, Chairman and President of Brandywine Automotive Group, Inc. and former owner of
Mercedes Benz of West Chester.
William J. Hieb - President and Chief Risk & Credit Officer
35 years of experience in commercial banking with a concentration in middle market lending, construction and CRE as well as specialized lending and capital
markets. Director of the Corporation since 2005 and a Director of the Bank since 2004. President and Chief Operating Officer of the Corporation and the Bank since
2011. Prior to that served as President and Chief Operating Officer of the Corporation and Bank since 2005. Chairman of the Wealth Management Committee and
member of the Board Loan Committee. Served as Board Member of the Chester County Economic Development Council from 2008 to 2013, the Chester County
Chamber of Business and Industry Foundation since 2007, the Downingtown Area School District Education Foundation since 2009, the Business Leadership Organized
for Catholic Schools since 2012, the Pennsylvania Bankers Association from 2009 to 2013 and the Chester County Historical Society since 2010. Served as Treasurer,
Board Member and a member of the Executive Committee of the Housing Partnership of Chester County from 2005 to 2012. Prior experience: First Union National
Bank and predecessor banks from 1978 to 2002. Served as a Senior Vice President of First Union National Bank and Managing Director of the First Union Securities in
Philadelphia. Holds Series 7, 24 and 63 Securities Licenses.
Gerald F. Sopp - Executive Vice President, Chief Financial Officer & Corporate Secretary
36 years of experience in financial services, manufacturing and retail. Joined DNB in 2007 and is directly responsible for financial reporting and accounting,
asset/liability management, strategic planning, human resources and facilities. Prior experience: Vice President and Controller of Wilmington Trust Corporation,
Wilmington, Delaware from 2000 to 2006, Vice President and Controller of The Clarks Companies, N.A., Newton Upper Falls, Massachusetts from 1993 to 2000,
Assistant Controller of Silo, Inc., Philadelphia, Pennsylvania from 1991 to 1992, and Vice President of Corporate Accounting and Reporting for Chase Manhattan Bank
(USA), Wilmington, Delaware from 1983 to 1991. Previously served on the Board of Directors of Habitat for Humanity of Chester County and served as Treasurer and
Board Member of the Financial Executives International, Delaware Chapter.
44

EXPERIENCED MANAGEMENT TEAM
Vince Liuzzi - Executive Vice President, Chief Banking Officer
30 years banking and financial services experience with emphasis on retail banking, consumer lending, geographic and territory executive leadership, community
relations and development. Joined DNB first in 2014 and is responsible to develop and direct strategies for the company’s Banking Group, including branch banking, operations,
specialty lines of business; consumer and mortgage lending, small business banking, cash and treasury management, credit, debit and merchant card services; and DNB ’s Sales
and Marketing functions. Currently serves on the board of directors and strategic planning committee for the Archdiocese of Greater Philadelphia Catholic Social Services, the
Salvation Army of Greater Philadelphia board of directors and finance committee and served recently as board member for the Greater Philadelphia Chamber of Commerce, the
Marian Anderson Awards, and the Ronald McDonald House in Wilmington. Served on the National Board of Directors for the Moyer foundation. Served in leadership positions
with the Valley Industry and Commerce Association, the Economic Alliance of the San Fernando Valley, the Boys and Girls Clubs of the San Fernando Valley and the Los Angeles
Children’s Museum. Recognized in 2012 by the Salvation Army with the “Doing the Most Good” Community leadership award. Prior experience: Executive leadership positions
with Wells Fargo Bank as Executive Vice President and Region President for the company’s Greater Philadelphia and Delaware region.
Albert J. Melfi, Jr. - Executive Vice President & Chief Lending Officer
40 years experience in the commercial banking industry with a concentration in middle market and CRE lending. Joined DNB in 2006 and is directly responsible for all
commercial and personal lending. Prior experience: Regional Vice President of Commerce Bank, PA, N.A., Vice President of Continental/MidAtlantic, N.A. and Vice President of
First Pennsylvania Bank. Currently serves as a Board Member and past Chairman of the Chester County Chamber of Business and Industry, Board Member and Vice Chairman of
the Delaware County Industrial Development Authority, Chairman of the Delaware County Industrial Development Corporation's Loan Review Committee, Board Member of the
Community Action Agency of Delaware County, Board Member of the Chester County Bar Association Foundation Board, Board Member of Delaware County Hero Bowl, Board
Member of Chester County Workforce & Development, Active member of SEEDCO's Loan Committee and Pennsylvania Banker's Association. Past Affiliations include: Chairman
of the Delaware County Chamber of Commerce, Chairman of the American Heart Association, Member of Neumann College President’s Advisory Committee and President of
Delco Lodge Sons of Italy. Mr. Melfi has served on the Boards of the following organizations: Society for the Performing Arts of Media Theater, Barrier Awareness, Delaware
County Community College Education Foundation, Archbishop Prendergast High School , Penn Delco School District’s Superintendent’ Advisory Board, Community Transit of
Delaware County, United Way of Delaware County, American Red Cross, Delaware County Education Foundation, Southwest Delco Municipal Authority, Delaware County
Historical Society, Neumann College Business Advisory Board, March of Dimes, Brandywine Convention and Visitors Bureau. Mr. Melfi has also served as a volunteer EMT and
fireman for the Yeadon and Norwood Fire Companies and with Big Brothers of America.
45

EXPERIENCED MANAGEMENT TEAM
Bruce E. Moroney - Executive Vice President & Chief Accounting Officer
36 years of experience in banking with a concentration in accounting, finance and treasury management. Joined DNB in 1992 and is directly responsible for SEC and
regulatory reporting and budgeting. Prior experience: Executive Vice President and Chief Financial Officer of Brandywine Savings Bank from 1978 to 1992. Board member
regulatory reporting and budgeting. Prior experience: Executive Vice President and Chief Financial Officer of Brandywine Savings Bank from 1978 to 1992. Board member
and former President of Downingtown Good Neighbor Day, Inc., Trustee for Kerr Park Foundation, Help the Children Advisory Board Member, former Advisory Board Member
of Bishop Shanahan High School and Family Services of Chester County's Retired Senior Volunteer Program.
James F. Gagliano - Director of Retail Services and Cash Management
21 years of retail banking and financial services experience. James joined DNB First in 2013 and is directly responsible for DNB First's retail branches & cash
management. Served on the board of the IM Able Foundation and numerous committees including; Berks County Habitat for Humanity (Fundraising Committee), Leadership
Berks (Marketing Committee) and The Wachovia Foundation (charitable allocations committee - Central Pennsylvania). Prior experience: District Managing Executive of The
Huntington Bank, Akron/Canton, Ohio region from January 2013 to June 2013; District Executive and Senior Vice President of Sovereign/Santander Bank, Reading / Lancaster,
Pennsylvania from 2010 to 2012; District Manager, Financial Sales Leader, Senior Producing Leader - Vice President and Senior Financial Specialist of Wachovia/Wells Fargo
(Lancaster-Reading, PA, Deal, NJ & Miami Beach, Florida from 1999 to 2010); Financial Advisor of Morgan Stanley (Miami Beach, Florida from 1997 to 1999).
Richard C. Weber - Managing Director of Wealth Management
41 years in commercial banking industry with a focus on corporate banking, regional management, marketing and wealth management. Joined DNB in 2010 and is
directly responsible for DNB's Wealth Management Group. Prior experience: Senior Vice President and Managing Director of Fifth Third Bank's Investment Advisors Division,
Senior Vice President and Managing Director of Comerica Bank's Investment Management and Trust Division, Executive Vice President and Managing Director of National City
Bank's Private Client Group, Senior Vice President and Director of Private Banking Consulting for Cannon Financial Institute and Executive Vice President of Meridian Bank's
Personal Trust Division & Private Banking Group. Mr. Weber currently assists Church Farm School with their fund raising efforts and has served on the Boards of the Allentown
Chamber of Commerce, Easter Seal Society of Berks County, Pennsylvania Stage Company in Allentown and Great Lakes Theater Company. Mr. Weber has served as Chairman of
the United Way Campaign for the State of Delaware, Vice Chairman of the Board of St. Joseph's Hospital in Reading, Pennsylvania, Chairman of the Montgomery County
Workforce Investment Board, Chairman of the Rotary Council of Berks County and President of the Town Hall of Cleveland. He has also served as a Member of the Investment
Committee for the United Way of Southeast Michigan and as a Trustee for the United Way of Berks County, Pennsylvania and Wilmington, Delaware as well as for Think TV
(public television).
46

EXPERIENCED MANAGEMENT TEAM
Frank S. Monterosso - Senior Vice President of Operations
24 years of experience in operations management with a concentration in electronic commerce, payment solutions and banking. Joined DNB in 2008 and is directly
responsible for IT and deposit operations. Prior experience: Senior Director of Financial Operations of First Data Corporation, Vice President of Operations of Progress Bank,
Assistant Vice President of Operations of First Pennsylvania Bank and Manager of Deposit Operations for Chase Manhattan Bank.
Catherine H. Hall - Senior Vice President, Marketing Director
Business Banking Marketing (Mid-Atlantic Region) of Citizens 33 years of experience in financial services with a concentration in marketing. Joined DNB in 2009 and is
directly responsible for marketing, product development and website management. Prior Experience: Vice President and Marketing Manager of First National Bank of Chester
County, Vice President and Marketing Director of Republic First Bank, Vice President and Manager of Commercial &Bank and Assistant Vice President of Marketing of Mellon
Bank.
.
47

Invest in DNB Financial
48
2013 DNBF STOCK PERFORMANCE
|
Security or Index
|
2013 Return
|
|
DNBF*
|
33.87%
|
|
NASDAQ Bank Index*
|
39.33%
|
|
KBW Bank Index*
|
34.71%
|
Closing price on Dec 31, 2012: $15.50
Closing price on Dec 27, 2013: $20.75
*Source: Bloomberg
49

INVESTOR RELATIONS CONTACT
Gerald F. Sopp
484.359.3138
gsopp@dnbfirst.com
http://investors.dnbfirst.com/
50
For more information, Investors may contact:

THANK YOU
51

Investment analysis for dnb financial corporation february 24, 2014 investment analysis for dnb financial corporation / february 24, 2014 1 dnb financial corp. (nasdaq: dnbf) compelling investment opportunity moving forward dominant community bank market share in our footprint. Prudently managed balance sheet positioned for earnings growth. Non-interest income represents growing percentage of overall revenue with a commitment to further wealth management build out. Attractive branch network with a low cost of funds. Good expense discipline has created efficiency. Stock trades at a discount to peer earnings and book multiples. Great geography & market presence with 13 locations in chester and delaware counties, dnb is well situated in the most attractive markets outside of philadelphia; and is not far from harrisburg, lancaster and wilmington. Dnb is #1 in downingtown and is the only locally-owned bank in the top three. Others that have bought into downingtown such as first niagara through harleysville national and toronto-dominion through commerce, have lost ground. Key statistics balance sheet 12/31/13: assets: $661 million loans: $415 million equity: $58.6 million tangible comm. Eq.: $45.5 million adjusted 2013 earnings:*net income: $4.6 million return on assets: 0.72% return on equity: 8.15% stock data as of 2/24/14: price: $19.00 per share 1 year price change: 13.4% change since 12/31/09: 208.9% 52 week high: $23.43 52 week low: $16.03 market cap: $52.3 million price/ltm adjusted earnings: 11.5× ltm adjusted eps: $1.65 price/tangible book: 115% tangible book: $16.51 per share dividend: $0.07 quarterly dividend yield: 1.47% other data: equity/assets: 8.86% tang. Comm. Eq./assets: 6.88% reserves/loans: 1.11% npas/assets: 1.02% capitalization** december 31, 2013 total risk-based: 16.40% tier 1: 15.35% leverage: 10.61% ** minimums to be considered well-capitalized are 10%, 6% and 5%, respectively. Bank june 2013 june 2008 dnb 42.0% 39.0% first niagara 21.3% 28.5% toronto-dominion 9.9% 10.8%* adjusted net income available to common shareholders is a non-gaap measure. Due to the significant disparity of the provision expense for the 3rd quarter 2013 ($1,600,000) compared to the other quarters presented ($375,000 in the 2nd and 4th quarters 2013, and $180,000 in 4th quarter 2012 and 1st quarter 2013), management believes that this non-gaap measure is useful to readers as a comparative tool as it assumes for the 3rd quarter 2013 a provision expense that is more in line with the other quarters ($375,000), as well as a normalized tax rate of 25%.

DNB FINANCIAL CORP. (NASDAQ: DNBF) COMPELLING INVESTMENT OPPORTUNITY DNB STOCK IS TRADING LOWER THAN PEERS DNBF stock data 2/24/14: $19.00 per share 11.5× adjusted LTM earnings of $1.65 per share 11.6× 4th quarter annualized earnings of $1.64 per share 115% of tangible book of $16.51 per share Based on 13 peers that have the following characteristics: Located between Virginia and New York Assets between $500 million and $1 billion ROE over 6% NPAs/assets under 3% Average number of shares traded daily in excess of 1,000 shares Excludes non-comparable banks with large fee income (over 2.50% of average assets), or tangible equity over 12% of assets or TARP Peer pricing multiples: Peers trade at 13.0× LTM earnings, 12.8× MRQ annualized earnings and 125% of tangible book If DNB’s stock traded at peer medians, the implied stock price is: $21.45 based on 13.0× adjusted LTM earnings per share $20.64 per share based on 125% of tangible book Other factors DNB’s dividend yield at 1.47% was lower than all but three comparable institutions, which did not pay a dividend. DNB FINANCIAL CORP. HISTORICAL STOCK PRICE AND PRICE TO TANGIBLE BOOK RATIOS COMPARED TO PEERS 130% 120% 110% 100% 90% 80% 70% 60% $25.00 $0.00 50% $5.00 $10.00 $15.00 $20.00 Peer group implied price: $20.64 DNB Price/Tangible Book | Peer Price/Tangible Book | Price *As of February 24, 2014 using December 31, 2013 financial data. Source: SNL Financial, Charlottesville, Virginia. 2009 2010 2011 2012 2013 2014* $6.15 $9.00 $10.68 $15.50 $20.75 $19.00 16.2× 7.8× 10.6×7.0× 9.1× 8.7× 10.4× 12.6× 13.0× 11.5× 13.0× 13.5× $0.38 $1.16 $1.53 $1.79 $1.65** $1.65**$6.15 $9.00 $10.68 $15.50 $20.75 $19.00 $11.90 +$0.47 $12.59 +$0.69 $14.09 +$1.50 $16.01 +$1.92 $16.51 +$0.50 $16.51 52% 71% 96% 102% 76% 91% 97% 126% 121% 115% DNB FINANCIAL CORP. HISTORICAL STOCK PRICE AND PRICE TO EARNINGS RATIOS COMPARED TO PEERS *As of February 24, 2014 using adjusted earnings for the twelve months ended December 31, 2013. ** Adjusted net income available to common shareholders is a non-gaap measure. Due to the significant disparity of the provision expense for the 3rd quarter 2013 ($1,600,000) compared to the other quarters presented ($375,000 in the 2nd and 4th quarters 2013, and $180,000 in 4th quarter 2012 and 1st quarter 2013), management believes that this non-gaap measure is useful to readers as a comparative tool as it assumes for the 3rd quarter 2013 a provision expense that is more in line with the other quarters ($375,000), as well as a normalized taxrate of 25%. Source: SNL Financial, Charlottesville, Virginia.
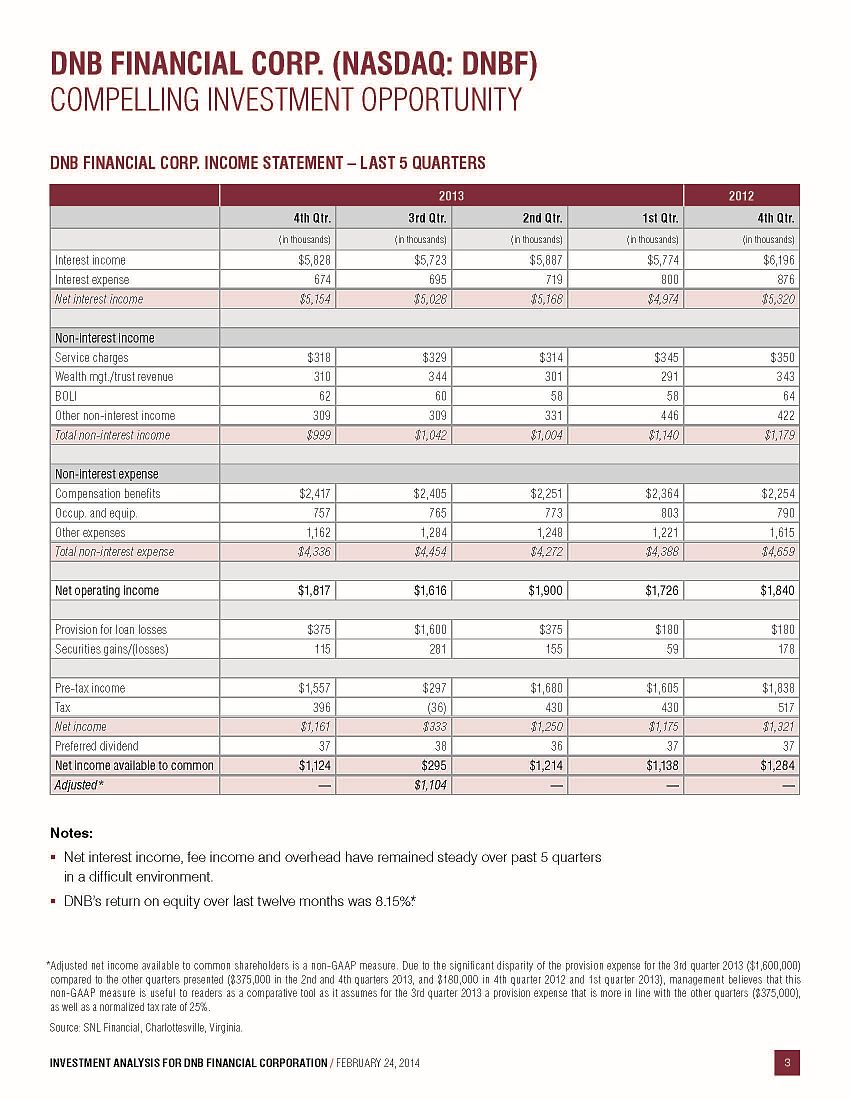
DNB FINANCIAL CORP. (NASDAQ: DNBF) COMPELLING INVESTMENT OPPORTUNITY DNB FINANCIAL CORP. INCOME STATEMENT – LAST 5 QUARTERS 2013 2012 4th Qtr. 3rd Qtr. 2nd Qtr. 1st Qtr. 4th Qtr. (in thousands) (in thousands) (in thousands) (in thousands) (in thousands) Interest income $5,828 $5,723 $5,887 $5,774 $6,196 Interest expense 674 695 719 800 876 Net interest income $5,154 $5,028 $5,168 $4,974 $5,320 Non-interest income Service charges $318 $329 $314 $345 $350 Wealth mgt./trust revenue 310 344 301 291 343 BOLI 62 60 58 58 64 Other non-interest income 309 309 331 446 422 Total non-interest income $999 $1,042 $1,004 $1,140 $1,179 Non-interest expense Compensation benefits $2,417 $2,405 $2,251 $2,364 $2,254 Occup. and equip. 757 765 773 803 790 Other expenses 1,162 1,284 1,248 1,221 1,615 Total non-interest expense $4,336 $4,454 $4,272 $4,388 $4,659 Net operating income $1,817 $1,616 $1,900 $1,726 $1,840 Provision for loan losses $375 $1,600 $375 $180 $180 Securities gains/(losses) 115 281 155 59 178 Pre-tax income $1,557 $297 $1,680 $1,605 $1,838 Tax 396 (36) 430 430 517 Net income $1,161 $333 $1,250 $1,175 $1,321 Preferred dividend 37 38 36 37 37 Net income available to common $1,124 $295 $1,214 $1,138 $1,284 Adjusted* — $1,104 — — —Notes: Net interest income, fee income and overhead have remained steady over past 5 quarters in a difficult environment. DNB’s return on equity over last twelve months was 8.15%.* * Adjusted net income available to common shareholders is a non-GAAP measure. Due to the significant disparity of the provision expense for the 3rd quarter 2013 ($1,600,000) compared to the other quarters presented ($375,000 in the 2nd and 4th quarters 2013, and $180,000 in 4th quarter 2012 and 1st quarter 2013), management believes that this non-GAAP measure is useful to readers as a comparative tool as it assumes for the 3rd quarter 2013 a provision expense that is more in line with the other quarters ($375,000), as well as a normalized tax rate of 25%. Source: SNL Financial, Charlottesville, Virginia.

DNB FINANCIAL CORP. (NASDAQ: DNBF) COMPELLING INVESTMENT OPPORTUNITY COMPARABLE BANKS DESCRIPTION* Full Name City, State Assets Ticker Exchange (in millions) 1st Constitution Bancorp Cranbury, NJ $742 FCCY NASDAQ Bancorp of New Jersey, Inc. Fort Lee, NJ 611 BKJ NYSE MKT Elmira Savings Bank Elmira, NY 514 ESBK NASDAQ Embassy Bancorp, Inc. Bethlehem, PA 661 EMYB OTCQB Evans Bancorp, Inc. Hamburg, NY 833 EVBN NYSE MKT First Capital Bancorp, Inc. Glen Allen, VA 548 FCVA NASDAQ Harleysville Savings Financial Corporation Harleysville, PA 809 HARL OTCQB Norwood Financial Corp. Honesdale, PA 711 NWFL NASDAQ QNB Corp. Quakertown, PA 933 QNBC OTCQB Unity Bancorp, Inc. Clinton, NJ 921 UNTY NASDAQ Virginia Heritage Bank Vienna, VA 895 VGBK OTCQB Median (11 banks) — $742 — — DNB Financial Corporation Downingtown, PA $661 DNBF NASDAQ Notes: The upper end of the asset range was limited to $1 billion as banks with higher asset levels usually trade at higher price to tangible book multiples and thus were considered to be less comparable.

DNB FINANCIAL CORP. (NASDAQ: DNBF)COMPELLING INVESTMENT OPPORTUNITY COMPARABLE BANKS FINANCIAL PERFORMANCE* Short Name Assets Common Tangible Equity / Assets NPAs** / Assets Return on Avg. Assets Return on Avg. Equity (in millions) (%) (%) (%) (%) 1st Constitution $742 8.61 1.68 .72 8.73 Bancorp of New Jersey 611 9.16 1.72 .80 8.55 Elmira Savings 514 6.33 .70 .97 8.51 Embassy 661 7.89 1.37 .84 10.08 Evans 833 8.79 2.26 .96 10.06 First Capital 548 8.06 1.45 .73 8.05 Harleysville Savings 809 7.70 1.78 .60 7.89 Norwood Financial 711 11.65 1.90 1.23 9.13 QNB 933 8.11 2.18 .91 10.95 Unity 921 6.05 2.71 .61 7.75 Virginia Heritage 895 9.04 .33 1.10 10.79 Median (11 banks) $742 8.11 1.72 .84 8.73 DNB $661 6.88 1.02 .60 6.75 Adjusted*** — — — .72 8.15 Notes: In comparison to its peers, DNB’s assets, capitalization, NPAs and returns on assets and equity are very comparable.

DNB FINANCIAL CORP. (NASDAQ: DNBF) COMPELLING INVESTMENT OPPORTUNITY COMPARABLE BANKS SELECTED FINANCIAL COMPARISONS* Short Name Loans / Assets Non-Int. Deposits / Deposits Yield on Earning Assets Cost of Funds Non-Int. Income / Avg. Assets Efficiency Ratio (%) (%) (%) (%) (%) (%) 1st Constitution 52 19 3.90 .69 .72 67 Bancorp of New Jersey 77 13 4.44 1.33 .03 56 Elmira Savings 76 15 4.47 1.14 1.06 66 Embassy 85 10 3.97 .49 .30 63 Evans 78 9 4.16 .51 1.48 72 First Capital 79 15 4.67 1.04 .41 74 Harleysville Savings 60 8 3.92 1.65 .30 62 Norwood Financial 71 4 4.39 .60 .64 52 QNB 54 9 3.44 .60 .54 62 Unity 74 18 4.41 .83 .67 71 Virginia Heritage 80 27 4.22 .71 1.24 62 Median (11 banks) 76 13 4.22 .71 .64 63 DNB 63 18 3.76 .49 .64 69 Notes: In comparison to its peers, DNB has fewer assets committed to loans, but slightly more non-interest bearing deposits and a much lower cost of funds.

DNB FINANCIAL CORP. (NASDAQ: DNBF) COMPELLING INVESTMENT OPPORTUNITY COMPARABLE BANKS STOCK PERFORMANCE – FEBRUARY 24, 2014* Price / Times Earnings Price / Percent of Short Name Stock Price MRQ LTM Tang. Book Assets Dividend Yield Shares Traded Daily** 1st Constitution $10.38 11.8× 10.9× 98% 8.4% .00% 3,124 Bancorp of New Jersey 13.08 14.9 15.0 125 11.4 1.83 3,167 Elmira Savings 24.00 20.0 17.1 201 12.7 3.48 1,354 Embassy 7.76 10.2 10.5 109 8.6 .64 3,455 Evans 22.70 14.6 12.3 132 11.4 2.73 3,134 First Capital 4.62 19.3 18.5 131 10.7 .00 7,494 Harleysville Savings 18.00 13.2 14.4 110 8.4 4.67 1,297 Norwood Financial 30.27 12.6 13.0 135 15.5 3.96 2,565 QNB 28.00 11.7 10.9 121 9.8 3.86 1,042 Unity 7.90 11.6 14.9 108 6.5 .51 3,476 Virginia Heritage 19.95 12.8 12.1 148 13.6 .00 4,547 Median (11 banks) – 12.8× 13.0× 125% 10.7% 1.83% 3,134 DNB $19.00 11.6× 14.0× 115% 8.1% 1.47% 1,306 Adjusted*** — — 11.5× — — — — Notes: In comparison to its peers, DNB trades at a lower P/E multiple, a lower price to tangible book and has similar levels of liquidity.
CONTACT Gerald F. Sopp EVP, Chief Financial Officer 4 Brandywine Avenue Downingtown, PA 19335 484.359.3138 gsopp@dnbfirst.comFORWARD-LOOKING STATEMENTS: Certain statements contained in this presentation are forward-looking in nature. These include all statements about DNB’s plans, objectives, expectations and other statements that are not historical facts, and usually use words such as “expect,” “anticipate,” “believe” and similar expressions. Such statements represent management’s current beliefs, based upon information available at the time the statements are made, with regard to the matters addressed. All forward-looking statements are subject to risks and uncertainties that could cause DNB’s actual results or financial condition to differ materially from those expressed in or implied by such statements. Factors of particular importance to DNB include, but are not limited to: (1) changes in general, national or regional economic conditions; (2) changes in interest rates; (3) changes in loan default and charge-off rates; (4) changes in deposit levels; (5) changes in levels of income and expense in non-interest income and expense related activities; (6) residential mortgage and secondary market activity; (7) changes in accounting and regulatory guidance applicable to banks; (8) price levels and conditions in the public securities markets generally; (9) competition and its effect on pricing, spending, third-party relationships and revenues; and (10) changes in regulation resulting from or relating to financial reform legislation. DNB does not undertake any obligation to update or revise any forward-looking statements, whether as a result of new information, future events or otherwise. NON-GAAP FINANCIAL MEASURES: This presentation includes non-GAAP financial measures. Information about any such non-GAAP financial measures, including a reconciliation of those measures to GAAP, can be found in the presentation and/or in our SEC reports available on our website at www.dnbfirst.com.