Attached files
| file | filename |
|---|---|
| EX-23 - EXHIBIT 23 - DNB FINANCIAL CORP /PA/ | a2197556zex-23.htm |
| EX-21 - EXHIBIT 21 - DNB FINANCIAL CORP /PA/ | a2197556zex-21.htm |
| EX-32.1 - EXHIBIT 32.1 - DNB FINANCIAL CORP /PA/ | a2197556zex-32_1.htm |
| EX-32.2 - EXHIBIT 32.2 - DNB FINANCIAL CORP /PA/ | a2197556zex-32_2.htm |
| EX-31.1 - EXHIBIT 31.1 - DNB FINANCIAL CORP /PA/ | a2197556zex-31_1.htm |
| EX-23.1 - EXHIBIT 23.1 - DNB FINANCIAL CORP /PA/ | a2197556zex-23_1.htm |
| EX-31.2 - EXHIBIT 31.2 - DNB FINANCIAL CORP /PA/ | a2197556zex-31_2.htm |
| EX-10.(W) - EXHIBIT 10(W) - DNB FINANCIAL CORP /PA/ | a2197556zex-10_w.htm |
| EX-99.1 - EXHIBIT 99.1 - DNB FINANCIAL CORP /PA/ | a2197556zex-99_1.htm |
UNITED STATES
SECURITIES AND EXCHANGE COMMISSION
Washington, D.C. 20549
FORM 10-K
ý ANNUAL REPORT PURSUANT TO SECTION 13 OR 15(d) OF THE
SECURITIES EXCHANGE ACT OF 1934
For the fiscal year ended
December 31, 2009
or
o TRANSITION
REPORT PURSUANT TO SECTION 13 or 15(d) OF THE SECURITIES
EXCHANGE ACT OF 1934
For the transition period from to . Commission file Number 0-16667

(Exact Name of registrant as specified in its charter)
| Pennsylvania | 23-2222567 | |
(State or other jurisdiction of |
(I.R.S. Employer Identification No.) |
|
| incorporation or organization) | ||
4 Brandywine Avenue, Downingtown, Pennsylvania (Address of principal executive offices) |
19335 (Zip Code) |
|
Registrant's telephone number, including area code: (610) 269-1040 Securities registered pursuant to Section 12 (b) of the Act: N/A Securities registered pursuant to Section 12 (g) of the Act: Common stock, par value $1.00 per share (Title of class) |
||
Indicate by check mark whether the registrant is a well-known seasoned issuer, as defined in Rule 405 of the Securities Act. o Yes ý No
Indicate by check mark if the registrant is not required to file reports pursuant to Section 13 or Section 15(d) of the Act. o Yes ý No
Indicate by check mark whether the Registrant: (1) has filed all reports required to be filed by Section 13 or 15(d) of the Securities Exchange Act of 1934 during the preceding 12 months (or for such shorter period that the Registrant was required to file such reports), and (2) has been subject to such filing requirements for the past 90 days. ý Yes o No
Indicate by check mark whether the registrant has submitted electronically and posted on its corporate Web site, if any, every Interactive Data File required to be submitted and posted pursuant to Rule 405 of Regulation S-T (§ 232.405 of this chapter) during the preceding 12 months (or for such shorter period that the registrant was required to submit and post such files). o Yes o No
Indicate by check mark if disclosure of delinquent filers pursuant to Item 405 of Regulation S-K is not contained herein, and will not be contained, to the best of registrant's knowledge, in definitive proxy or information statements incorporated by reference in Part III of this Form 10-K or any amendment to this Form 10-K. o
Indicate by check mark whether the registrant is a large accelerated filer, an accelerated filer, a non-accelerated filer, or a smaller reporting company. See the definitions of "large accelerated filer," "accelerated filer," and "smaller reporting company" in Rule 12b-2 of the Exchange Act. (Check one):
| Large accelerated filer o | Accelerated filer o | Non-accelerated filer o (Do not check if a smaller reporting company) |
Smaller reporting company ý |
Indicate by check mark whether the registrant is a shell company (as defined in Rule 12b-2 of the Act). o Yes ý No
The aggregate market value of the shares of common stock of the Registrant issued and outstanding on June 30, 2009, which excludes 334,000 shares held by all directors, officers and affiliates of the Registrant as a group, was approximately $17.1 million. This figure is based on the closing price of $7.55 per share of the Registrant's common stock on June 30, 2009, the last business day of the Registrant's second fiscal quarter.
As of March 25, 2010, the Registrant had outstanding 2,626,511 shares of Common Stock, $1 par value per share.
DOCUMENTS INCORPORATED BY REFERENCE
Portions of the Registrant's definitive Proxy Statement relating to the 2010 Annual Meeting of Shareholders are incorporated by reference into Part III of this Form 10-K.
DNB FINANCIAL CORPORATION
Table of Contents
DNB FINANCIAL CORPORATION
FORM 10-K
This report contains statements which, to the extent that they are not recitations of historical fact may constitute forward-looking statements within the meaning of the United States Private Securities Litigation Reform Act of 1995. Such forward-looking statements may include financial and other projections as well as statements regarding DNB's future plans, objectives, performance, revenues, growth, profits, operating expenses or DNB's underlying assumptions. The words "may", "would", "could", "will", "likely", "expect," "anticipate," "intend", "estimate", "plan", "forecast", "project" and "believe" or other similar words and phrases may identify forward-looking statements. Persons reading this report are cautioned that such statements are only predictions, and that DNB's actual future results or performance may be materially different.
Such forward-looking statements involve known and unknown risks and uncertainties. A number of factors, many of which are beyond DNB's control, could cause our actual results, events or developments, or industry results, to be materially different from any future results, events or developments expressed, implied or anticipated by such forward-looking statements, and so our business and financial condition and results of operations could be materially and adversely affected. Such factors include, among others, our need for capital; the impact of economic conditions on our business; changes in banking regulation and the possibility that any banking agency approvals we might require for certain activities will not be obtained in a timely manner or at all or will be conditioned in a manner that would impair our ability to implement our business plans; our ability to attract and retain key personnel; competition in our marketplace; and other factors as described in our securities filings. All forward-looking statements and information made herein are based on our current expectations as of the date hereof and speak only as of the date they are made. DNB does not undertake to update forward-looking statements.
For a complete discussion of the assumptions, risks and uncertainties related to our business, you are encouraged to review our filings with the Securities and Exchange Commission, including this Form 10-K, as well as any changes in risk factors that we may identify in our quarterly or other reports filed with the SEC.
(a) General Description of Registrant's Business and Its Development
DNB Financial Corporation (the "Registrant" or "DNB"), a Pennsylvania business corporation, is a bank holding company registered with and supervised by the Board of Governors of the Federal Reserve System (Federal Reserve Board). The Registrant was incorporated on October 28, 1982 and commenced operations on July 1, 1983 upon consummation of the acquisition of all of the outstanding stock of Downingtown National Bank, now known as DNB First, National Association (the "Bank"). Since commencing operations, DNB's business has consisted primarily of managing and supervising the Bank, and its principal source of income has been derived from the Bank. At December 31, 2009, DNB had total consolidated assets, total liabilities and stockholders' equity of $634.2 million, $591.3 million, and $42.9 million, respectively.
The Bank was organized in 1860. The Bank is a national banking association that is a member of the Federal Reserve System, the deposits of which are insured by the Federal Deposit Insurance Corporation ("FDIC"). The Bank is a full service commercial bank providing a wide range of services to individuals and small to medium sized businesses in the southeastern Pennsylvania market area, including accepting time, demand, and savings deposits and making secured and unsecured commercial, real estate and consumer loans. In addition, the Bank has eleven full service and two limited service branches and a full-service
1
wealth management group known as "DNB Advisors". The Bank's financial subsidiary, DNB Financial Services, Inc., is a Pennsylvania licensed insurance agency, which, together with the Bank, sells a broad variety of insurance and investment products. The Bank's other subsidiaries are Downco, Inc. and DN Acquisition Company, Inc which were incorporated in December 1995 and December 2008, respectively, for the purpose of acquiring and holding other real estate owned acquired through foreclosure or deed in-lieu-of foreclosure, as well as Bank-occupied real estate. In accordance with U.S. generally accepted accounting principles, the Registrant and the Bank operate as one segment, and therefore do not report segment financial information.
The Bank's headquarters is located at 4 Brandywine Avenue, Downingtown, Pennsylvania. As of December 31, 2009, the Bank had total assets of $633.8 million, total deposits of $508.4 million and total stockholders' equity of $51.1 million. The Bank's business is not seasonal in nature. The FDIC, to the extent provided by law, insures its deposits. At December 31, 2009, the Bank had 109 full-time employees and 21 part-time employees.
The Bank derives its income principally from interest charged on loans and, to a lesser extent, interest earned on investments, fees received in connection with the origination of loans, wealth management and other services. The Bank's principal expenses are interest expense on deposits and borrowings and operating expenses. Funds for activities are provided principally by operating revenues, deposit growth and the repayment of outstanding loans and investments.
The Bank encounters vigorous competition from a number of sources, including other commercial banks, thrift institutions, other financial institutions and financial intermediaries. In addition to commercial banks, Federal and state savings and loan associations, savings banks, credit unions and industrial savings banks actively compete in the Bank's market area to provide a wide variety of banking services. Mortgage banking firms, real estate investment trusts, finance companies, insurance companies, leasing companies and brokerage companies, financial affiliates of industrial companies and certain government agencies provide additional competition for loans and for certain financial services. The Bank also competes for interest-bearing funds with a number of other financial intermediaries, which offer a diverse range of investment alternatives, including brokerage firms and mutual fund companies.
(b) Financial Information About Geographic Areas
The geographic information required by Item 101(d) of Regulation S-K under the Securities Exchange Act of 1934, as amended, is impracticable for the Registrant to calculate, however, the Registrant does not believe that a material amount of revenues in any of the last three years were attributable to customers outside of the United States, nor does it believe that a material amount of its long-lived assets in any of the past three years were located outside of the United States.
Supervision and Regulation — Registrant
Sarbanes-Oxley Act of 2002. The Sarbanes-Oxley Act of 2002 ("Sarbanes-Oxley") imposes significant requirements and restrictions on publicly-held companies, such as the Registrant. These provisions include requirements governing the composition and responsibilities of audit committees, financial disclosures and reporting and restrictions on personal loans to directors and officers. Sarbanes-Oxley, among other things, mandates chief executive and chief financial officer certifications of periodic financial reports, additional financial disclosures concerning off-balance sheet items, and speedier transaction reporting requirements for executive officers, directors and 10% shareholders. Rules promulgated by the SEC pursuant to Sarbanes-Oxley impose substantial reporting and compliance obligations on management and boards of directors, and new obligations and restrictions have been placed on auditors and audit committees that are intended to enhance their independence from management. In addition, penalties for non-compliance with the federal securities laws are heightened. The Registrant has and will incur significant additional expense complying with Sarbanes-Oxley requirements.
2
The Registrant is subject to a number of complex Federal banking laws, most notably the provisions of the Bank Holding Company Act of 1956, as amended ("Bank Holding Company Act") and the Change in Bank Control Act of 1978 ("Change in Control Act"), and to supervision by the Federal Reserve Board.
Bank Holding Company Act — Financial Holding Companies
The Bank Holding Company Act requires a "company" (including the Registrant) to secure the prior approval of the Federal Reserve Board before it owns or controls, directly or indirectly, more than five percent (5%) of the voting shares or substantially all of the assets of any bank. It also prohibits acquisition by any "company" (including the Registrant) of more than five percent (5%) of the voting shares of, or interest in, or all or substantially all of the assets of, any bank located outside of the state in which a current bank subsidiary is located unless such acquisition is specifically authorized by laws of the state in which such bank is located. A "bank holding company" (including the Registrant) is prohibited from engaging in or acquiring direct or indirect control of more than five percent (5%) of the voting shares of any company engaged in non-banking activities unless the Federal Reserve Board, by order or regulation, has found such activities to be so closely related to banking or managing or controlling banks as to be a proper incident thereto. In making this determination, the Federal Reserve Board considers whether the performance of these activities by a bank holding company would offer benefits to the public that outweigh possible adverse effects. Applications under the Bank Holding Company Act and the Change in Control Act are subject to review, based upon the record of compliance of the applicant with the Community Reinvestment Act of 1977 ("CRA"). See further discussion below.
The Registrant is required to file an annual report with the Federal Reserve Board and any additional information that the Federal Reserve Board may require pursuant to the Bank Holding Company Act. The Federal Reserve Board may also make examinations of the Registrant and any or all of its subsidiaries. Further, under Section 106 of the 1970 amendments to the Bank Holding Company Act and the Federal Reserve Board's regulations, a bank holding company and its subsidiaries are prohibited from engaging in certain tie-in arrangements in connection with any extension of credit or provision of credit or provision of any property or services. The so-called "anti-tie-in" provisions state generally that a bank may not extend credit, lease, sell property or furnish any service to a customer on the condition that the customer provide additional credit or service to the bank, to its bank holding company or to any other subsidiary of its bank holding company or on the condition that the customer not obtain other credit or service from a competitor of the bank, its bank holding company or any subsidiary of its bank holding company.
Permitted Non-Banking Activities. The Federal Reserve Board permits bank holding companies to engage in non-banking activities so closely related to banking or managing or controlling banks as to be a proper incident thereto. A number of activities are authorized by Federal Reserve Board regulation, while other activities require prior Federal Reserve Board approval. The types of permissible activities are subject to change by the Federal Reserve Board. Revisions to the Bank Holding Company Act contained in the Federal Gramm- Leach Bliley Act of 1999 permit certain eligible bank holding companies to qualify as "financial holding companies" and thereupon engage in a wider variety of financial services such as securities and insurance activities.
Gramm-Leach Bliley Act of 1999 ("GLB"). This law repeals certain restrictions on bank and securities firm affiliations, and allows bank holding companies to elect to be treated as a "financial holding company" that can engage in approved "financial activities," including insurance, securities underwriting and merchant banking. Banks without holding companies can engage in many of these new financial activities through a "financial subsidiary." The law also mandates functional regulation of bank securities activities. Banks' exemption from broker-dealer regulation would be limited to, for example, trust, safekeeping, custodian, shareholder and employee benefit plans, sweep accounts, private placements (under certain conditions), self-directed IRAs, third party networking arrangements to offer brokerage services to bank customers, and the like. It also requires banks that advise mutual funds to register as
3
investment advisers. The legislation provides for state regulation of insurance, subject to certain specified state preemption standards. It establishes which insurance products banks and bank subsidiaries may provide as principal or underwriter, and prohibits bank underwriting of title insurance, but also preempts state laws interfering with affiliations. GLB prohibits approval of new de novo thrift charter applications by commercial entities and limits sales of existing so-called "unitary" thrifts to commercial entities. The law bars banks, savings and loans, credit unions, securities firms and insurance companies, as well as other "financial institutions," from disclosing customer account numbers or access codes to unaffiliated third parties for telemarketing or other direct marketing purposes, and enables customers of financial institutions to "opt out" of having their personal financial information shared with unaffiliated third parties, subject to exceptions related to the processing of customer transactions and joint financial services marketing arrangements with third parties, as long as the institution discloses the activity to its customers and requires the third party to keep the information confidential. It requires policies on privacy and disclosure of information to be disclosed annually, requires federal regulators to adopt comprehensive regulations for ensuring the security and confidentiality of consumers' personal information, and allows state laws to give consumers greater privacy protections. The GLB is likely to increase the competition the Bank faces, and this increased competition is likely to come from a wider variety of non-banking competitors as well as banks.
Under the Change in Control Act, no person, acting directly or indirectly or through or in concert with one or more other persons, may acquire "control" of any Federally insured depository institution unless the appropriate Federal banking agency has been given 60 days prior written notice of the proposed acquisition and within that period has not issued a notice disapproving of the proposed acquisition or has issued written notice of its intent not to disapprove the action. The period for the agency's disapproval may be extended by the agency. Upon receiving such notice, the Federal agency is required to provide a copy to the appropriate state regulatory agency, if the institution of which control is to be acquired is state chartered, and the Federal agency is obligated to give due consideration to the views and recommendations of the state agency. Upon receiving a notice, the Federal agency is also required to conduct an investigation of each person involved in the proposed acquisition. Notice of such proposal is to be published and public comment solicited thereon. A proposal may be disapproved by the Federal agency if the proposal would have anticompetitive effects, if the proposal would jeopardize the financial stability of the institution to be acquired or prejudice the interests of its depositors, if the competence, experience or integrity of any acquiring person or proposed management personnel indicates that it would not be in the interest of depositors or the public to permit such person to control the institution, if any acquiring person fails to furnish the Federal agency with all information required by the agency, or if the Federal agency determines that the proposed transaction would result in an adverse effect on a deposit insurance fund. In addition, the Change in Control Act requires that, whenever any Federally insured depository institution makes a loan or loans secured, or to be secured, by 25% or more of the outstanding voting stock of a Federally insured depository institution, the president or chief executive officer of the lending bank must promptly report such fact to the appropriate Federal banking agency regulating the institution whose stock secures the loan or loans.
Troubled Assets Relief Program (TARP). In response to the financial crisis affecting the banking system and financial markets, on October 3, 2008, the Emergency Economic Stabilization Act of 2008 ("EESA") was signed into law and established the Troubled Assets Relief Program known as TARP administered by the U.S. Treasury Department. As part of TARP, the Treasury established the Capital Purchase Program ("CPP") to provide up to $700 billion of funding to eligible financial institutions through the purchase of capital stock and other financial instruments for the purpose of stabilizing and providing liquidity to the U.S. financial markets. In connection with EESA, there have been numerous actions by the Federal Reserve Board, Congress, the Treasury, the FDIC, the SEC and others to further the economic and banking industry stabilization efforts under EESA. It remains unclear at this time what further legislative and regulatory measures will be implemented under EESA affecting the Registrant.
4
The American Reinvestment and Recovery Act of 2009 (sometimes called ARRA), which became effective February 17, 2009, contains expansive new restrictions on executive compensation for financial institutions such as the Registrant that participate in the CPP. ARRA amends EESA by continuing all the same compensation and governance restrictions. It also adds the following major new requirements so long as the Registrant has any obligations under the CPP (other than the warrants to purchase our common stock issued to the Treasury): prohibition on payment of any "bonus, retention award, or incentive compensation" to the Registrant's chief executive officer, other than bonus amounts payable pursuant to agreements in effect on or before February 11, 2009, but permitting the Registrant to issue "long-term" restricted stock, with a value not exceeding one-third of the total amount of annual compensation of the employee receiving the stock, and not fully vesting until after CPP obligations have been satisfied; requiring every company receiving CPP assistance to permit a non-binding shareholder vote to approve the compensation of executives as disclosed in the Registrant's proxy statement; prohibiting any payment to a senior executive officer or any of the next five most highly-compensated employees for departure from the Registrant for any reason, except for payments for services performed or benefits accrued; extending the EESA clawback of bonus or other incentive payment based on materially inaccurate financial or other performance criteria to the next 20 most highly compensated employees in addition to the senior executive officers; prohibiting a CPP participant from implementing any compensation plan that that would encourage manipulation of the reported earnings of the Registrant to enhance the compensation of any of its employees; requiring our Benefits & Compensation Committee to meet at least semiannually to discuss and evaluate employee compensation plans in light of an assessment of any risk to the Registrant posed by such plans; requiring the chief executive officer and chief financial officer to provide a written certification of compliance with the executive compensation restrictions in ARRA in a registrant's annual filings with the SEC; and requiring each CPP participant to implement a company-wide policy regarding excessive or luxury expenditures, including excessive expenditures on entertainment or events, office and facility renovations, aviation or other transportation services. ARRA requires the Treasury Department and the SEC to issue rules to implement its new executive compensation restrictions. Until rules are finalized, many details relating to the new rules described above will remain unclear.
On June 10, 2009, the Treasury Department announced an interim final rule on the executive compensation standards for recipients of TARP funds. The interim final rule provides that it supersedes all prior rules and guidance on executive compensation limitations under the TARP program. Among other things, in terms of its application to the Bank, the interim final rule contains the following provisions:
1. Limitations on Executive Compensation for Companies Receiving TARP Assistance. The interim final rule:
- •
- Limits bonuses paid to the most highly compensated executive officer.
- •
- Prohibits any golden parachute payment to a senior executive officer or any of the next 5 most highly compensated
employees. While ARRA limited the definition of golden parachutes to payments for an employee's departure for any reason, the rule also includes payments made in connection with a change in control of
the Bank.
- •
- Implements the ARRA mandate that bonuses paid to senior executive officers and next 20 most highly compensated employees be subject to a clawback if the payment was based on materially inaccurate performance criteria, and requires that the TARP recipient actually exercise its clawback rights in such a case unless the TARP recipient can demonstrate that it would be unreasonable to do so (for example, if the expense of enforcing the clawback right exceeds the benefits of doing so).
2. Implementation of ARRA Requirements for Compensation Practices. The rule:
- •
- Expands on EESA's requirement that compensation plans for senior executive officers be limited to avoid incentives for unnecessary risk-taking, ARRA's expansion of that requirement to cover all employee compensation plans, and ARRA's requirement that no employee compensation plan encourage the manipulation of earnings, by requiring that a bank's compensation committee of the
5
- •
- Implements ARRA's requirement that the board of directors of each TARP recipient put in place a company-wide
policy on luxury or excessive expenditures and requires that the policy mandate prompt internal reporting of any violations of the policy, and that the CEO and the CFO of each TARP recipient certify
that any expenditure requiring the approval of the board of directors or a senior executive officer was properly approved.
- •
- Implements and clarifies ARRA's shareholder "say on pay" resolution requirement.
financial institution conduct an analysis of whether compensation, plans or practices encourage unnecessary risk-taking.
3. Additional Compensation and Governance Standards. The rule adopts the following new requirements:
- •
- Prohibits the payment to senior executive officers and the 20 next most highly compensated employees of a tax
"gross-up," or a payment to cover taxes due on compensation such as golden parachutes and perquisites.
- •
- Requires a TARP recipient such as the Bank to disclose to the Treasury Department and its primary federal regulator any
perquisites provided to any employee subject to ARRA's bonus limitations with total value exceeding $25,000 and, in that case, provide those agencies a narrative description of, and justification for,
the benefit.
- •
- Requires a TARP recipient such as the Bank to disclose to the Treasury Department and its primary federal regulator whether the Bank or its compensation committee engaged a compensation consultant and to provide to those agencies a narrative description of the services provided by any such consultant, including any non-compensation related services provided by the consultant or any of its affiliates, as well as a description of the use of any "benchmarking" procedures in the consultant's analysis.
4. Certification Requirements. The rule requires TARP recipients to provide:
- •
- Within ninety days of the completion of each fiscal year, a TARP recipient's principal executive officer and principal
financial officer must provide a certification to its primary federal regulatory agency and the Treasury Department regarding the TARP recipient's compliance with rules established by EESA, ARRA and
the interim final rule.
- •
- At least once each fiscal year, a TARP recipient's compensation committee must provide to its primary federal regulator and the Treasury Department a narrative description identifying each senior executive officer compensation plan and explaining how the plan does not encourage its senior executive officers to take unnecessary and excessive risks that threaten the value of the TARP recipient. The compensation committee must also identify each employee compensation plan (whether or not it covers senior executive officers), explain how any unnecessary risks posed by the plan have been limited, and further explain how the plan does not encourage the manipulation of reported earnings to enhance the compensation of any employee.
Participation in U.S. Treasury Capital Purchase Program On January 30, 2009, as part of the Capital Purchase Program administered by the United States Department of the Treasury, the Registrant entered into a Letter Agreement and a Securities Purchase Agreement — Standard Terms attached thereto with the U.S. Treasury, pursuant to which the Registrant issued and sold on January 30, 2009, and the U.S. Treasury purchased for cash on that date (i) 11,750 shares of the Registrant's Fixed Rate Cumulative Perpetual Preferred Stock, Series 2008A, par value $10.00 per share, having a liquidation preference of $1,000 per share, and (ii) a ten-year warrant to purchase up to 186,311 shares of the Registrant's common stock, $1.00 par value, at an exercise price of $9.46 per share, for an aggregate purchase price of $11,750,000 in cash (this is called the transaction). This transaction closed on January 30, 2009. The issuance and sale of these securities was a private placement exempt from registration pursuant to Section 4(2) of the Securities Act of 1933.
6
The preferred shares will qualify as Tier 1 capital and will pay cumulative dividends at a rate of 5% per annum for the first five years and 9% per annum thereafter. Dividends are payable on the preferred shares quarterly and are payable on February 15, May 15, August 15, and November 15 of each year. Should the Registrant fail to pay a total of six dividend payments on the preferred shares, whether or not consecutive, the holders of the preferred shares will have the right to elect two directors to the Registrant's board of directors until the Registrant has paid all such dividends that it had failed to pay. The preferred shares have no maturity date and rank senior to the Registrant's common stock with respect to the payment of dividends and distributions and amounts payable upon liquidation, dissolution and winding up of the Registrant. The preferred shares are generally non-voting, but do have contingent rights to vote on certain matters as more fully described in the Certificate of Designations for the preferred shares.
For three years following the closing date, the Registrant may redeem the preferred shares only from the sale or sales of qualifying equity securities of the Registrant in a "Qualified Equity Offering," as defined in the agreement, resulting in the aggregate of not less than 25% of the U.S. Treasury's purchase price. The agreement defines a "Qualified Equity Offering" as the sale for cash by the Registrant, after the closing date, of shares of preferred stock or common stock that qualify as Tier I capital of the Registrant under the capital guidelines of the Registrant's federal banking agency. After three years following the closing date, the Registrant may redeem the preferred shares in whole or in part at any time, or from time to time. All redemptions are subject to the approval of the Board of Governors of the Federal Reserve System.
The U.S. Treasury may not transfer a portion of the warrant with respect to, or exercise the warrant for more than one-half of, the 186,311 shares of the Registrant's common stock issuable upon exercise of the warrant until the earlier of (i) the date on which the Registrant has received aggregate gross proceeds of not less than $11,750,000 from one or more Qualified Equity Offerings and (ii) December 31, 2009. The company is obligated to register the resale of the preferred shares and the warrant, and the issuance of shares of common stock upon exercise of the warrant, under certain circumstances including without limitation if the Registrant files another registration statement under which the preferred shares, the warrant or the common shares issuable on exercise of the warrant can be registered or if, under certain circumstances, the U.S. Treasury requests.
The Securities Purchase Agreement pursuant to which the preferred shares and the warrant were sold contains limitations on the payment of dividends on common stock (other than regular quarterly cash dividends of not more than $0.13 per share of common stock), junior preferred shares, and on other preferred shares. The ability to repurchase common stock, junior preferred shares, or other preferred shares is also restricted under the Securities Purchase Agreement, which provides that, prior to the earlier of January 30, 2012 and the date on which the preferred shares have been redeemed in whole or the Treasury has transferred all of the preferred shares to third parties which are not affiliates of the Treasury, neither the Registrant nor any Registrant subsidiary shall, without the consent of the Treasury, redeem, purchase or acquire any shares of the Registrant's common stock or other capital stock or other equity securities of any kind of the Registrant, or any trust preferred securities issued by the Registrant or any affiliate of the Registrant, other than (A) redemptions, purchases or other acquisitions of the preferred shares, (B) redemptions, purchases or other acquisitions of shares of common stock or other stock junior to the preferred shares in connection with the administration of any employee benefit plan in the ordinary course of business and consistent with past practice, or (C) the acquisition by the Registrant, the Bank or any of the Registrant's other subsidiaries of record ownership for the beneficial ownership of any other persons other than the Registrant or any Registrant subsidiary, including as trustees or custodians, and (D) certain exchanges or conversions of stock junior or parity with the preferred shares or trust preferred securities for or into other parity stock (with the same or lesser aggregate liquidation amount) or stock junior to the preferred shares, as more fully described in the Securities Purchase Agreement.
7
The Securities Purchase Agreement also subjects the Registrant to certain of the executive compensation limitations included in the Emergency Economic Stabilization Act of 2008 (the "EESA"). In connection with the closing of the transaction, William S. Latoff, William J. Hieb, Gerald F. Sopp, Albert J. Melfi, Jr. and Bruce E. Moroney, the Registrant's senior executive officers as defined in the Securities Purchase Agreement, executed a waiver voluntarily waiving any claim against the U.S. Treasury or the Registrant for any changes to compensation or benefits arrangements that are required to comply with the regulation issued by the U.S. Treasury under the Treasury program and acknowledging that the regulation may require modification of the compensation, bonus, incentive, and other benefit plans, arrangements, and policies and agreements as they relate to the period the U.S. Treasury holds any equity or debt securities of the Registrant acquired through the Treasury program. As more fully described above under "Other Recent Legislation and Regulatory Actions," ARRA imposes additional requirements on the Registrant so long as the Registrant has any obligations under the CPP (other than the warrants to purchase the Registrant's common stock issued to the Treasury).
Section 5.3 of the Securities Purchase Agreement states that the Securities Purchase Agreement and all related documents may be amended unilaterally by the U.S. Treasury to the extent required to comply with any changes in applicable federal statutes after the execution thereof.
Participation in the Temporary Liquidity Guarantee Program. In October 2008, the FDIC announced its temporary liquidity guarantee program ("TLPG") pursuant to which the FDIC will guarantee the payment of certain newly-issued senior unsecured debt of insured depository institutions ("Debt Guarantee") and funds held at FDIC-insured depository institutions in non-interest-bearing transaction accounts in excess of the current standard maximum deposit insurance amount of $250,000 ("Transaction Account Guarantee"). Both guarantees were provided to eligible institutions, including the Corporation and the Bank, at no cost through December 5, 2008. Participation in the TLPG subsequent to December 5, 2008 was optional. The Corporation has elected to participate only in the Transaction Account Guarantee portion of the TLPG subsequent to December 5, 2008. The Transaction Account Guarantee is effective for the Corporation through June 30, 2010. Participants in the Transaction Account Guarantee Program will be assessed an annualized fee of 10 basis points. To the extent that these initial assessments are insufficient to cover the expense or losses arising under TLPG, the FDIC is required to impose an emergency special assessment on all FDIC-insured depository institutions as prescribed by the Federal Deposit Insurance Act.
Under the Pennsylvania Banking Code of 1965, as amended ("PA Code"), the Registrant is permitted to control an unlimited number of banks, subject to prior approval of the Federal Reserve Board as more fully described above. The PA Code authorizes reciprocal interstate banking without any geographic limitation. Reciprocity between states exists when a foreign state's law authorizes Pennsylvania bank holding companies to acquire banks or bank holding companies located in that state on terms and conditions substantially no more restrictive than those applicable to such an acquisition by a bank holding company located in that state. Interstate ownership of banks in Pennsylvania with banks in Delaware, Maryland, New Jersey, Ohio, New York and other states is currently authorized. However, state laws still restrict de novo formations of branches in other states. Pennsylvania law also provides Pennsylvania state chartered institutions elective parity with the power of national banks, federal thrifts, and state-chartered institutions in other states as authorized by the Federal Deposit Insurance Corporation ("Competing Institutions"). In some cases, this may give state chartered institutions broader powers than national banks such as the Bank, and may increase competition the Bank faces from other banking institutions.
The Registrant, the Bank and the Bank's customers are subject in the course of their activities to a growing number of Federal, state and local environmental laws and regulations. Neither the Registrant nor
8
the Bank anticipates that compliance with environmental laws and regulations will have any material effect on capital expenditures, earnings, or on its competitive positions.
Supervision and Regulation — Bank
The operations of the Bank are subject to Federal and State statutes applicable to banks chartered under the banking laws of the United States, to members of the Federal Reserve System and to banks whose deposits are insured by the FDIC. Bank operations are also subject to regulations of the Office of the Comptroller of the Currency ("OCC"), the Federal Reserve Board and the FDIC.
The primary supervisory authority of the Bank is the OCC, who regularly examines the Bank. The OCC has the authority to prevent a national bank from engaging in an unsafe or unsound practice in conducting its business.
Federal and state banking laws and regulations govern, among other things, the scope of a bank's business, the investments a bank may make, the reserves against deposits a bank must maintain, loans a bank makes and collateral it takes, the activities of a bank with respect to mergers and consolidations and the establishment of branches. All nationally and state-chartered banks in Pennsylvania are permitted to maintain branch offices in any county of the state. National bank branches may be established only after approval by the OCC. It is the general policy of the OCC to approve applications to establish and operate domestic branches, including ATMs and other automated devices that take deposits, provided that approval would not violate applicable Federal or state laws regarding the establishment of such branches. The OCC reserves the right to deny an application or grant approval subject to conditions if (1) there are significant supervisory concerns with respect to the applicant or affiliated organizations, (2) in accordance with CRA, the applicant's record of helping meet the credit needs of its entire community, including low and moderate income neighborhoods, consistent with safe and sound operation, is less than satisfactory, or (3) any financial or other business arrangement, direct or indirect, involving the proposed branch or device and bank "insiders" (directors, officers, employees and 10% or greater shareholders) involves terms and conditions more favorable to the insiders than would be available in a comparable transaction with unrelated parties.
The Bank, as a subsidiary of a bank holding company, is subject to certain restrictions imposed by the Federal Reserve Act on any extensions of credit to the bank holding company or its subsidiaries, on investments in the stock or other securities of the bank holding company or its subsidiaries and on taking such stock or securities as collateral for loans. The Federal Reserve Act and Federal Reserve Board regulations also place certain limitations and reporting requirements on extensions of credit by a bank to principal shareholders of its parent holding company, among others, and to related interests of such principal shareholders. In addition, such legislation and regulations may affect the terms upon which any person becoming a principal shareholder of a holding company may obtain credit from banks with which the subsidiary bank maintains a correspondent relationship.
Federal banking laws impose on banks certain minimum requirements for capital adequacy. Federal banking agencies have issued certain "risk-based capital" guidelines, and certain "leverage" requirements on member banks such as the Bank. Banking regulators have authority to require higher minimum capital ratios for an individual bank or bank holding company in view of its circumstances.
Minimum Capital Ratios. The risk-based guidelines require all banks to maintain two "risk-weighted assets" ratios. The first is a minimum ratio of total capital ("Tier 1" and "Tier 2" capital) to risk-weighted assets equal to 8.00%; the second is a minimum ratio of "Tier 1" capital to risk-weighted assets equal to 4.00%. Assets are assigned to five risk categories, with higher levels of capital being required for the categories perceived as representing greater risk. In making the calculation, certain intangible assets must be deducted from the capital base. The risk-based capital rules are designed to make regulatory capital
9
requirements more sensitive to differences in risk profiles among banks and bank holding companies and to minimize disincentives for holding liquid assets.
The risk-based capital rules also account for interest rate risk. Institutions with interest rate risk exposure above a normal level would be required to hold extra capital in proportion to that risk. A bank's exposure to declines in the economic value of its capital due to changes in interest rates is a factor that the banking agencies will consider in evaluating a bank's capital adequacy. The rule does not codify an explicit minimum capital charge for interest rate risk. The Bank currently monitors and manages its assets and liabilities for interest rate risk, and management believes that the interest rate risk rules which have been implemented and proposed will not materially adversely affect our operations.
The "leverage" ratio rules require banks which are rated the highest in the composite areas of capital, asset quality, management, earnings, liquidity and sensitivity to market risk to maintain a ratio of "Tier 1" capital to "adjusted total assets" (equal to the bank's average total assets as stated in its most recent quarterly Call Report filed with its primary federal banking regulator, minus end-of-quarter intangible assets that are deducted from Tier 1 capital) of not less than 3.00%. For banks which are not the most highly rated, the minimum "leverage" ratio will range from 4.00% to 5.00%, or higher at the discretion of the bank's primary federal regulator, and is required to be at a level commensurate with the nature of the level of risk of the bank's condition and activities.
For purposes of the capital requirements, "Tier 1" or "core" capital is defined to include common stockholders' equity and certain non-cumulative perpetual preferred stock and related surplus. "Tier 2" or "qualifying supplementary" capital is defined to include a bank's allowance for loan and lease losses up to 1.25% of risk-weighted assets, plus certain types of preferred stock and related surplus, certain "hybrid capital instruments" and certain term subordinated debt instruments.
Prompt Corrective Action. Federal banking law mandates certain "prompt corrective actions," which Federal banking agencies are required to take, and certain actions which they have discretion to take, based upon the capital category into which a Federally regulated depository institution falls. Regulations have been adopted by the Federal bank regulatory agencies setting forth detailed procedures and criteria for implementing prompt corrective action in the case of any institution that is not adequately capitalized. Under the rules, an institution will be deemed to be "adequately capitalized" or better if it exceeds the minimum Federal regulatory capital requirements. However, it will be deemed "undercapitalized" if it fails to meet the minimum capital requirements, "significantly undercapitalized" if it has a total risk-based capital ratio that is less than 6.0%, a Tier 1 risk-based capital ratio that is less than 3.0%, or a leverage ratio that is less than 3.0%, and "critically undercapitalized" if the institution has a ratio of tangible equity to total assets that is equal to or less than 2.0%. The rules require an undercapitalized institution to file a written capital restoration plan, along with a performance guaranty by its holding company or a third party. In addition, an undercapitalized institution becomes subject to certain automatic restrictions including a prohibition on the payment of dividends, a limitation on asset growth and expansion, and in certain cases, a limitation on the payment of bonuses or raises to senior executive officers, and a prohibition on the payment of certain "management fees" to any "controlling person". Institutions that are classified as undercapitalized are also subject to certain additional supervisory actions, including increased reporting burdens and regulatory monitoring, a limitation on the institution's ability to make acquisitions, open new branch offices, or engage in new lines of business, obligations to raise additional capital, restrictions on transactions with affiliates, and restrictions on interest rates paid by the institution on deposits. In certain cases, bank regulatory agencies may require replacement of senior executive officers or directors, or sale of the institution to a willing purchaser. If an institution is deemed to be "critically undercapitalized" and continues in that category for four quarters, the statute requires, with certain narrowly limited exceptions, that the institution be placed in receivership.
10
DNB's management believes that the Bank is "well capitalized" for regulatory capital purposes. See table of Bank's compliance with minimum capital ratios, at footnote 17 ("Regulatory Matters") to DNB's audited financial statements for the fiscal year ended December 31, 2009.
Under the Federal Deposit Insurance Act, the OCC possesses the power to prohibit institutions regulated by it, such as the Bank, from engaging in any activity that would be an unsafe and unsound banking practice and in violation of the law. Moreover, Federal law enactments have expanded the circumstances under which officers or directors of a bank may be removed by the institution's Federal supervisory agency; unvested and further regulated lending by a bank to its executive officers, directors, principal shareholders or related interests thereof; and unvested management personnel of a bank from serving as directors or in other management positions with certain depository institutions whose assets exceed a specified amount or which have an office within a specified geographic area; and unvested management personnel from borrowing from another institution that has a correspondent relationship with their bank.
Interstate Banking. Federal law permits interstate bank mergers and acquisitions. Limited branch purchases are still subject to state laws. Pennsylvania law permits out-of-state banking institutions to establish branches in Pennsylvania with the approval of the Pennsylvania Banking Department, provided the law of the state where the banking institution is located would permit a Pennsylvania banking institution to establish and maintain a branch in that state on substantially similar terms and conditions. It also permits Pennsylvania banking institutions to maintain branches in other states. Bank management anticipates that interstate banking will continue to increase competitive pressures in the Bank's market by permitting entry of additional competitors, but management is of the opinion that this will not have a material impact upon the anticipated results of operations of the Bank.
Bank Secrecy Act and OFAC. Under the Bank Secrecy Act ("BSA"), the Bank is required to report to the Internal Revenue Service, currency transactions of more than $10,000 or multiple transactions of which the Bank is aware in any one day that aggregate in excess of $10,000. Civil and criminal penalties are provided under the BSA for failure to file a required report, for failure to supply information required by the BSA or for filing a false or fraudulent report. The Department of the Treasury's Office of Foreign Asset Control ("OFAC") administers and enforces economic and trade sanctions against targeted foreign countries, terrorism-sponsoring jurisdictions and organizations, and international narcotics traffickers based on U.S. foreign policy and national security goals. OFAC acts under presidential wartime and national emergency powers and authority granted by specific legislation to impose controls on transactions and freeze foreign assets under U.S. jurisdiction. Acting under authority delegated from the Secretary of the Treasury, OFAC promulgates, develops, and administers the sanctions under its statutes and executive orders. OFAC requirements are separate and distinct from the BSA, but both OFAC requirements and the BSA share a common national security goal. Because institutions and regulators view compliance with OFAC sanctions as related to BSA compliance obligations, supervisory examination for OFAC compliance is typically connected to examination of an institution's BSA compliance. Examiners focus on a banking organization's compliance processes and evaluate the sufficiency of a banking organization's implementation of policies, procedures and systems to ensure compliance with OFAC regulations.
USA PATRIOT Act. The Uniting and Strengthening America by Providing Appropriate Tools Required to Intercept and Obstruct Terrorism Act of 2001 (together with its implementing regulations, the "Patriot Act"), designed to deny terrorists and others the ability to obtain access to the United States financial system, has significant implications for banks and other financial institutions. It requires the Registrant and its subsidiary to implement new policies and procedures or amend existing policies and procedures with respect to, anti-money laundering, compliance, suspicious activity and currency transaction reporting and due diligence on customers, as well as related matters. The Patriot Act permits and in some cases requires information sharing for counter-terrorist purposes between federal law enforcement agencies and financial institutions, as well as among financial institutions, and it requires federal banking agencies to evaluate the
11
effectiveness of an institution in combating money laundering activities, both in ongoing examinations and in connection with applications for regulatory approval.
Deposit Insurance Assessments. The deposits of the Bank are insured by the FDIC up to the limits set forth under applicable law and are subject to deposit insurance premium assessments. The FDIC imposes a risk based deposit premium assessment system, under which the amount of FDIC assessments paid by an individual insured depository institution, such as the Bank, is based on the level of risk incurred in its activities. The FDIC places a depository institution in one of four risk categories determined by reference to its capital levels and supervisory ratings. In addition, in the case of those institutions in the lowest risk category, the FDIC further determines its assessment rates based on certain specified financial ratios. Pursuant to the Federal Deposit Insurance Act, the FDIC has authority and the responsibility to establish deposit insurance assessments at rates sufficient to maintain the designated reserve ratio of the Deposit Insurance Fund at a level between 1.15% and 1.5% of estimated insured deposits, and to take action to restore the designated reserve ratio to at least 1.15% of estimated insured deposits when it falls below that level. As of June 30, 2008, the designated reserve ratio fell below 1.15%, to 1.01%. On October 7, 2008, the FDIC established a restoration plan which is has updated periodically since then to respond to deteriorating economic conditions. Conditions in the banking industry have continued to deteriorate through 2008 and 2009. According to the FDIC's Quarterly Banking Profile for the Fourth Quarter 2009, as of December 30, 2009 the designated reserve ratio had fallen to (0.39%), down from (0.16%) on September 30, 2009, and 0.36% as of December 31, 2008. The FDIC reports that the December 31, 2009 reserve ratio is the lowest on record for a combined bank and thrift insurance fund. In response to the declining reserve ratio, the FDIC took a series of extraordinary deposit insurance assessment actions during 2009.
Effective for the second quarter of 2009, the FDIC adopted changes to its base and risk-based deposit insurance rates. Pursuant to the new rules, a bank's annual assessment base rates were as follows, depending on the bank's risk category:
| |
Risk Category |
|||||||||||||||
|---|---|---|---|---|---|---|---|---|---|---|---|---|---|---|---|---|
| |
I |
|
|
|
||||||||||||
| |
Minimum |
Maximum |
II |
III |
IV |
|||||||||||
Annual rates (in basis points) |
12 | 16 | 22 | 32 | 45 | |||||||||||
The base assessment rate can be adjusted downward based on a bank's unsecured debt and level of excess capital above the well capitalized threshold, or upward based on a bank's secured liabilities including Federal Home Loan Bank advances and repurchase agreements, so that the total risk-based assessment rates will range as follows, depending on a bank's risk category:
| |
Risk Category |
|||||||
|---|---|---|---|---|---|---|---|---|
| |
I |
II |
III |
IV |
||||
Initial base assessment rate |
12 to 16 | 22 | 32 | 45 | ||||
Unsecured debt adjustment |
(5) to 0 | (5) to 0 | (5) to 0 | (5) to 0 | ||||
Secured liability adjustment |
0 to 8 | 0 to 11 | 0 to 16 | 0 to 22.5 | ||||
Brokered deposit adjustment |
— | 0 to 10 | 0 to 10 | 0 to 10 | ||||
Total base assessment rate |
7 to 24 | 17 to 43 | 27 to 58 | 40 to 77.5 | ||||
On May 22, 2009, the FDIC adopted a final rule imposing a 5 basis point special assessment on each insured depository institution's assets minus Tier 1 capital as of June 30, 2009. The amount of the special assessment for any institution did not exceed 10 basis points times the institution's assessment base for the second quarter 2009. The assessment, in the amount of $280,000, was collected from the Bank on September 30, 2009.
12
As of December 31, 2009 the Bank had an assessment rate of 15.68 basis points, and, based on this rate, the Bank's estimated 2010 FDIC insurance cost projection is $827,000.
On September 29, 2009, the FDIC adopted a uniform three-basis point increase in the assessment rates shown above, effective on January 1, 2011, and on November 12, 2009, the FDIC adopted a final rule to require insured institutions to prepay their estimated quarterly risk-based assessments for the fourth quarter of 2009, and for all of 2010, 2011, and 2012. The prepaid assessment was collected on December 30, 2009, along with the institution's regular quarterly risk-based deposit insurance assessment for the third quarter of 2009. For purposes of calculating the prepaid assessment, each institution's assessment rate was its total base assessment rate in effect on September 30, 2009. In calculating the prepayment attributable to 2011 and thereafter, it is calculated using the September 29, 2009 increase in 2011 base assessment rates. In addition, future deposit growth was reflected in the prepayment by assuming that an institution's third quarter 2009 assessment base would be increased quarterly at a 5 percent annual growth rate through the end of 2012. The FDIC will begin to draw down an institution's prepaid assessments on March 30, 2010, representing payment for the regular quarterly risk-based assessment for the fourth quarter of 2009, which was accrued and expensed during 2009. In announcing these initiatives, the FDIC stated that, while the prepaid assessment would not immediately affect bank earnings, each institution would record the entire amount of its prepaid assessment as a prepaid expense asset as of December 30, 2009, the date the payment was made and, as of December 31, 2009 and each quarter thereafter, record an expense or charge to earnings for its regular quarterly assessment and an offsetting credit to the prepaid assessment until the asset is exhausted. Once the asset is exhausted, institutions would resume paying and accounting for quarterly deposit insurance assessments as they currently do. The total amount of the Bank's deposit insurance assessment prepayment was $3.1 million.
In addition to deposit insurance assessments, banks are subject to assessments to pay the interest on Financing Corporation bonds. The Financing Corporation was created by Congress to issue bonds to finance the resolution of failed thrift institutions. The FDIC sets the Financing Corporation assessment rate every quarter. The Financing Corporation assessment for the fourth quarter of 2009 was an annual rate of $0.0102 for each $100 of deposits, which resulted in a $12,000 FICO assessment payment by the Bank.
Other Laws and Regulations. The Bank is subject to a variety of consumer protection laws, including the Truth in Lending Act, the Truth in Savings Act adopted as part of the Federal Deposit Insurance Corporation Improvement Act of 1991 ("FDICIA"), the Equal Credit Opportunity Act, the Home Mortgage Disclosure Act, the Electronic Funds Transfer Act, the Real Estate Settlement Procedures Act and the regulations adopted hereunder. In the aggregate, compliance with these consumer protection laws and regulations involves substantial expense and administrative time on the part of the Bank and the Registrant.
Legislation and Regulatory Changes. From time to time, legislation is enacted which has the effect of increasing the cost of doing business, limiting or expanding permissible activities and/or affecting the competitive balance between banks and other financial institutions. Proposals to change the laws and regulations governing the operations and taxation of banks, bank holding companies and other financial institutions are frequently made in Congress, and before various bank regulatory agencies. No prediction can be made as to the likelihood of any major changes or the impact such changes might have on the Registrant and its subsidiary Bank.
Effect of Government Monetary Policies. The earnings of the Registrant are and will be affected by domestic economic conditions and the monetary and fiscal policies of the United States Government and its agencies (particularly the Federal Reserve Board). The monetary policies of the Federal Reserve Board have had and will likely continue to have, an important impact on the operating results of commercial banks through its power to implement national monetary policy in order, among other things, to curb inflation or combat a recession. The Federal Reserve Board has a major effect upon the levels of bank
13
loans, investments and deposits through its open market operations in United States Government securities and through its regulation of, among other things, the discount rate on borrowing of member banks and the reserve requirements against member bank deposits. It is not possible to predict the nature and impact of future changes in monetary and fiscal policies.
All of the Registrant's revenues are attributable to customers located in the United States, and primarily from customers located in Southeastern Pennsylvania. All of Registrant's assets are located in the United States and in Southeastern Pennsylvania. Registrant has no activities in foreign countries and hence no risks attendant to foreign operations.
DNB files reports with the Securities and Exchange Commission ("SEC"). The public may read and copy any materials we file with the SEC at the SEC's Public Reference Room at 450 fifth Street, NW, Washington, DC 20549. The public may obtain information on the operation of the Public Reference Room by calling the SEC at 1-800-SEC-0330. The SEC maintains an Internet site that contains reports, proxy and information statements, and other information regarding issuers that file electronically with the SEC. The SEC Internet site's address is http://www.sec.gov. The Registrant maintains a corporate website at www.dnbfirst.com. We will provide printed copies of our annual report on Form 10-K, quarterly reports on Form 10-Q, current reports on Form 8-K, and any amendments to these reports at no charge upon written request. Requests should be made to DNB Financial Corporation, 4 Brandywine Avenue, Downingtown, PA 19335, Attention: Gerald F. Sopp, Chief Financial Officer.
Not applicable.
Item 1B. Unresolved Staff Comments
None.
The main office of the Bank is located at 4 Brandywine Avenue, Downingtown, Pennsylvania 19335. The Registrant's registered office is also at this location. The Registrant pays no rent or other form of consideration for the use of the Bank's main office as its principal executive office. The Bank leases its operations center located at 104 Brandywine Avenue, Downingtown. The Bank also leases the Chadds Ford office, West Goshen office, Exton office, West Chester office and limited service offices in Media and at the Tel Hai Retirement Community. The Bank owns the remainder of its existing branches as described below. The Bank had a net book value of $7.3 million for all branches owned plus leasehold improvements on offices leased at December 31, 2009. The Bank's trust department and wealth management unit, operating under the name, "DNB Advisors," have offices in the Bank's Exton Office.
14
The bank has thirteen offices located in Chester and Delaware Counties, Pennsylvania. In addition to the Main Office discussed above, they are:
| Office | Office Location | Owned/Leased | ||
|---|---|---|---|---|
| Caln | 1835 East Lincoln Highway, Coatesville | Owned | ||
| Chadds Ford | 300 Oakland Road, West Chester | Leased | ||
| East End | 701 East Lancaster Avenue, Downingtown | Owned | ||
| Exton | 410 Exton Square Parkway, Exton | Leased | ||
| Kennett Square | 215 E. Cypress Street, Kennett Square | Owned | ||
| Lionville | Intersection of Route 100 and Welsh Pool Road, Exton | Owned | ||
| Little Washington | Route 322 and Culbertson Run Road, Downingtown | Owned | ||
| Ludwig's Corner | Intersection of Routes 100 and 401, Chester Springs | Owned | ||
| Media | 200 E. State Street, Suite 208, Media (Limited Service) | Leased | ||
| Tel Hai | Tel Hai Retirement Community, Honey Brook (Limited Service) | Leased | ||
| West Goshen | 1115 West Chester Pike, West Chester | Leased | ||
| West Chester | 2 North Church Street, West Chester | Leased | ||
DNB is a party to a number of lawsuits arising in the ordinary course of business. While any litigation causes an element of uncertainty, management is of the opinion that the liability, if any, resulting from the actions, will not have a material effect on the accompanying consolidated financial statements.
15
Item 5. Market for Registrant's Common Equity, Related Stockholder Matters and Issuer Purchases of Equity Securities
(a) Market Price of and Dividends on Registrant's Common Equity
DNB Financial Corporation's common stock, par value $1.00 per share, is listed for trading on NASDAQ under the symbol DNBF. Current price information is available from account executives at most brokerage firms as well as the firms listed at the back of this report who are market makers of DNB's common stock. There were approximately 1,100 stockholders who owned 2.6 million shares of common stock outstanding at March 22, 2010. Quarterly high and low sales prices are set forth below:
| |
2009 |
2008 |
||||||||||||
|---|---|---|---|---|---|---|---|---|---|---|---|---|---|---|
| |
High |
Low |
High |
Low |
||||||||||
First quarter |
$ | 7.83 | $ | 4.02 | $ | 18.00 | $ | 13.31 | ||||||
Second quarter |
9.78 | 6.61 | 15.00 | 13.75 | ||||||||||
Third quarter |
8.38 | 6.47 | 14.50 | 10.55 | ||||||||||
Fourth quarter |
7.70 | 5.88 | 11.25 | 8.00 | ||||||||||
The information required with respect to the frequency and amount of the Registrant's cash dividends declared on each class of its common equity for the two most recent fiscal years is set forth in the section of this report titled, "Item 6 — Selected Financial Data" on page 18.
The information required with respect to securities authorized for issuance under the Registrant's equity compensation plans is set forth in "Item 12 — Security Ownership of Certain Beneficial Owners and Management and Related Stockholder Matters" on page 86.
(b) Recent Sales of Unregistered Securities
On January 30, 2009, as part of the CPP administered by the United States Department of the Treasury, DNB Financial Corporation entered into a Letter Agreement and a Securities Purchase Agreement with the U.S. Treasury, pursuant to which the DNB issued and sold on January 30, 2009, and the U.S. Treasury purchased for cash on that date (i) 11,750 shares of the DNB's Fixed Rate Cumulative Perpetual Preferred Stock, Series 2008A, par value $10.00 per share, having a liquidation preference of $1,000 per share, and (ii) a ten-year warrant to purchase up to 186,311 shares of the DNB's common stock, $1.00 par value, at an exercise price of $9.46 per share, for an aggregate purchase price of $11,750,000 in cash. This transaction closed on January 30, 2009. The issuance and sale of these securities was a private placement exempt from registration pursuant to Section 4(2) of the Securities Act of 1933.
(c) Purchases of Equity Securities by the Registrant and Affiliated Purchasers
The following table provides information on repurchases by or on behalf of DNB or any "affiliated purchaser" (as defined in Regulation 10b-18(a)(3)) of its common stock in each month of the quarter ended December 31, 2009.
Period
|
Total Number Of Shares Purchased |
Average Price Paid Per Share |
Total Number of Shares Purchased as Part of Publicly Announced Plans or Programs |
Maximum Number of Shares that May Yet Be Purchased Under the Plans or Programs |
||||
|---|---|---|---|---|---|---|---|---|
October 1, 2009 – October 31, 2009 |
— | $ — | — | 63,116 | ||||
November 1, 2009 – November 30, 2009 |
— | — | — | 63,116 | ||||
December 1, 2009 – December 31, 2009 |
100 | 7.06 | 100 | 63,016 | ||||
Total |
100 | $7.06 | 100 | |||||
16
On July 25, 2001, DNB authorized the buyback of up to 175,000 shares of its common stock over an indefinite period. On August 27, 2004, DNB increased the buyback from 175,000 to 325,000 shares of its common stock over an indefinite period. As more fully discussed beginning on page 2 in the "Supervision and Regulation" section of Item 1. "Business" of this Annual Report on Form 10-K, the Company's ability to repurchase its common stock is limited by the terms of the Purchase Agreement between DNB and the U.S. Treasury. Under the CPP, prior to the earlier of (i) January 30, 2012, or (ii) the date on which the Series A Preferred Stock is redeemed in whole or the U.S. Treasury has transferred all of the Series A Preferred Stock to unaffiliated third parties, the consent of the U.S. Treasury is required to repurchase any shares of common stock except in connection with benefit plans in the ordinary course of business and certain other limited exceptions.
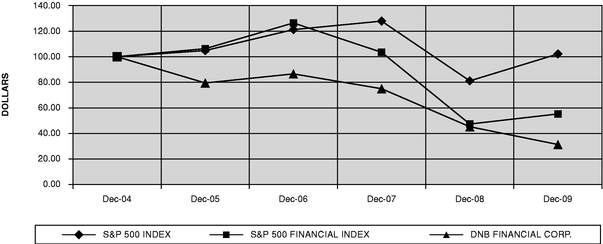
(d) Corporation Performance Graph
The following graph presents the 5 year cumulative total return on DNB Financial Corporation's common stock, compared to the S&P 500 Index and the S&P 500 Financial Index for the 5 year period ended December 31, 2009. The comparison assumes that $100 was invested in the Corporation's common stock and each of the foregoing indices and that all dividends have been reinvested.
CORPORATION PERFORMANCE
COMPARISON OF FIVE YEAR CUMULATIVE TOTAL RETURN
AMONG DNB FINANCIAL CORP., the S&P 500 INDEX & the S&P 500 FINANCIAL INDEX
17
Item 6. Selected Financial Data
The selected financial data set forth below is derived in part from, and should be read in conjunction with, the Consolidated Financial Statements and Notes thereto, contained elsewhere herein.
| |
At or For the Year Ended December 31 (Dollars in thousands, except share data) |
|||||||||||||||
|---|---|---|---|---|---|---|---|---|---|---|---|---|---|---|---|---|
| |
2009 |
2008 |
2007 |
2006 |
2005 |
|||||||||||
| RESULTS OF OPERATIONS | ||||||||||||||||
| Interest income | $ | 25,948 | $ | 28,262 | $ | 30,237 | $ | 28,249 | $ | 23,427 | ||||||
| Interest expense | 10,629 | 13,048 | 15,417 | 13,368 | 9,313 | |||||||||||
| Net interest income | 15,319 | 15,214 | 14,820 | 14,881 | 14,114 | |||||||||||
| Provision for credit losses | 1,325 | 2,018 | 60 | — | — | |||||||||||
| Non-interest income | 4,507 | 4,408 | 4,003 | 3,414 | 2,356 | |||||||||||
| Non-interest expense | 16,590 | 16,731 | 16,589 | 16,507 | 14,411 | |||||||||||
| Income before income taxes | 1,911 | 873 | 2,174 | 1,788 | 2,059 | |||||||||||
| Income tax expense (benefit) | 362 | 64 | 372 | 41 | (89 | ) | ||||||||||
| Net income | $ | 1,549 | $ | 809 | $ | 1,802 | $ | 1,747 | $ | 2,148 | ||||||
| Preferred stock dividends & accretion of discount | 567 | — | — | — | — | |||||||||||
| Net income available to common stockholders | $ | 982 | $ | 809 | $ | 1,802 | $ | 1,747 | $ | 2,148 | ||||||
PER SHARE DATA* |
||||||||||||||||
| Basic earnings | $ | 0.38 | $ | 0.31 | $ | 0.69 | $ | 0.67 | $ | 0.92 | ||||||
| Diluted earnings | 0.38 | 0.31 | 0.69 | 0.66 | 0.91 | |||||||||||
| Cash dividends | 0.23 | 0.46 | 0.50 | 0.47 | 0.45 | |||||||||||
| Book value | 11.88 | 11.53 | 12.55 | 11.94 | 11.83 | |||||||||||
| Weighted average | ||||||||||||||||
| Common shares outstanding — basic | 2,606,596 | 2,602,902 | 2,614,417 | 2,625,182 | 2,332,552 | |||||||||||
FINANCIAL CONDITION |
||||||||||||||||
| Total assets | $ | 634,248 | $ | 533,447 | $ | 545,840 | $ | 525,242 | $ | 473,046 | ||||||
| Loans and leases, gross | 359,427 | 336,454 | 309,342 | 329,466 | 288,130 | |||||||||||
| Allowance for credit losses | 5,477 | 4,586 | 3,891 | 4,226 | 4,420 | |||||||||||
| Deposits | 507,347 | 408,470 | 412,920 | 381,027 | 339,627 | |||||||||||
| Borrowings | 79,450 | 90,123 | 89,877 | 110,538 | 99,880 | |||||||||||
| Stockholders' equity | 42,876 | 30,058 | 32,635 | 31,411 | 30,186 | |||||||||||
SELECTED RATIOS |
||||||||||||||||
| Return on average stockholders' equity | 3.76 | % | 2.51 | % | 5.96 | % | 5.73 | % | 8.31 | % | ||||||
| Return on average assets | 0.26 | 0.15 | 0.36 | 0.35 | 0.48 | |||||||||||
| Average equity to average assets | 6.87 | 5.98 | 6.02 | 6.18 | 5.77 | |||||||||||
| Loans to deposits | 70.84 | 82.37 | 74.92 | 86.47 | 84.84 | |||||||||||
| Dividend payout ratio | 59.68 | 146.56 | 72.17 | 71.37 | 49.39 | |||||||||||
- *
- Per share data and shares outstanding have been adjusted for the 5% stock dividends in December of 2007, 2006 and 2005.
18
Item 7. Management's Discussion and Analysis of Financial Condition and Results of Operations
I. Introductory Overview
DNB Financial Corporation is a bank holding company whose bank subsidiary, DNB First, National Association (the "Bank") is a nationally chartered commercial bank with trust powers, and a member of the FDIC. DNB provides a broad range of banking services to individual and corporate customers through its thirteen community offices located throughout Chester and Delaware Counties, Pennsylvania. DNB is a community banking organization that focuses its lending and other services on businesses and consumers in the local market area. DNB funds all these activities with retail and business deposits and borrowings. Through its DNB Advisors division, the Bank provides wealth management and trust services to individuals and businesses. The Bank and its subsidiary, DNB Financial Services, Inc., make available certain non-depository products and services, such as securities brokerage, mutual funds, life insurance and annuities.
DNB earns revenues and generates cash flows by lending funds to commercial and consumer customers in its marketplace. DNB generates its largest source of interest income through its lending function. A secondary source of interest income is DNB's investment portfolio, which provides liquidity and cash flows for future lending needs.
In addition to interest earned on loans and investments, DNB earns revenues from fees it charges customers for non-lending services. These services include wealth management and trust services; brokerage and investment services; cash management services; banking and ATM services; as well as safekeeping and other depository services.
To implement the culture changes necessary at DNB First to become an innovative community bank capable of meeting challenges of the 21st century, in 2008 we embarked on a strategy called "Loyalty, Bank On It." In recognizing the importance of loyalty in our everyday lives, we have embraced this concept as the cornerstone of DNB First's culture. To that end, DNB continues to make appropriate investments in all areas of our business, including people, technology, facilities and marketing.
Highlights of DNB's results for the year-end December 31, 2009 include:
- •
- Steady growth in loans — up $23.0 million or 6.8%
- •
- Control of non-interest expenses — decrease from 2008 of $141,000 or
.84%
- •
- Strengthened capital position — Tier 1 Capital increased 30.1% to $53.1 million
The global and U.S. economies have experienced significantly reduced business activity as a result of disruptions in the financial system during the past two years. Dramatic declines in the housing market during the past two years, with falling home prices and increasing foreclosures and unemployment, have resulted in significant write-downs of asset values by financial institutions, including government-sponsored entities and major commercial and investment banks. As a result of the recession, retail customers may delay borrowing from DNB as unemployment remains high and availability to borrow against equity in primary residences diminishes. As the U.S. economy moves through a period of recession, delinquencies will rise as the value of homes decline and DNB's borrowers experience financial difficulty due to corporate downsizing, reduced sales, or other negative events which may impact their ability to meet their contractual loan payments. As a result of these negative trends in the economy and their impact on our borrowers' ability to repay their loans, DNB made a $1.3 million provision in 2009 in response to DNB's increased level of non-performing assets which grew $6.0 million to $13.7 million at December 31, 2009, compared to $7.7 million at December 31, 2008. On January 30, 2009, management strengthened DNB's financial position at a time of unprecedented economic turmoil by increasing its Stockholders Equity by issuing Fixed Rate Cumulative Perpetual Preferred Stock and warrants in exchange for $11,750,000 (as more fully described in Footnote 17) to the United States Department of the Treasury as part of the Treasury's Capital Purchase Program.
19
To increase liquidity, management increased the size of the investment securities portfolio from $124.1 million at December 31, 2008 to $204.1 million at December 31, 2009. In addition, DNB's net interest margin has been impacted by these changes in the economy. Management has been aggressive in managing DNB's cost of funds during the year by implementing carefully planned pricing strategies, designed to offset the decline in rates on earning assets, while matching liquidity needs. Our composite cost of funds for 2009 dropped 77 basis points to 2.09%, from 2.86% in 2008. Our net interest margin however declined from 3.00% in 2008 to 2.71% in 2009 because of falling short term rates, higher levels of investment securities relative to total assets and higher levels of non-performing assets.
Earnings. For the year ended December 31, 2009, DNB reported net income of $1.5 million, an increase of $740,000 from the $809,000 reported for the year ended December 31, 2008, or $0.38 per share versus $0.31 per share, respectively, on a fully diluted basis. DNB's earnings were favorably impacted by a lower provision for credit losses, which in 2009 totaled $1.3 million, compared to $2.0 million in 2008. Also, economic conditions challenging all commercial banking institutions affected 2009 earnings — the current recession, higher levels of non-performing assets and delinquencies, as well as continued pricing competition on loans and deposits.
Asset Quality. Non-performing assets were $13.7 million at December 31, 2009 compared to $7.7 million at December 31, 2008. Non-performing assets as of December 31, 2009 were comprised of $9.0 million of non-accrual loans and leases, $191,000 of loans and leases delinquent over ninety days and still accruing, as well as $4.4 million of Other Real Estate Owned ("OREO") and $109,000 in other repossessed assets. As of December 31, 2009, the non-performing loans to total loans ratio increased to 2.55% compared to .81% at December 31, 2008. The non-performing assets to total assets ratio increased to 2.16% at December 31, 2009, compared to 1.45% at December 31, 2008. The allowance for credit losses was $5.5 million at December 31, 2009, compared to $4.6 million at December 31, 2008. The allowance to total loans was 1.52% at December 31, 2009 compared to 1.36% at December 31, 2008. DNB's delinquency ratio (the total of all delinquent loans and leases plus loans greater than 90 days and still accruing, divided by total loans and leases) was 3.31% at December 31, 2009, up from 1.64% at December 31, 2008. Delinquencies increased during 2009 in the residential mortgage and commercial loan portfolios.
II. Overview of Financial Condition — Major Changes and Trends
At December 31, 2009, DNB had consolidated assets of $634.2 million and a Tier I/Leverage Capital Ratio of 8.33%. Loans and leases comprise 59.4% of earning assets, while investments and federal funds sold constitute the remainder. During 2009, assets increased $100.8 million to $634.2 million at December 31, 2009, compared to $533.4 million at December 31, 2008. Investment securities increased $80.0 million to $204.1 million, while the loan and lease portfolio increased $23.0 million, or 6.83%, to $359.4 million. Deposits increased $98.9 million to $507.3 million at December 31, 2009. DNB's liabilities are comprised of a high level of core deposits with a low cost of funds in addition to a moderate level of borrowings with costs that are more volatile than core deposits.
Comprehensive 5-Year Plan. During the second quarter of 2009, management updated the 5-year strategic plan that was designed to reposition its balance sheet and improve core earnings. Through the plan, which covers years 2008 through 2012, management will endeavor to expand its loan portfolio through new originations, increased loan participations, as well as strategic loan and lease receivable purchases. Management also plans to reduce the absolute level of borrowings with cash flows from existing loans and investments as well as from new deposit growth. A discussion on DNB's Key Strategies follows below:
- •
- Focus on penetrating markets and allowing existing locations to maximize profitability
- •
- Grow loans and diversify the mix
- •
- Reduce long-term borrowings
20
- •
- Focus on profitable customer segments
- •
- Grow and diversify non-interest income
- •
- Focus on reducing DNB's cost of funds by changing DNB's mix of deposits
- •
- Focus on cost containment and improving operational efficiencies
Strategic Plan Update. During 2009, management focused on expense control as well as strengthening DNB's capital and liquidity positions. Non-interest expenses decreased .84% year over year and Total Risk Based Capital stood at 14.27% at December 31, 2009. In addition, DNB grew loans by $23.0 million or 6.83% during 2009 and reduced its composite cost of funds from 2.86% in 2008 to 2.09% in 2009.
Management's strategies are designed to direct DNB's tactical investment decisions and support financial objectives. DNB's most significant revenue source continues to be net interest income, defined as total interest income less interest expense, which in 2009 accounted for approximately 77.3% of total revenue. To produce net interest income and consistent earnings growth over the long-term, DNB must generate loan and deposit growth at acceptable economic spreads within its market area. To generate and grow loans and deposits, DNB must focus on a number of areas including, but not limited to, the economy, branch expansion, sales practices, customer satisfaction and retention, competition, customer behavior, technology, product innovation and credit performance of its customers.
Management has made a concerted effort to improve the measurement and tracking of business lines and overall corporate performance levels. Improved information systems have increased DNB's ability to track key indicators and enhance corporate performance levels. Better measurement against goals and objectives and increased accountability will be integral in attaining desired loan, deposit and fee income production.
On January 30, 2009, as part of the CPP administered by the United States Department of the Treasury, DNB Financial Corporation entered into a Letter Agreement and a Securities Purchase Agreement with the U.S. Treasury. The addition of the $11,750,000 in capital will enhance DNB's strong capital position and allow us to aid local communities by increasing our lending capacity. (See additional discussion in Other Recent Legislation and Regulatory Actions, on page 4 of this Form 10-K).
III. DNB's Principal Products and Services
Loans and Lending Services. DNB's primary source of earnings and cash flows is derived from its lending function. The commercial loan and lease portfolios amounted to $263.0 million or 73.1% of total loans as of December 31, 2009. DNB focuses on providing these products to small to mid-size businesses throughout Chester and Delaware Counties. In keeping with DNB's goal to match customer business initiatives with products designed to meet their needs, DNB offers a wide variety of fixed and variable rate loans that are priced competitively. DNB serves this market by providing funds for the purchase of business property or ventures, working capital lines, lease financing for equipment and for a variety of other purposes.
As a community bank, DNB also serves consumers by providing home equity and home mortgages, as well as term loans for the purchase of consumer goods. During the current economic environment, demand for consumer home equity loan products has declined, therefore consumer loans declined $7.9 million or 12.5% from the prior year due to lower demand for this product as a result of falling housing prices and a higher unemployment rate.
In addition to providing funds to customers, DNB also provides a variety of services to its commercial customers. These services, such as cash management, remote capture, commercial sweep accounts, internet banking, letters of credit and other lending services are designed to meet our customer needs and help them become successful. DNB provides these services to assist its customers in obtaining financing, securing business opportunities, providing access to new resources and managing cash flows.
21
Deposit Products and Services. DNB's primary source of funds is derived from customer deposits, which are typically generated by DNB's thirteen branch offices. DNB's deposit base, while highly concentrated in central Chester County, extends to southern Chester County and into parts of Delaware and Lancaster Counties. In addition, a growing amount of new deposits are being generated through expanded government service offerings and as a part of comprehensive loan or wealth management relationships.
The majority of DNB's deposit mix consists of low costing core deposits, (demand, NOW and savings accounts). The remaining deposits are comprised of rate-sensitive money market and time products. DNB offers tiered savings and money market accounts, designed to attract high dollar, less volatile funds. Certificates of deposit and IRAs are traditionally offered with interest rates commensurate with their terms.
Non-Deposit Products and Services. DNB offers non-deposit products and services through its subsidiaries under the names "DNB Financial Services" ("DNBFS") and "DNB Advisors." Revenues under these entities were $794,000 and $820,000 or 4.00% and 4.12% of total revenues for 2009 and 2008, respectively.
DNB Financial Services. Through a partnership with UVEST Financial Services, DNBFS offers a complete line of investment and insurance products.
• Fixed & Variable Annuities |
• Defined Benefit Plans |
|
• 401(k) Rollovers |
• Stocks |
|
• Self-Directed IRAs |
• Bonds |
|
• Mutual Funds |
• Full Services Brokerage |
|
• Long Term Care Insurance |
• 529 College Savings Plans |
|
• Life Insurance |
• Estate Accounts |
|
• Disability Insurance |
• Trust Services |
|
• Self Employed Pension (SEP) |
DNB Advisors. DNB Advisors offers a full line of products and services, which includes the following:
• Investment Management |
• Investment Advisory |
|
• Estate Settlement |
• Trust Services |
|
• Custody Services |
• Retirement Planning |
|
• Safekeeping |
IV. Material Challenges, Risks and Opportunities
A. Interest Rate Risk Management.
Interest rate risk is the exposure to adverse changes in net interest income due to changes in interest rates. DNB considers interest rate risk a predominant risk in terms of its potential impact on earnings. Interest rate risk can occur for any one or more of the following reasons: (a) assets and liabilities may mature or re-price at different times; (b) short-term or long-term market rates may change by different amounts; or (c) the remaining maturity of various assets or liabilities may shorten or lengthen as interest rates change.
The principal objective of DNB's interest rate risk management is to evaluate the interest rate risk included in certain on and off balance sheet accounts, determine the level of risk appropriate given DNB's business strategy, operating environment, capital and liquidity requirements and performance objectives,
22
and manage the risk consistent with approved guidelines. Through such management, DNB seeks to reduce the vulnerability of its operations to changes in interest rates. DNB's Asset Liability Committee (the "ALCO") is responsible for reviewing DNB's asset/liability policies and interest rate risk position and making decisions involving asset liability considerations. The ALCO meets on a monthly basis and reports trends and DNB's interest rate risk position to the Board of Directors on a quarterly basis. The extent of the movement of interest rates is an uncertainty that could have a negative impact on DNB's earnings. (See additional discussion in Item 7a. Quantitative and Qualitative Disclosures About Market Risk on page 44 of this Form 10-K.)
1. Net Interest Margin
DNB's net interest margin is the ratio of net interest income to average interest-earning assets. Unlike the interest rate spread, which measures the difference between the rates on earning assets and interest paying liabilities, the net interest margin measures that spread plus the effect of net free funding sources. This is a more meaningful measure of profitability because a bank can have a narrow spread but a high level of equity and non-interest-bearing deposits, resulting in a good net interest margin. One of the most critical challenges DNB faced over the last several years was the impact of historically low interest rates and a narrower spread between short-term rates and long-term rates as noted in the tables below.
| |
December 31 |
|||||||||||
|---|---|---|---|---|---|---|---|---|---|---|---|---|
| |
2009 |
2008 |
2007 |
2006 |
2005 |
2004 |
||||||
Prime |
3.25% | 3.25% | 7.25% | 8.25% | 7.25% | 5.25% | ||||||
Federal Funds Sold ("FFS") |
.25 | .25 | 4.25 | 5.25 | 4.25 | 2.25 | ||||||
6 month U.S. Treasury |
.20 | .27 | 3.51 | 5.08 | 4.25 | 2.56 | ||||||
| |
Historical Yield Spread December 31 |
|||||||||||
|---|---|---|---|---|---|---|---|---|---|---|---|---|
| |
2009 |
2008 |
2007 |
2006 |
2005 |
2004 |
||||||
FFS to 5 year U.S. Treasury |
2.44% | 1.30% | -0.62% | -0.56% | 0.10% | 1.38% | ||||||
FFS to 10 year U.S. Treasury |
3.60 | 2.00 | -0.04 | -0.55 | 0.14 | 1.99 | ||||||
In general, financial institutions price their fixed rate loans off of 5 and 10 year treasuries and price their deposits off of shorter indices, like the federal funds rate. As you can see in the table above, the spread between the Federal Funds Sold rate and the 5 year treasury has ranged from 2.44% to a negative 0.62% during the last 5 years. The spread between the Federal Funds Sold rate and the 10 year treasury has ranged from 3.60% to a negative 0.55% during the last 5 years. As a result of the compression between long and short term rates, many banks, including DNB, have seen their net interest margin decline during the last 5 years.
The table below provides, for the periods indicated, information regarding: (i) DNB's average balance sheet; (ii) the total dollar amounts of interest income from interest-earning assets and the resulting average yields (tax-exempt yields have been adjusted to a tax equivalent basis using a 34% tax rate); (iii) the total dollar amounts of interest expense on interest-bearing liabilities and the resulting average costs; (iv) net interest income; (v) net interest rate spread; and (vi) net interest margin. Average balances were calculated based on daily balances. Non-accrual loan balances are included in total loans. Loan fees and costs are included in interest on total loans.
23
Average Balances, Rates, and Interest Income and Expense
(Dollars in thousands)
| |
Year Ended December 31 |
|||||||||||||||||||||||||||||
|---|---|---|---|---|---|---|---|---|---|---|---|---|---|---|---|---|---|---|---|---|---|---|---|---|---|---|---|---|---|---|
| |
2009 |
2008 |
2007 |
|||||||||||||||||||||||||||
| |
Average Balance |
Interest |
Yield/ Rate |
Average Balance |
Interest |
Yield/ Rate |
Average Balance |
Interest |
Yield/ Rate |
|||||||||||||||||||||
ASSETS |
||||||||||||||||||||||||||||||
Interest-earning assets: |
||||||||||||||||||||||||||||||
Investment securities: |
||||||||||||||||||||||||||||||
Taxable |
$ | 185,413 | $ | 6,347 | 3.42 | % | $ | 159,724 | $ | 7,895 | 4.94 | % | $ | 127,416 | $ | 6,136 | 4.82 | % | ||||||||||||
Tax-exempt |
5,457 | 286 | 5.22 | 4,527 | 263 | 5.81 | 15,014 | 906 | 6.04 | |||||||||||||||||||||
Total securities |
190,870 | 6,633 | 3.48 | 164,251 | 8,158 | 4.97 | 142,430 | 7,042 | 4.94 | |||||||||||||||||||||
Cash and cash equivalents |
41,978 | 69 | .16 | 30,576 | 468 | 1.53 | 23,566 | 849 | 3.60 | |||||||||||||||||||||
Total loans and leases |
340,571 | 19,460 | 5.71 | 322,015 | 19,904 | 6.18 | 322,381 | 22,838 | 7.08 | |||||||||||||||||||||
Total interest-earning assets |
573,419 | 26,162 | 4.56 | 516,842 | 28,530 | 5.52 | 488,377 | 30,729 | 6.29 | |||||||||||||||||||||
Non-interest-earning assets |
26,120 | 21,633 | 19,447 | |||||||||||||||||||||||||||
Total assets |
$ | 599,539 | $ | 538,475 | $ | 507,824 | ||||||||||||||||||||||||
LIABILITIES AND STOCKHOLDERS' EQUITY |
||||||||||||||||||||||||||||||
Interest-bearing liabilities: |
||||||||||||||||||||||||||||||
Savings deposits |
$ | 258,304 | $ | 2,700 | 1.05 | % | $ | 238,890 | $ | 4,193 | 1.76 | % | $ | 210,572 | $ | 4,841 | 2.30 | % | ||||||||||||
Time deposits |
155,981 | 4,115 | 2.64 | 128,158 | 4,704 | 3.67 | 131,133 | 6,172 | 4.71 | |||||||||||||||||||||
Total interest-bearing deposits |
414,285 | 6,815 | 1.64 | 367,048 | 8,897 | 2.42 | 341,705 | 11,013 | 3.22 | |||||||||||||||||||||
Federal funds purchased |
— | — | — | 166 | 4 | 2.34 | 263 | 15 | 5.52 | |||||||||||||||||||||
Federal Reserve borrowing |
4,718 | 12 | .25 | — | — | — | — | — | — | |||||||||||||||||||||
Repurchase agreements |
21,247 | 286 | 1.35 | 20,496 | 521 | 2.54 | 33,871 | 1,263 | 3.73 | |||||||||||||||||||||
FHLB advances |
58,945 | 2,897 | 4.92 | 58,108 | 2,907 | 5.00 | 39,724 | 2,303 | 5.80 | |||||||||||||||||||||
Other borrowings |
9,930 | 619 | 6.23 | 9,947 | 719 | 7.23 | 9,961 | 824 | 8.27 | |||||||||||||||||||||
Total interest-bearing liabilities |
509,125 | 10,629 | 2.09 | 455,765 | 13,048 | 2.86 | 425,524 | 15,417 | 3.62 | |||||||||||||||||||||
Demand deposits |
45,110 | 46,237 | 47,675 | |||||||||||||||||||||||||||
Other liabilities |
4,145 | 4,284 | 3,705 | |||||||||||||||||||||||||||
Stockholders' equity |
41,159 | 32,189 | 30,920 | |||||||||||||||||||||||||||
Total liabilities and stockholders' equity |
$ | 599,539 | $ | 538,475 | $ | 507,824 | ||||||||||||||||||||||||
Net interest income |
$ | 15,533 | $ | 15,482 | $ | 15,312 | ||||||||||||||||||||||||
Interest rate spread |
2.47 | % | 2.66 | % | 2.67 | % | ||||||||||||||||||||||||
Net interest margin |
2.71 | % | 3.00 | % | 3.14 | % | ||||||||||||||||||||||||
2. Rate / Volume Analysis
During 2009, net interest income, before the provision for credit losses, increased $50,000 or .3% on a tax equivalent basis. As shown in the Rate/Volume Analysis below, $1.0 million was attributable to volume changes and $958,000 to rate changes. The volume changes were mostly attributable to increased levels of loans and leases of $18.6 million and increased levels of investment securities of $26.6 million, offset by increased levels of time deposits of $27.8 million and increased levels of savings deposits of $19.5 million. The average balance of loans and leases was $340.6 million in 2009 compared to $322.0 million in 2008. The decrease in yields on interest-bearing assets and the decrease in rates on interest-bearing liabilities offset each other, resulting in a $958,000 unfavorable difference. The tax equivalent yield on loans and leases in 2009 was 5.71%, compared to 6.18% in 2008. The tax equivalent yield on securities declined to 3.48% in 2009 from 4.97% in 2008. The favorable change due to rate on savings deposits was $1.7 million
24
which had an average rate of 1.05% in 2009 and 1.76% in 2008. The favorable change due to rate on time deposits was $1.3 million which had an average rate of 2.64% in 2009 and 3.67% in 2008. DNB's composite cost of funds decreased to 2.09% in 2009 compared to 2.86% in 2008.
The following table sets forth, among other things, the extent to which changes in interest rates and changes in the average balances of interest-earning assets and interest-bearing liabilities have affected interest income and expense for the periods noted (tax-exempt yields have been adjusted to a tax equivalent basis using a 34% tax rate). For each category of interest-earning assets and interest-bearing liabilities, information is provided with respect to changes attributable to (i) changes in rate (change in rate multiplied by old volume) and (ii) changes in volume (change in volume multiplied by new rate). The net change attributable to the combined impact of rate and volume has been allocated proportionately to the change due to rate and the change due to volume.
Rate / Volume Analysis
(Dollars in thousands)
| |
2009 Versus 2008 Change Due To |
2008 Versus 2007 Change Due To |
||||||||||||||||||
|---|---|---|---|---|---|---|---|---|---|---|---|---|---|---|---|---|---|---|---|---|
| |
Rate |
Volume |
Total |
Rate |
Volume |
Total |
||||||||||||||
Interest-earning assets: |
||||||||||||||||||||
Loans and leases |
$ | (1,505 | ) | $ | 1,060 | $ | (445 | ) | $ | (2,911 | ) | $ | (23 | ) | $ | (2,934 | ) | |||
Investment securities: |
||||||||||||||||||||
Taxable |
(2,426 | ) | 879 | (1,547 | ) | 162 | 1,597 | 1,759 | ||||||||||||
Tax-exempt |
(27 | ) | 49 | 22 | (34 | ) | (609 | ) | (643 | ) | ||||||||||
Cash and cash equivalents |
(418 | ) | 19 | (399 | ) | (488 | ) | 107 | (381 | ) | ||||||||||
Total |
(4,376 | ) | 2,007 | (2,369 | ) | (3,271 | ) | 1,072 | (2,199 | ) | ||||||||||
Interest-bearing liabilities: |
||||||||||||||||||||
Savings deposits |
(1,696 | ) | 203 | (1,493 | ) | (1,145 | ) | 497 | (648 | ) | ||||||||||
Time deposits |
(1,323 | ) | 734 | (589 | ) | (1,359 | ) | (109 | ) | (1,468 | ) | |||||||||
Federal funds purchased |
(4 | ) | — | (4 | ) | (8 | ) | (2 | ) | (10 | ) | |||||||||
Federal Reserve borrowing |
— | 12 | 12 | — | — | — | ||||||||||||||
Repurchase agreements |
(244 | ) | 10 | (234 | ) | (403 | ) | (340 | ) | (743 | ) | |||||||||
FHLB advances |
(51 | ) | 41 | (10 | ) | (315 | ) | 919 | 604 | |||||||||||
Other borrowings |
(100 | ) | (1 | ) | (101 | ) | (104 | ) | (1 | ) | (105 | ) | ||||||||
Total |
(3,418 | ) | 999 | (2,419 | ) | (3,334 | ) | 964 | (2,370 | ) | ||||||||||
Net interest income |
$ | (958 | ) | $ | 1,008 | $ | 50 | $ | 63 | $ | 108 | $ | 171 | |||||||
3. Interest Rate Sensitivity Analysis
The largest component of DNB's total income is net interest income, and the majority of DNB's financial instruments are comprised of interest rate-sensitive assets and liabilities with various terms and maturities. The primary objective of management is to maximize net interest income while minimizing interest rate risk. Interest rate risk is derived from timing differences in the re-pricing of assets and liabilities, loan prepayments, deposit withdrawals, and differences in lending and funding rates. The Asset/Liability Committee ("ALCO") actively seeks to monitor and control the mix of interest rate-sensitive assets and interest rate-sensitive liabilities.
ALCO continually evaluates interest rate risk management opportunities, including the use of derivative financial instruments. Management believes that hedging instruments currently available are not cost-effective, and therefore, has focused its efforts on increasing DNB's spread by attracting lower-costing retail deposits and in some instances, borrowing from the FHLB of Pittsburgh.
25
DNB reports its callable agency and callable municipal investments ($79.2 million at December 31, 2009) and callable FHLB advances ($43 million at December 31, 2009) at their Option Adjusted Spread ("OAS") effective duration date, as opposed to the call or maturity date. In management's opinion, using effective duration dates on callable securities and advances provides a better estimate of the option exercise date under any interest rate environment. The OAS methodology is an approach whereby the likelihood of option exercise takes into account the coupon on the security, the distance to the call date, the maturity date and current interest rate volatility. In addition, prepayment assumptions derived from historical data have been applied to mortgage-related securities, which are included in investments. (See additional discussion in Item 7a. Quantitative and Qualitative Disclosures About Market Risk on page 44 of this Form 10-K.)
B. Liquidity and Market Risk Management
Liquidity is the ability to meet current and future financial obligations. The Bank further defines liquidity as the ability to respond to deposit outflows as well as maintain flexibility to take advantage of lending and investment opportunities. The Bank's primary sources of funds are operating earnings, deposits, repurchase agreements, principal and interest payments on loans, proceeds from loan sales, sales and maturities of mortgage-backed and investment securities, and FHLB advances. The Bank uses the funds generated to support its lending and investment activities as well as any other demands for liquidity such as deposit outflows. While maturities and scheduled amortization of loans and securities are predictable sources of funds, deposit flows, mortgage prepayments, loan and security sales and the exercise of call features are greatly influenced by general interest rates, economic conditions and competition.
The objective of DNB's asset/liability management function is to maintain consistent growth in net interest income within DNB's policy limits. This objective is accomplished through the management of liquidity and interest rate risk, as well as customer offerings of various loan and deposit products. DNB maintains adequate liquidity to meet daily funding requirements, anticipated deposit withdrawals, or asset opportunities in a timely manner. Liquidity is also necessary to meet obligations during unusual, extraordinary or adverse operating circumstances, while avoiding a significant loss or cost. DNB's foundation for liquidity is a stable deposit base as well as a marketable investment portfolio that provides cash flow through regular maturities or that can be used for collateral to secure funding in an emergency. As part of its liquidity management, DNB maintains assets, which comprise its primary liquidity (Federal funds sold, investments and interest-bearing cash balances, less pledged securities).
C. Credit Risk Management
DNB defines credit risk as the risk of default by a customer or counter-party. The objective of DNB's credit risk management strategy is to quantify and manage credit risk on an aggregate portfolio basis as well as to limit the risk of loss resulting from an individual customer default. Credit risk is managed through a combination of underwriting, documentation and collection standards. DNB's credit risk management strategy calls for regular credit examinations and quarterly management reviews of large credit exposures and credits experiencing credit quality deterioration. DNB's loan review procedures provide objective assessments of the quality of underwriting, documentation, risk grading and charge-off procedures, as well as an assessment of the allowance for credit loss reserve analysis process. As the U.S. economy moves through a period of recession, it is possible that delinquencies and non-performing assets may rise as the value of homes decline and DNB's borrowers experience financial difficulty due to corporate downsizing, reduced sales, or other negative events which will impact their ability to meet their contractual loan payments. To minimize the impact on DNB's earnings and maintain sound credit quality, management continues to aggressively monitor credit and credit relationships that may be impacted by such adverse factors.
26
D. Competition
In addition to the challenges related to the interest rate environment, community banks in Chester and Delaware Counties have been experiencing increased competition from large regional and international banks entering DNB's marketplace through mergers and acquisitions. Competition for loans and deposits has negatively affected DNB's net interest margin. To compensate for the increased competition, DNB, along with other area community banks, has aggressively sought and marketed customers who have been disenfranchised by these mergers. To attract these customers, DNB has introduced new deposit products, such as Mobile Banking, Rewards Checking, Credit Cards as well as Executive and employee packages. In addition, DNB has introduced Remote Capture to our commercial customers to expedite their collection of funds.
E. Bank Secrecy Act/OFAC/Patriot Act Implementation
Management of the Bank had previously determined that its BSA compliance program needed to be improved to a level commensurate with BSA, OFAC and Patriot Act related risks to which the Bank is exposed. An action plan was developed and implemented to strengthen the Bank's compliance. It is management's goal that these improvements to the BSA compliance program will address the Bank's BSA compliance needs in order to establish the Bank as an institution that will not pose a target to those who would use the U.S. financial system to further criminal or terrorist ends. However, there is no assurance that the Bank's improved compliance plan will eliminate all risks related to BSA, OFAC and Patriot Act because those regulatory requirements are dynamic and complex and must be continually reassessed in light of the changing environment in which they operate. During 2009, DNB continued its efforts to strengthen its BSA policies, procedures and systems to ensure compliance with OFAC regulations.
V. Recent Developments
A. Accounting Developments Affecting DNB
In June 2009, the Financial Accounting Standards Board ("FASB") issued an update to Accounting Standard Codification 105-10, "Generally Accepted Accounting Principles." This standard establishes the FASB Accounting Standard Codification ("Codification" or "ASC") as the source of authoritative U.S. GAAP recognized by the FASB for nongovernmental entities. The Codification is effective for interim and annual periods ending after September 15, 2009. The Codification is a reorganization of existing U.S. GAAP and does not change existing U.S. GAAP. The Corporation adopted this standard during the third quarter of 2009. The adoption had no impact on the Corporation's consolidated financial statements.
In June 2009, the FASB issued new guidance impacting FASB ASC 860, Transfers and Servicing ASC Topic 860, "Transfers and Servicing." New authoritative accounting guidance under ASC Topic 860, "Transfers and Servicing," amends prior accounting guidance as follows: (i) eliminates the concept of a qualified special purpose entity ("QSPE"); (ii) requires a transferor to consider all arrangements made contemporaneously with or in anticipation of a transfer when determining whether derecognition is appropriate; (iii) clarifies the requirement that a transferred financial asset be legally isolated from the transferor and any of its consolidated affiliates; (iv) introduces the concept of a participating interest which is applied to transfers of portions of financial assets to determine derecognition eligibility; (v) modifies the conditions required for a transfer of financial assets to qualify as a sale; (vi) changes the initial measurement guidance for asset transfers that qualify as sales and (vii) stipulates that guaranteed mortgage securitizations ("GMS") that fail to meet the conditions for sale accounting will result in the continued classification of the securitized mortgage loans as loans and will not enable a transferor to recognize a servicing asset or liability. The new authoritative accounting guidance under ASC Topic 860 will be effective January 1, 2010 and will have no impact on the Corporation's consolidated financial statements.
In August 2009, the FASB issued Accounting Standards Update ("ASU") 2009-05, "Measuring Liabilities at Fair Value," which updates ASC 820-10, "Fair Value Measurements and Disclosures." The
27
updated guidance clarifies that the fair value of a liability can be measured in relation to the quoted price of the liability when it trades as an asset in an active market, without adjusting the price for restrictions that prevent the sale of the liability. This guidance is effective beginning October 1, 2009. The adoption of this guidance did not have an impact on the Corporation's consolidated financial statements.
In April 2009, the FASB issued new guidance impacting ASC 320-10, "Investments — Debt and Equity Securities." The guidance amends the other-than-temporary impairment ("OTTI") guidance for debt securities. If the fair value of a debt security is less than its amortized cost basis at the measurement date, the updated guidance requires the Corporation to determine whether it has the intent to sell the debt security or whether it is more likely than not it will be required to sell the debt security before the recovery of its amortized cost basis. If either condition is met, an entity must recognize full impairment. For all other debt securities that are considered other-than-temporarily impaired and do not meet either condition, the guidance requires that the credit loss portion of impairment be recognized in earnings and the temporary impairment related to all other factors be recorded in other comprehensive income. In addition, the guidance requires additional disclosures regarding impairments on debt and equity securities. The adoption of this guidance did not have an impact on the Corporation's consolidated financial statements.
In April 2009, the FASB issued new guidance impacting ASC 820-10, "Fair Value Measurements and Disclosures" to provide guidance on determining fair value when the volume and level of activity for the asset or liability have significantly decreased and identifying transactions that are not orderly. This issuance provides guidance on estimating fair value when there has been a significant decrease in the volume and level of activity for the asset or liability and for identifying transactions that may not be orderly. The guidance requires entities to disclose the inputs and valuation techniques used to measure fair value and to discuss changes in valuation techniques and related inputs, if any, in both interim and annual periods. The Corporation adopted this standard on June 30, 2009. The adoption had no impact on the Corporation's consolidated financial statements.
In December 2009, the FASB issued FASB ASC 810, Consolidations. This accounting guidance was originally issued in June 2009 and is now included in ASC 810. The guidance amends the consolidation guidance applicable for variable interest entities. The guidance is effective for financial statements issued for fiscal years and interim periods beginning after November 15, 2009, and early adoption is prohibited. The adoption will have no impact on the Corporation's consolidated financial statements.
VI. Critical Accounting Policies and Estimates
The following discussion and analysis of financial condition and results of operations is based upon our consolidated financial statements, which have been prepared in accordance with U.S. generally accepted accounting principles. Generally accepted accounting principles are complex and require management to apply significant judgment to various accounting, reporting and disclosure matters. Management must use assumptions and estimates to apply these principles where actual measurement is not possible or practical. Actual results may differ from these estimates under different assumptions or conditions.
In management's opinion, the most critical accounting policies and estimates impacting DNB's consolidated financial statements are listed below. These policies are critical because they are highly dependent upon subjective or complex judgments, assumptions and estimates. Changes in such estimates may have a significant impact on the financial statements. For a complete discussion of DNB's significant accounting policies, see the footnotes to the Consolidated Financial Statements and discussion throughout this Form 10-K.
1. Determination of the allowance for credit losses. Credit loss allowance policies involve significant judgments, estimates and assumptions by management which may have a material impact on the carrying value of net loans and, potentially, on the net income recognized by DNB from period to period. The allowance for credit losses is based on management's ongoing evaluation of the loan and lease portfolio
28
and reflects an amount considered by management to be its best estimate of the amount necessary to absorb known and inherent losses in the portfolio. Management considers a variety of factors when establishing the allowance, such as the impact of current economic conditions, diversification of the portfolios, delinquency statistics, results of loan review and related classifications, and historic loss rates. In addition, certain individual loans which management has identified as problematic are specifically provided for, based upon an evaluation of the borrower's perceived ability to pay, the estimated adequacy of the underlying collateral and other relevant factors. In addition, regulatory authorities, as an integral part of their examinations, periodically review the allowance for credit losses. They may require additions to the allowance based upon their judgments about information available to them at the time of examination. Although provisions have been established and segmented by type of loan, based upon management's assessment of their differing inherent loss characteristics, the entire allowance for credit losses is available to absorb further losses in any category.
Management uses significant estimates to determine the allowance for credit losses. Because the allowance for credit losses is dependent, to a great extent, on conditions that may be beyond DNB's control, management's estimate of the amount necessary to absorb credit losses and actual credit losses could differ. DNB's current judgment is that the allowance for credit losses remains appropriate at December 31, 2009.
VII. 2009 Financial Results
A. Liquidity
Management maintains liquidity to meet depositors' needs for funds, to satisfy or fund loan commitments, and for other operating purposes. DNB's foundation for liquidity is a stable and loyal customer deposit base, cash and cash equivalents, and a marketable investment portfolio that provides periodic cash flow through regular maturities and amortization, or that can be used as collateral to secure funding. Primary liquidity includes investments, Federal funds sold, and interest-bearing cash balances, less pledged securities. DNB also anticipates scheduled payments and prepayments on its loan and mortgage-backed securities portfolios. In addition, DNB maintains borrowing arrangements with various correspondent banks, the Federal Home Loan Bank of Pittsburgh and the Federal Reserve Bank of Philadelphia to meet short-term liquidity needs. Through these relationships, DNB has available credit of approximately $194.1 million at December 31, 2009. Management believes that DNB has adequate resources to meet its short-term and long-term funding requirements.
As of December 31, 2009, deposits totaled $507.3 million, up $98.8 million from $408.5 million at December 31, 2008. There were approximately $119.0 million in certificates of deposit (including IRAs) scheduled to mature during the next twelve months. At December 31, 2009, DNB had $55.2 million in un-funded loan commitments. In addition, there was $2.8 million in un-funded letters of credit. Management anticipates the majority of these commitments will be funded by means of normal cash flows.
The following table sets forth the composition of DNB's deposits at the dates indicated.
Deposits By Major Classification
(Dollars in thousands)
| |
December 31 |
||||||||||||||||
|---|---|---|---|---|---|---|---|---|---|---|---|---|---|---|---|---|---|
| |
2009 |
2008 |
2007 |
2006 |
2005 |
||||||||||||
Non-interest-bearing deposits |
$ | 46,236 | $ | 45,503 | $ | 48,741 | $ | 50,852 | $ | 51,407 | |||||||
Interest-bearing deposits: |
|||||||||||||||||
NOW |
151,597 | 106,623 | 82,912 | 82,579 | 78,664 | ||||||||||||
Money market |
102,427 | 81,742 | 93,029 | 66,352 | 45,390 | ||||||||||||
Savings |
35,973 | 32,895 | 38,362 | 54,956 | 77,216 | ||||||||||||
Certificates |
148,636 | 124,665 | 133,530 | 108,970 | 70,621 | ||||||||||||
IRA |
22,478 | 17,042 | 16,346 | 17,318 | 16,329 | ||||||||||||
Total deposits |
$ | 507,347 | $ | 408,470 | $ | 412,920 | $ | 381,027 | $ | 339,627 | |||||||
29
Capital Resources and Adequacy
Stockholders' equity was $42.9 million at December 31, 2009 compared to $30.1 million at December 31, 2008. The increase in stockholders' equity was primarily a result of participation in the U.S. Treasury Capital Purchase program with the issuance of $11.7 million of Preferred Stock as described below, coupled with year-to-date earnings of $1.5 million, a $186,000 change in unrealized gains, net-of-tax, on the securities portfolio and an unrealized actuarial gain on DNB's pension totaling $385,000. These additions to stockholders' equity were partially offset by $586,000 of dividends paid on DNB's common stock, $74,000 of dividends accrued and $465,000 of dividends paid on DNB's Fixed Rate Cumulative Perpetual Preferred Stock.
Management believes that the Corporation and the Bank have each met the definition of "well capitalized" for regulatory purposes on December 31, 2009. The Bank's capital category is determined for the purposes of applying the bank regulators' "prompt corrective action" regulations and for determining levels of deposit insurance assessments and may not constitute an accurate representation of the Corporation's or the Bank's overall financial condition or prospects. The Corporation's capital exceeds the Federal Reserve Bank's ("FRB's") minimum leverage ratio requirements for bank holding companies (see additional discussion in Regulatory Matters — Footnote 17 to DNB's consolidated financial statements).
Under federal banking laws and regulations, DNB and the Bank are required to maintain minimum capital as determined by certain regulatory ratios. Capital adequacy for regulatory purposes, and the capital category assigned to an institution by its regulators, may be determinative of an institution's overall financial condition.
In addition, the FRB's leverage ratio rules require bank holding companies to maintain a minimum level of "primary capital" to total assets of 5.5% and a minimum level of "total capital" to total assets of 6%. For this purpose, (i) "primary capital" includes, among other items, common stock, certain perpetual debt instruments such as eligible Trust Preferred Securities, contingency and other capital reserves, and the allowance for credit losses, (ii) "total capital" includes, among other things, certain subordinated debt, and "total assets" is increased by the allowance for credit losses. Both DNB and the Bank would be deemed to be "well capitalized" for regulatory purposes.
On January 30, 2009, as part of the CPP administered by the United States Department of the Treasury, DNB Financial Corporation entered into a Letter Agreement and a Securities Purchase Agreement with the U.S. Treasury (see additional discussion in Participation in U.S. Treasury Capital Purchase Program, on page 6 of this Form 10-K).
B. Results of Operations
1. Summary of Performance
(a) Summary of Results
For the year ended December 31, 2009, DNB reported net income of $1.5 million versus $809,000 for 2008. Per share earnings on a fully diluted basis were $0.38, up from $0.31 for the prior year.
DNB's earnings were impacted by the general economic conditions challenging all commercial banking institutions — the current global and U.S. recession, dramatic declines in the housing market, falling home prices, increased foreclosures and unemployment. During the year, management focused on expense control, increasing liquidity and adherence to sound underwriting standards. To increase liquidity, management increased the size of the investment securities portfolio from $124.1 million at December 31, 2008 to $204.1 million at December 31, 2009. During 2009, DNB continued to focus on expense control and operational efficiencies as operating expenses declined by $141,000 or .84%. Management was able to accomplish this reduction, despite payments to the FDIC for a special assessment and increased rates
30
which were $754,000 more than the amount paid to the FDIC in 2008. In addition, management restructured portions of DNB's investment portfolio and recognized $1.4 million in net gains during 2009. Highlights for the year include:
- •
- Steady growth in loans — up $23.0 million or 6.8%
- •
- Control of non-interest expenses — decrease from 2008 of $141,000 or .84%
- •
- Strengthened capital position — Tier 1 Capital increased 30.1% to $53.1 million
(b) Significant Events, Transactions and Economic Changes Affecting Results
Some of DNB's significant events during 2009 include:
- •
- Net loans and leases were $354.0 million at December 31, 2009, up $22.1 million or 6.7% from 2008.
The increase was primarily the result of originations by our loan officers, coupled with strategic purchases of Small Business Administration and United States Department of Agriculture guaranteed
loans. Commercial mortgage loans grew $33.2 million or 23.9% to $172.1 million and commercial loans increased $4.6 million or 5.5% to $87.8 million. This was offset by
declines in consumer loans of $7.9 million or 12.5% to $55.5 million, primarily due to the current economic environment which has lessened consumer demand for home equity loan products
as a result of falling housing prices and a higher unemployment rate. In addition, commercial leases declined $3.8 million or 55.0% and residential mortgage loans declined $3.1 million
or 7.0%.
- •
- DNB continued its focus on expense control and improving operational efficiencies throughout the bank. As a result,
non-interest expenses declined approximately 1% year over year. Non-interest expenses were $16.6 million in 2009, compared to $16.7 million in 2008.
- •
- DNB made $1.3 million in provisions for credit losses during the year in response to the deteriorating economy and its impact on certain of DNB's borrowers. This provision strengthened DNB's Allowance for Credit Losses to Total Loans ratio from 1.36% at December 31, 2008, to 1.52% at December 31, 2009.
(c) Trends and Uncertainties
Please refer to Item 7. Management's Discussion and Analysis of Financial Condition and Results of Operations-Introductory Overview on page 19 of this Form 10-K.
(d) Material Changes in Results
Please refer to the discussion above in the section titled "Significant Events, Transactions and Economic Changes Affecting Results."
(e) Effect of Inflation and Changing Rates
For detailed discussion of the effects of inflation and changes in rates on DNB's results, refer to the discussion below on "Net Interest Income."
2. Net Interest Income
DNB's earnings performance is primarily dependent upon its level of net interest income, which is the excess of interest income over interest expense. Interest income includes interest earned on loans and leases (net of interest reversals on non-performing loans), investments and Federal funds sold, as well as net loan fee amortization and dividend income. Interest expense includes the interest cost for deposits, FHLB advances, repurchase agreements, corporate debentures, Federal funds purchased and other borrowings.
31
During 2009, DNB focused on loan growth and expense control as well as strengthening its capital and liquidity positions. DNB grew loans by $23.0 million or 6.83% during 2009 and reduced its composite cost of funds from 2.59% in 2008 to 1.92% in 2009. DNB also made $1.3 million in provisions for credit losses during the year in response to the deteriorating economy and its impact on certain of DNB's borrowers. Non-interest income increased $99,000 and non-interest expenses decreased $141,000 or approximately 1% year over year. At December 31, 2009, DNB's leverage ratio stood at 8.33% and its total risk-based capital ratio was 14.27%. In response to unprecedented economic turmoil during the latter part of 2008 and the early part of 2009, management decided to increase its liquid assets, primarily investment securities which totaled $204.1 million at December 31, 2009.
Interest earned on loans and leases was $19.3 million for 2009 compared to $19.7 million for 2008. The average balance on loans and leases was $340.6 million with an average yield of 5.71% in 2009 compared to an average balance of $322.0 million with an average yield of 6.18% in 2008. The decrease in yield was the result of lower interest rates on fixed and prime-based loans as well as a higher level of non-performing assets year over year.
Interest and dividends on investment securities was $6.5 million and $8.1 million for 2009 and 2008, respectively. The average balance on investment securities was $190.9 million with an average yield of 3.48% in 2009 compared to $164.3 million with an average yield of 4.97% in 2008. Interest and dividends decreased $1.5 million, primarily due to a lower average balance of securities and a lower yield on securities year over year. Total investment securities increased $80.0 million from December 31, 2008 to December 31, 2009, primarily due to the purchase of $259.9 million of securities, offset by $180.2 million of sales, maturities, calls and pay-downs during 2009.
Interest on deposits was $6.8 million for 2009 compared to $8.9 million for 2008. The average balance of interest-bearing deposits was $414.3 million with an average rate of 1.64% for 2009 compared to $367.0 million with an average rate of 2.42% for 2008. The increase in average balance was primarily the result of our efforts to increase deposits. The decrease in rate was primarily the result of a decrease in the cost of funds resulting from the lower interest rate environment during 2009.
Interest on FHLB advances was $2.89 million for 2009 compared to $2.90 million for 2008. The average balance on FHLB advances was $58.9 million with an average rate of 4.92% for 2009 compared to $58.1 million with an average rate of 5.00% for 2008.
Interest on repurchase agreements was $286,000 for 2009 compared to $521,000 for 2008. The average balance on repurchase agreements was $21.2 million with an average rate of 1.35% for 2009 compared to $20.5 million with an average rate of 2.54% for 2008. The decrease in rate was primarily the result of the lower interest rate environment during 2009.
3. Provision for Credit Losses
To provide for known and inherent losses in the loan and lease portfolio, DNB maintains an allowance for credit losses. There was a $1.3 million provision made in 2009, compared to a $2.0 million provision made in 2008. Management made a $1.3 million provision in 2009 primarily in response to DNB's increased level of non-performing assets which grew $5.9 million to $13.7 million at December 31, 2009, compared to $7.7 million at December 31, 2008. For a detailed discussion on DNB's reserving methodology, refer to "Item 1 — Determination of the allowance for credit losses" which can be found under "Critical Accounting Policies and Estimates".
4. Non-Interest Income
Non-interest income includes service charges on deposit products; fees received in connection with the sale of non-depository products and services, including fiduciary and investment advisory services
32
offered through DNB Advisors; securities brokerage products and services and insurance products and services offered through DNB Financial Services; and other sources of income such as increases in the cash surrender value of Bank Owned Life Insurance ("BOLI"), net gains on sales of investment securities and other real estate owned ("OREO") properties. In addition, DNB receives fees for cash management, remote capture, merchant services, debit cards, safe deposit box rentals and similar activities.
Non-interest income was $4.5 million for 2009 compared to $4.4 million for 2008. This increase was primarily due to the sale, redemption and calls of securities having a book value of $146.9 million during the year, resulting in $1.4 million of net gains. The $1.4 million of net gains on sales of securities was $402,000 higher than the $962,000 recorded in 2008. This increase in gains was partially offset by declines in service charges on deposits and wealth management fees. The $142,000 decrease in service charges on deposits was primarily attributable to a year-over-year decrease in non-sufficient funds charges. Wealth management fees were $794,000 for 2009 compared to $820,000 for 2008. This decrease was primarily the result of lower annuity sales in DNB Financial Services.
5. Non-Interest Expense
Non-interest expense includes salaries & employee benefits, furniture & equipment, occupancy, professional & consulting fees as well as marketing, printing & supplies and other less significant expense items.
Non-interest expense was $16.6 million for 2009 compared to $16.7 million for 2008. The $141,000 decrease year over year was due primarily to management's efforts to control expenses during 2009.
Salary and employee benefits. Salary and employee benefits were $8.2 million for 2009 compared to $8.9 million for 2008. The decrease was attributable to lower levels of full-time equivalent employees year over year, coupled with lower benefit costs.
Furniture and equipment. Furniture and equipment expense was $1.6 million for 2009 compared to $1.7 million for 2008. The slight decrease was primarily attributable to lower depreciation on existing furniture and equipment.
Occupancy. Occupancy expense was flat at $1.6 million for both 2009 and 2008.
Professional and consulting. Professional and consulting expenses were flat at $1.3 million for both 2009 and 2008.
FDIC Insurance. FDIC insurance was $1.1 million in 2009 compared to $307,000 in 2008. The $754,000 increase in 2009 was attributable to the $280,000 special assessment paid to the FDIC, in addition to $474,000 more paid to the FDIC for regular premiums. The $474,000 increase was due to higher rates charged by the FDIC, coupled with a higher assessment base.
Other Expenses. Other expenses were flat at $2.2 million for both 2009 and 2008.
6. Income Taxes
Income tax expense was $362,000 for 2009 compared to $64,000 for 2008. Income tax expense for each period differs from the amount determined at the statutory rate of 34% due to tax-exempt income on loans and investment securities, DNB's ownership of BOLI policies and tax credits recognized on a low-income housing limited partnership. The effective tax rates for 2009 and 2008 were 18.9% and 7.3%, respectively. The higher effective tax in 2009 was due to higher levels of pre-tax income in 2009, compared to 2008.
33
Financial Condition Analysis
1. Investment Securities
DNB's investment portfolio consists of US agency securities, mortgage-backed securities issued by US Government agencies, collateralized mortgage obligations, state and municipal securities, bank stocks, and other bonds and notes. In addition to generating revenue, DNB maintains the investment portfolio to manage interest rate risk, provide liquidity, provide collateral for borrowings and to diversify the credit risk of earning assets. The portfolio is structured to maximize DNB's net interest income given changes in the economic environment, liquidity position and balance sheet mix.
Given the nature of the portfolio, and its generally high credit quality, management normally expects to realize all of its investment upon the maturity of such instruments. Management determines the appropriate classification of securities at the time of purchase. Investment securities are classified as: (a) securities held to maturity ("HTM") based on management's intent and ability to hold them to maturity; (b) trading account ("TA") securities that are bought and held principally for the purpose of selling them in the near term; and (c) securities available for sale ("AFS"). DNB does not currently maintain a trading account portfolio.
Securities classified as AFS include securities that may be sold in response to changes in interest rates, changes in prepayment assumptions, the need to increase regulatory capital or other similar requirements. DNB does not necessarily intend to sell such securities, but has classified them as AFS to provide flexibility to respond to liquidity needs.
DNB's investment portfolio (HTM and AFS securities) totaled $200.0 million at December 31, 2009, up $79.9 million or 67% from $120.1 million at December 31, 2008. On September 30, 2008, DNB reclassified its taxable municipal securities with a net carrying amount of $22.7 million from AFS to HTM. Reclassifying the taxable municipal securities to HTM reduced the volatility and future negative effect on DNB's capital, because HTM securities are not marked-to-market through other comprehensive income, but carried at their amortized cost basis. In general, when securities are held in the HTM portfolio, they can not be sold. After this movement of securities, management anticipated that it would have sufficient cash flow to meet all loan and deposit obligations.
At December 31, 2009, approximately 78% of DNB's investments were in the AFS portfolio and 22% was in the HTM portfolio. Investments consist mainly of MBS and Agency notes backed by government sponsored enterprises, such as FHLMC, FNMA and FHLB, as well as state and municipal securities. Management regularly reviews its investment portfolio to determine whether any securities are other than temporarily impaired. DNB did not invest in securities backed by sub-prime mortgages. At December 31, 2009, the combined AFS and HTM portfolios had an unrealized pretax gain of $1.4 million and an unrealized pretax loss of $2.2 million. There were no other than temporarily impaired securities.
The following tables set forth information regarding the composition, stated maturity and average yield of DNB's investment security portfolio as of the dates indicated (tax-exempt yields have been adjusted to a tax equivalent basis using a 34% tax rate). The first two tables do not include amortization or anticipated prepayments on mortgage-backed securities. Callable securities are included at their stated maturity dates.
34
Investment Maturity Schedule, Including Weighted Average Yield
(Dollars in thousands)
| |
December 31, 2009 |
|||||||||||||||||||||
|---|---|---|---|---|---|---|---|---|---|---|---|---|---|---|---|---|---|---|---|---|---|---|
| Held to Maturity |
Less than 1 Year |
1-5 Years |
5-10 Years |
Over 10 Years |
No Stated Maturity |
Total |
Yield |
|||||||||||||||
US agency mortgage-backed securities |
$ | 4,733 | $ | 1,765 | $ | 6,311 | $ | — | $ | — | $ | 12,809 | 3.98 | % | ||||||||
Collateralized mortgage obligations |
— | — | 246 | 3,421 | — | 3,667 | 3.57 | |||||||||||||||
State and municipal tax-exempt |
231 | 2,135 | 1,128 | 1,960 | — | 5,454 | 3.42 | |||||||||||||||
State and municipal taxable |
— | 2,582 | 11,986 | 7,668 | — | 22,236 | 5.96 | |||||||||||||||
Total |
$ | 4,964 | $ | 6,482 | $ | 19,671 | $ | 13,049 | $ | — | $ | 44,166 | 4.87 | % | ||||||||
Percent of portfolio |
11 | % | 15 | % | 45 | % | 29 | % | — | % | 100 | % | ||||||||||
Weighted average yield |
3.40 | % | 4.09 | % | 5.26 | % | 5.23 | % | — | % | 4.87 | % | ||||||||||
| Available for Sale |
Less than 1 Year |
1-5 Years |
5-10 Years |
Over 10 Years |
No Stated Maturity |
Total |
Yield |
|||||||||||||||
|---|---|---|---|---|---|---|---|---|---|---|---|---|---|---|---|---|---|---|---|---|---|---|
US Government agency obligations |
$ | 6,611 | $ | 39,131 | $ | 8,171 | $ | 8,147 | $ | — | $ | 62,060 | 1.86 | % | ||||||||
Corporate bonds |
— | 16,617 | 5,578 | — | — | 22,195 | 3.79 | |||||||||||||||
US agency mortgage-backed securities |
— | — | 15,648 | 44,196 | — | 59,844 | 3.60 | |||||||||||||||
Collateralized mortgage obligations |
— | — | 4,121 | 7,629 | — | 11,750 | 3.54 | |||||||||||||||
Equity securities |
— | — | — | — | 13 | 13 | 1.69 | |||||||||||||||
Total |
$ | 6,611 | $ | 55,748 | $ | 33,518 | $ | 59,972 | $ | 13 | $ | 155,862 | 2.93 | % | ||||||||
Percent of portfolio |
4 | % | 36 | % | 22 | % | 38 | % | — | % | 100 | % | ||||||||||
Weighted average yield |
0.99 | % | 2.13 | % | 3.33 | % | 3.33 | % | 1.69 | % | 2.93 | % | ||||||||||
Composition of Investment Securities
(Dollars in thousands)
| |
December 31 |
||||||||||||
|---|---|---|---|---|---|---|---|---|---|---|---|---|---|
| |
2009 |
2008 |
|||||||||||
| |
Held to Maturity |
Available for Sale |
Held to Maturity |
Available for Sale |
|||||||||
US Government agency obligations |
$ | — | $ | 62,060 | $ | — | $ | 6,126 | |||||
Corporate bonds |
— | 22,195 | — | 17,035 | |||||||||
US agency mortgage-backed securities |
12,809 | 59,844 | 27,884 | 32,379 | |||||||||
Collateralized mortgage obligations |
3,667 | 11,750 | 4,962 | 5,105 | |||||||||
State and municipal tax-exempt |
5,454 | — | 4,513 | — | |||||||||
State and municipal taxable |
22,236 | — | 22,036 | — | |||||||||
Equity securities |
— | 13 | — | 21 | |||||||||
Total |
$ | 44,166 | $ | 155,862 | $ | 59,395 | $ | 60,666 | |||||
2. Loans and Lease Portfolio
DNB's loan and lease portfolio consists primarily of commercial and residential real estate loans, commercial loans and lines of credit (including commercial construction), commercial leases and consumer loans. The portfolio provides a stable source of interest income, monthly amortization of principal and, in the case of adjustable rate loans, re-pricing opportunities.
Net loans and leases were $354.0 million at December 31, 2009, up $22.1 million or 6.7% from 2008. The increase was primarily the result of originations by our loan officers, coupled with strategic purchases of Small Business Administration and United States Department of Agriculture guaranteed loans. Commercial mortgage loans increased $33.2 million or 23.9% to $172.1 million and commercial loans increased $4.6 million or 5.5% to $87.8 million. Consumer loans decreased $7.9 million or 12.5% to
35
$55.5 million, commercial leases decreased $3.8 million or 55.0% to $3.1 million and residential mortgage loans decreased $3.1 million or 7.0% to $41.0 million.
The following table sets forth information concerning the composition of total loans outstanding, net of unearned income and fees and the allowance for credit losses, as of the dates indicated.
Total Loans and Leases Outstanding, Net of Allowance for Credit Losses
(Dollars in thousands)
| |
December 31 |
|||||||||||||||
|---|---|---|---|---|---|---|---|---|---|---|---|---|---|---|---|---|
| |
2009 |
2008 |
2007 |
2006 |
2005 |
|||||||||||
Residential mortgages |
$ | 40,951 | $ | 44,052 | $ | 46,448 | $ | 52,636 | $ | 43,738 | ||||||
Commercial mortgages |
172,117 | 138,897 | 111,727 | 99,333 | 88,921 | |||||||||||
Commercial loans |
87,778 | 83,186 | 81,021 | 99,732 | 83,156 | |||||||||||
Commercial leases |
3,077 | 6,919 | 13,593 | 22,994 | 23,934 | |||||||||||
Consumer |
55,504 | 63,400 | 56,553 | 54,771 | 48,381 | |||||||||||
Total loans and leases |
359,427 | 336,454 | 309,342 | 329,466 | 288,130 | |||||||||||
Less allowance for credit losses |
(5,477 | ) | (4,586 | ) | (3,891 | ) | (4,226 | ) | (4,420 | ) | ||||||
Net loans and leases |
$ | 353,950 | $ | 331,868 | $ | 305,451 | $ | 325,240 | $ | 283,710 | ||||||
The following table sets forth information concerning the contractual maturities of the loan portfolio, net of unearned income and fees. For amortizing loans, scheduled repayments for the maturity category in which the payment is due are not reflected below, because such information is not readily available.
Loan and Lease Maturities
(Dollars in thousands)
| |
December 31, 2009 |
||||||||||||
|---|---|---|---|---|---|---|---|---|---|---|---|---|---|
| |
Less than 1 Year |
1-5 Years |
Over 5 Years |
Total |
|||||||||
Residential mortgages |
$ | 12,661 | $ | 8,318 | $ | 19,972 | $ | 40,951 | |||||
Commercial mortgages |
19,450 | 62,762 | 89,905 | 172,117 | |||||||||
Commercial term loans |
29,312 | 18,499 | 39,967 | 87,778 | |||||||||
Commercial leases |
770 | 2,307 | — | 3,077 | |||||||||
Consumer loans |
3,339 | 18,209 | 33,956 | 55,504 | |||||||||
Total loans and leases |
65,532 | 110,095 | 183,800 | 359,427 | |||||||||
Loans and leases with fixed interest rates |
12,065 | 72,446 | 119,797 | 204,308 | |||||||||
Loans and leases with variable interest rates |
53,467 | 37,649 | 64,003 | 155,119 | |||||||||
Total loans and leases |
$ | 65,532 | $ | 110,095 | $ | 183,800 | $ | 359,427 | |||||
3. Non-Performing Assets
Total non-performing assets increased $6.0 million to $13.7 million at December 31, 2009, compared to $7.7 million at December 31, 2008. The increase was primarily attributable to 6 residential and 7 commercial loans that were placed on non-accrual status during 2009. As a result of the increase in non-performing loans, the non-performing loans to total loans ratio increased to 2.55% at December 31, 2009, up from .81% at December 31, 2008. The non-performing assets to total assets ratio increased to 2.16% at December 31, 2009 from 1.45% at December 31, 2008. The non-performing loans to the allowance ratio increased from 59.4% at December 31, 2008 to 167.7% at December 31, 2009. DNB continues to work diligently to improve asset quality by adhering to strict underwriting standards and improving lending policies and procedures. Non-performing assets have, and will continue to have, an impact on earnings; therefore management intends to continue working aggressively to reduce the level of such assets.
Non-performing assets are comprised of non-accrual loans and leases, loans and leases delinquent over ninety days and still accruing, troubled debt restructurings ("TDRs") as well as Other Real Estate
36
Owned ("OREO") and other repossessed assets. Non-accrual loans and leases are loans and leases for which the accrual of interest ceases when the collection of principal or interest payments is determined to be doubtful by management. It is the policy of DNB to discontinue the accrual of interest when principal or interest payments are delinquent 90 days or more (unless the loan principal and interest are determined by management to be fully secured and in the process of collection), or earlier if considered prudent. Interest received on such loans is applied to the principal balance, or may, in some instances, be recognized as income on a cash basis. A non-accrual loan or lease may be restored to accrual status when management expects to collect all contractual principal and interest due and the borrower has demonstrated a sustained period of repayment performance in accordance with the contractual terms. OREO consists of real estate acquired by foreclosure. Other repossessed assets are primarily assets from DNB's commercial lease portfolio that were repossessed. OREO and other repossessed assets are carried at the lower of cost or estimated fair value, less estimated disposition costs. Any significant change in the level of non-performing assets is dependent, to a large extent, on the economic climate within DNB's market area.
DNB's Credit Policy Committee monitors the performance of the loan and lease portfolio to identify potential problem assets on a timely basis. Committee members meet to design, implement and review asset recovery strategies, which serve to maximize the recovery of each troubled asset. As of December 31, 2009, DNB had $16.3 million of loans, which, although performing at that date, are believed to require increased supervision and review; and may, depending on the economic environment and other factors, become non-performing assets in future periods. The amount of such loans at December 31, 2008 was $11.2 million. The majority of the loans are secured by commercial real estate, with lesser amounts being secured by residential real estate, inventory and receivables.
The following table sets forth those assets that are: (i) placed on non-accrual status, (ii) contractually delinquent by 90 days or more and still accruing, (iii) troubled debt restructurings other than those included in items (i) and (ii), and (iv) OREO as a result of foreclosure or voluntary transfer to DNB as well as other repossessed assets.
Non-Performing Assets
(Dollars in thousands)
| |
December 31 |
||||||||||||||||
|---|---|---|---|---|---|---|---|---|---|---|---|---|---|---|---|---|---|
| |
2009 |
2008 |
2007 |
2006 |
2005 |
||||||||||||
Non-accrual loans: |
|||||||||||||||||
Residential mortgages |
$ | 3,081 | $ | 362 | $ | 697 | $ | — | $ | — | |||||||
Commercial mortgages |
1,317 | — | — | — | 5 | ||||||||||||
Commercial term loans |
4,374 | 1,163 | — | 42 | 1,017 | ||||||||||||
Commercial leases |
157 | 14 | 255 | 38 | 83 | ||||||||||||
Consumer loans |
62 | 286 | 569 | 635 | — | ||||||||||||
Total non-accrual loans |
8,991 | 1,825 | 1,521 | 715 | 1,105 | ||||||||||||
Loans 90 days past due and still accruing |
191 | 900 | 345 | 106 | 245 | ||||||||||||
Troubled debt restructurings |
— | — | — | — | — | ||||||||||||
Total non-performing loans |
9,182 | 2,725 | 1,866 | 821 | 1,350 | ||||||||||||
Other real estate owned & other repossessed property |
4,489 | 4,997 | — | — | — | ||||||||||||
Total non-performing assets |
$ | 13,671 | $ | 7,722 | $ | 1,866 | $ | 821 | $ | 1,350 | |||||||
Asset quality ratios: |
|||||||||||||||||
Non-performing loans to total loans |
2.6 | % | 0.8 | % | 0.6 | % | 0.3 | % | 0.5 | % | |||||||
Non-performing assets to total assets |
2.16 | 1.45 | 0.34 | 0.16 | 0.29 | ||||||||||||
Allowance for credit losses to: |
|||||||||||||||||
Total loans and leases |
1.52 | 1.36 | 1.26 | 1.28 | 1.53 | ||||||||||||
Non-performing loans and leases |
59.6 | 168.3 | 208.5 | 514.7 | 327.3 | ||||||||||||
37
4. Allowance for Credit Losses
To provide for known and inherent losses in the loan and lease portfolios, DNB maintains an allowance for credit losses. Provisions for credit losses are charged against income to increase the allowance when necessary. Loan and lease losses are charged directly against the allowance and recoveries on previously charged-off loans and leases are added to the allowance. In establishing its allowance for credit losses, management considers the size and risk exposure of each segment of the loan and lease portfolio, past loss experience, present indicators of risk such as delinquency rates, levels of non-accruals, the potential for losses in future periods, and other relevant factors. Management's evaluation of the loan and lease portfolio generally includes reviews of borrowers of $100,000 or greater. Consideration is also given to examinations performed by regulatory agencies, primarily the Office of the Comptroller of the Currency ("OCC").
In establishing and reviewing the allowance for adequacy, management establishes the allowance for credit losses in accordance with U.S. generally accepted accounting principles, guidance provided by the Securities and Exchange Commission and as prescribed in OCC Bulletin 2006-47. Its methodology for assessing the appropriateness of the allowance consists of several key elements which include: specific allowances for identified problem loans; formula allowances for commercial and commercial real estate loans; and allowances for pooled homogenous loans. In considering national and local economic trends, we review a variety of information including Federal Reserve publications, general economic statistics, foreclosure rates and housing statistics published by third parties. We believe this improves the measure of inherent loss over a complete economic cycle and reduces the impact for qualitative adjustments. This process does not impact losses estimated in accordance with ASC 310.
The unallocated portion of the allowance is intended to provide for probable losses not otherwise accounted for in management's other elements of its overall estimate. An unallocated component is maintained to cover uncertainties such as changes in the national and local economy, concentrations of credit, expansion into new markets and other factors that could affect management's estimate of probable losses. The unallocated component of the allowance reflects the margin of imprecision inherent in the underlying assumptions used in the methodologies for estimating specific and general losses in the portfolio.
In addition, DNB reviews historical loss experience for the commercial real estate, commercial, residential real estate, home equity and consumer installment loan pools to determine a historical loss factor. The historical loss factors are then applied to the current portfolio balances to determine the required reserve percentage for each loan pool based on risk rating. A reserve analysis is performed on individually reviewed loans, but not impaired loans, and excludes individually reviewed impaired loans, based on ASC 310. Historical losses are segregated into risk-similar groups and a loss ratio is determined for each group over a three year period. The three year average loss ratio by type is then used to calculate the estimated loss based on the current balance of each group. This three year time period is appropriate given the DNB's historically low level of losses and, more importantly, represents the current economic environment.
This analysis is intended to assess the potential for loss within the loan portfolio and to substantiate the adequacy of the allowance. Should the analysis indicate that the allowance is not adequate, management will recommend a provision expense be made in an amount equal to the shortfall derived. In establishing and reviewing the allowance for adequacy, emphasis has been placed on utilizing the methodology prescribed in OCC Bulletin 2006-47. Management believes that the following factors create a comprehensive system of controls in which management can monitor the quality of the loan portfolio.
38
Consideration has been given to the following factors and variables which may influence the risk of loss within the loan portfolio:
- •
- Changes in the nature and volume of the portfolio and in the terms of loans.
- •
- Changes in the volume and severity of past due loans, the volume of non-accrual loans, and the volume and
severity of adversely classified or graded loans.
- •
- The existence and effect of any concentrations of credit, and changes in the level of such concentrations.
- •
- Changes in lending policies and procedures, including changes in underwriting standards and collection,
charge-off, and recovery practices not considered elsewhere in estimating credit losses.
- •
- Changes in the experience, ability, and depth of lending management and other relevant staff.
- •
- Changes in the quality of the institution's loan review system.
- •
- Changes in international, national, regional, and local economic and business conditions and developments that affect the
collectibility of the portfolio, including the condition of various market segments.
- •
- The effect of other external factors such as competition and legal and regulatory requirements on the level of estimated
credit losses in the institution's existing portfolio.
- •
- Changes in the value of underlying collateral for collateral-dependent loans.
Portfolio risk includes the levels and trends in delinquencies, impaired loans and changes in the loan rating matrix, trends in volume and terms of loans. Management is satisfied with the stability of the past due and non-performing loans and believes there has been no further decline in the quality of the loan portfolio due to any trend in delinquent or adversely classified loans. Although the aggregate total of classified loans has increased, management is confident in the adequacy of the sources of repayment. In determining the adequacy of the allowance, management considered the deterioration of asset quality in DNB's residential construction and residential first mortgage portfolios, which were factors contributing to the increase in the level of allowance during 2009. In addition to ordering new appraisals and creating specific reserves on impaired loans, the allowance allocation rates were increased, reflective of delinquency trends which have been caused by continued weakness in the housing markets, falling home equity values, and rising unemployment. New appraisal values we have obtained for existing loans have been consistent generally with the declines indicated by the Case-Schiller and other indices.
Given the contraction in real estate values, DNB closely monitors the loan to value ratios of all classified assets and requires periodic current appraisals to monitor underlying collateral values. Management also reviews borrower, sponsorship and guarantor's financial strength along with their ability and willingness to provide financial support of their obligations on an immediate and continuing basis.
There was a $1.3 million provision made in 2009, compared to $2.0 million in 2008. DNB's percentage of allowance for credit losses to total loans and leases was 1.52% at December 31, 2009 compared to 1.36% and 1.26% for the years ended December 31, 2008 and 2007, respectively. Management monitors DNB's performance metrics including those ratios related to non-performing loans and leases. The allowance as a percentage of total loans and leases has increased slightly over the last three years at the same time DNB has seen deterioration in the credit quality of the loan portfolio, as evidenced by the increase in non-performing assets. However, these increases do not directly impact DNB's allowance for loan and lease losses as management monitors each of its criticized and classified loans and leases on an individual basis in accordance with ASC 310. Underlying asset values which support collateral dependent loans are
39
monitored on a periodic basis primarily through updated appraisals and reserves are established for any shortfalls in collateral values. In addition, despite the increase in non-performing assets during the last 2 years, charge-offs have been low, relative to the size of the loan and lease portfolio and to the level of non-performing assets. Net charge-offs were $434,000 in 2009 compared to $1.3 million and $395,000 in 2008 and 2007, respectively. The percentage of net charge-offs to total average loans and leases were .13%, .41% and 0.13% during the three years ending December 31, 2009. Management is not aware of any potential problem loans, which were accruing and current at December 31, 2009, where serious doubt exists as to the ability of the borrower to comply with the present repayment terms and that would result in a significant loss to DNB.
The increase in the allowance for loan loss ratio reflects management's estimate of the level of inherent losses in the portfolio, which continued to increase during 2009 due to a recessionary economy, rising unemployment, a weakened housing market and deterioration in income-producing properties. The increase in non-performing assets, driven by residential homebuilder loans, income producing commercial investor real estate loans and residential loans was a key determining dynamic in the assessment of inherent losses and, as a result, was an important factor in determining the allowance level.
We typically establish a general valuation allowance on classified loans which are not impaired. In establishing the general valuation allowance, we segregate these loans by category. The categories used by DNB include "doubtful," "substandard," "special mention," "watch list" and "pass." For commercial and construction loans, the determination of the category for each loan is based on periodic reviews of each loan by our lending and credit officers as well as an independent, third-party consultant. The reviews include a consideration of such factors as recent payment history, current financial data, cash flow, financial projections, collateral evaluations, guarantor or sponsorship financial strength and current economic and business conditions. Categories for mortgage and consumer loans are determined through a similar review. Classification of a loan within a category is based on identified weaknesses that increase the credit risk of loss on the loan. Each category carries a target rate for the allowance percentage to be assigned to the loans within that category. The allowance percentage, which is refined based on the specific circumstances of each classified loan, is determined based on inherent losses associated with each type of lending as determined through consideration of our loss history with each type of loan, trends in credit quality and collateral values, and an evaluation of current economic and business conditions.
We establish a general allowance on non-classified loans to recognize the inherent losses associated with lending activities, but which, unlike specific allowances, have not been allocated to particular problem loans. This general valuation allowance is determined by segregating the loans by loan category and assigning allowance percentages to each category. An evaluation of each category is made to determine the need to further segregate the loans within each category by type. For our residential mortgage and consumer loan portfolios, we identify similar characteristics throughout the portfolio including credit scores, loan-to-value ratios and collateral. For our commercial real estate and construction loan portfolios, a further analysis is made in which we segregated the loans by type based on the purpose of the loan and the collateral properties securing the loan. Various risk factors for each type of loan are considered, including the impact of general economic and business conditions, collateral value trends, credit quality trends and historical loss experience.
As of December 31, 2009, DNB had $13.7 million of non-performing assets, which included $9.2 million of non-performing loans and $4.5 million of OREO. Impaired loans, which are measured for impairment using the fair value of the collateral for collateral dependent loans, had a carrying amount of $9.0 million at December 31, 2009. Of this, $3.5 million had a valuation allowance of $531,000 and $5.5 million had no specific allowance as of December 31, 2009. For those impaired loans that management determined that no specific valuation allowance was necessary, management has reviewed the appraisal for each loan and determined that there is no shortfall in the collateral. In general, management reduces the amount of the appraisal by the estimated cost of acquisition and disposition of the underlying
40
collateral and compares that adjusted value with DNB's carrying value. For those impaired loans that have not been assigned a specific valuation allowance, DNB reserves at the rate of approximately 6% used for loans rated substandard under the general allowance. During the year ended December 31, 2009, we did not recognize any impairment charges related to loans. Impaired loans had a carrying amount of $1.2 million at December 31, 2008. The valuation allowance on impaired loans was $120,000 as of December 31, 2008. Loans are reviewed for impairment which is measured in accordance with FASB ASC 310-10-35. Impaired loans can either be secured or unsecured, not including large groups of smaller balance loans that are collectively evaluated. Impairment is measured by the difference between the loan amount and the present value of the future cash flow discounted at the loan's effective interest rate, or, alternatively the fair value of the collateral if the loan is collateral dependent. An impaired loan may not represent an expected loss.
We typically order new third-party appraisals or collateral valuations when a loan becomes impaired or is transferred to OREO. This is done within two weeks of a loan becoming impaired or a loan moving to OREO. It generally takes two to eight weeks to receive the appraisals, depending on the type of property being appraised. We recognize any provision or related charge-off within two weeks of receiving the appraisal after the appraisal has been reviewed by DNB. We generally order a new appraisal every twelve months, unless management determines more frequent appraisals are necessary. DNB had appraisals dated and reviewed within three months of December 31, 2009 for all impaired loans, with the exception of one loan participation we purchased from another bank. We typically request new appraisals from lead banks so that the receipt and review of the appraisal is in conformity with our own internal policy and procedures. However, DNB does not have any control over the timely delivery of the appraisal from a lead bank. During the later part of March 2010, we received a new appraisal from the lead bank for a $2.8 million residential land development loan. Management is in the process of reviewing the appraisal and discussing various aspects of the appraisal with the lead bank. We currently have $180,000 reserved against this loan in the general allowance. A preliminary review of the appraisal indicates that we may need to provide an additional $100,000-$150,000 for this loan during the first quarter of 2010. Based on this, the after tax impact could be between $80,000 and $120,000, however the final determination of the additional reserve will depend on a complete review and approval by management. We use updated valuations when time constraints do not permit a full appraisal process, to reflect rapidly changing market conditions. Because appraisals and updated valuations utilize historical data in reaching valuation conclusions, the appraised or updated value may or may not reflect the actual sales price that we will receive at the time of sale. Management uses the qualitative factor "Changes in the value of underlying collateral for collateral-dependent loans" to establish a reserve to mitigate this risk.
Real estate appraisals typically include up to three approaches to value: the sales comparison approach, the income approach (for income-producing property) and the cost approach. Not all appraisals utilize all three approaches to value. Depending on the nature of the collateral and market conditions, the appraiser may emphasize one approach over another in determining the fair value of collateral.
Appraisals may also contain different estimates of value based on the level of occupancy or future improvements. "As-is" valuations represent an estimate of value based on current market conditions with no changes to the collateral's use or condition. "As-stabilized" or "as-completed" valuations assume that the collateral is improved to a stated standard or achieves its highest and best use in terms of occupancy. "As-stabilized" valuations may be subject to a present value adjustment for market conditions or the schedule for improvements.
In connection with the valuation process, we will typically develop an exit strategy for the collateral by assessing overall market conditions, the current condition and use of the asset and its highest and best use. For most income-producing real estate, investors value most highly a stable income stream from the asset; consequently, we conduct a comparative evaluation to determine whether conducting a sale on an "as-is"
41
basis or on an "as-stabilized" basis is most likely to produce the highest net realizable value and compare these values with the costs incurred and the holding period necessary to achieve the "as stabilized" value.
Our estimates of the net realizable value of collateral include a deduction for the expected costs to sell the collateral or such other deductions as deemed appropriate. For most real estate collateral, we apply an eight to thirteen percent deduction to the value of real estate collateral to determine its expected costs to sell the asset. This estimate generally includes real estate commissions, one year of real estate taxes and miscellaneous repair and closing costs. If we receive a purchase offer that requires unbudgeted repairs, or if the expected holding period for the asset exceeds one year, then we include the additional real estate taxes and repairs or other holding costs in the expected costs to sell the collateral on a case-by-case basis.
Analysis of Allowance for Credit Losses
(Dollars in thousands)
| |
Year Ended December 31 |
||||||||||||||||
|---|---|---|---|---|---|---|---|---|---|---|---|---|---|---|---|---|---|
| |
2009 |
2008 |
2007 |
2006 |
2005 |
||||||||||||
Beginning balance |
$ | 4,586 | $ | 3,891 | $ | 4,226 | $ | 4,420 | $ | 4,436 | |||||||
Provisions |
1,325 | 2,018 | 60 | — | — | ||||||||||||
Loans charged off: |
|||||||||||||||||
Real estate |
(390 | ) | (132 | ) | — | — | — | ||||||||||
Commercial |
— | (254 | ) | (1 | ) | — | (31 | ) | |||||||||
Leases |
(61 | ) | (287 | ) | (458 | ) | (360 | ) | — | ||||||||
Consumer |
(45 | ) | (608 | ) | (27 | ) | (5 | ) | (15 | ) | |||||||
Deposit overdrafts |
(99 | ) | (120 | ) | — | — | — | ||||||||||
Total charged off |
(595 | ) | (1,401 | ) | (486 | ) | (365 | ) | (46 | ) | |||||||
Recoveries: |
|||||||||||||||||
Real estate |
31 | 8 | 7 | 8 | 6 | ||||||||||||
Commercial |
93 | — | 15 | 44 | 20 | ||||||||||||
Leases |
12 | 28 | 62 | 117 | — | ||||||||||||
Consumer |
1 | 7 | 7 | 2 | 4 | ||||||||||||
Deposit overdrafts |
24 | 35 | — | — | — | ||||||||||||
Total recoveries |
161 | 78 | 91 | 171 | 30 | ||||||||||||
Ending balance |
$ | 5,477 | $ | 4,586 | $ | 3,891 | $ | 4,226 | $ | 4,420 | |||||||
The following table sets forth the composition of DNB's allowance for credit losses at the dates indicated.
Composition of Allowance for Credit Losses
(Dollars in thousands)
| December 31 | |||||||||||||||||||||||||||||||
|---|---|---|---|---|---|---|---|---|---|---|---|---|---|---|---|---|---|---|---|---|---|---|---|---|---|---|---|---|---|---|---|
| |
2009 |
2008 |
2007 |
2006 |
2005 |
||||||||||||||||||||||||||
| |
Amount |
Percent of Loan Type to Total Loans |
Amount |
Percent of Loan Type to Total Loans |
Amount |
Percent of Loan Type to Total Loans |
Amount |
Percent of Loan Type to Total Loans |
Amount |
Percent of Loan Type to Total Loans |
|||||||||||||||||||||
Real estate |
$ | 2,552 | 59 | % | $ | 1,456 | 54 | % | $ | 1,320 | 51 | % | $ | 954 | 46 | % | $ | 927 | 46 | % | |||||||||||
Commercial* |
1,896 | 24 | 1,615 | 25 | 744 | 26 | 1,155 | 30 | 1,220 | 29 | |||||||||||||||||||||
Leases |
150 | 1 | 450 | 2 | 680 | 4 | 1,191 | 7 | 1,132 | 8 | |||||||||||||||||||||
Consumer |
473 | 16 | 407 | 19 | 821 | 18 | 347 | 17 | 305 | 17 | |||||||||||||||||||||
Unallocated |
406 | — | 658 | — | 326 | — | 579 | — | 836 | — | |||||||||||||||||||||
Total |
$ | 5,477 | 100 | % | $ | 4,586 | 100 | % | $ | 3,891 | 100 | % | $ | 4,226 | 100 | % | $ | 4,420 | 100 | % | |||||||||||
* Includes commercial construction
42
5. Certain Regulatory Matters
Recent market conditions have made it difficult or uneconomical to access the capital markets. As a result, at the end of 2008 and the beginning of 2009, the United States Congress, the Treasury, and the FDIC announced various programs designed to enhance market liquidity and bank capital. In response to the disruptions in the financial system during 2008 and 2009, management increased liquidity and pledgable assets by increasing the size of the investment securities portfolio from $124.1 million at December 31, 2008 to $204.1 million at December 31, 2009. On January 30, 2009, as part of the CPP administered by the United States Department of the Treasury, DNB Financial Corporation entered into a Letter Agreement and a Securities Purchase Agreement with the U.S. Treasury (see additional discussion in Participation in U.S. Treasury Capital Purchase Program, on page 6 of this Form 10-K).
Dividends payable to the Corporation by the Bank are subject to certain regulatory limitations. Under normal circumstances, the payment of dividends in any year without regulatory permission is limited to the net profits (as defined for regulatory purposes) for that year, plus the retained net profits for the preceding two calendar years. The sum of these items amounted to $1.8 million for the year ended December 31, 2009. During 2009, the Bank paid $488,000 to the Corporation. During 2010, the Bank will need to provide dividends to the Corporation in connection with the $11,750,000 of Fixed Rate Cumulative Perpetual Preferred Stock sold on January 30, 2009 as part of the CPP administered by the United States Department of the Treasury.
The FDIC has authority to assess and change federal deposit insurance assessment rates on assessable deposits of the Bank. For further information, please refer to the discussion of FDIC deposit insurance assessments under Part I, Item 1 ("Business"), section (c) ("Narrative Description of Business") — "Supervision and Regulation — Bank" under the heading "Deposit Insurance Assessments" on page 12 of this report. DNB's FDIC insurance expense was $1.1 million in 2009.
DNB was well capitalized at December 31, 2009 and met all regulatory capital requirements. Please refer to Footnote 17 for a table that summarizes required capital ratios and the corresponding regulatory capital positions of DNB and the Bank at December 31, 2009.
6. Off Balance Sheet Arrangements
In the normal course of business, various commitments and contingent liabilities are outstanding, such as guarantees and commitments to extend credit, borrow money or act in a fiduciary capacity, which are not reflected in the consolidated financial statements. Management does not anticipate any significant losses as a result of these commitments.
DNB had outstanding stand-by letters of credit totaling $2.8 million and unfunded loan and lines of credit commitments totaling $55.2 million at December 31, 2009.
These instruments involve, to varying degrees, elements of credit and interest rate risk in excess of the amount recognized on the balance sheet. The exposure to credit loss, in the event of non-performance by the party to the financial instrument for commitments to extend credit and stand-by letters of credit, is represented by the contractual amount. Management uses the same credit policies in making commitments and conditional obligations as it does for on-balance-sheet instruments.
Commitments to extend credit are agreements to lend to a customer as long as there is no violation of any condition established in the contract. Commitments generally have fixed expiration dates or other termination clauses and may require the payment of a fee. DNB evaluates each customer's creditworthiness on a case-by-case basis. The amount of collateral, if any, obtained upon the extension of credit, usually consists of real estate, but may include securities, property or other assets.
43
Stand-by letters of credit are conditional commitments issued by DNB to guarantee the performance or repayment of a financial obligation of a customer to a third party. Those guarantees are primarily issued to support public and private borrowing arrangements. The credit risks involved in issuing letters of credit are essentially the same as those involved in extending loan facilities to customers. DNB holds various forms of collateral to support these commitments.
DNB maintains borrowing arrangements with a correspondent bank and the FHLB of Pittsburgh, as well as access to the discount window at the Federal Reserve Bank of Philadelphia to meet short-term liquidity needs. Through these relationships, DNB has available credit of approximately $194.1 million. At December 31, 2009 DNB had borrowed $53.0 million against available lines of credit.
As of December 31, 2009, approximately $41.6 million of assets are held by DNB Advisors in a fiduciary, custody or agency capacity. These assets are not assets of DNB, and are not included in the consolidated financial statements.
The following table sets forth DNB's known contractual obligations as of December 31, 2009. The amounts presented below do not include interest.
| |
Payments Due by Period |
||||||||||||||||
|---|---|---|---|---|---|---|---|---|---|---|---|---|---|---|---|---|---|
| Contractual Obligations (Dollars in thousands) |
Total |
Less than 1 Year |
1-3 Years |
3-5 Years |
More than 5 Years |
||||||||||||
FHLB advances |
$ | 53,000 | $ | 28,000 | $ | 5,000 | $ | 10,000 | $ | 10,000 | |||||||
Repurchase agreements |
16,529 | 16,529 | — | — | — | ||||||||||||
Capital lease obligations |
642 | 21 | 50 | 66 | 505 | ||||||||||||
Operating lease obligations |
3,459 | 480 | 919 | 822 | 1,238 | ||||||||||||
Junior subordinated debentures |
9,279 | — | — | — | 9,279 | ||||||||||||
Total |
$ | 82,909 | $ | 45,030 | $ | 5,969 | $ | 10,888 | $ | 21,022 | |||||||
| |
Expiration by Period |
||||||||||||||||
|---|---|---|---|---|---|---|---|---|---|---|---|---|---|---|---|---|---|
| Off Balance Sheet Obligations (Dollars in thousands) |
Total |
Less than 1 Year |
1-3 Years |
3-5 Years |
More than 5 Years |
||||||||||||
Commitments to extend credit |
$ | 55,237 | $ | 14,915 | $ | 5,659 | $ | 8,127 | $ | 26,536 | |||||||
Letters of credit |
2,778 | 2,594 | 158 | — | 26 | ||||||||||||
Total |
$ | 58,015 | $ | 17,509 | $ | 5,817 | $ | 8,127 | $ | 26,562 | |||||||
During 2010 the Bank will need to provide dividends to the Corporation in connection with the $11,750,000 of Fixed Rate Cumulative Perpetual Preferred Stock sold on January 30, 2009 as part of the CPP administered by the United States Department of the Treasury. These payments are not included in the table above.
Item 7A. Quantitative and Qualitative Disclosures About Market Risk
To measure the impacts of longer-term asset and liability mismatches beyond two years, DNB utilizes Key Rate Duration and Economic Value of Equity ("EVE") models. The Key Rate Duration measures the differences in durations in various maturity buckets and indicates potential asset and liability mismatches. Because of balance sheet optionality, an EVE analysis is also used to dynamically model the present value of asset and liability cash flows, with rates ranging up or down 200 basis points. The economic value of equity is likely to be different if rates change. Results falling outside prescribed ranges require action by management. At December 31, 2009 and 2008, DNB's variance in the economic value of equity as a percentage of assets with an instantaneous and sustained parallel shift of 200 basis points was within its
44
negative 3% guideline, as shown in the table below. The change as a percentage of the present value of equity with a 200 basis point increase or decrease at December 31, 2008 was within DNB's negative 25% guideline. The change as a percentage of the present value of equity with a 200 basis point increase or decrease at December 31, 2009 was slightly above DNB's negative 25% guideline. Possible actions by management to reduce this variance in a +200 basis point scenario include the reduction of longer term assets, shorten the duration of the investment portfolio to reduce interest rate risk and price volatility, shorten the term of fixed rate loans or originate variable rate loans, increase longer term certificates and increased capital levels through increased earnings.
| (Dollars in thousands) |
December 31, 2009 |
December 31, 2008 |
|||||||||||||||||
|---|---|---|---|---|---|---|---|---|---|---|---|---|---|---|---|---|---|---|---|
| Change in rates |
Flat |
-200bp |
+200bp |
Flat |
-200bp |
+200bp |
|||||||||||||
EVE |
$ | 39,095 | $ | 43,264 | $ | 28,920 | $ | 29,196 | $ | 30,554 | $ | 25,831 | |||||||
Change |
4,169 | (10,175 | ) | 1,358 | (3,365 | ) | |||||||||||||
Change as a % of assets |
0.7 | % | (1.6 | )% | 0.3 | % | (0.6 | )% | |||||||||||
Change as a % of PV equity |
10.7 | % | (26.0 | )% | 4.7 | % | (11.5 | )% | |||||||||||
45
Item 8. Financial Statements and Supplementary Data
DNB FINANCIAL CORPORATION AND SUBSIDIARIES
Consolidated
Statements of Financial Condition
(Dollars in thousands, except share data)
| |
December 31 |
|||||||
|---|---|---|---|---|---|---|---|---|
| |
2009 |
2008 |
||||||
Assets |
||||||||
Cash and due from banks |
$ | 35,832 | $ | 9,780 | ||||
Federal funds sold |
8,000 | 38,338 | ||||||
Cash and cash equivalents |
43,832 | 48,118 | ||||||
AFS investment securities, at fair value (amortized cost of $156,268 in 2009 and $61,265 in 2008) |
155,862 | 60,666 | ||||||
HTM investment securities (fair value of $43,742 in 2009 and $58,525 in 2008) |
44,166 | 59,395 | ||||||
Restricted stock |
4,067 | 4,065 | ||||||
Total investment securities |
204,095 | 124,126 | ||||||
Loans and leases |
359,427 | 336,454 | ||||||
Allowance for credit losses |
(5,477 | ) | (4,586 | ) | ||||
Net loans and leases |
353,950 | 331,868 | ||||||
Office property and equipment, net |
8,775 | 9,665 | ||||||
Accrued interest receivable |
2,703 | 2,127 | ||||||
OREO & other repossessed property |
4,489 | 4,997 | ||||||
Bank owned life insurance |
7,887 | 7,580 | ||||||
Core deposit intangible |
210 | 259 | ||||||
Net deferred taxes |
3,866 | 3,496 | ||||||
Other assets |
4,441 | 1,211 | ||||||
Total assets |
$ | 634,248 | $ | 533,447 | ||||
Liabilities and Stockholders' Equity |
||||||||
Liabilities |
||||||||
Non-interest-bearing deposits |
$ | 46,236 | $ | 45,503 | ||||
Interest-bearing deposits: |
||||||||
NOW |
151,597 | 106,623 | ||||||
Money market |
102,427 | 81,742 | ||||||
Savings |
35,973 | 32,895 | ||||||
Time |
171,114 | 141,707 | ||||||
Total deposits |
507,347 | 408,470 | ||||||
FHLB advances |
53,000 | 60,000 | ||||||
Repurchase agreements |
16,529 | 20,185 | ||||||
Junior subordinated debentures |
9,279 | 9,279 | ||||||
Other borrowings |
642 | 659 | ||||||
Total borrowings |
79,450 | 90,123 | ||||||
Accrued interest payable |
743 | 1,154 | ||||||
Other liabilities |
3,832 | 3,642 | ||||||
Total liabilities |
591,372 | 503,389 | ||||||
Commitments and contingencies (Note 15) |
||||||||
Stockholders' Equity |
||||||||
Preferred stock, $10.00 par value; 1,000,000 shares authorized; $1,000 liquidation preference per share; 11,750 issued at December 31, 2009 and none issued at December 31, 2008 |
11,511 | — | ||||||
Common stock, $1.00 par value; 10,000,000 shares authorized; 2,861,618 and 2,863,024 issued, respectively |
2,875 | 2,867 | ||||||
Stock warrants |
151 | — | ||||||
Treasury stock, at cost; 243,593 and 256,420 shares, respectively |
(4,727 | ) | (4,811 | ) | ||||
Surplus |
35,179 | 35,082 | ||||||
Accumulated deficit |
(666 | ) | (1,062 | ) | ||||
Accumulated other comprehensive loss, net |
(1,447 | ) | (2,018 | ) | ||||
Total stockholders' equity |
42,876 | 30,058 | ||||||
Total liabilities and stockholders' equity |
$ | 634,248 | $ | 533,447 | ||||
See accompanying notes to consolidated financial statements.
46
DNB FINANCIAL CORPORATION AND SUBSIDIARIES
Consolidated
Statements of Operations
(Dollars in thousands, except per share data)
| |
Year Ended December 31 |
|||||||
|---|---|---|---|---|---|---|---|---|
| |
2009 |
2008 |
||||||
Interest and Dividend Income: |
||||||||
Interest and fees on loans and leases |
$ 19,343 | $ 19,725 | ||||||
Interest and dividends on investment securities: |
||||||||
Taxable |
6,347 | 7,895 | ||||||
Exempt from federal taxes |
189 | 174 | ||||||
Interest on cash and cash equivalents |
69 | 468 | ||||||
Total interest and dividend income |
25,948 | 28,262 | ||||||
Interest Expense: |
||||||||
Interest on NOW, money market and savings |
2,700 | 4,193 | ||||||
Interest on time deposits |
4,115 | 4,704 | ||||||
Interest on FHLB advances |
2,897 | 2,907 | ||||||
Interest on Federal Reserve borrowing |
12 | — | ||||||
Interest on repurchase agreements |
286 | 521 | ||||||
Interest on junior subordinated debentures |
530 | 628 | ||||||
Interest on other borrowings |
89 | 95 | ||||||
Total interest expense |
10,629 | 13,048 | ||||||
Net interest income |
15,319 | 15,214 | ||||||
Provision for credit losses |
1,325 | 2,018 | ||||||
Net interest income after provision for credit losses |
13,994 | 13,196 | ||||||
Non-interest Income: |
||||||||
Service charges |
1,447 | 1,589 | ||||||
Wealth management |
794 | 820 | ||||||
Increase in cash surrender value of BOLI |
307 | 259 | ||||||
Gain on sale of securities |
1,364 | 962 | ||||||
Loss on sale of OREO |
(98 | ) | — | |||||
Write-down of OREO |
(226 | ) | (70 | ) | ||||
Other fees |
919 | 848 | ||||||
Total non-interest income |
4,507 | 4,408 | ||||||
Non-interest Expense: |
||||||||
Salaries and employee benefits |
8,195 | 8,868 | ||||||
Furniture and equipment |
1,589 | 1,750 | ||||||
Occupancy |
1,624 | 1,588 | ||||||
Professional and consulting |
1,266 | 1,263 | ||||||
Marketing |
446 | 509 | ||||||
Printing and supplies |
167 | 239 | ||||||
FDIC insurance |
1,061 | 307 | ||||||
Other expenses |
2,242 | 2,207 | ||||||
Total non-interest expense |
16,590 | 16,731 | ||||||
Income before income taxes |
1,911 | 873 | ||||||
Income tax expense |
362 | 64 | ||||||
Net income |
$ 1,549 | $ 809 | ||||||
Preferred stock dividends and accretion of discount |
567 | — | ||||||
Net income available to common stockholders |
$ 982 | $ 809 | ||||||
Earnings per share: |
||||||||
Basic |
$ 0.38 | $ 0.31 | ||||||
Diluted |
$ 0.38 | $ 0.31 | ||||||
Cash dividends per share |
$ 0.23 | $ 0.46 | ||||||
Weighted average common shares outstanding: |
||||||||
Basic |
2,606,596 | 2,602,902 | ||||||
Diluted |
2,606,596 | 2,605,565 | ||||||
See accompanying notes to consolidated financial statements.
47
DNB FINANCIAL CORPORATION AND SUBSIDIARIES
Consolidated
Statements of Stockholders' Equity and Comprehensive Income
(Dollars in thousands)
| |
Preferred Stock |
Common Stock |
Stock Warrants |
Treasury Stock |
Surplus |
Accumulated Deficit |
Accumulated Other Compre- hensive Income (Loss) |
Total |
|||||||||||||||||||
|---|---|---|---|---|---|---|---|---|---|---|---|---|---|---|---|---|---|---|---|---|---|---|---|---|---|---|---|
Balance at January 1, 2008 |
$ | — | $ | 2,860 | $ | — | $ | (4,757 | ) | $ | 34,888 | $ | (771 | ) | $ | 415 | $ | 32,635 | |||||||||
Comprehensive Income: |
|||||||||||||||||||||||||||
Net income |
— | — | — | — | — | 809 | — | 809 | |||||||||||||||||||
Other comprehensive income, net of tax: |
|||||||||||||||||||||||||||
Unrealized losses on investments, net |
— | — | — | — | — | — | (1,322 | ) | (1,322 | ) | |||||||||||||||||
Unrealized actuarial losses — pension, net |
— | — | — | — | — | — | (1,111 | ) | (1,111 | ) | |||||||||||||||||
Total comprehensive income |
$ | (1,624 | ) | ||||||||||||||||||||||||
Restricted stock compensation expense |
— | 7 | — | — | 226 | — | — | 233 | |||||||||||||||||||
Cash dividends ($.46 per share) |
— | — | — | — | — | (1,180 | ) | — | (1,180 | ) | |||||||||||||||||
Purchase of treasury shares (19,719 shares) |
— | — | — | (284 | ) | — | — | — | (284 | ) | |||||||||||||||||
Sale of treasury shares to 401-K plan (13,158 shares) |
— | — | — | 230 | (54 | ) | — | — | 176 | ||||||||||||||||||
Deferred Compensation Plan |
— | — | — | — | — | 80 | — | 80 | |||||||||||||||||||
Stock compensation tax benefit |
— | — | — | — | 22 | — | — | 22 | |||||||||||||||||||
Balance at December 31, 2008 |
— | 2,867 | — | (4,811 | ) | 35,082 | (1,062 | ) | (2,018 | ) | 30,058 | ||||||||||||||||
Comprehensive Income: |
|||||||||||||||||||||||||||
Net income |
— | — | — | — | — | 1,549 | — | 1,549 | |||||||||||||||||||
Other comprehensive income, net of tax: |
|||||||||||||||||||||||||||
Unrealized gains on investments, net |
— | — | — | — | — | — | 186 | 186 | |||||||||||||||||||
Unrealized actuarial gains — pension, net |
— | — | — | — | — | — | 385 | 385 | |||||||||||||||||||
Total comprehensive income |
$ | 2,120 | |||||||||||||||||||||||||
Issuance of preferred stock, net of issuance cost |
11,483 | — | — | — | — | — | — | 11,483 | |||||||||||||||||||
Preferred stock discount accretion |
28 | — | — | — | — | (28 | ) | — | — | ||||||||||||||||||
Stock warrants issued |
— | — | 151 | — | — | — | — | 151 | |||||||||||||||||||
Restricted stock compensation expense |
— | 8 | — | — | 97 | — | — | 105 | |||||||||||||||||||
Cash dividends ($.23 per share) |
— | — | — | — | — | (586 | ) | — | (586 | ) | |||||||||||||||||
Cash dividends — Preferred |
— | — | — | — | — | (465 | ) | — | (465 | ) | |||||||||||||||||
Purchase of treasury shares (2,554 shares) |
— | — | — | (14 | ) | — | — | — | (14 | ) | |||||||||||||||||
Sale of treasury shares to 401-K plan (15,381 shares) |
— | — | — | 98 | — | — | — | 98 | |||||||||||||||||||
Preferred stock dividends accrued |
— | — | — | — | — | (74 | ) | — | (74 | ) | |||||||||||||||||
Balance at December 31, 2009 |
$ | 11,511 | $ | 2,875 | $ | 151 | $ | (4,727 | ) | $ | 35,179 | $ | (666 | ) | $ | (1,447 | ) | $ | 42,876 | ||||||||
See accompanying notes to consolidated financial statements.
48
DNB FINANCIAL CORPORATION AND SUBSIDIARIES
Consolidated Statements of Cash Flows
(Dollars in thousands)
| |
Year Ended December 31 |
||||||||
|---|---|---|---|---|---|---|---|---|---|
| |
2009 |
2008 |
|||||||
| Cash Flows From Operating Activities: | |||||||||
| Net income | $ | 1,549 | $ | 809 | |||||
| Adjustments to reconcile net income to net cash provided by operating activities: |
|||||||||
| Depreciation, amortization and accretion | 2,701 | 1,321 | |||||||
| Provision for credit losses | 1,325 | 2,018 | |||||||
| Unvested stock amortization | 105 | 233 | |||||||
| Net gain on sale of securities | (1,364 | ) | (962 | ) | |||||
| Net loss on sale and write downs of OREO and other repossessed property | 349 | — | |||||||
| (Increase) decrease in accrued interest receivable | (576 | ) | 483 | ||||||
| (Increase) decrease in other assets | (2,373 | ) | 321 | ||||||
| Earnings from investment in BOLI | (307 | ) | (259 | ) | |||||
| Decrease in interest payable | (411 | ) | (344 | ) | |||||
| Deferred tax benefit | (432 | ) | (233 | ) | |||||
| Decrease in other liabilities | (190 | ) | (617 | ) | |||||
| Net Cash Provided By Operating Activities | 376 | 2,770 | |||||||
| Cash Flows From Investing Activities: | |||||||||
| Activity in available-for-sale securities: | |||||||||
| Sales | 130,583 | 167,853 | |||||||
| Maturities, repayments and calls | 32,326 | 21,529 | |||||||
| Purchases | (257,915 | ) | (117,313 | ) | |||||
| Activity in held-to-maturity securities: | |||||||||
| Sales | 1,680 | — | |||||||
| Maturities, repayments and calls | 15,635 | 8,151 | |||||||
| Purchases | (2,023 | ) | (39,725 | ) | |||||
| Net increase in restricted stock | (2 | ) | (647 | ) | |||||
| Net increase in loans and leases | (24,012 | ) | (33,432 | ) | |||||
| Proceeds from sale of OREO and other repossessed property | 595 | — | |||||||
| Purchase of property and equipment | (400 | ) | (1,076 | ) | |||||
| Net Cash (Used) Provided By Investing Activities | (103,533 | ) | 5,340 | ||||||
| Cash Flows From Financing Activities: | |||||||||
| Net increase (decrease) in deposits | 98,877 | (4,450 | ) | ||||||
| Proceeds from FHLB advances | — | 20,820 | |||||||
| Repayment of FHLB advances | (7,000 | ) | (10,820 | ) | |||||
| Decrease in short term repurchase agreements | (3,656 | ) | (9,738 | ) | |||||
| Decrease in other borrowings | (17 | ) | (16 | ) | |||||
| Dividends paid | (1,051 | ) | (1,011 | ) | |||||
| Issuance of preferred stock and warrants | 11,634 | — | |||||||
| Sale (purchase) of treasury stock, net | 84 | (108 | ) | ||||||
| Net Cash Provided (Used) By Financing Activities | 98,871 | (5,323 | ) | ||||||
| Net Change in Cash and Cash Equivalents | (4,286 | ) | 2,787 | ||||||
| Cash and Cash Equivalents at Beginning of Year | 48,118 | 45,331 | |||||||
| Cash and Cash Equivalents at End of Year | $ | 43,832 | $ | 48,118 | |||||
| Supplemental Disclosure of Cash Flow Information: | |||||||||
| Cash paid during the period for: | |||||||||
| Interest | $ | 11,040 | $ | 13,392 | |||||
| Income taxes | 402 | 678 | |||||||
| Supplemental Disclosure of Non-cash Flow Information: | |||||||||
| Change in unrealized losses on investment securities | $ | 193 | $ | (2,003 | ) | ||||
| Change in deferred taxes due to change in unrealized losses on AFS securities | (66 | ) | 681 | ||||||
| Transfer securities from AFS to HTM, at fair value (amortized cost of $22,670) | — | 21,987 | |||||||
| Change in unsettled securities purchased included in other liabilities | — | (5,940 | ) | ||||||
| Transfers from loans and leases to real estate owned and other repossessed property | 383 | 4,997 | |||||||
See accompanying notes to consolidated financial statements.
49
Notes to Consolidated Financial Statements
(1) SUMMARY OF SIGNIFICANT ACCOUNTING POLICIES
DNB Financial Corporation (the "Corporation" or "DNB") through its wholly owned subsidiary, DNB First, National Association (the "Bank"), formerly Downingtown National Bank, has been serving individuals and small to medium sized businesses of Chester County, Pennsylvania since 1860. DNB Capital Trust I and II are special purpose Delaware business trusts, which are not consolidated (see additional discussion in Junior Subordinated Debentures — Footnote 9). The Bank is a locally managed commercial bank providing personal and commercial loans and deposit products, in addition to investment and trust services from thirteen community offices. The Bank encounters vigorous competition for market share from commercial banks, thrift institutions, credit unions and other financial intermediaries.
The consolidated financial statements of DNB and its subsidiary, the Bank, which together are managed as a single operating segment, are prepared in accordance with U.S. generally accepted accounting principles applicable to the banking industry. In preparing the financial statements, management is required to make estimates and assumptions that affect the reported amounts of assets and liabilities and affect revenues and expenses for the period. Actual results could differ significantly from those estimates.
In preparing the consolidated financial statements, management is required to make estimates and assumptions that affect the reported amounts of assets and liabilities, the disclosure of contingent assets and liabilities at the date of the balance sheets, and the reported amounts of revenues and expenses during the reporting period. Actual results could differ from these estimates. Although our current estimates contemplate current conditions and how we expect them to change in the future, it is reasonably possible that in 2010, actual conditions could be worse than anticipated in those estimates, which could materially affect our results of operations and financial condition. Amounts subject to significant estimates are items such as the allowance for loan and lease losses and lending related commitments, the fair value of repossessed assets, pension and post-retirement obligations, the fair value of financial instruments and other-than-temporary impairments. Among other effects, such changes could result in future impairments of investment securities, and establishment of allowances for loan and lease losses and lending related commitments as well as increased benefit plans' expenses.
The more significant accounting policies are summarized below. Prior period amounts not affecting net income are reclassified when necessary to conform to current year classifications. Included in 2008 net income is an increase in reported earnings of approximately $51,000 reflecting the immaterial correction of errors arising from 2007.
Principles of Consolidation The accompanying consolidated financial statements include the accounts of the Corporation and its wholly owned subsidiary, the Bank. All significant inter-company transactions have been eliminated.
Cash and Due From Banks For purposes of the consolidated statement of cash flows, cash and due from banks, and federal funds sold are considered to be cash equivalents. Generally, federal funds are sold for one-day periods. DNB is required to maintain certain daily reserve balances in accordance with Federal Reserve Board requirements. The average reserve balance maintained at the Federal Reserve for the years ended December 31, 2009 and 2008 was approximately $200,000 and $250,000 respectively.
Investment Securities Investment securities are classified and accounted for as follows:
Held-To-Maturity ("HTM") includes debt securities that DNB has the positive intent and ability to hold to maturity. Debt securities are reported at cost, adjusted for amortization of premiums and accretion of discounts.
50
Trading Account ("TA") includes securities that are generally held for a short term in anticipation of market gains. Such securities would be carried at fair value with realized and unrealized gains and losses on trading account securities included in the statement of operations. DNB did not have any securities classified as TA during 2009 or 2008.
Available-For-Sale ("AFS") includes debt and equity securities not classified as HTM or TA securities. Securities classified as AFS are securities that DNB intends to hold for an indefinite period of time, but not necessarily to maturity. Such securities are reported at fair value, with unrealized holding gains and losses excluded from earnings and reported, net of tax (if applicable), as a separate component of stockholders' equity. Realized gains and losses on the sale of AFS securities are computed on the basis of specific identification of the adjusted cost of each security. Amortization of premiums and accretion of discounts for all types of securities are computed using a method approximating a level-yield basis.
Other Than Temporary Impairment Analysis Securities are evaluated on a quarterly basis, and more frequently when market conditions warrant such an evaluation, to determine whether declines in their value are other-than-temporary. To determine whether a loss in value is other-than-temporary, management utilizes criteria such as the reasons underlying the decline, the magnitude and duration of the decline, and whether or not management intends to sell or expects that it is more likely than not that it will be required to sell the security prior to an anticipated recovery of the fair value. Once a decline in value for a debt security is determined to be other-than-temporary, the other-than-temporary impairment is separated into (a) the amount of the total other-than-temporary impairment related to a decrease in cash flows expected to be collected from the debt security (the credit loss) and (b) the amount of the total other-than-temporary impairment related to the credit loss is reflected in operations. The amount of the total other-than-temporary impairment related to all other factors is recognized in other comprehensive income. DNB recorded no impairment charges in 2009 or 2008.
Restricted Stock includes investments in Federal Home Loan Bank of Pittsburgh (FHLBP), Federal Reserve Bank (FRB) and Atlantic Central Bankers Bank (ACBB) stock which are carried at cost and are redeemable at par with certain restrictions. Investments in these stocks are necessary to participate in FHLB, FRB and ACBB programs. On December 23, 2008, the FHLBP announced that it will indefinitely suspend dividend payments and repurchases of excess capital stock, due to low short-term interest rates, increased costs of maintaining liquidity and constrained access to debt markets at attractive rates. Management's evaluation and determination of whether these investments are impaired is based on their assessment of the ultimate recoverability of their cost rather than by recognizing temporary declines in value. The determination of whether a decline affects the ultimate recoverability of an investment's cost is influenced by criteria such as (1) the significance of the decline in net assets of the FHLBP as compared to the capital stock amount for the FHLBP and the length of time the decline has persisted, (2) commitments by the FHLBP to make payments required by law or regulation and the level of such payments in relation to the operating performance of the FHLBP, and (3) the impact of legislative and regulatory changes on institutions and, accordingly, on the customer base of the FHLBP.
Loans and Leases Loans and leases are stated net of unearned discounts, unamortized net loan origination fees and the allowance for credit losses. Interest income is recognized on an accrual basis. The accrual of interest on loans and leases is generally discontinued when loans become 90 days past due or earlier when, in management's judgment, it is determined that a reasonable doubt exists as to its collectibility. When a loan or lease is placed on non-accrual, interest accruals cease and uncollected accrued interest is reversed and charged against current income. Additional interest payments on such loans or leases are generally applied to principal or recognized to income on a cash basis. A non-accrual loan or lease may be restored to accrual status when management expects to collect all contractual principal and interest due and the borrower has demonstrated a sustained period of repayment performance in accordance with the contractual terms.
51
Deferred Loan Fees and Costs Loan origination and commitment fees and related direct-loan origination costs of completed loans are deferred and accreted to income as a yield adjustment over the life of the loan using the level-yield method. The accretion to income is discontinued when a loan is placed on non-accrual status. When a loan is paid off, any unamortized net deferred fee balance is credited to income. When a loan is sold, any unamortized net deferred fee balance is considered in the calculation of gain or loss.
Allowance for Credit Losses The allowance for credit losses is an estimate of the credit loss risk in our loan and lease portfolio. The allowance is based on two basic principles of accounting; 1) requires that losses be accrued when it is probable that a loss has occurred at the balance sheet date and such losses can be reasonable estimated; and 2) requires that losses be accrued on impaired loans based on the differences between the value of collateral, present value of future cash flows or values that are observable in the secondary market and the loan balance. DNB's credit loss allowance policies involve significant judgments and assumptions by management which may have a material impact on the carrying value of net loans and, potentially, on the net income recognized by DNB from period to period. The allowance for credit losses is based on management's ongoing evaluation of the loan and lease portfolio and reflects an amount considered by management to be its best estimate of the amount necessary to absorb known and inherent losses in the portfolio. Management considers a variety of factors when establishing the allowance, such as the impact of current economic conditions, diversification of the portfolios, delinquency statistics, results of loan review and related classifications, and historic loss rates. In addition, certain individual loans which management has identified as problematic are specifically provided for, based upon an evaluation of the borrower's perceived ability to pay, the estimated adequacy of the underlying collateral and other relevant factors. In addition, regulatory authorities, as an integral part of their examinations, periodically review the allowance for credit losses. They may require additions to the allowance based upon their judgments about information available to them at the time of examination. Although provisions are established and segmented by type of loan, based upon management's assessment of their differing inherent loss characteristics, the entire allowance for credit losses is available to absorb losses in any category.
Management uses significant estimates to determine the allowance for credit losses. Because the allowance for credit losses is dependent, to a great extent, on conditions that may be beyond DNB's control, management's estimate of the amount necessary to absorb credit losses and actual credit losses could differ. DNB's current judgment is that the valuation of the allowance for credit losses is appropriate at December 31, 2009.
Other Real Estate Owned & Other Repossessed Property Other real estate owned ("OREO") and other repossessed property consists of properties acquired as a result of, or in-lieu-of, foreclosure as well as other repossessed assets. Properties classified as OREO are initially recorded at fair value less cost to sell at the date of foreclosure, establishing a new cost basis. Subsequent to foreclosure, valuations are periodically performed by management and the assets are carried at the lower of carrying value or fair value, less estimated costs to sell. Costs relating to the development or improvement of the properties are capitalized and costs relating to holding the properties are charged to expense. DNB had OREO and other repossessed property totaling $4.5 million at December 31, 2009 and $5.0 million at December 31, 2008.
Office Properties and Equipment Office properties and equipment are recorded at cost. Depreciation is computed using the straight-line method over the expected useful lives of the assets. The costs of maintenance and repairs are expensed as they are incurred; renewals and betterments are capitalized. All long-lived assets are reviewed for impairment, based on the fair value of the asset. In addition, long-lived assets to be disposed of are generally reported at the lower of carrying amount or fair value, less cost to sell. Gains or losses on disposition of premises and equipment are reflected in operations.
Other Assets Financing costs related to the issuance of junior subordinated debentures are being amortized over the life of the debentures and are included in other assets.
52
Income Taxes DNB accounts for Income Taxes in accordance with the income tax accounting guidance set forth in FASB ASC Topic 740, Income Taxes.
The income tax accounting guidance results in two components of income tax expense: current and deferred. Current income tax expense reflects taxes to be paid or refunded for the current period by applying the provisions of the enacted tax law to the taxable income or excess of deductions over revenues. DNB determines deferred income taxes using the liability (or balance sheet) method. Under this method, the net deferred tax asset or liability is based on the tax effects of the differences between the book and tax bases of assets and liabilities, and enacted changes in tax rates and laws are recognized in the period in which they occur.
Deferred income tax expense results from changes in deferred tax assets and liabilities between periods. Deferred tax assets are recognized if it is more likely than not, based on the technical merits, that the tax position will be realized or sustained upon examination. The term more likely than not means a likelihood of more than 50 percent; the terms examined and upon examination also include resolution of the related appeals or litigation processes, if any. A tax position that meets the more-likely-than-not recognition threshold is initially and subsequently measured as the largest amount of tax benefit that has a greater than 50 percent likelihood of being realized upon settlement with a taxing authority that has full knowledge of all relevant information. The determination of whether or not a tax position has met the more-likely-than-not recognition threshold considers the facts, circumstances, and information available at the reporting date and is subject to management's judgment. Deferred tax assets are reduced by a valuation allowance if, based on the weight of evidence available, it is more likely than not that some portion or all of a deferred tax asset will not be realized.
DNB recognizes interest and penalties on income taxes as a component of income tax expense. The Company is no longer subject to examinations by taxing authorities for the years before January 1, 2006.
Pension Plan The Bank maintains a noncontributory defined benefit pension plan covering substantially all employees over the age of 21 with one year of service. Plan benefits are based on years of service and the employee's monthly average compensation for the highest five consecutive years of their last ten years of service (see Note 14 — Benefit Plans).
Stock Option Plan Stock compensation accounting guidance (FASB ASC718, Compensation — Stock Compensation) requires that the compensation cost relating to share-based payment transactions be recognized in financial statements. That cost will be measured based on the grant date fair value of the equity or liability instruments issued. The stock compensation accounting guidance covers a wide range of share-based compensation arrangements including stock options, restricted share plans, performance-based awards, share appreciation rights, and employee share purchase plans.
The stock compensation accounting guidance requires that compensation cost for all stock awards be calculated and recognized over the employees' service period, generally defined as the vesting period. For awards with graded-vesting, compensation cost is recognized on a straight-line basis over the requisite service period for the entire award. A Black-Sholes model is used to estimate the fair value of stock options, while the market price of the Corporation's common stock at the date of grant is used for restricted stock awards. No new options were granted in 2009 or 2008; therefore, DNB did not recognize any compensation cost related to options in 2009 or 2008.
Preferred Stock Preferred stock ranks senior to common stock with respect to dividends and has preference in the event of liquidation. The shares of fixed rate cumulative perpetual preferred stock, Series 2008A ("Series 2008A Preferred Stock") issued to the United States Treasury ("U.S. Treasury") under the TARP Capital Purchase Program ("CPP") of the Emergency Economics Stabilization Act of 2008 and the warrants issued under the CPP are accounted for as permanent equity on the Consolidated Statements of Financial Condition. The proceeds received were allocated between the Series 2008A Preferred Stock and the warrants based upon their relative fair values as of the date of issuance which
53
resulted in the recording of a discount of the Series 2008A Preferred Stock upon issuance that reflects the value allocated to the warrants. The discount is accreted by a charge to accumulate deficit on a straight-line basis over the expected life of the preferred stock of five years.
The Series 2008a Preferred Stock pays cumulative dividends at a rate of five percent per annum until the fifth anniversary of the date of issuance, and thereafter at a rate of nine percent per annum. Dividends are payable quarterly in arrears and accrued as earned over the period the Series 2008A Preferred Stock is outstanding. Preferred dividends paid (declared and accrued) and the related accretion is deducted from net income for computing income available to common stockholders and earnings per share computations.
Earnings Per Share (EPS) Basic EPS is computed based on the weighted average number of common shares outstanding during the year. Diluted EPS reflects the potential dilution that could occur from unvested stock awards and the exercise of stock options and warrants computed using the treasury stock method. Stock options and awards for which the exercise price exceeds the average market price over the period have an anti-dilutive effect on EPS and, accordingly, are excluded from the EPS calculation. Treasury shares are not deemed outstanding for earnings per share calculations.
Comprehensive Income Comprehensive income consists of net income and other comprehensive income. Other comprehensive income includes unrealized gains on securities available for sale, and unrealized losses related to factors other than credit on debt securities, and changes in the funded status of the pension plan which are also recognized as separate components of equity.
Treasury Stock Common stock shares repurchased are recorded as treasury stock at cost.
Trust Assets Assets held by DNB Advisors in fiduciary or agency capacities are not included in the consolidated financial statements since such items are not assets of DNB. Operating income and expenses of DNB Advisors are included in the consolidated statements of operations and are recorded on an accrual basis.
Subsequent Events Management has considered subsequent events in preparing the December 31, 2009 Consolidated Financial Statements.
Recent Accounting Pronouncements
In June 2009, the Financial Accounting Standards Board ("FASB") issued an update to Accounting Standard Codification 105-10, "Generally Accepted Accounting Principles". This standard establishes the FASB Accounting Standard Codification ("Codification" or "ASC") as the source of authoritative U.S. GAAP recognized by the FASB for nongovernmental entities. The Codification is effective for interim and annual periods ending after September 15, 2009. The Codification is a reorganization of existing U.S. GAAP and does not change existing U.S. GAAP. The Corporation adopted this standard during the third quarter of 2009. The adoption had no impact on the Corporation's consolidated financial statements.
In June 2009, the FASB issued new guidance impacting FASB ASC 860, Transfers and Servicing ASC Topic 860, "Transfers and Servicing." New authoritative accounting guidance under ASC Topic 860, "Transfers and Servicing," amends prior accounting guidance as follows: (i) eliminates the concept of a qualified special purpose entity ("QSPE"); (ii) requires a transferor to consider all arrangements made contemporaneously with or in anticipation of a transfer when determining whether derecognition is appropriate; (iii) clarifies the requirement that a transferred financial asset be legally isolated from the transferor and any of its consolidated affiliates; (iv) introduces the concept of a participating interest which is applied to transfers of portions of financial assets to determine derecognition eligibility; (v) modifies the conditions required for a transfer of financial assets to qualify as a sale; (vi) changes the initial measurement guidance for asset transfers that qualify as sales: and (vii) stipulates that guaranteed mortgage securitizations ("GMS") that fail to meet the conditions for sale accounting will result in the continued classification of the securitized mortgage loans as loans and will not enable a transferor to
54
recognize a servicing asset or liability. The new authoritative accounting guidance under ASC Topic 860 will be effective January 1, 2010 and will have no impact on the Corporation's consolidated financial statements.
In August 2009, the FASB issued Accounting Standards Update ("ASU") 2009-05, "Measuring Liabilities at Fair Value", which updates ASC 820-10, "Fair Value Measurements and Disclosures". The updated guidance clarifies that the fair value of a liability can be measured in relation to the quoted price of the liability when it trades as an asset in an active market, without adjusting the price for restrictions that prevent the sale of the liability. This guidance is effective beginning October 1, 2009. The adoption of this guidance did not have an impact on the Corporation's consolidated financial statements.
In April 2009, the FASB issued new guidance impacting ASC 320-10, "Investments — Debt and Equity Securities." The guidance amends the other-than-temporary impairment ("OTTI") guidance for debt securities. If the fair value of a debt security is less than its amortized cost basis at the measurement date, the updated guidance requires the Corporation to determine whether it has the intent to sell the debt security or whether it is more likely than not it will be required to sell the debt security before the recovery of its amortized cost basis. If either condition is met, an entity must recognize full impairment. For all other debt securities that are considered other-than-temporarily impaired and do not meet either condition, the guidance requires that the credit loss portion of impairment be recognized in earnings and the temporary impairment related to all other factors be recorded in other comprehensive income. In addition, the guidance requires additional disclosures regarding impairments on debt and equity securities. The adoption of this guidance did not have an impact on the Corporation's consolidated financial statements.
In April 2009, the FASB issued new guidance impacting ASC 820-10, "Fair Value Measurements and Disclosures" to provide guidance on determining fair value when the volume and level of activity for the asset or liability have significantly decreased and identifying transactions that are not orderly. This issuance provides guidance on estimating fair value when there has been a significant decrease in the volume and level of activity for the asset or liability and for identifying transactions that may not be orderly. The guidance requires entities to disclose the inputs and valuation techniques used to measure fair value and to discuss changes in valuation techniques and related inputs, if any, in both interim and annual periods. The Corporation adopted this standard on June 30, 2009. The adoption had no impact on the Corporation's consolidated financial statements.
In December 2009, the FASB issued FASB ASC 810, Consolidations. This accounting guidance was originally issued in June 2009 and is now included in ASC 810. The guidance amends the consolidation guidance applicable for variable interest entities. The guidance is effective for financial statements issued for fiscal years and interim periods beginning after November 15, 2009, and early adoption is prohibited. The adoption will have no impact on the Corporation's consolidated financial statements.
55
(2) INVESTMENT SECURITIES
The amortized cost and estimated fair values of investment securities, as of the dates indicated, are summarized as follows:
| |
December 31, 2009 |
||||||||||||
|---|---|---|---|---|---|---|---|---|---|---|---|---|---|
| (Dollars in thousands) |
Amortized Cost |
Unrealized Gains |
Unrealized Losses |
Estimated Fair Value |
|||||||||
| Held To Maturity | |||||||||||||
| Government Sponsored Entities (GSE) mortgage-backed securities | $ | 12,809 | $ | 348 | $ | — | $ | 13,157 | |||||
| Collateralized mortgage obligations (GSE) | 3,667 | 29 | (24 | ) | 3,672 | ||||||||
| State and municipal tax-exempt bonds | 5,454 | 105 | — | 5,559 | |||||||||
| State and municipal taxable bonds | 22,236 | 294 | (1,176 | ) | 21,354 | ||||||||
| Total | $ | 44,166 | $ | 776 | $ | (1,200 | ) | $ | 43,742 | ||||
| Available For Sale | |||||||||||||
| US Government agency obligations | $ | 62,168 | $ | 64 | $ | (172 | ) | $ | 62,060 | ||||
| Government Sponsored Entities (GSE) mortgage-backed securities | 59,593 | 432 | (181 | ) | 59,844 | ||||||||
| Collateralized mortgage obligations (GSE) | 11,723 | 64 | (37 | ) | 11,750 | ||||||||
| Corporate bonds | 22,752 | 54 | (611 | ) | 22,195 | ||||||||
| Equity securities | 32 | — | (19 | ) | 13 | ||||||||
| Total | $ | 156,268 | $ | 614 | $ | (1,020 | ) | $ | 155,862 | ||||
| |
December 31, 2008 |
||||||||||||
|---|---|---|---|---|---|---|---|---|---|---|---|---|---|
| (Dollars in thousands) |
Amortized Cost |
Unrealized Gains |
Unrealized Losses |
Estimated Fair Value |
|||||||||
| Held To Maturity | |||||||||||||
| Government Sponsored Entities (GSE) mortgage-backed securities | $ | 27,884 | $ | 447 | $ | (2 | ) | $ | 28,329 | ||||
| Collateralized mortgage obligations (GSE) | 4,962 | 1 | (111 | ) | 4,852 | ||||||||
| State and municipal tax-exempt bonds | 4,513 | 50 | (1 | ) | 4,562 | ||||||||
| State and municipal taxable bonds | 22,036 | 78 | (1,332 | ) | 20,782 | ||||||||
| Total | $ | 59,395 | $ | 576 | $ | (1,446 | ) | $ | 58,525 | ||||
| Available For Sale | |||||||||||||
| US Government agency obligations | $ | 6,075 | $ | 51 | $ | — | $ | 6,126 | |||||
| Government Sponsored Entities (GSE) mortgage-backed securities | 32,063 | 410 | (94 | ) | 32,379 | ||||||||
| Collateralized mortgage obligations (GSE) | 5,011 | 94 | — | 5,105 | |||||||||
| Corporate bonds | 18,084 | 300 | (1,349 | ) | 17,035 | ||||||||
| Equity securities | 32 | — | (11 | ) | 21 | ||||||||
| Total | $ | 61,265 | $ | 855 | $ | (1,454 | ) | $ | 60,666 | ||||
Included in unrealized losses are market losses on securities that have been in a continuous unrealized loss position for twelve months or more and those securities that have been in a continuous unrealized loss position for less than twelve months. The table below details the aggregate unrealized losses and aggregate
56
fair value of the underlying securities whose fair values are below their amortized cost at December 31, 2009 and 2008.
| |
December 31, 2009 |
||||||||||||||||||
|---|---|---|---|---|---|---|---|---|---|---|---|---|---|---|---|---|---|---|---|
| (Dollars in thousands) |
Total Fair Value |
Total Unrealized Loss |
Fair value Impaired Less Than 12 Months |
Unrealized Loss Less Than 12 Months |
Fair value Impaired More Than 12 Months |
Unrealized Loss More Than 12 Months |
|||||||||||||
| Held To Maturity | |||||||||||||||||||
| Collateralized mortgage obligations (GSE) | $ | 2,202 | $ | (24 | ) | $ | 1,123 | $ | (2 | ) | $ | 1,079 | $ | (22 | ) | ||||
| State and municipal taxable | 12,679 | (1,176 | ) | 6,546 | (169 | ) | 6,133 | (1,007 | ) | ||||||||||
| Total | $ | 14,881 | $ | (1,200 | ) | $ | 7,669 | $ | (171 | ) | $ | 7,212 | $ | (1,029 | ) | ||||
Available For Sale |
|||||||||||||||||||
| Corporate bonds | $ | 12,239 | $ | (611 | ) | $ | 5,877 | $ | (308 | ) | $ | 6,362 | $ | (303 | ) | ||||
| US Government agency obligations | 29,863 | (172 | ) | 29,863 | (172 | ) | — | — | |||||||||||
| Collateralized mortgage obligations (GSE) | 7,134 | (37 | ) | 7,134 | (37 | ) | — | — | |||||||||||
| GSE mortgage-backed securities | 11,896 | (181 | ) | 11,896 | (181 | ) | — | — | |||||||||||
| Equity securities | 13 | (19 | ) | — | — | 13 | (19 | ) | |||||||||||
| Total | $ | 61,145 | $ | (1,020 | ) | $ | 54,770 | $ | (698 | ) | $ | 6,375 | $ | (322 | ) | ||||
| |
December 31, 2008 |
||||||||||||||||||
|---|---|---|---|---|---|---|---|---|---|---|---|---|---|---|---|---|---|---|---|
| (Dollars in thousands) |
Total Fair Value |
Total Unrealized Loss |
Fair value Impaired Less Than 12 Months |
Unrealized Loss Less Than 12 Months |
Fair value Impaired More Than 12 Months |
Unrealized Loss More Than 12 Months |
|||||||||||||
| Held To Maturity | |||||||||||||||||||
| Collateralized mortgage obligations (GSE) | $ | 4,246 | $ | (111 | ) | $ | — | $ | — | $ | 4,246 | $ | (111 | ) | |||||
| State and municipal tax-exempt | 527 | (1 | ) | 527 | (1 | ) | — | — | |||||||||||
| State and municipal taxable | 13,018 | (1,332 | ) | 13,018 | (1,332 | ) | — | — | |||||||||||
| GSE mortgage-backed securities | 118 | (2 | ) | 118 | (2 | ) | — | — | |||||||||||
| Total | $ | 17,909 | $ | (1,446 | ) | $ | 13,663 | $ | (1,335 | ) | $ | 4,246 | $ | (111 | ) | ||||
Available For Sale |
|||||||||||||||||||
| Corporate bonds | $ | 12,329 | $ | (1,349 | ) | $ | 12,329 | $ | (1,349 | ) | $ | — | $ | — | |||||
| GSE mortgage-backed securities | 7,161 | (94 | ) | 5,482 | (61 | ) | 1,679 | (33 | ) | ||||||||||
| Equity securities | 21 | (11 | ) | — | — | 21 | (11 | ) | |||||||||||
| Total | $ | 19,511 | $ | (1,454 | ) | $ | 17,811 | $ | (1,410 | ) | $ | 1,700 | $ | (44 | ) | ||||
As of December 31, 2009, there were 4 mortgage backed securities, 8 municipal obligations, 10 corporate bonds, 11 agency notes, 7 collateralized mortgage obligations and 7 equity securities which were in an unrealized loss position. DNB does not intend to sell these securities and management of DNB does not expect to be required to sell any of these securities prior to a recovery of its cost basis. Management does not believe any individual unrealized loss as of December 31, 2009 represents an other-than-temporary impairment. DNB had $6.4 million in AFS securities and $7.2 million in HTM securities, which have had fair values below amortized cost for more than twelve continuous months at December 31, 2009. The total unrealized loss of these securities was $322,000 and $1.0 million,
57
respectively. DNB reviews its investment portfolio on a quarterly basis judging each investment for other-than temporary impairment (OTTI). The OTTI analysis focuses on duration and amount a security is below book. As of December 31, 2009, the following securities were reviewed:
U.S. Government agency obligations. The unrealized losses on the eleven investments in U.S Government agency portfolio were caused by interest rate increases and are all impaired for less than twelve months. The contractual terms of these investments do not permit the issuer to settle the securities at a price less than the amortized cost basis of the investments. Because DNB does not intend to sell the investments and it is not more likely than not that DNB will be required to sell the investments before recovery of their amortized cost basis, which may be maturity, DNB does not consider these investments to be other-than-temporarily impaired at December 31, 2009.
GSE Collateralized mortgage obligations. The unrealized losses on the seven investments in Collateralized mortgage obligations portfolio were caused by interest rate increases, of which five are impaired for less than twelve months and two are impaired for more than twelve months. The contractual terms of those investments do not permit the issuer to settle these securities at a price less than the amortized cost basis of the investments. Because DNB does not intend to sell the investments and it is not more likely than not that DNB will be required to sell the investments before recovery of their amortized cost basis, which may be maturity, DNB does not consider these investments to be other-than-temporarily impaired at December 31, 2009.
Corporate bonds. The unrealized losses on the ten investments in the Corporate Bonds portfolio were caused by three factors: an increase in rates since the bonds were purchased, a decline in certain bonds ratings since the bonds were purchased and a widening of corporate spreads over treasury equivalents since the bonds were purchased. At December 31, 2009, all of the bonds were rated as investment grade by one or more of the major rating agencies. Five are impaired for less than twelve months and five are impaired for more than twelve months. The contractual terms of those investments do not permit the issuer to settle the securities at a price less than the amortized cost basis of the investments. Because DNB does not intend to sell the investments and it is not more likely than not that DNB will be required to sell the investments before recovery of their amortized cost basis, which may be maturity, DNB does not consider these investments to be other-than-temporarily impaired at December 31, 2009.
GSE mortgage-backed securities. The unrealized losses on the four investments in the GSE mortgage-backed securities portfolio were caused by interest rate increases and are all impaired for less than twelve months. The contractual terms of those investments do not permit the issuer to settle the securities at a price less than the amortized cost basis of the investments. Because DNB does not intend to sell the investments and it is not more likely than not that DNB will be required to sell the investments before recovery of their amortized cost basis, which may be maturity, DNB does not consider these investments to be other-than-temporarily impaired at December 31, 2009.
Equity securities. DNB's investment in six marketable equity securities consist primarily of investments in common stock of community banks in Pennsylvania. The unrealized losses on the six investments in the Equity securities portfolio were all impaired for more than twelve months. The severity and duration of the impairment are driven by higher collateral losses, wider credit spreads, and changes in interest rates within the financial services sector. DNB evaluated the prospects of all issuers in relation to the severity and duration of the impairment. Based on this analysis and an evaluation of DNB's ability and intent to hold these investments for a reasonable period of time sufficient for each security to increase to DNB's cost, DNB does not intend to sell these investments and it is not more likely than not that DNB will be required to sell the investments before recovery of their cost, DNB does not consider these investments to be other-than-temporarily impaired at December 31, 2009.
58
State and municipal taxable securities. The unrealized losses on the eight investments in State and municipal taxable securities portfolio were caused by the fact that some of the insurance companies that were insuring these bonds, were downgraded, and consequently, the overall ratings on the bonds declined (however the underlying ratings on these bonds have not declined). In addition, the Federal government passed legislation promoting Build America Bonds in an effort to stimulate the economy. Build America Bonds are more attractive to potential buyers than bonds issued in prior years in our portfolio, because Build America Bonds are taxable municipal bonds that carry special tax credits and federal subsidies for either the bond issuer or the bondholder. Build America Bonds were created under the American Recovery and Reinvestment Act signed into law on February 17, 2009. There were no changes in the underlying credit of these bonds. Four are impaired for less than twelve months and four are impaired for more than twelve months. The contractual terms of those investments do not permit the issuer to settle the securities at a price less than the amortized cost basis of the investments. Because DNB does not intend to sell the investments and it is not more likely than not that DNB will be required to sell the investments before recovery of their amortized cost basis, which may be maturity, DNB does not consider these investments to be other-than-temporarily impaired at December 31, 2009. A further description of the four securities impaired for more that twelve months is as follows:
DNB holds a zero coupon taxable limited general obligation municipal bonds backed by property taxes. Bonds are insured by AGM. Bonds are rated Aa3 by Moody's. The issuer, Cook County School District #89, has never deferred or defaulted on interest payments on this issue, so credit risk is acceptable. Taxable municipal bonds trade frequently, so liquidity risk is acceptable. The security matures on 12/1/15 with a modified duration of 5.75 years, so interest rate risk is acceptable. With no embedded options, earnings potential is good. This bond currently has a loss of $116,734 which represents 7.7% of book value.
DNB holds a fixed rate taxable unlimited general obligation municipal bond backed by ad valorem property taxes. Bonds are insured by AMBAC. Bonds are not rated. The issuer, Blount County, TN, has never deferred or defaulted on interest payments on this issue, so credit risk is acceptable. Taxable municipal bonds trade frequently, so liquidity risk is acceptable. The security matures on 6/1/24 with a modified duration of 5.90 years, so interest rate risk is acceptable. With a coupon of 6.00% and a call option on 6/1/17, earnings potential is good. This bond currently has a loss of $415,267 which represents 20.5% of book value.
DNB holds a fixed rate taxable tax allocation municipal bond backed by tax increment allocation revenues. Bonds are insured by AMBAC. Bonds are rated A- by S&P with an A- underlying rating. The issuer, Monrovia, CA, has never deferred or defaulted on interest payments on this issue, so credit risk is acceptable. Taxable municipal bonds trade frequently, so liquidity risk is acceptable. The security matures on 5/1/28 with a modified duration of 10.56 years, so interest rate risk is acceptable. With a coupon of 6.28% and a call option on 5/1/16, earnings potential is good. This bond currently has a loss of $104,158 which represents 15.0% of book value.
DNB holds a fixed rate taxable revenue municipal bond backed by university revenues. Bonds are insured by XLCA. Bonds are rated A1 by Moody's with an A1 underlying rating. The issuer, Iowa University has never deferred or defaulted on interest payments on this issue, so credit risk is acceptable. Taxable municipal bonds trade frequently, so liquidity risk is acceptable. The security matures on 7/1/33 with a modified duration of 11.84 years, so interest rate risk is acceptable. With a coupon of 6.10% and a call option on 7/1/18, earnings potential is good. This bond currently has a loss of $370,988 which represents 12.8% of book value.
59
The amortized cost and estimated fair value of investment securities as of December 31, 2009, by contractual maturity, are shown below. Actual maturities may differ from contractual maturities because certain securities may be called or prepaid without penalties.
| |
Held to Maturity |
Available for Sale |
|||||||||||
|---|---|---|---|---|---|---|---|---|---|---|---|---|---|
| (Dollars in thousands) |
Amortized Cost |
Estimated Fair Value |
Amortized Cost |
Estimated Fair Value |
|||||||||
| Due in one year or less | $ | 4,964 | $ | 4,999 | $ | 6,591 | $ | 6,611 | |||||
| Due after one year through five years | 6,482 | 6,658 | 56,075 | 55,748 | |||||||||
| Due after five years through ten years | 19,671 | 19,965 | 33,550 | 33,518 | |||||||||
| Due after ten years | 13,049 | 12,120 | 60,020 | 59,972 | |||||||||
| No stated maturity | — | — | 32 | 13 | |||||||||
| Total investment securities | $ | 44,166 | $ | 43,742 | $ | 156,268 | $ | 155,862 | |||||
DNB sold $130.6 million and $167.9 million securities from the AFS portfolio during 2009 and 2008, respectively. DNB also sold $1.7 million securities from the HTM portfolio during 2009. The sales from HTM in 2009 were permissible under accounting guidelines as the remaining factors on the pools was less than 15% of the original principal. Gains and losses resulting from investment sales, redemptions or calls were as follows:
| |
Year Ended December 31 |
||||||
|---|---|---|---|---|---|---|---|
| (Dollars in thousands) |
2009 |
2008 |
|||||
| Gross realized gains | $ | 1,412 | $ | 964 | |||
| Gross realized losses | 48 | 2 | |||||
| Net realized gain | $ | 1,364 | $ | 962 | |||
At December 31, 2009 and 2008, investment securities with a carrying value of approximately $158 million and $100 million, respectively, were pledged to secure public funds, repurchase agreements, FHLB advances and for other purposes as required by law. See Footnote 7 regarding the use of certain securities as collateral.
As of September 30, 2008, DNB reclassified its taxable municipal securities with a book value (net carrying amount) of $22.7 million from available-for-sale (AFS) to held-to-maturity (HTM). Reclassifying the taxable municipal securities to HTM will reduce the volatility and future negative effect on DNB's capital, because HTM securities are not marked-to-market through other comprehensive income, but carried at their amortized cost basis. The fair value of our taxable municipal securities was $22.0 million at September 30, 2008, the date of their reclassification. The $683,000 difference between their book value and their fair value will be treated like a discount and accreted into interest income over the remaining life of the security. The unrealized loss on these securities, which is in accumulated other comprehensive income, will be amortized as an adjustment of yield in a manner consistent with the discount, thus offsetting or mitigating the effect on interest income of the amortization of the discount.
60
(3) LOANS AND LEASES
| |
December 31 |
||||||
|---|---|---|---|---|---|---|---|
| (Dollars in thousands) |
2009 |
2008 |
|||||
Residential mortgage |
$ | 40,951 | $ | 44,052 | |||
Commercial mortgage |
172,117 | 138,897 | |||||
Commercial |
87,778 | 83,186 | |||||
Leases |
3,077 | 6,919 | |||||
Consumer |
55,504 | 63,400 | |||||
Total loans and leases |
$ | 359,427 | $ | 336,454 | |||
Less allowance for credit losses |
(5,477 | ) | (4,586 | ) | |||
Net loans and leases |
$ | 353,950 | $ | 331,868 | |||
Included in the loan portfolio are loans for which DNB has ceased the accrual of interest (i.e. non-accrual loans). Loans of approximately $9.0 million and $1.8 million as of December 31, 2009 and 2008, respectively, were on a non-accrual basis. DNB also had loans of approximately $191,000 and $900,000 that were 90 days or more delinquent, but still accruing as of December 31, 2009 and 2008, respectively. If contractual interest income had been recorded on non-accrual loans, interest would have been increased as shown in the following table:
| |
Year Ended December 31 |
||||||
|---|---|---|---|---|---|---|---|
| (Dollars in thousands) |
2009 |
2008 |
|||||
Interest income which would have been recorded under original terms |
$ | 505 | $ | 121 | |||
Interest income recorded during the year |
(89 | ) | (58 | ) | |||
Net impact on interest income |
$ | 416 | $ | 63 | |||
DNB had $16.3 million of loans, which, although performing at December 31, 2009, are believed to require increased supervision and review, and may, depending on the economic environment and other factors, become non-performing assets in future periods. There was $11.2 million of such loans at December 31, 2008. The majority of these loans are secured by commercial real estate with lesser amounts being secured by residential real estate, inventory and receivables.
DNB has a significant concentration of residential and commercial mortgage loans collateralized by first mortgage liens on properties located in Chester County. DNB did not have any concentration of loans to borrowers engaged in similar activities that exceed 10% of total loans at December 31, 2009, except for loans of approximately $66.7 million relating to commercial real estate buildings. See Footnote 7 regarding the use of certain loans as collateral.
61
(4) ALLOWANCE FOR CREDIT LOSSES
Changes in the allowance for credit losses, for the years indicated, are as follows:
| |
Year Ended December 31 |
||||||
|---|---|---|---|---|---|---|---|
| (Dollars in thousands) |
2009 |
2008 |
|||||
Beginning balance |
$ | 4,586 | $ | 3,891 | |||
Provision |
1,325 | 2,018 | |||||
Loans charged off |
(435 | ) | (994 | ) | |||
Leases charged off |
(61 | ) | (287 | ) | |||
Deposit overdrafts charged off |
(99 | ) | (120 | ) | |||
Recoveries |
161 | 78 | |||||
Net charge-offs |
(434 | ) | (1,323 | ) | |||
Ending balance |
$ | 5,477 | $ | 4,586 | |||
During the later part of March 2010, we received a new appraisal from the lead bank of a participation loan for a $2.8 million residential land development loan. Management is in the process of reviewing the appraisal and discussing various aspects of the appraisal with the lead bank. We currently have $180,000 reserved against this loan in the general allowance. A preliminary review of the appraisal indicates that we may need to provide an additional $100,000-$150,000 for this loan during the first quarter of 2010. Based on this, the after tax impact could be between $80,000 and $120,000, however the final determination of the additional reserve will depend on a complete review and approval by management.
Impaired loans are loans individually evaluated for collectibility, and which will probably not be collected in accordance with their contractual terms. The average recorded investment in 2008 is higher than the total recorded investment in the table below due primarily to the transfer of loans to OREO totaling approximately $5.0 million during 2008, the majority being moved during the fourth quarter. Information regarding impaired loans is presented as follows:
| |
Year Ended December 31 |
||||||
|---|---|---|---|---|---|---|---|
| (Dollars in thousands) |
2009 |
2008 |
|||||
Total recorded investment |
$ | 8,991 | $ | 1,163 | |||
Impaired loans with a specific allowance |
3,497 | 1,163 | |||||
Impaired loans without a specific allowance |
5,494 | — | |||||
Average recorded investment |
7,901 | 6,236 | |||||
Specific allowance allocation |
531 | 120 | |||||
Total cash collected |
654 | 313 | |||||
Interest income recorded |
46 | 108 | |||||
(5) OFFICE PROPERTY AND EQUIPMENT
| |
Estimated Useful Lives |
December 31 |
||||||||
|---|---|---|---|---|---|---|---|---|---|---|
| (Dollars in thousands) |
2009 |
2008 |
||||||||
Land |
$ | 611 | $ | 611 | ||||||
Buildings |
5-31.5 years | 10,662 | 10,139 | |||||||
Furniture, fixtures and equipment |
2-20 years | 12,703 | 12,826 | |||||||
Total cost |
23,976 | 23,576 | ||||||||
Less accumulated depreciation |
(15,201 | ) | (13,911 | ) | ||||||
Office property and equipment, net |
$ | 8,775 | $ | 9,665 | ||||||
62
Amounts charged to operating expense for depreciation for the years ended December 31, 2009 and 2008 amounted to $1.3 million and $1.3 million, respectively.
On November 18, 2005, the Bank sold its operations center and an adjunct administrative office at 104-106 Brandywine Avenue, to an unaffiliated buyer for $1,700,000 and leased the property from the buyer for an initial term ending December 1, 2010, on a triple net basis for an initial annual basic lease rental of approximately $176,000. The lease gives the Bank successive options to renew for three additional terms of five years each at a basic rent to be established at a fair market rental taking into account all of the terms and conditions of this lease, and an option to terminate the lease at any time on 120 days prior notice.
(6) DEPOSITS
Included in interest bearing time deposits are certificates of deposit issued in amounts of $100,000 or more. These certificates and their remaining maturities were as follows:
| (Dollars in thousands) |
December 31 2009 |
|||
|---|---|---|---|---|
| Three months or less | $ | 27,300 | ||
| Over three through six months | 16,232 | |||
| Over six through twelve months | 18,124 | |||
| Over one year through two years | 15,959 | |||
| Over two years | 11,279 | |||
| Total | $ | 88,894 | ||
Certificates of deposit scheduled to mature have the following remaining maturities:
| (Dollars in thousands) |
December 31 2009 |
|||
|---|---|---|---|---|
One year or less |
$ | 118,968 | ||
Over one year through two years |
18,706 | |||
Over two years through three years |
13,585 | |||
Over three years through four years |
4,479 | |||
Over four years through five years |
15,376 | |||
Over five years |
— | |||
Total |
$ | 171,114 | ||
(7) FHLB ADVANCES AND SHORT-TERM BORROWED FUNDS
DNB's short-term borrowed funds consist of borrowings at the Federal Home Loan Bank of Pittsburgh (FHLBP), repurchase agreements and Federal funds purchased. Repurchase agreements and Federal funds purchased generally represent one-day borrowings. Borrowings at the FHLB consist of overnight and 90 day borrowings. DNB had $16.5 million of repurchase agreements at December 31, 2009 with an average rate of 1.38% and $20.2 million of repurchase agreements at December 31, 2008 with an average rate of 1.31%.
In addition to short-term borrowings, DNB maintains borrowing arrangements with a correspondent bank and the FHLB of Pittsburgh, as well as access to the discount window at the Federal Reserve Bank of Philadelphia to meet short-term liquidity needs. Through these relationships, DNB has available credit of approximately $194.1 million. DNB has a maximum borrowing capacity at the FHLB of approximately $184.1 million. At December 31, 2009, DNB had $53.0 million of outstanding long-term advances, which
63
mature at various dates through the year-ended December 31, 2015, as shown in the table below. Of the advances maturing in 2010 and thereafter, $43.0 million are convertible term advances and are callable, at the FHLB's option, at various dates starting on January 20, 2010. None of these advances were called on that date. If an advance is called by the FHLB, DNB has the option of repaying the borrowing, or continuing to borrow at three month Libor plus 10-14 basis points, depending on the advance. DNB had $60.0 million of outstanding long-term FHLB advances are collateralized by loans and investment securities, and a lien on the Bank's FHLB stock.
| |
December 31, 2009 |
||||||
|---|---|---|---|---|---|---|---|
| (Dollars in thousands) |
Weighted Average Rate |
Amount |
|||||
Due by December 31, 2010 |
5.34 | % | $ | 28,000 | |||
Due by December 31, 2011 |
5.46 | 5,000 | |||||
Thereafter |
4.17 | 20,000 | |||||
Total |
4.91 | % | $ | 53,000 | |||
(8) CAPITAL LEASE AND OPERATING LEASE OBLIGATIONS
Included in other borrowings is a long-term capital lease agreement, which relates to DNB's West Goshen branch. As of December 31, 2009 the branch has a carrying amount of $407,000, net of accumulated depreciation of $343,000, and is included in the balance of office properties and equipment in the accompanying statements of financial condition. The following is a schedule of the future minimum lease payments, together with the present value of the net minimum lease payments, as of December 31, 2009:
| (Dollars in thousands) |
Year ended December 31 Amount |
|||
|---|---|---|---|---|
2010 |
$ | 106 | ||
2011 |
106 | |||
2012 |
106 | |||
2013 |
106 | |||
2014 |
106 | |||
Thereafter |
817 | |||
Total minimum lease payments |
1,347 | |||
Less amount representing interest |
(705 | ) | ||
Present value of net minimum lease payments |
$ | 642 | ||
The following is a schedule of the future minimum operating lease payments as of December 31, 2009:
| (Dollars in thousands) |
Year ended December 31 Amount |
|||
|---|---|---|---|---|
2010 |
$ | 480 | ||
2011 |
465 | |||
2012 |
454 | |||
2013 |
454 | |||
2014 |
368 | |||
Thereafter |
1,238 | |||
Total minimum lease payments |
$ | 3,459 | ||
64
(9) JUNIOR SUBORDINATED DEBENTURES
DNB has two issuances of junior subordinated debentures (the "debentures") as follows. The majority of the proceeds of each issuance were invested in DNB's subsidiary, DNB First, National Association, to increase the Bank's capital levels. The junior subordinated debentures issued in each case qualify as a component of capital for regulatory purposes. DNB Capital Trust I and II are special purpose Delaware business trusts, which are not consolidated.
DNB Capital Trust I DNB's first issuance of junior subordinated debentures was on July 20, 2001. This issuance of debentures are floating rate and were issued to DNB Capital Trust I, a Delaware business trust in which DNB owns all of the common equity. DNB Capital Trust I issued $5.0 million of floating rate (6 month Libor plus 3.75%, with a cap of 12%) capital preferred securities to a qualified institutional buyer. The proceeds of these securities were used by the Trust, along with DNB's capital contribution, to purchase $5.2 million principal amount of DNB's floating rate junior subordinated debentures. The preferred securities have been redeemable since July 25, 2006 and must be redeemed upon maturity of the debentures on July 25, 2031.
DNB Capital Trust II DNB's second issuance of junior subordinated debentures was on March 30, 2005. This issuance of debentures are floating rate and were issued to DNB Capital Trust II, a Delaware business trust in which DNB owns all of the common equity. DNB Capital Trust II issued $4.0 million of floating rate (the rate is fixed at 6.56% for the first 5 years and will adjust at a rate of 3-month LIBOR plus 1.77% thereafter) capital preferred securities. The proceeds of these securities were used by the Trust, along with DNB's capital contribution, to purchase $4.1 million principal amount of DNB's floating rate junior subordinated debentures. The preferred securities are redeemable by DNB on or after May 23, 2010, or earlier in the event of certain adverse tax or bank regulatory developments. The preferred securities must be redeemed upon maturity of the debentures on May 23, 2035.
(10) FAIR VALUE OF FINANCIAL INSTRUMENTS
FASB ASC Topic 820, Fair Value Measurements and Disclosures, which we adopted on January 1, 2008, establishes a fair value hierarchy based on the nature of data inputs for fair value determinations, under which DNB is required to value each asset within its scope using assumptions that market participations would utilize to value that asset. When DNB uses its own assumptions, it is required to disclose additional information about the assumptions used and the effect of the measurement on earnings or the net change in assets for the period.
The three levels of the fair value hierarchy under FASB ASC Topic 820 are as follows:
Level 1 — Quoted prices in active markets for identical securities.
Level 2 — Quoted prices for similar instruments in active markets; quoted prices for identical or similar instruments in markets that are not active and model derived valuations whose inputs are observable or whose significant value drivers are observable.
Level 3 — Instruments whose significant value drivers are unobservable.
A description of the valuation methodologies used for assets measured at fair value is set forth below:
DNB's available-for-sale investment securities, which generally include U.S. government agencies and mortgage backed securities, collateralized mortgage obligations, corporate bonds and equity securities are reported at fair value. These securities are valued by an independent third party ("preparer"). The preparer's evaluations are based on market data. They utilize evaluated pricing models that vary by asset and incorporate available trade, bid and other market information. For securities that do not trade on a daily basis, their evaluated pricing applications apply available information such as benchmarking and
65
matrix pricing. The market inputs normally sought in the evaluation of securities include benchmark yields, reported trades, broker/dealer quotes (only obtained from market makers or broker/dealers recognized as market participants), issuer spreads, two-sided markets, benchmark securities, bid, offers and reference data. For certain securities additional inputs may be used or some market inputs may not be applicable. Inputs are prioritized differently on any given day based on market conditions.
U.S. Government agencies are evaluated and priced using multi-dimensional relational models and option adjusted spreads. State and municipal securities are evaluated on a series of matrices including reported trades and material event notices. Mortgage backed securities are evaluated using matrix correlation to treasury or floating index benchmarks, prepayment speeds, monthly payment information and other benchmarks. Other investments are evaluated using a broker-quote based application, including quotes from issuers.
Impaired loans are those loans that the Bank has measured impairment generally based on the fair value of the loan's collateral. Fair value is generally determined based upon independent third-party appraisals of the properties, or discounted cash flows based upon the expected proceeds. These assets are included as Level 3 fair values, based upon the lowest level of input that is significant to the fair value measurements.
OREO assets are adjusted to fair value less estimated selling costs upon transfer of the loans to OREO. Subsequently, OREO assets are carried at the lower of carrying value or fair value. Fair value is based upon independent market prices, appraised values of the collateral or management's estimation of the value of the collateral. There assets are included as level 3 fair values.
The following table summarizes the assets at December 31, 2009 and December 31, 2008 that are recognized on DNB's balance sheet using fair value measurement determined based on the differing levels of input.
| |
December 31, 2009 |
||||||||||||
|---|---|---|---|---|---|---|---|---|---|---|---|---|---|
| (Dollars in thousands) |
Level 1 |
Level 2 |
Level 3 |
Assets at Fair Value |
|||||||||
Assets Measured at Fair Value on a Recurring Basis |
|||||||||||||
Securities available for sale |
$ | 13 | $ | 155,849 | $ | — | $ | 155,862 | |||||
Total assets measured at fair value on a recurring basis |
$ | 13 | $ | 155,849 | $ | — | $ | 155,862 | |||||
Assets Measured at Fair Value on a Nonrecurring Basis |
|||||||||||||
Impaired loans |
$ | — | $ | — | $ | 2,966 | $ | 2,966 | |||||
OREO & other repossessed property |
— | — | 4,489 | 4,489 | |||||||||
Total assets measured at fair value on a nonrecurring basis |
$ | — | $ | — | $ | 7,455 | $ | 7,455 | |||||
66
| |
December 31, 2008 |
||||||||||||
|---|---|---|---|---|---|---|---|---|---|---|---|---|---|
| (Dollars in thousands) |
Level 1 |
Level 2 |
Level 3 |
Assets at Fair Value |
|||||||||
Assets Measured at Fair Value on a Recurring Basis |
|||||||||||||
Securities available for sale |
$ | 21 | $ | 60,645 | $ | — | $ | 60,666 | |||||
Total assets measured at fair value on a recurring basis |
$ | 21 | $ | 60,645 | $ | — | $ | 60,666 | |||||
Assets Measured at Fair Value on a Nonrecurring Basis |
|||||||||||||
Impaired loans |
$ | — | $ | 1,163 | $ | — | $ | 1,163 | |||||
OREO & other repossessed property |
— | 4,997 | — | 4,997 | |||||||||
Total assets measured at fair value on a nonrecurring basis |
$ | — | $ | 6,160 | $ | — | $ | 6,160 | |||||
Impaired loans. Impaired loans, which are measured for impairment using the fair value of the collateral for collateral dependent loans, had a carrying amount of $9.0 million at December 31, 2009. Of this, $3.5 million had a valuation allowance of $531,000 and $5.5 million had no allowance as of December 31, 2009. Impaired loans had a carrying amount of $1.2 million at December 31, 2008. The valuation allowance on impaired loans was $120,000 as of December 31, 2008.
Other Real Estate Owned & other repossessed property. Other real estate owned ("OREO") consists of properties acquired as a result of, or in-lieu-of, foreclosure. Properties or other assets (primarily repossessed assets formerly leased) are classified as OREO and other repossessed property are initially recorded at fair value less cost to sell at the date of foreclosure, establishing a new cost basis. Subsequent to foreclosure, valuations are periodically performed by management and the assets are carried at the lower of carrying value or fair value, less estimated costs to sell. Costs relating to the development or improvement of the assets are capitalized and costs relating to holding the assets are charged to expense. DNB had $4.5 million of such assets at December 31, 2009, which consisted of $4.4 million in OREO and $109,000 in other repossessed property. DNB had $5.0 million of such assets at December 31, 2008, which consisted of $4.9 million in OREO and $93,000 in other repossessed property. Subsequent to the repossession of these assets, DNB wrote down their carrying values by $226,000 during the year ending December 31, 2009, based on appraisals.
Below is management's estimate of the fair value of all financial instruments, whether carried at cost or fair value on the Company's consolidated balance sheet. The carrying amounts and estimated fair values of financial instruments at December 31, 2009 and December 31, 2008 are as follows:
| |
December 31 |
||||||||||||
|---|---|---|---|---|---|---|---|---|---|---|---|---|---|
| |
2009 |
2008 |
|||||||||||
| (Dollars in thousands) |
Carrying Amount |
Estimated Fair Value |
Carrying Amount |
Estimated Fair Value |
|||||||||
Financial assets |
|||||||||||||
Cash and cash equivalents |
$ | 43,832 | $ | 43,832 | $ | 48,118 | $ | 48,118 | |||||
AFS investment securities |
155,862 | 155,862 | 60,666 | 60,666 | |||||||||
HTM investment securities |
44,166 | 43,742 | 59,395 | 58,525 | |||||||||
Loans and leases, net of allowance |
353,950 | 346,986 | 331,868 | 329,964 | |||||||||
Accrued interest receivable |
2,703 | 2,703 | 2,127 | 2,127 | |||||||||
Financial liabilities |
|||||||||||||
Deposits |
507,347 | 503,552 | 408,470 | 405,414 | |||||||||
Borrowings |
70,171 | 73,782 | 80,844 | 86,108 | |||||||||
Junior subordinated debentures |
9,279 | 5,647 | 9,279 | 5,158 | |||||||||
Accrued interest payable |
743 | 743 | 1,154 | 1,154 | |||||||||
Off-balance sheet instruments |
— | — | — | — | |||||||||
67
The specific estimation methods and assumptions used can have a substantial impact on the resulting fair values of financial instruments. Following is a brief summary of the significant assumptions, methods, and estimates used in estimating fair value.
Limitations Fair value estimates are made at a specific point in time, based on relevant market information about the financial instrument. These estimates do not reflect any premium or discount that could result from offering for sale at one time DNB's entire holdings of a particular financial instrument. Because no market exists for a significant portion of DNB's financial instruments, fair value estimates are based on judgments regarding future expected loss experience, current economic conditions, risk characteristics of various financial instruments, and other factors. These estimates are subjective in nature and involve uncertainties and matters of significant judgment and therefore cannot be determined with precision. Changes in assumptions could significantly affect the estimates.
Cash and Cash Equivalents, Investment Securities, Accrued Interest Receivable and Accrued Interest Payable The carrying amounts for short-term investments (cash and cash equivalents) and accrued interest receivable and payable approximate fair value. The fair value of investment securities are determined by an independent third party ("preparer"). The preparer's evaluations are based on market data. They utilize evaluated pricing models that vary by asset and incorporate available trade, bid and other market information. For securities that do not trade on a daily basis, their evaluated pricing applications apply available information such as benchmarking and matrix pricing. The market inputs normally sought in the evaluation of securities include benchmark yields, reported trades, broker/dealer quotes (only obtained from market makers or broker/dealers recognized as market participants), issuer spreads, two-sided markets, benchmark securities, bid, offers and reference data. For certain securities additional inputs may be used or some market inputs may not be applicable. Inputs are prioritized differently on any given day based on market conditions.
U.S. Government agencies are evaluated and priced using multi-dimensional relational models and option adjusted spreads. State and municipal securities are evaluated on a series of matrices including reported trades and material event notices. Mortgage backed securities are evaluated using matrix correlation to treasury or floating index benchmarks, prepayment speeds, monthly payment information and other benchmarks. Other investments are evaluated using a broker- quote based application, including quotes from issuers. The carrying amount of non-readily marketable equity securities approximates liquidation value.
Loans Fair values are estimated for portfolios of loans with similar financial characteristics. Loans are segregated by type such as commercial, commercial mortgages, residential mortgages, consumer and student loans, and non-accrual loans. The fair value of performing loans is calculated by discounting expected cash flows using an estimated market discount rate. Expected cash flows include both contractual cash flows and prepayments of loan balances. Prepayments on consumer loans were determined using the median of estimates of securities dealers for mortgage-backed investment pools.
The estimated discount rate considers credit and interest rate risk inherent in the loan portfolios and other factors such as liquidity premiums and incremental servicing costs to an investor. Management has made estimates of fair value discount rates that it believes to be reasonable. However, because there is no market for many of these financial instruments, management has no basis to determine whether the fair value presented below would be indicative of the value negotiated in an actual sale.
The fair value for non-accrual loans not based on fair value of collateral was derived through a discounted cash flow analysis, which includes the opportunity costs of carrying a non-performing asset. An estimated discount rate was used for these non-accrual loans, based on the probability of loss and the expected time to recovery.
68
Deposits and Borrowings The fair value of deposits with no stated maturity, such as non-interest- bearing deposits, savings, NOW and money market accounts, is equal to the amount payable on demand. The fair values of time deposits and borrowings are based on the present value of contractual cash flows. The discount rates used to compute present values are estimated using the rates currently offered for deposits of similar maturities in DNB's marketplace and rates currently being offered for borrowings of similar maturities.
Off-balance-sheet Instruments (Disclosed at Cost) Off-balance-sheet instruments are primarily comprised of loan commitments, which are generally priced at market at the time of funding. Fees on commitments to extend credit and stand-by letters of credit are deemed to be immaterial and these instruments are expected to be settled at face value or expire unused. It is impractical to assign any fair value to these instruments. At December 31, 2009, un-funded loan commitments totaled $55.2 million. Stand-by letters of credit totaled $2.8 million at December 31, 2009. At December 31, 2008, un-funded loan commitments totaled $55.3 million. Stand-by letters of credit totaled $3.0 million at December 31, 2008.
(11) FEDERAL INCOME TAXES
Income tax expense (benefit) was comprised of the following:
| |
Year Ended December 31 |
|||||||
|---|---|---|---|---|---|---|---|---|
| (Dollars in thousands) |
2009 |
2008 |
||||||
Current tax expense: |
||||||||
Federal |
$ | 786 | $ | 291 | ||||
State |
8 | 7 | ||||||
Deferred income tax (benefit): |
||||||||
Federal |
(432 | ) | (234 | ) | ||||
State |
— | — | ||||||
Income tax expense |
$ | 362 | $ | 64 | ||||
The effective income tax rates of 20% for 2009 and 7% for 2008 were different than the applicable statutory Federal income tax rate of 34%. The reason for these differences follows:
| |
Year Ended December 31 |
||||||
|---|---|---|---|---|---|---|---|
| (Dollars in thousands) |
2009 |
2008 |
|||||
Federal income taxes at statutory rate |
$ | 650 | $ | 297 | |||
Decrease resulting from: |
|||||||
Low income housing credits |
(36 | ) | (36 | ) | |||
Tax-exempt interest and dividend preference |
(130 | ) | (161 | ) | |||
Change in valuation allowance |
(2 | ) | — | ||||
Bank owned life insurance |
(104 | ) | (88 | ) | |||
Other, net increase |
(16 | ) | 52 | ||||
Income tax expense |
$ | 362 | $ | 64 | |||
69
The tax effects of temporary differences that give rise to significant portions of the deferred tax assets and deferred tax liabilities are presented below:
| |
December 31 |
||||||||
|---|---|---|---|---|---|---|---|---|---|
| (Dollars in thousands) |
2009 |
2008 |
|||||||
Deferred tax assets: |
|||||||||
Allowance for credit losses |
$ | 1,862 | $ | 1,559 | |||||
Unrealized losses on securities |
138 | 204 | |||||||
Unrealized losses on reclassified securities |
202 | — | |||||||
Unrealized loss on pension obligation |
406 | 604 | |||||||
AMT credit carry forward |
361 | 357 | |||||||
Low income housing tax credit carry forward |
343 | 546 | |||||||
Capital loss disallowance |
441 | 443 | |||||||
Unvested stock awards |
65 | 30 | |||||||
Deferred gain on sale / leaseback on buildings |
49 | 104 | |||||||
Deferred compensation (SERP) |
338 | 256 | |||||||
Non-accrued interest |
193 | 69 | |||||||
Charitable contributions carryover |
— | 44 | |||||||
Joint venture difference |
98 | 81 | |||||||
Deferred compensation (BOLI) |
252 | 252 | |||||||
Provision for unfunded loans |
50 | — | |||||||
Accrued expenses |
11 | 16 | |||||||
Total gross deferred tax assets |
4,809 | 4,565 | |||||||
Deferred tax liabilities: |
|||||||||
Depreciation |
(215 | ) | (191 | ) | |||||
Pension expense |
(49 | ) | (104 | ) | |||||
Tax bad debt reserve |
— | (74 | ) | ||||||
Bank shares tax credit |
(86 | ) | (68 | ) | |||||
Prepaid expenses |
(152 | ) | (189 | ) | |||||
Total gross deferred tax liabilities |
(502 | ) | (626 | ) | |||||
Valuation allowance |
(441 | ) | (443 | ) | |||||
Net deferred tax asset |
$ | 3,866 | $ | 3,496 | |||||
As of December 31, 2009, DNB had no material unrecognized tax benefits or accrued interest and penalties. It is the DNB's policy to account for interest and penalties accrued relative to unrecognized tax benefits as a component of income tax expense. Federal and state tax years 2006 through 2009 were open for examination as of December 31, 2009.
During 2009, DNB decreased the valuation allowance for federal tax assets by $2,000 related to realized capital gains that were offset by DNB's capital loss carryovers. During 2008, there was no change to the valuation allowance.
DNB has capital loss carryovers of $1,293,000 which will expire on December 31, 2010 if not utilized. DNB has recorded a valuation allowance of $441,000 for the entire amount of tax benefits associated with this item. In addition, DNB had AMT and low-income housing tax credit (LIHC) carry forwards as of December 31, 2009 of $361,000 and $343,000, respectively. The AMT credit carry forward has an indefinite life. The LIHC carry forward has a life of twenty years and will begin to expire in the year 2023, if not used. We believe it is more likely than not that these tax credits will be utilized.
70
(12) EARNINGS PER SHARE
Basic earnings per share ("EPS") is computed based on the weighted average number of common shares outstanding during the period. Diluted EPS is computed using the treasury stock method and reflects the potential dilution that could occur from the exercise of stock options, and warrants and the amortized portion of unvested stock awards. Stock options and unvested stock awards for which the exercise or the grant price exceeds the average market price over the period have an anti-dilutive effect on EPS and, accordingly, are excluded from the calculation. Treasury shares are not deemed outstanding for calculations. There were 186,311 anti-dilutive stock warrants, 169,503 anti-dilutive stock options outstanding and 24,101 anti-dilutive stock awards at December 31, 2009. There were 181,828 anti-dilutive stock options outstanding and 24,574 anti-dilutive stock awards at December 31, 2008. See Note 17 for a discussion of stock warrants issued in conjunction with Preferred shares issued to the U.S. Treasury Department as part of the CPP. The following table sets forth the computation of basic and diluted earnings per share:
| |
Year Ended December 31 |
||||||||||||||||||
|---|---|---|---|---|---|---|---|---|---|---|---|---|---|---|---|---|---|---|---|
| |
2009 |
2008 |
|||||||||||||||||
| (In thousands, except share data) |
Income |
Shares |
Amount |
Income |
Shares |
Amount |
|||||||||||||
Basic EPS |
|||||||||||||||||||
Net income available to common stockholders |
$ | 982 | 2,607 | $ | 0.38 | $ | 809 | 2,603 | $ | 0.31 | |||||||||
Diluted EPS |
|||||||||||||||||||
Effect of dilutive common stock awards |
— | — | — | — | 3 | — | |||||||||||||
Net income available to common stockholders |
$ | 982 | 2,607 | $ | 0.38 | $ | 809 | 2,606 | $ | 0.31 | |||||||||
(13) OTHER COMPREHENSIVE INCOME (LOSS)
The components of "Other Comprehensive Income (Loss)" and the related tax effects are as follows:
| (Dollars in thousands) |
Before-Tax Amount |
Tax Benefit (Expense) |
Net-of-Tax Amount |
||||||||
|---|---|---|---|---|---|---|---|---|---|---|---|
Year Ended December 31, 2009: |
|||||||||||
Unrealized gains on securities: |
|||||||||||
Unrealized holding gains arising during the period |
$ | 1,557 | $ | (530 | ) | $ | 1,027 | ||||
Accretion of discount on AFS to HTM reclassification |
89 | (30 | ) | 59 | |||||||
Less reclassification for gains included in net income |
(1,364 | ) | 464 | (900 | ) | ||||||
Unrealized actuarial gains — pension |
583 | (198 | ) | 385 | |||||||
Other Comprehensive Income |
$ | 865 | $ | (294 | ) | $ | 571 | ||||
Year Ended December 31, 2008: |
|||||||||||
Unrealized losses on securities: |
|||||||||||
Unrealized holding losses arising during the period |
$ | (1,041 | ) | $ | 354 | $ | (687 | ) | |||
Less reclassification for gains included in net income |
(962 | ) | 327 | (635 | ) | ||||||
Unrealized actuarial losses — pension |
(1,683 | ) | 572 | (1,111 | ) | ||||||
Other Comprehensive Loss |
$ | (3,686 | ) | $ | 1,253 | $ | (2,433 | ) | |||
71
The components of accumulated other comprehensive income (loss) included in stockholders' equity, are as follows:
| |
December 31 |
||||||||
|---|---|---|---|---|---|---|---|---|---|
| (Dollars in thousands) |
2009 |
2008 |
|||||||
Net unrealized loss on AFS securities |
$ | (406 | ) | $ | (599 | ) | |||
Tax effect |
138 | 204 | |||||||
Net of tax amount |
(268 | ) | (395 | ) | |||||
Discount on AFS to HTM reclassification |
(594 | ) | (683 | ) | |||||
Tax effect |
202 | 232 | |||||||
Net of tax amount |
(392 | ) | (451 | ) | |||||
Unrealized actuarial losses-pension |
(1,193 | ) | (1,776 | ) | |||||
Tax effect |
406 | 604 | |||||||
Net of tax amount |
(787 | ) | (1,172 | ) | |||||
Total |
$ | (2,193 | ) | $ | (3,058 | ) | |||
Tax effect |
746 | 1,040 | |||||||
Net of tax amount |
$ | (1,447 | ) | $ | (2,018 | ) | |||
(14) BENEFIT PLANS
Pension Plan The Bank maintains a defined benefit pension plan (the "Plan") covering all employees, including officers, who have been employed for one year and have attained 21 years of age. Prior to May 1, 1985, an individual must have attained the age of 25 and accrued one year of service. The Plan provides pension benefits to eligible retired employees at 65 years of age equal to 1.5% of their average monthly pay multiplied by their years of accredited service (maximum 40 years). The accrued benefit is based on the monthly average of their highest five consecutive years of their last ten years of service. The Plan generally covers only full-time employees.
Effective December 31, 2003, DNB amended its Plan so that no participants will earn additional benefits under the Plan after December 31, 2003. As a result of this amendment, no further service or compensation was credited under the Plan after December 31, 2003. The Plan, although frozen, will continue to provide benefit payments and employees can still earn vesting credits until retirement.
The following table sets forth the Plan's funded status, as of the measurement dates of December 31, 2009 and 2008 and amounts recognized in DNB's consolidated financial statements at December 31, 2009 and 2008:
| |
December 31 |
||||||
|---|---|---|---|---|---|---|---|
| (Dollars in thousands) |
2009 |
2008 |
|||||
Projected benefit obligation |
$ | (6,715 | ) | $ | (6,428 | ) | |
Accumulated benefit obligation |
(6,715 | ) | (6,428 | ) | |||
Fair value of plan assets |
6,015 | 5,308 | |||||
Amounts recognized in the statement of financial position consist of: |
|||||||
Liabilities |
$ | (700 | ) | $ | (1,120 | ) | |
Funded status |
$ | (700 | ) | $ | (1,120 | ) | |
Amounts recognized in accumulated other comprehensive income (loss) consist of: |
|||||||
Net loss |
$ | 1,193 | $ | 1,776 | |||
Total |
$ | 1,193 | $ | 1,776 | |||
72