Attached files
| file | filename |
|---|---|
| 8-K - 8-K - W R GRACE & CO | a8-k022014investormeetings.htm |

W. R. Grace & Co. Investor Meetings New York / Boston February 2014 Hudson La Force Senior Vice President and Chief Financial Officer © 2014 W. R. Grace & Co.
2 © 2014 W. R. Grace & Co. Disclaimer Safe Harbor Statement under the Private Securities Litigation Reform Act of 1995 This presentation contains forward-looking statements, that is, information related to future, not past, events. Such statements generally include the words “believes,” “plans,” “intends,” “targets,” “will,” “expects,” “suggests,” “anticipates,” “outlook,” “continues” or similar expressions. Forward-looking statements include, without limitation, expected financial positions; results of operations; cash flows; financing plans; business strategy; operating plans; capital and other expenditures; competitive positions; growth opportunities for existing products; benefits from new technology and cost reduction initiatives, plans and objectives; and markets for securities. For these statements, Grace claims the protection of the safe harbor for forward-looking statements contained in the Private Securities Litigation Reform Act of 1995. Like other businesses, Grace is subject to risks and uncertainties that could cause its actual results to differ materially from its projections or that could cause other forward-looking statements to prove incorrect. Factors that could cause actual results to materially differ from those contained in the forward-looking statements include, without limitation: risks related to foreign operations, especially in emerging regions, the cost and availability of raw materials and energy, the effectiveness of its research and development and growth investments, acquisitions and divestitures of assets and gains and losses from dispositions, developments affecting Grace's funded and unfunded pension obligations, its legal and environmental proceedings, costs of compliance with environmental regulation and those additional factors set forth in Grace's most recent Annual Report on Form 10-K, quarterly report on Form 10-Q and current reports on Form 8-K, which have been filed with the Securities and Exchange Commission and are readily available on the Internet at www.sec.gov. Reported results should not be considered as an indication of future performance. Readers are cautioned not to place undue reliance on Grace's projections and forward-looking statements, which speak only as the date thereof. Grace undertakes no obligation to publicly release any revision to the projections and forward-looking statements contained in this announcement, or to update them to reflect events or circumstances occurring after the date of this announcement. Non-GAAP Financial Terms These slides contain certain “non-GAAP financial terms” which are defined in the Appendix. Reconciliations of non-GAAP terms to the closest GAAP term (i.e., net income) are provided in the Appendix.
3 © 2014 W. R. Grace & Co. Discussion Outline Overview • Fast Facts • Delivering Shareholder Value Segment Updates • Catalysts Technologies • Construction Products 2014 Outlook Strategy for Return of Capital Summary – Why Grace
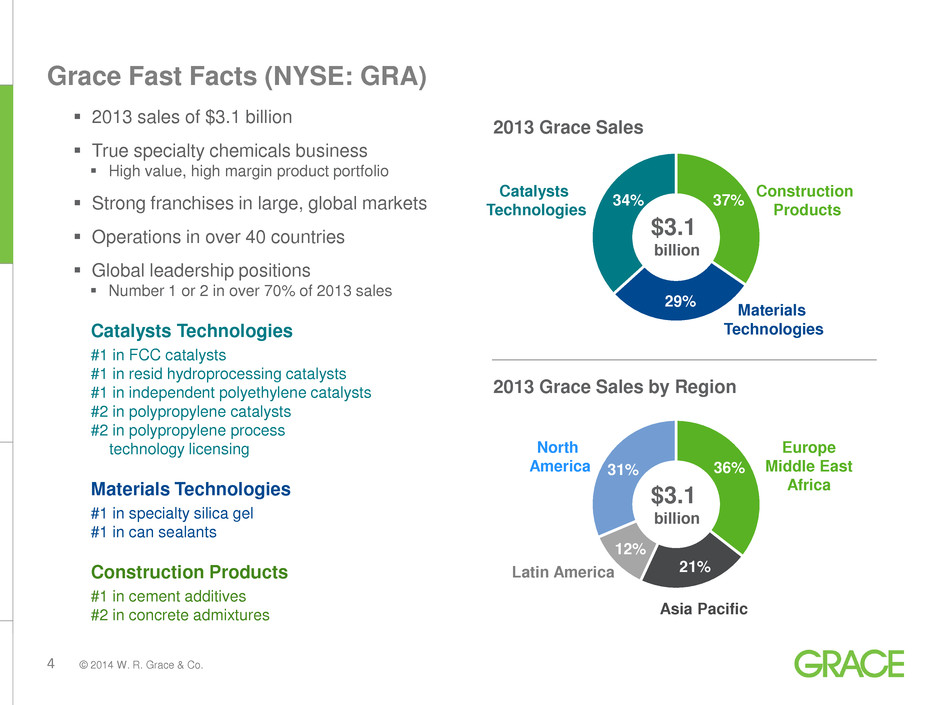
4 © 2014 W. R. Grace & Co. 36% 21% 12% 31% 37% 29% 34% Grace Fast Facts (NYSE: GRA) 2013 sales of $3.1 billion True specialty chemicals business High value, high margin product portfolio Strong franchises in large, global markets Operations in over 40 countries Global leadership positions Number 1 or 2 in over 70% of 2013 sales Catalysts Technologies #1 in FCC catalysts #1 in resid hydroprocessing catalysts #1 in independent polyethylene catalysts #2 in polypropylene catalysts #2 in polypropylene process technology licensing Materials Technologies #1 in specialty silica gel #1 in can sealants Construction Products #1 in cement additives #2 in concrete admixtures 2013 Grace Sales 2013 Grace Sales by Region $3.1 billion $3.1 billion Catalysts Technologies Construction Products Materials Technologies North America Europe Middle East Africa Asia Pacific Latin America
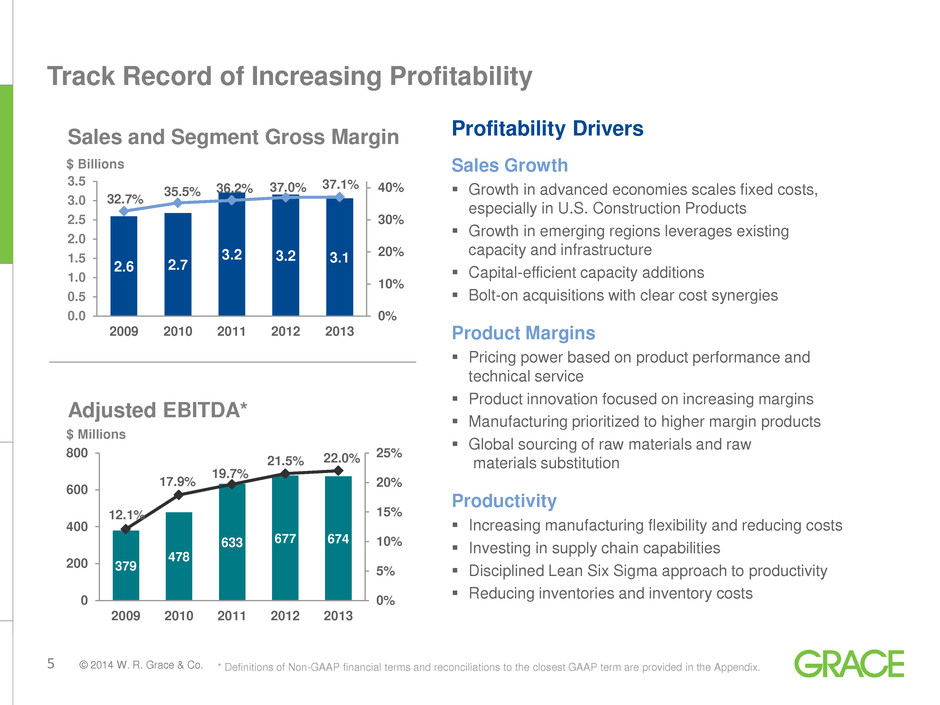
5 © 2014 W. R. Grace & Co. Track Record of Increasing Profitability * Definitions of Non-GAAP financial terms and reconciliations to the closest GAAP term are provided in the Appendix. 2.6 2.7 3.2 3.2 3.1 32.7% 35.5% 36.2% 37.0% 37.1% 0% 10% 20% 30% 40% 0.0 0.5 1.0 1.5 2.0 2.5 3.0 3.5 2009 2010 2011 2012 2013 Sales and Segment Gross Margin Profitability Drivers Sales Growth Growth in advanced economies scales fixed costs, especially in U.S. Construction Products Growth in emerging regions leverages existing capacity and infrastructure Capital-efficient capacity additions Bolt-on acquisitions with clear cost synergies Product Margins Pricing power based on product performance and technical service Product innovation focused on increasing margins Manufacturing prioritized to higher margin products Global sourcing of raw materials and raw materials substitution Productivity Increasing manufacturing flexibility and reducing costs Investing in supply chain capabilities Disciplined Lean Six Sigma approach to productivity Reducing inventories and inventory costs 379 478 633 677 674 12.1% 17.9% 19.7% 21.5% 22.0% 0% 5% 10% 15% 20% 25% 0 200 400 600 800 2009 2010 2011 2012 2013 Adjusted EBITDA* $ Billions $ Millions
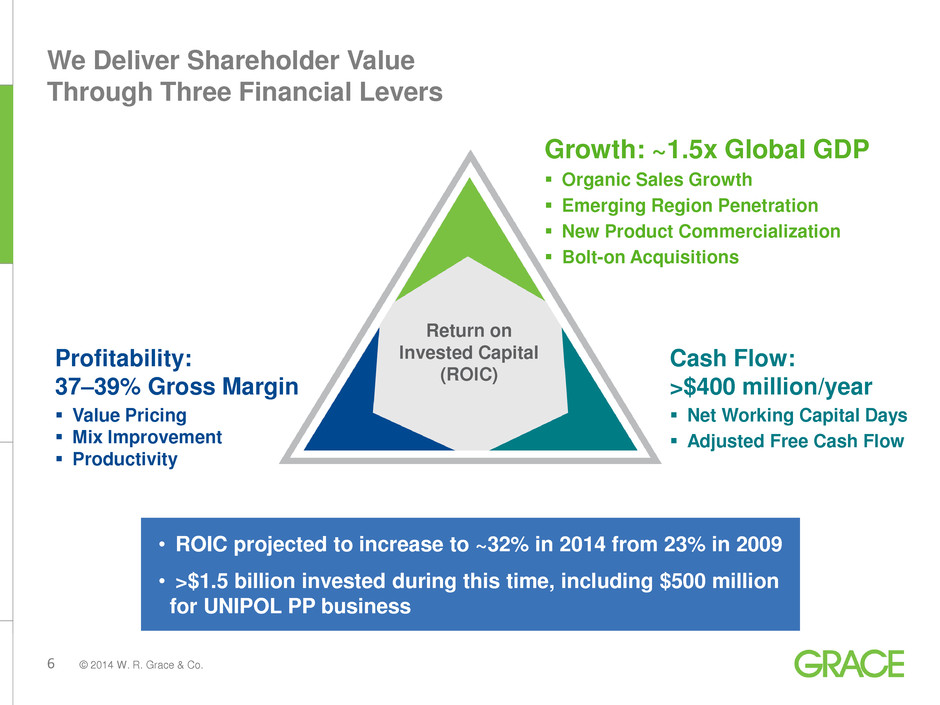
6 © 2014 W. R. Grace & Co. • ROIC projected to increase to ~32% in 2014 from 23% in 2009 • >$1.5 billion invested during this time, including $500 million for UNIPOL PP business We Deliver Shareholder Value Through Three Financial Levers Growth: ~1.5x Global GDP Organic Sales Growth Emerging Region Penetration New Product Commercialization Bolt-on Acquisitions Cash Flow: >$400 million/year Net Working Capital Days Adjusted Free Cash Flow Profitability: 37–39% Gross Margin Value Pricing Mix Improvement Productivity Return on Invested Capital (ROIC)
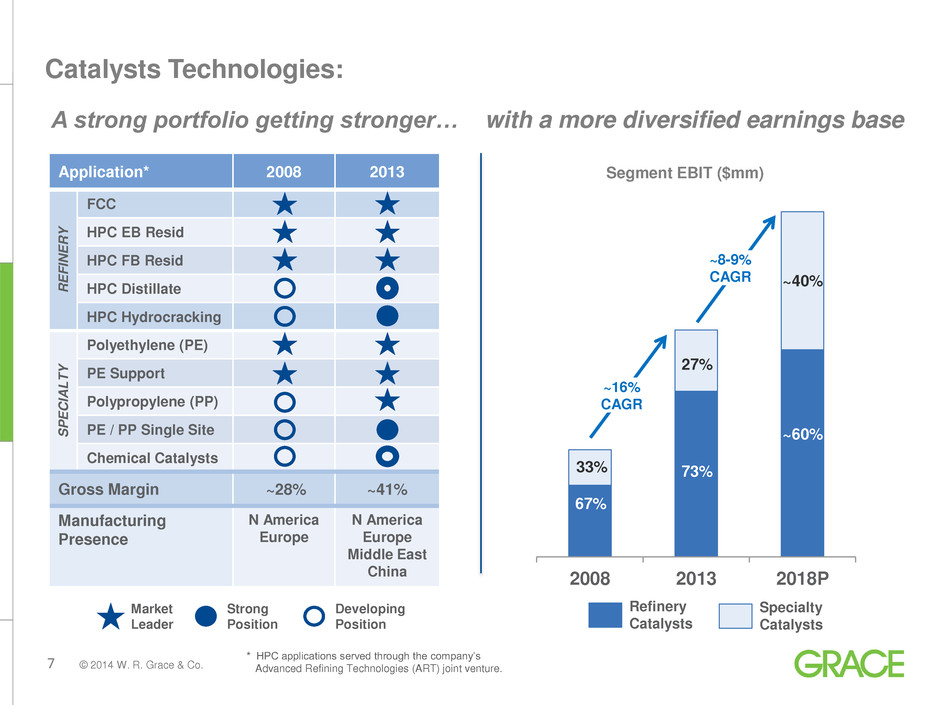
7 © 2014 W. R. Grace & Co. Catalysts Technologies: Application* 2008 2013 R E F IN E R Y FCC HPC EB Resid HPC FB Resid HPC Distillate HPC Hydrocracking S P E CIA L T Y Polyethylene (PE) PE Support Polypropylene (PP) PE / PP Single Site Chemical Catalysts Gross Margin ~28% ~41% Manufacturing Presence N America Europe N America Europe Middle East China Market Leader Developing Position Strong Position * HPC applications served through the company’s Advanced Refining Technologies (ART) joint venture. 2008 2013 2018P A strong portfolio getting stronger… with a more diversified earnings base Refinery Catalysts Segment EBIT ($mm) 33% 67% 73% 27% ~40% ~60% Specialty Catalysts ~16% CAGR ~8-9% CAGR
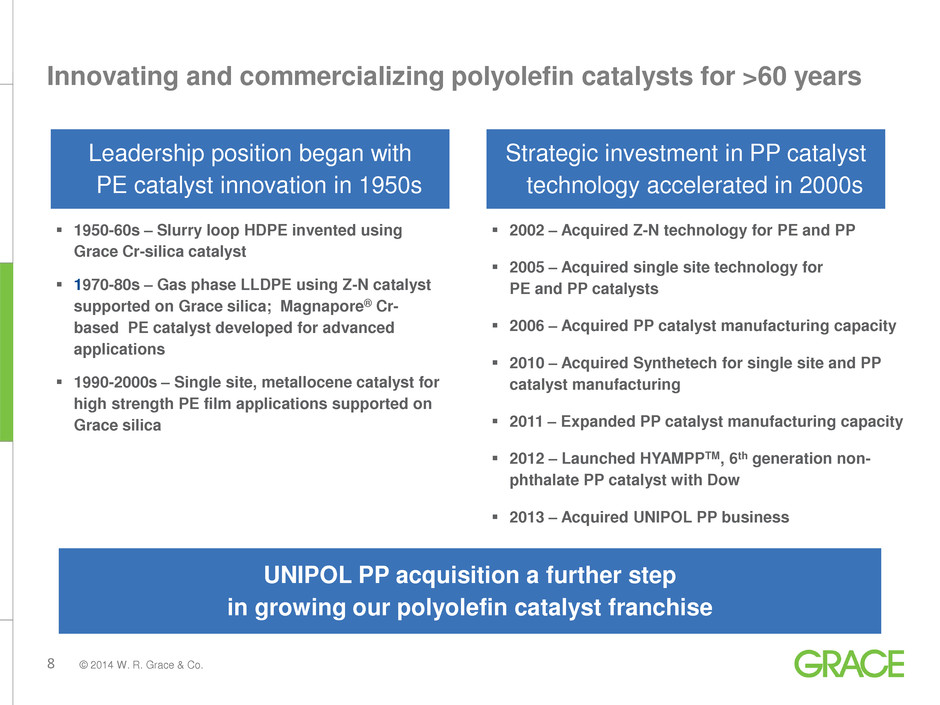
8 © 2014 W. R. Grace & Co. 1950-60s – Slurry loop HDPE invented using Grace Cr-silica catalyst 1970-80s – Gas phase LLDPE using Z-N catalyst supported on Grace silica; Magnapore® Cr- based PE catalyst developed for advanced applications 1990-2000s – Single site, metallocene catalyst for high strength PE film applications supported on Grace silica 2002 – Acquired Z-N technology for PE and PP 2005 – Acquired single site technology for PE and PP catalysts 2006 – Acquired PP catalyst manufacturing capacity 2010 – Acquired Synthetech for single site and PP catalyst manufacturing 2011 – Expanded PP catalyst manufacturing capacity 2012 – Launched HYAMPPTM, 6th generation non- phthalate PP catalyst with Dow 2013 – Acquired UNIPOL PP business UNIPOL PP acquisition a further step in growing our polyolefin catalyst franchise Leadership position began with PE catalyst innovation in 1950s Strategic investment in PP catalyst technology accelerated in 2000s Innovating and commercializing polyolefin catalysts for >60 years
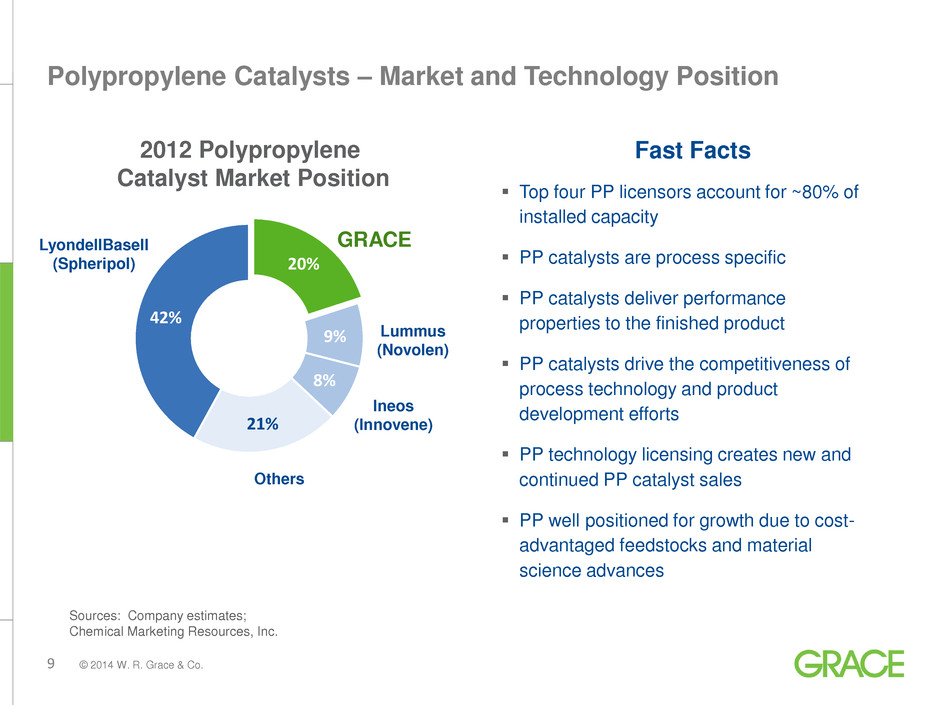
9 © 2014 W. R. Grace & Co. Polypropylene Catalysts – Market and Technology Position Fast Facts Top four PP licensors account for ~80% of installed capacity PP catalysts are process specific PP catalysts deliver performance properties to the finished product PP catalysts drive the competitiveness of process technology and product development efforts PP technology licensing creates new and continued PP catalyst sales PP well positioned for growth due to cost- advantaged feedstocks and material science advances 20% 9% 8% 21% 42% 2012 Polypropylene Catalyst Market Position Sources: Company estimates; Chemical Marketing Resources, Inc. GRACE LyondellBasell (Spheripol) Lummus (Novolen) Others Ineos (Innovene)
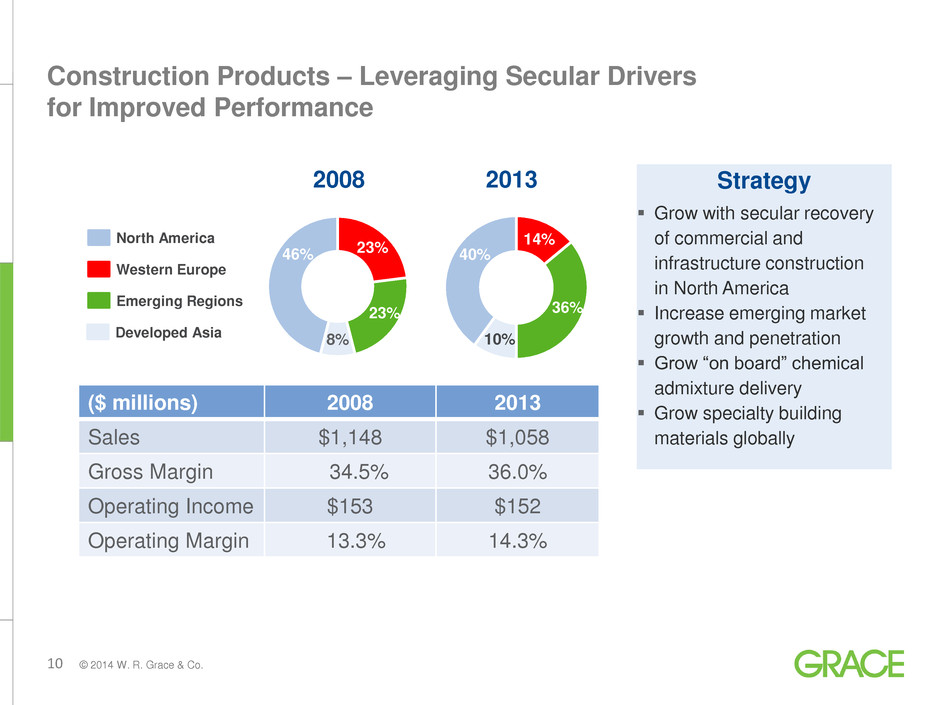
10 © 2014 W. R. Grace & Co. Strategy Grow with secular recovery of commercial and infrastructure construction in North America Increase emerging market growth and penetration Grow “on board” chemical admixture delivery Grow specialty building materials globally Construction Products – Leveraging Secular Drivers for Improved Performance FY 2008 23% 23% 8% 46% North America Western Europe 14% 36% 10% 40% Developed Asia ($ millions) 2008 2013 Sales $1,148 $1,058 Gross Margin 34.5% 36.0% Operating Income $153 $152 Operating Margin 13.3% 14.3% North America Western Europe Developed Asia Emerging Regions 2008 2013
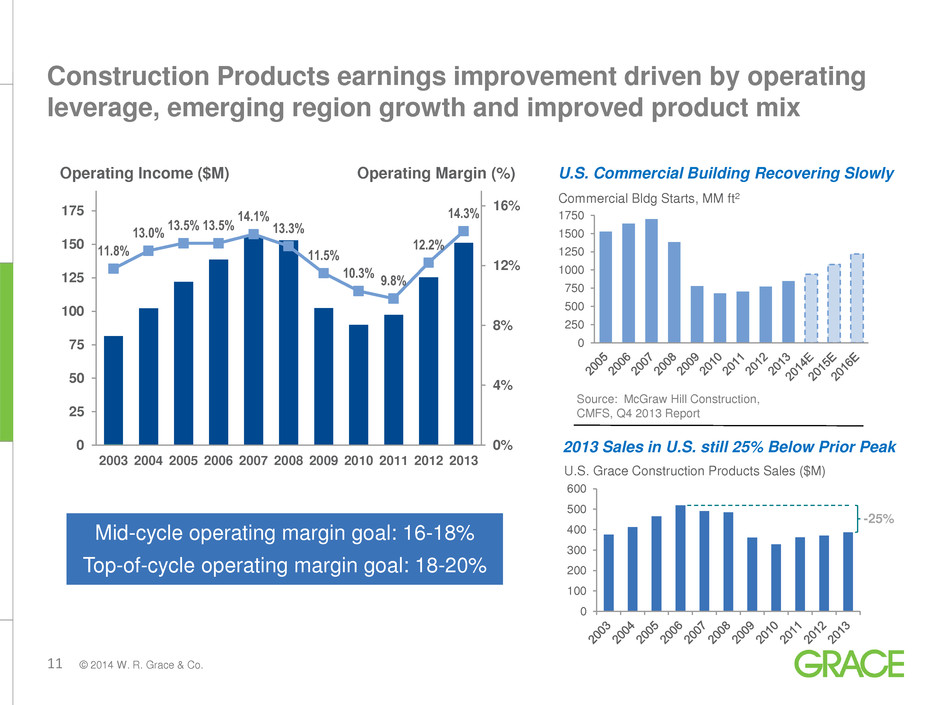
11 © 2014 W. R. Grace & Co. Construction Products earnings improvement driven by operating leverage, emerging region growth and improved product mix 11.8% 13.0% 13.5% 13.5% 14.1% 13.3% 11.5% 10.3% 9.8% 12.2% 14.3% 0% 4% 8% 12% 16% 0 25 50 75 100 125 150 175 2003 2004 2005 2006 2007 2008 2009 2010 2011 2012 2013 Operating Income ($M) Operating Margin (%) Mid-cycle operating margin goal: 16-18% Top-of-cycle operating margin goal: 18-20% 0 250 500 750 1000 1250 1500 1750 U.S. Commercial Building Recovering Slowly Commercial Bldg Starts, MM ft2 Source: McGraw Hill Construction, CMFS, Q4 2013 Report 0 100 200 300 400 500 600 2013 Sales in U.S. still 25% Below Prior Peak U.S. Grace Construction Products Sales ($M) -25%
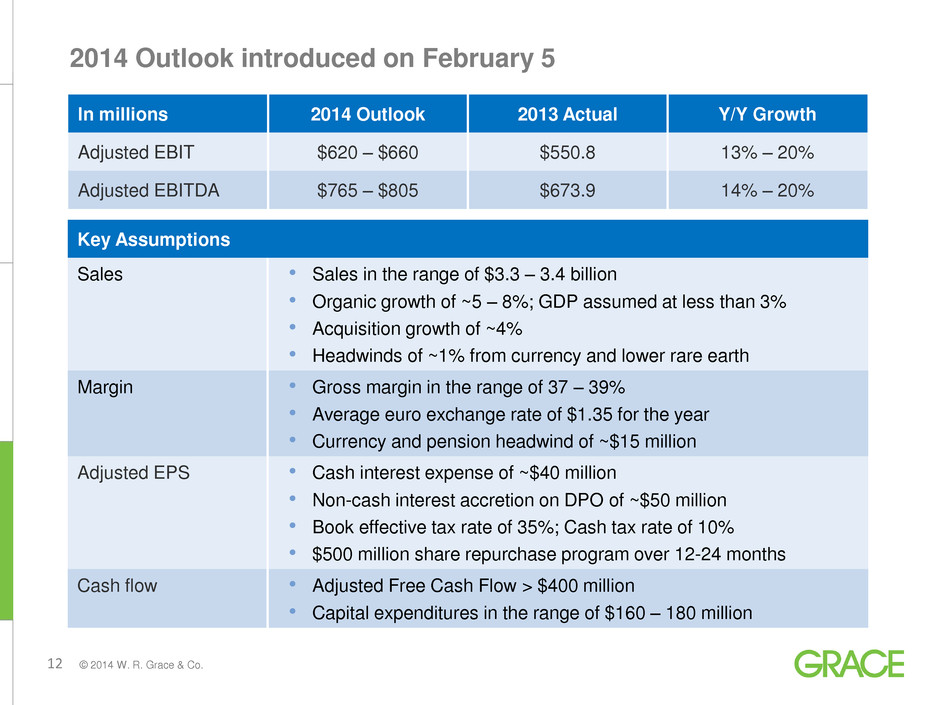
12 © 2014 W. R. Grace & Co. In millions 2014 Outlook 2013 Actual Y/Y Growth Adjusted EBIT $620 – $660 $550.8 13% – 20% Adjusted EBITDA $765 – $805 $673.9 14% – 20% 2014 Outlook introduced on February 5 Key Assumptions Sales • Sales in the range of $3.3 – 3.4 billion • Organic growth of ~5 – 8%; GDP assumed at less than 3% • Acquisition growth of ~4% • Headwinds of ~1% from currency and lower rare earth Margin • Gross margin in the range of 37 – 39% • Average euro exchange rate of $1.35 for the year • Currency and pension headwind of ~$15 million Adjusted EPS • Cash interest expense of ~$40 million • Non-cash interest accretion on DPO of ~$50 million • Book effective tax rate of 35%; Cash tax rate of 10% • $500 million share repurchase program over 12-24 months Cash flow • Adjusted Free Cash Flow > $400 million • Capital expenditures in the range of $160 – 180 million
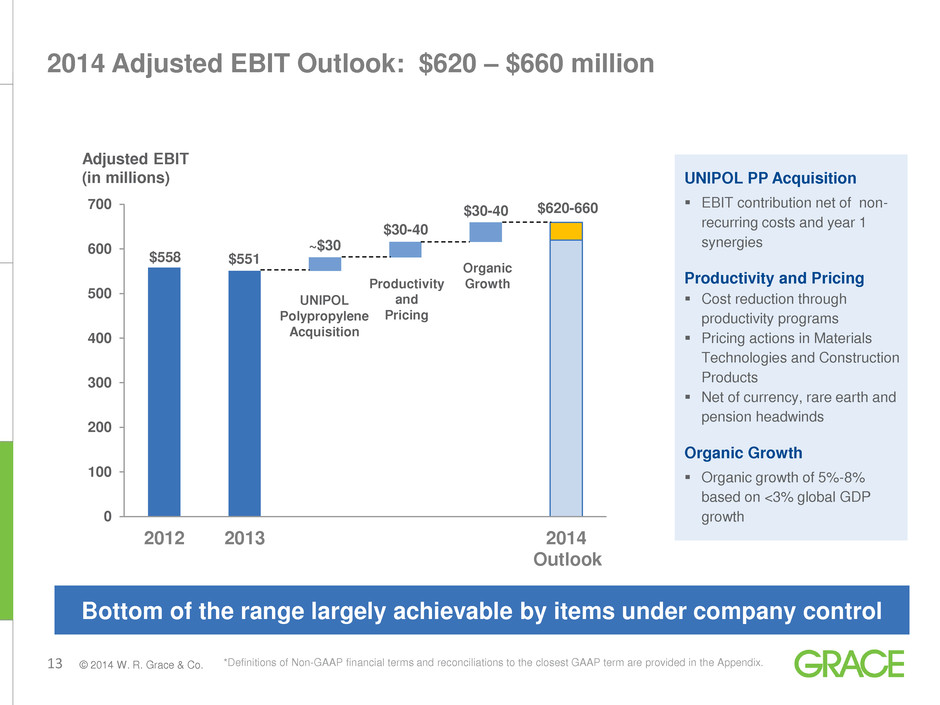
13 © 2014 W. R. Grace & Co. UNIPOL PP Acquisition EBIT contribution net of non- recurring costs and year 1 synergies Productivity and Pricing Cost reduction through productivity programs Pricing actions in Materials Technologies and Construction Products Net of currency, rare earth and pension headwinds Organic Growth Organic growth of 5%-8% based on <3% global GDP growth *Definitions of Non-GAAP financial terms and reconciliations to the closest GAAP term are provided in the Appendix. 2014 Adjusted EBIT Outlook: $620 – $660 million = 2014 Outlook as of February 5, 2014 0 100 200 300 400 500 600 700 2012 2013 2014 Organic Growth Productivity and Pricing $558 $30-40 $620-660 Adjusted EBIT (in millions) $551 Outlook UNIPOL Polypropylene Acquisition ~$30 $30-40 Bottom of the range largely achievable by items under company control

14 © 2014 W. R. Grace & Co. Capital Investment Acquisitions ~ 5–7% of Sales Catalysts: ~70% Materials: ~15% Construction: ~15% Recent acquisitions: Catalysts: $555M (3 deals) Materials: -0- Construction: $142M (6 deals) Financial Strength to Grow Top Line and Increase Total Shareholder Return $490 million by February 2015 Leverage targeted at 2-3X Adjusted EBITDA High return opportunities in each segment Financial Strength Annual Cash from Operations and Additional Leverage Reinvest in the business $500 million within 12-24 months Cash settle warrant Share repurchases Return cash to shareholders
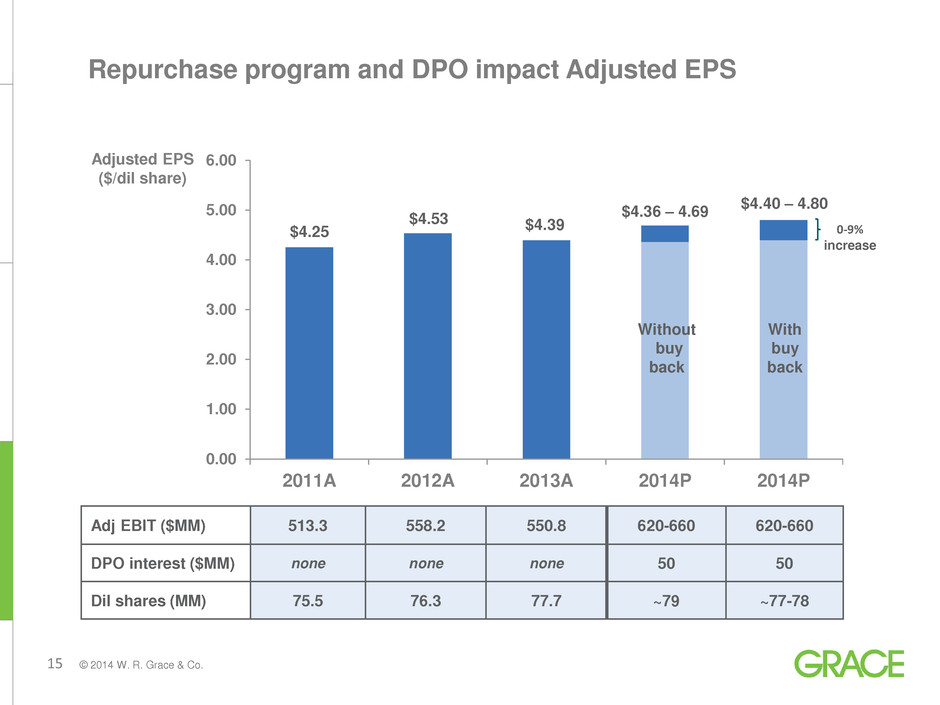
15 © 2014 W. R. Grace & Co. 0.00 1.00 2.00 3.00 4.00 5.00 6.00 2011A 2012A 2013A 2014P 2014P Adj EBIT ($MM) 513.3 558.2 550.8 620-660 620-660 DPO interest ($MM) none none none 50 50 Dil shares (MM) 75.5 76.3 77.7 ~79 ~77-78 $4.25 $4.53 $4.39 $4.36 – 4.69 $4.40 – 4.80 Repurchase program and DPO impact Adjusted EPS Adjusted EPS ($/dil share) With buy back 0-9% increase Without buy back

16 © 2014 W. R. Grace & Co. Summary – Why Grace? Proven market leader delivering high-value technology in large global industries Strong financial track record Execution-focused management team Financial flexibility to return cash to shareholders post emergence Compelling valuation

17 © 2014 W. R. Grace & Co. For additional information, please visit www.grace.com or contact: J. Mark Sutherland Vice President, Investor Relations +1 410.531.4590 Mark.Sutherland@grace.com David Joseph Finance Manager, Investor Relations +1 410.531.4590 David.Joseph@grace.com
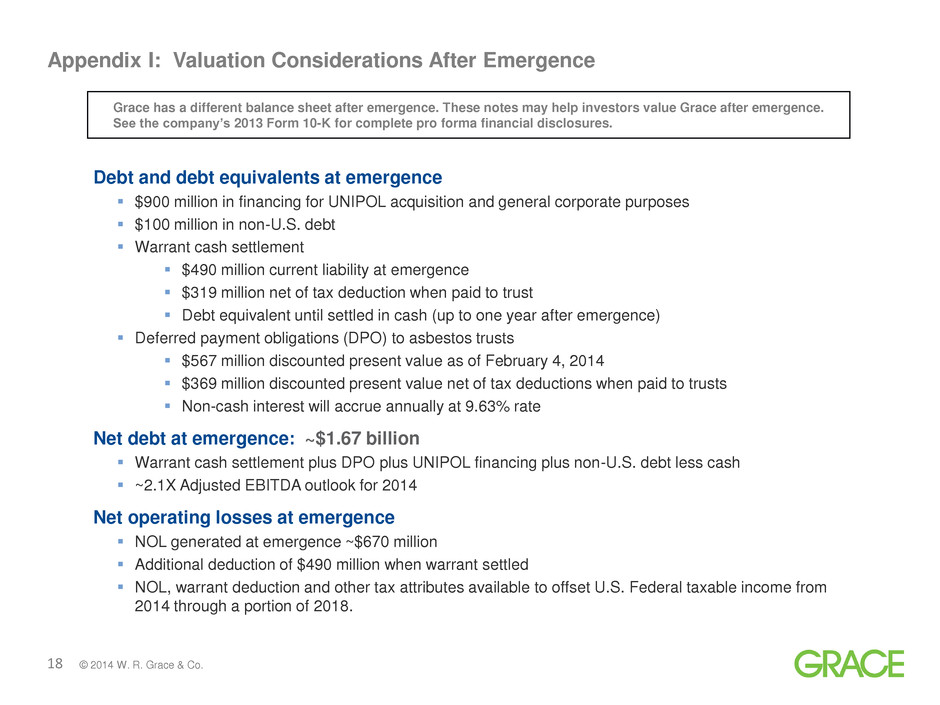
18 © 2014 W. R. Grace & Co. Appendix I: Valuation Considerations After Emergence Grace has a different balance sheet after emergence. These notes may help investors value Grace after emergence. See the company’s 2013 Form 10-K for complete pro forma financial disclosures. Debt and debt equivalents at emergence $900 million in financing for UNIPOL acquisition and general corporate purposes $100 million in non-U.S. debt Warrant cash settlement $490 million current liability at emergence $319 million net of tax deduction when paid to trust Debt equivalent until settled in cash (up to one year after emergence) Deferred payment obligations (DPO) to asbestos trusts $567 million discounted present value as of February 4, 2014 $369 million discounted present value net of tax deductions when paid to trusts Non-cash interest will accrue annually at 9.63% rate Net debt at emergence: ~$1.67 billion Warrant cash settlement plus DPO plus UNIPOL financing plus non-U.S. debt less cash ~2.1X Adjusted EBITDA outlook for 2014 Net operating losses at emergence NOL generated at emergence ~$670 million Additional deduction of $490 million when warrant settled NOL, warrant deduction and other tax attributes available to offset U.S. Federal taxable income from 2014 through a portion of 2018.
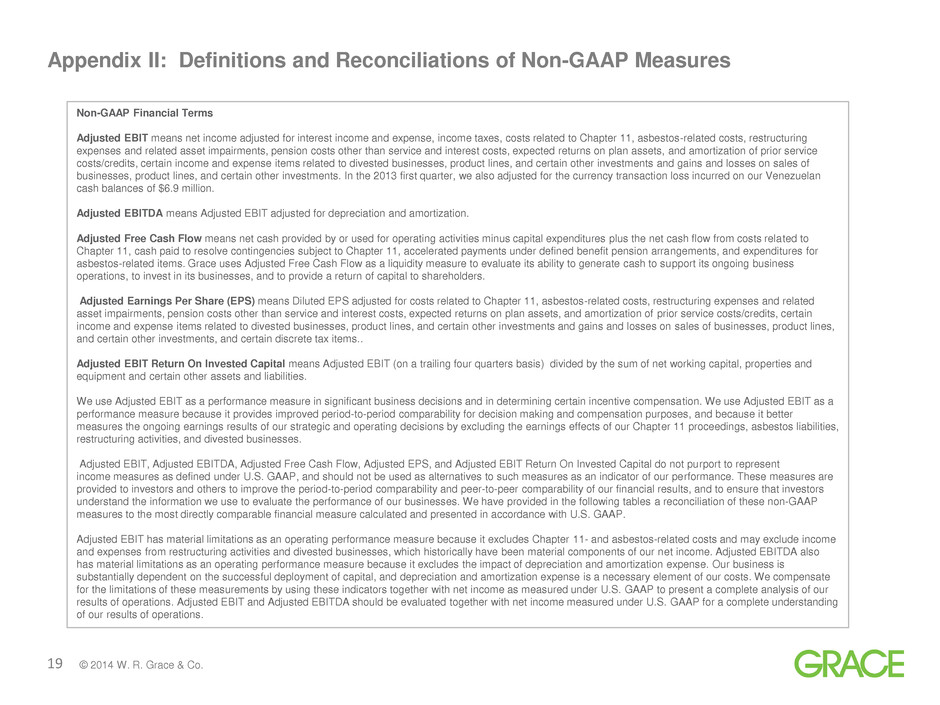
19 © 2014 W. R. Grace & Co. Appendix II: Definitions and Reconciliations of Non-GAAP Measures Non-GAAP Financial Terms Adjusted EBIT means net income adjusted for interest income and expense, income taxes, costs related to Chapter 11, asbestos-related costs, restructuring expenses and related asset impairments, pension costs other than service and interest costs, expected returns on plan assets, and amortization of prior service costs/credits, certain income and expense items related to divested businesses, product lines, and certain other investments and gains and losses on sales of businesses, product lines, and certain other investments. In the 2013 first quarter, we also adjusted for the currency transaction loss incurred on our Venezuelan cash balances of $6.9 million. Adjusted EBITDA means Adjusted EBIT adjusted for depreciation and amortization. Adjusted Free Cash Flow means net cash provided by or used for operating activities minus capital expenditures plus the net cash flow from costs related to Chapter 11, cash paid to resolve contingencies subject to Chapter 11, accelerated payments under defined benefit pension arrangements, and expenditures for asbestos-related items. Grace uses Adjusted Free Cash Flow as a liquidity measure to evaluate its ability to generate cash to support its ongoing business operations, to invest in its businesses, and to provide a return of capital to shareholders. Adjusted Earnings Per Share (EPS) means Diluted EPS adjusted for costs related to Chapter 11, asbestos-related costs, restructuring expenses and related asset impairments, pension costs other than service and interest costs, expected returns on plan assets, and amortization of prior service costs/credits, certain income and expense items related to divested businesses, product lines, and certain other investments and gains and losses on sales of businesses, product lines, and certain other investments, and certain discrete tax items.. Adjusted EBIT Return On Invested Capital means Adjusted EBIT (on a trailing four quarters basis) divided by the sum of net working capital, properties and equipment and certain other assets and liabilities. We use Adjusted EBIT as a performance measure in significant business decisions and in determining certain incentive compensation. We use Adjusted EBIT as a performance measure because it provides improved period-to-period comparability for decision making and compensation purposes, and because it better measures the ongoing earnings results of our strategic and operating decisions by excluding the earnings effects of our Chapter 11 proceedings, asbestos liabilities, restructuring activities, and divested businesses. Adjusted EBIT, Adjusted EBITDA, Adjusted Free Cash Flow, Adjusted EPS, and Adjusted EBIT Return On Invested Capital do not purport to represent income measures as defined under U.S. GAAP, and should not be used as alternatives to such measures as an indicator of our performance. These measures are provided to investors and others to improve the period-to-period comparability and peer-to-peer comparability of our financial results, and to ensure that investors understand the information we use to evaluate the performance of our businesses. We have provided in the following tables a reconciliation of these non-GAAP measures to the most directly comparable financial measure calculated and presented in accordance with U.S. GAAP. Adjusted EBIT has material limitations as an operating performance measure because it excludes Chapter 11- and asbestos-related costs and may exclude income and expenses from restructuring activities and divested businesses, which historically have been material components of our net income. Adjusted EBITDA also has material limitations as an operating performance measure because it excludes the impact of depreciation and amortization expense. Our business is substantially dependent on the successful deployment of capital, and depreciation and amortization expense is a necessary element of our costs. We compensate for the limitations of these measurements by using these indicators together with net income as measured under U.S. GAAP to present a complete analysis of our results of operations. Adjusted EBIT and Adjusted EBITDA should be evaluated together with net income measured under U.S. GAAP for a complete understanding of our results of operations.
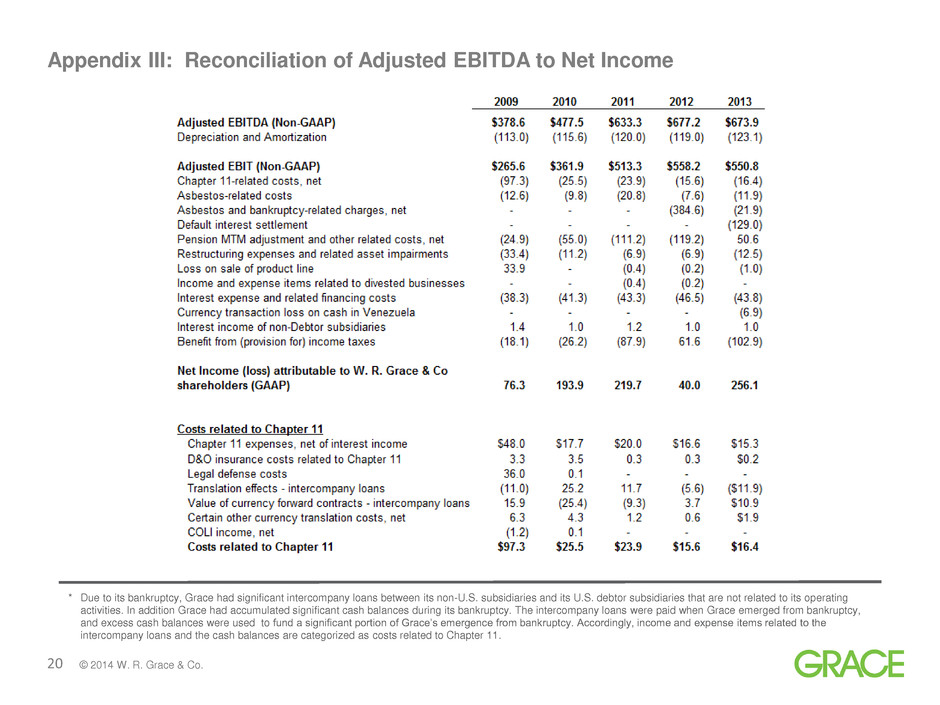
20 © 2014 W. R. Grace & Co. Appendix III: Reconciliation of Adjusted EBITDA to Net Income * Due to its bankruptcy, Grace had significant intercompany loans between its non-U.S. subsidiaries and its U.S. debtor subsidiaries that are not related to its operating activities. In addition Grace had accumulated significant cash balances during its bankruptcy. The intercompany loans were paid when Grace emerged from bankruptcy, and excess cash balances were used to fund a significant portion of Grace’s emergence from bankruptcy. Accordingly, income and expense items related to the intercompany loans and the cash balances are categorized as costs related to Chapter 11.
