Attached files
| file | filename |
|---|---|
| 8-K - FORM 8K - CenterState Bank Corp | d675629d8k.htm |
 Sterne Agee
Financial Institution
Investor Conference
February 13, 2014
Exhibit 99.1 |
 This
presentation
contains
forward-looking
statements,
as
defined
by
Federal
Securities
Laws,
relating
to
present
or
future
trends
or
factors
affecting
the
operations,
markets
and
products
of
CenterState
Banks,
Inc.
(CSFL).
These
statements
are
provided
to
assist
in
the
understanding
of
future
financial
performance.
Any
such
statements
are
based
on
current
expectations
and
involve
a
number
of
risks
and
uncertainties.
For
a
discussion
of
factors
that
may
cause
such
forward-looking
statements
to
differ
materially
from
actual
results,
please
refer
to
CSFL’s
most
recent
Form
10-Q
and
Form
10-K
filed
with
the
Securities
Exchange
Commission.
CSFL
undertakes
no
obligation
to
release
revisions
to
these
forward-looking
statements
or
reflect
events
or
circumstances
after
the
date
of
this
presentation.
Forward Looking Statement
2
2 |
 Company Overview |
 Correspondent
Banking Market Pro forma for Gulfstream acquisition
•
Headquartered in Davenport, FL
$3.0 billion in assets
$1.9 billion in loans
$2.5 billion in deposits
•
Company formed: June 2000
1 Subsidiary Bank
Corporate Overview
4 |
 18
CSFL –
Best Positioned Florida Consolidator
Source: SNL Financial
Data as of MRQ available
5
Federal Trust Acquisition
from
The Hartford Insurance Company
TD Bank divesture in Putnam
Gulfstream Business Bank in Stuart
First Southern Bancorp |
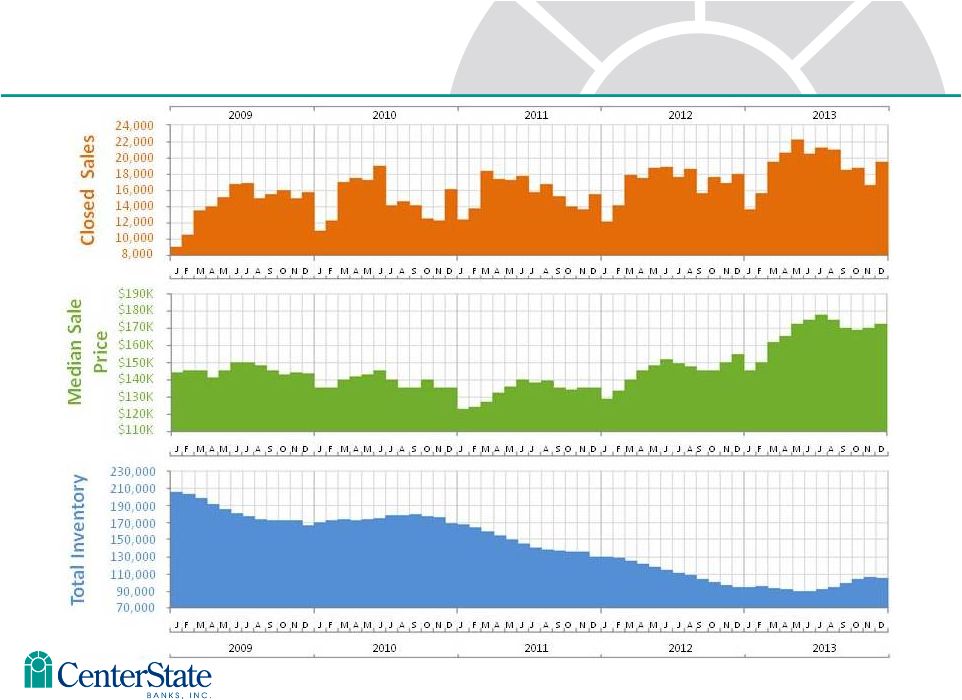 6
Source:
Florida
Realtors
Monthly
Market
Detail
(December
2013)
–
Single
Family
Homes
Florida Real Estate –
Single Family Homes
6 |
 4
th
Quarter
Financial
Summary |
 8
4
th
Quarter Summary of Financial Results
4Q 2013
3Q 2013
EPS
$0.06
$0.10
•
Lower loan loss provision
$183 vs. ($1,273)
•
Higher IA amortization
•
Lower bond sales
•
Loan growth
•
Resilient NIM
•
4.65% vs. 4.96%
(4.58%) vs. (4.89%)
•
Covered loan performance
•
Potential future ALLL release
•
Valuable core deposit franchise
•
Credit metrics continue to improve
Current Qtr take-aways |
 9
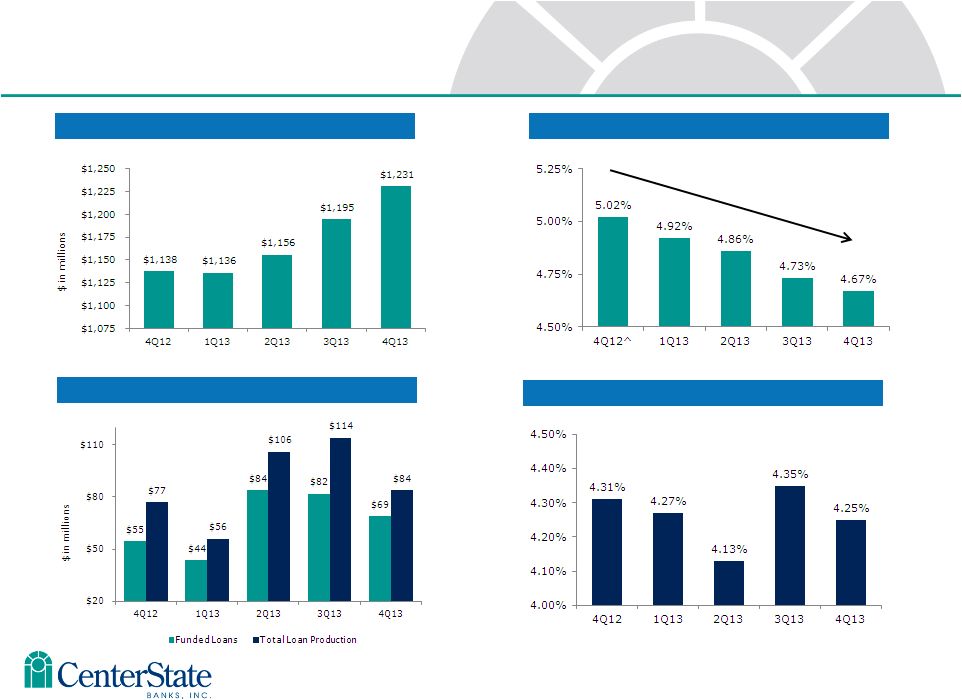
Non-Covered Loan Growth
Loan Production by Quarter
•
Current Qtr annualized growth 9.3%
•
YTD annualized growth 9.4%
•
Avg yld funded loans 4.25%
•
35% Resi
•
28% CRE
•
26% C&I
•
11% all other
•
Loan pipeline:
Current: $114M
End of 3Q13: $124M
End of 2Q13: $150M
End of 1Q13: $175M
Current Quarter Loan Production |
 Net
Income Profitability Metrics –
6 Years
10
Net Interest Margin |
 10
Efficiency Ratio
Operating Efficiencies
11
*
Efficiency
Ratio
is
defined
as
follows:
[non-interest
expense
–
intangible
amortization
–
credit
related
expenses
–
merger
related
expenses
–
other
nonrecurring
expense]
/
[net
interest
income
(fully
tax
equivalent)
+
non-interest
income
–
gain
on
sale
of
AFS
securities
–
FDIC
indemnification
revenue
–
nonrecurring
income]
**Efficiency
Ratio,
excluding
Correspondent
Banking
is
defined
as
follows:
[non-interest
expense
–
Correspondent
Banking non-
interest
expense
–
intangible
amortization
–
credit
related
expenses
–
merger
related
expenses
–
other
nonrecurring
expense]
/
[net
interest
income
(fully
tax
equivalent)
–
Correspondent
Banking
net
interest
income
+
non-interest
income
–
Correspondent
Banking
non-interest
income
–
gain
on
sale
of
AFS
securities
–
FDIC
indemnification
revenue
–
nonrecurring income] |
 12
Efficiency and Enhanced Profitability Initiatives |
 Loan Portfolio |
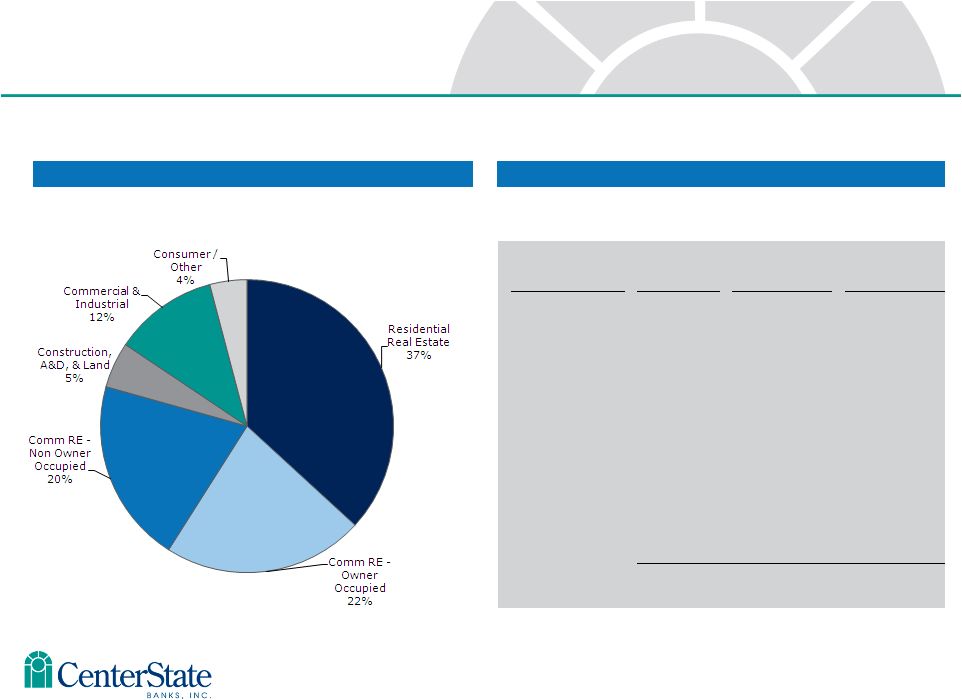 Total Loans by
Type Total Loans Detail
Loan Type
No. of
Loans
Balance
Avg Loan
Balance
Residential Real
Estate
3,798
$ 458 MM
$120,600
CRE-Owner
Occupied
743
$ 276 MM
$371,500
CRE-Non Owner
Occupied
531
$ 253 MM
$476,500
Construction,
A&D, & Land
438
$ 63 MM
$143,800
Commercial &
Industrial
1,344
$ 143 MM
$106,400
Consumer & All
Other
2,982
$ 51 MM
$17,100
Total
9,836
$ 1,244 MM
$126,500
Total
Loan
Portfolio
as
of
December
31,
2013
Excluding FDIC covered assets
14 |
 Non-Covered
Loans Non-Covered Loans -
Average Yields, FTE
Non-Covered Loans –
Average Balances
New Loan Production
New Loan Production –
Average Yields
^ Adjusted for accelerated accretion related to noncovered ASC
310-10 loans
15 |
 Covered Loans
– Average Yields*
Covered Loans –
Average Balances*
Covered Loans
16
* Adjusted for measurement period adjustment.
** Excluding accelerated accretion related to ASC 310-10 loans
|
 17
17
FDIC
Indemnification
Asset
as
of
December
31,
2013
$34M
FDIC
Reimbursement
Write-Off
$43M
Collect from Borrower
(or sale of OREO)
$40M
Expected reimbursements from FDIC for 80% of expected losses
$34M
Previously expected reimbursements for previously expected losses no longer expected
$73M
Total indemnification assets
Written off over the lesser of the remaining expected life of the related loan pool(s) or the
remaining term of the related loss share agreement(s).
Amortization of Indemnification Asset ($34M) |
 18
Indemnification Asset (“IA”) amortization and its relationship
with FDIC covered loan interest income accretion
18
Interest Income and Amortization Expense
Yields on Covered Loans and Indemnification Asset
8 Quarter Average =
4.93% |
 Credit Trends
19
NPAs / Loans & OREO (%)
NPA Inflows
Source: SNL Financial
Nonperforming assets include loans 90 days or more past due, nonaccrual loans, and
OREO/ORA; and exclude FDIC covered assets Southeastern peers include ABCB, PNFP, RNST,
SCBT, UBSH and UCBI. Florida peers include all banks headquartered in Florida with total
assets between $500 million and $5 billion. |
 20
20
ALLL –
Non-Covered Loans
FAS 5 Component
Total ALLL –
Non-Covered Loans
Loan Balance
ALLL
Loans (Fas 5)
$1,219,796
$17,883
1.47%
Impaired Loans (Fas 114)
24,110
1,811
7.51%
Total Non-Covered Loans
$1,243,906
$19,694
1.58%
ALLL as a % of NPLs=
73% |
 Deposit Portfolio |
 Total
Deposits by Type Total Deposits Detail
23
Total
Deposit
Portfolio
as
of
December
31,
2013
Deposit Type
No. of
Deposits
Balance
Avg Deposit
Balance
Demand
Deposits
38,188
$ 645 MM
$16,900
Now Accounts
50,572
$ 484 MM
$9,600
Savings
Deposits
17,564
$ 233 MM
$13,300
Money Market
3,045
$ 309 MM
$101,700
Certificates of
Deposits
11,017
$ 385 MM
$34,900
Total
120,386
$ 2,056 MM
$17,100
22 |
 Value of
core deposits not fully realized in this low rate environment.
Approximately 120,386 total accounts
-
$17,080 average balance per account
Core deposits defined as non-time deposits.
Total Deposits
Number of Deposit Accounts (000’s)
Building Franchise Value with Core Deposits
Cost of Deposits
23 |
 Acquisition of
First Southern
Bancorp, Inc. |
 25
Overview of Pro Forma Franchise
(1)
Based on financial data as of December 31, 2013 excluding purchase accounting adjustments;
previously announced branch closings are excluded
(2)
Based on financial data as of November 30, 2013
Source: CSFL Management, FSOF Management
Pro Forma Highlights
(1)
Offices:
69
Assets:
$4.1 billion
Deposits:
$3.4 billion
Loans:
$2.5 billion
CSFL Branches
CSFL & FSOF Branches
FSOF Branches
Branch overlap consolidation
•
Merging 6 branches
•
Closing 4 branches
•
Represents 12% of FSOF DDA
(2)
Significant Orlando and Jacksonville MSA
market share
South Florida extension |
   26
Florida
June '13
Total
Market
Deposits
Share
Rank
Institutions
($mm)
(%)
1
EverBank Financial
13,743
3.19
2
BankUnited Inc.
8,754
2.03
3
Bond Street Holdings Inc.
3,594
0.83
Pro Forma
3,328
0.77
4
Ocean Bankshares Inc.
2,956
0.69
5
CenterState Banks
2,464
0.57
6
Capital City Bank Group Inc.
1,757
0.41
7
Seacoast Banking Corp. of FL
1,741
0.40
8
Capital Bank Finl Corp
1,680
0.39
9
1st United Bancorp Inc.
1,485
0.34
10
Stonegate Bank
1,404
0.33
21
First Southern Bancorp Inc.
864
0.20
Totals
431,204
100.00
Orlando MSA
June '13
Total
Market
Deposits
Share
Rank
Institutions
($mm)
(%)
1
Old Florida Bancshares Inc.
1,071
2.83
Pro Forma
595
1.57
2
Three Shores Bancorp. Inc.
497
1.31
3
Villages Bancorp. Inc.
475
1.25
4
CNLBancshares Inc.
464
1.22
5
CenterState Banks
339
0.89
6
UniSouth Inc.
326
0.86
7
HomeBancorp Inc.
321
0.85
8
BANKshares Inc.
294
0.78
9
First Southern Bancorp Inc.
257
0.68
10
Citizens Bancorp of Oviedo Inc
202
0.53
Totals
37,888
100.00
Note: Includes banks headquartered in Florida
Deposit Data as of June 30, 2013
Source: SNL Financial LLC
4
th
largest Florida-based bank
2
nd
largest Florida-based bank
Strengthens Presence in Key Markets |
 27
Summary of Transaction Terms
Acquiror:
CenterState Banks, Inc. (NASDAQ: CSFL)
Target:
First Southern Bancorp, Inc. (OTCQB: FSOF)
Transaction Value
(1)
:
$189.8 million
Consideration Mix
(1) (2)
:
50% Stock / 50% Cash
Consideration Per Share
(1) (2)
:
$6.01
Per Share Consideration:
0.3 shares of CSFL stock and $3.00 cash
Price / Tangible Book Value (%)
(1) (2) (3)
:
96.3%
Capital Raise:
No additional capital required to complete the
transaction
Board Seats:
None committed
Required Approvals:
Customary regulatory approval and approval of CSFL
and FSOF shareholders
Expected Closing:
Q3 2014
Note: Financial data as of December 31, 2013
(1)
Based on CSFL’s closing price of $10.03 ended January 28, 2014
(2)
Based on 31.6 million FSOF fully diluted shares outstanding and full conversion of preferred
shares (3)
Assumes reversal of deferred tax asset |
 28
Immediately Accretive to Tangible Book Value (1.4% Accretive)
Low Double-Digit EPS Accretion Fully Phased-In (2015: 10.3% Accretive)
High Teens Internal Rate of Return (19.4%)
Strong Pro Forma Capital Ratios
Transaction Impact
Financial Impact
Capital Ratios
Pro Forma
(1)
Pro Forma at Close
TCE / TA
8.7%
8.5%
Tier 1 Leverage
9.5%
9.2%
Total Risk-Based Ratio
16.4%
14.8%
(1)
Per CSFL Management (pro forma for Gulfstream merger) |
 29
Transaction Assumptions
Cost Savings:
•
46% cost savings fully phased-in
•
$16.0 million in pre-tax savings in 2015
Merger Related Expenses
(1)
:
•
$4.6 million after-tax
Credit mark
(2)
:
•
Gross
credit
mark
to
loans
of
$28.9
million
(3)
•
10.2% mark on covered loans
•
2.5% mark on non-covered loans
•
Gross credit mark to OREO of $8.1 million
•
25% mark to OREO
Revenue Synergies:
•
None assumed
Core Deposit Intangible:
•
1.25% of transaction accounts amortized at 150% declining
balance over 10 years
First Southern Preferred Equity:
•
Assumes conversion of First Southern’s preferred equity into
common stock prior to closing
(1)
CSFL’s merger related expenses assumed to be $4.6 million; total after-tax merger
related expenses assumed to be $11.9 million
(2)
Based on financial data at November 30, 2013
(3)
Gross credit mark on book balance |
  30
Cost
Cost
2013
Savings
Savings
($mm)
(%)
($mm)
Salaries & Benefits
$16.2
51%
$8.2
Occupancy
4.1
66%
2.7
Professional & Legal
2.2
77%
1.7
Data Processing
2.1
48%
1.0
Credit
4.5
11%
0.5
Other
5.6
34%
1.9
Total Expenses
$34.7
46%
$16.0
Cost Savings Assumptions |
 31
Comprehensive review process for First Southern’s loans and OREO portfolios
•
Credit team reviewed 82% of the dollar balance of First Southern’s loan portfolio
•
Completed due diligence on 28 banks since 2008 –
all acquired banks are outperforming their initial
marks
29% of First Southern’s portfolio is covered by loss share agreements and has already
been marked •
First Commercial purchased in January 2011 with day 1 mark of 32%
•
Haven Trust purchased in September 2010 with day 1 mark of 24%
•
CSFL is marking covered loans 10.2% ($19.3 million) and legacy loans 2.5% ($9.7
million) Diligence Highlights
Credit Due Diligence
Note: Financial data as of November 30, 2013
Source: CSFL Management, FSOF Management
Non-Covered Portfolio: NPAs / Loans + OREO |
 32
First Southern Bancorp, Inc. Highlights
Note: Data as of December 31, 2013; capital ratios assume conversion of preferred shares
Source: FSOF Management and SNL Financial LLC
Founded –
1987
Significant Excess Capital
•
16.2% TCE / TA
FDIC Acquisitions
•
Haven Trust Bank Florida
•
September 2010
•
$115 million of loans
•
Loss Share Tranches: 70% -
0% -
70%
•
First Commercial Bank of Florida
•
January 2011
•
$467 million of loans
•
Loss Share Tranches: 70% -
30% -
75%
Branches –
17
•
Headquarters in Boca Raton, FL
•
Branches in:
•
West Palm Beach –
Fort Lauderdale MSA
•
Orlando MSA
•
Jacksonville MSA
Company Highlights
Total Assets -
$1,093 million
Gross Loans -
$635 million
Total Deposits -
$883 million
Financial Highlights |
 33
Pro Forma Loan Composition
(1)
Pro forma for Gulfstream acquisition excluding purchase accounting adjustments
(2)
Excludes purchase accounting adjustments
Source: CSFL Management, FSOF Management
CRE
45%
C&I
14%
Resi RE
33%
C&D
5%
Consumer
& Other
3%
CSFL Loan Composition
MRQ CSFL Yield on Loans: 5.79%
CRE
79%
C&I
4%
Resi RE
12%
C&D
5%
Consumer
& Other
0%
FSOF Loan Composition
MRQ FSOF Yield on Loans: 5.41%
CRE
54%
C&I
12%
Resi RE
28%
C&D
4%
Consumer
& Other
2%
Pro Forma Loan Composition
Dollars in thousands
For the period ended December 31, 2013
Pro Forma CSFL
(1)
FSOF
Pro Forma
(2)
Real Estate - Residential
$613,500
33.2
%
$77,826
12.2
%
$691,326
27.8
%
Real Estate - Commercial
833,185
45.0
502,095
79.0
1,335,280
53.7
Real Estate - Land, Development, & Construction
83,240
4.5
30,276
4.8
113,516
4.6
Commercial & Industrial
267,740
14.5
24,582
3.9
292,322
11.8
Consumer & Other
52,804
2.9
713
0.1
53,517
2.2
Gross Loans & Leases
$1,850,468
100.0
%
$635,492
100.0
%
$2,485,960
100.0
% |
 34
Pro Forma Deposit Composition
(1)
Pro forma for Gulfstream acquisition excluding purchase accounting adjustments
(2)
Excludes purchase accounting adjustments
Source: CSFL Management, FSOF Management
Non-
Interest
Bearing
DDA
32%
NOW,
Money
Market,
and
Savings
49%
Time
Deposits
19%
MRQ CSFL Cost of Deposits: 0.26%
CSFL Deposit Composition
Non-
Interest
Bearing
DDA
23%
NOW,
Money
Market,
and
Savings
49%
Time
Deposits
28%
FSOF Deposit Composition
MRQ FSOF Cost of Deposits: 0.47%
Non-
Interest
Bearing
DDA
30%
NOW,
Money
Market,
and
Savings
49%
Time
Deposits
21%
Pro Forma Deposit Composition
Dollars in thousands
For the period ended December 31, 2013
Pro Forma CSFL
(1)
FSOF
Pro Forma
(2)
Non-Interest Bearing DDA
$815,590
32.3
%
$204,639
23.2
%
$1,020,229
29.9
%
NOW, Money Market, and Savings
1,240,293
49.1
428,738
48.6
1,669,031
49.0
Time Deposits
469,294
18.6
249,355
28.2
718,649
21.1
Total Deposits
$2,525,178
100.0
%
$882,732
100.0
%
$3,407,910
100.0
% |
 35
Improving Market Demographics
17.1%
14.4%
16.4%
10.0%
12.5%
15.0%
17.5%
20.0%
CSFL
FSOF
Pro Forma
3.38%
3.59%
3.44%
3.00%
3.25%
3.50%
3.75%
CSFL
FSOF
Pro Forma
Projected
Population
Growth
(1)
Projected
Median
HHI
Growth
(1)
Note:
CSFL
pro
forma
for
Gulfstream
acquisition;
data
is
deposit
weighted
by
county
as
of
June
30,
2013
(1)
Projected
growth
from
2012
–
2017
Source: SNL Financial LLC
$50,299
$56,409
$51,887
$45,000
$50,000
$55,000
$60,000
CSFL
FSOF
Pro Forma
Projected 2017 Median HHI |
 |