Attached files
| file | filename |
|---|---|
| 8-K - FORM 8-K - SOUTHERN Co GAS | form_8-k.htm |
| EX-99.1 - PRESS RELEASE - SOUTHERN Co GAS | exhibit_99-1.htm |

Fourth Quarter and Year-End 2013 Earnings Presentation February 5, 2014

* $ in millions Cautionary Statements & Supplemental Information Forward-Looking Statements This presentation contains forward-looking statements. Senior officers and other employees may also make verbal statements to analysts, investors, regulators, the media and others that are forward-looking. Forward-looking statements include matters that are not historical facts, such as statements regarding our future operations, prospects, strategies, financial condition, economic performance (including growth and earnings), industry conditions and demand for our products and services. Because these statements involve anticipated events or conditions, forward-looking statements often include words such as "anticipate," "assume," "believe," "can," "could," "estimate," "expect," "forecast," "future," "goal," "indicate," "intend," "may," "outlook," "plan," "potential," "predict," "project," "seek," "should," "target," "would," or similar expressions. Forward-looking statements contained in this presentation include, without limitation, statements regarding the financial impact of the new depreciation rates for Nicor Gas, when we expect to realize earnings in the future related to our mark-to-market hedge movements, our performance expectations for the full year and our growth potential in future periods, our priorities for 2014 and our 2014 earnings guidance and related expectations and assumptions. Our expectations are not guarantees and are based on currently available competitive, financial and economic data along with our operating plans. While we believe our expectations are reasonable in view of the currently available information, our expectations are subject to future events, risks and uncertainties, and there are several factors - many beyond our control - that could cause results to differ significantly from our expectations. Actual results may differ materially from those suggested by the forward-looking statements for a number of reasons including, but not limited to, changes in price, supply and demand for natural gas and related products; the impact of changes in state and federal legislation and regulation, including changes related to climate change; actions taken by government agencies on rates and other matters, including regulatory approval of new partnerships and infrastructure programs; concentration of credit risk; utility and energy industry consolidation; the impact on cost and timeliness of construction projects by government and other approvals; development project delays; adequacy of supply of diversified vendors; unexpected change in project costs, including the cost of funds to finance these projects; the impact of acquisitions and divestitures, including the Nicor merger; limits on natural gas pipeline capacity; direct or indirect effects on our business, financial condition or liquidity resulting from a change in our credit ratings or the credit ratings of our counterparties or competitors; interest rate fluctuations; financial market conditions, including disruptions in the capital markets and lending environment and the current economic uncertainty; general economic conditions; uncertainties about environmental issues and the related impact of such issues, including our environmental remediation plans; the impact of new and proposed legislation in Illinois; the impact of changes in weather, including climate change, on the temperature-sensitive portions of our business; the impact of natural disasters such as hurricanes on the supply and price of natural gas; the outcome of litigation; acts of war or terrorism; and other factors which are provided in detail in our filings with the Securities and Exchange Commission. Forward-looking statements are only as of the date they are made, and we disclaim any obligation to update these statements to reflect subsequent changes, except as required under United States federal securities law. Supplemental Information Company management evaluates segment financial performance based on operating margin and earnings before interest and taxes (EBIT), which include the effects of corporate expense allocations. The company believes EBIT is a useful measurement of its performance because it provides information that can be used to evaluate the effectiveness of its businesses from an operational perspective, exclusive of the costs to finance those activities and exclusive of income taxes, neither of which is directly relevant to the efficiency of those operations. Further, management calculates “economic earnings” in relation to EBIT reported on a GAAP basis for the wholesale services segment in order to assess and evaluate earnings generated during the year. The company believes economic earnings is a useful measurement of the wholesale services’ segment as it provides information excluding the volatility effects resulting from mark-to-market, LOCOM accounting adjustments and gains or losses from dispositions recorded during the current period, as well as the offset of mark-to-market gains or losses reported in prior periods. Operating margin is a non-GAAP measure calculated as operating revenues minus cost of goods sold and revenue taxes, excluding operation and maintenance expense, depreciation and amortization, certain taxes other than income taxes, Nicor merger expenses and gains or losses on the sale of assets, if any. These items are included in the company's calculation of operating income. The company believes operating margin is a better indicator than operating revenues of the contribution resulting from customer growth, since cost of gas and revenue taxes are generally passed directly through to customers. In addition, in this press release AGL Resources has presented a non-GAAP measure of adjusted earnings per share (EPS) that excludes expenses incurred with respect to the Nicor merger, an additional accrual for the Nicor Gas PBR issue and the impact of our wholesale services segment. As the company does not routinely engage in transactions of the magnitude of the Nicor merger, and consequently does not regularly incur transaction and integration-related expenses of correlative size, the company believes presenting EPS excluding Nicor merger-related expenses provides investors with an additional measure of AGL Resources’ core operating performance. Examples of such expenses related to the merger and integration are: employee severance, relocation, consulting services, temporary labor and certain travel costs. The Company also has excluded the additional accrual for the Nicor Gas PBR issue as it was a one-time cost that is not expected to be recurring. In addition, the company believes that presenting EPS excluding wholesale services provides investors with additional measures of operating performance excluding the volatility effects resulting from mark-to-market and LOCOM accounting adjustments in the wholesale services segment. Details related to these adjustments will be included in the management discussion and analysis section of the Annual Report on Form 10-K. Operating margin and adjusted EPS should not be considered as alternatives to, or more meaningful indicators of, the company's operating performance than net income attributable to AGL Resources Inc., operating income or EPS as determined in accordance with GAAP. In addition, the company's operating margin and adjusted EPS may not be comparable to similarly titled measures of another company. Reconciliations of non-GAAP financial measures referenced in this presentation are available on the company’s Web site at www.aglresources.com. *

Share price rose 18% in 2013 and total shareholder return was 23% Consolidated EBIT increased 11% year-over-year with distribution operations EBIT rising 10% year-over-year Achieved several key regulatory and legislative milestones, including: Illinois infrastructure investment legislation signed into law that could allow Nicor Gas to invest capital of up to an annual average of 4% of base rate revenues Georgia Commission approval to replace 750 miles vintage plastic pipeline with capex of $275 million by December 2017 Georgia Commission approval to continue Integrated System Reinforcement Program and Integrated Customer Growth Program (under STRIDE) with combined expenditures of $260 million over four-year period New Jersey Commission approval of the Accelerated Infrastructure Replacement program, enabling Elizabethtown Gas to invest up to $115 million over a four-year period Illinois Commission approval of lower composite depreciation rate for Nicor Gas, with reduced depreciation expense of approximately $50 million on an annualized basis Solid growth in retail operations driven by innovative marketing programs and targeted acquisitions Strong commercial activity in wholesale services, offset by mark-to-market hedge losses Higher volume in cargo shipping segment 2013 Key Accomplishments *

EPS Track Record * 2013 included strong performance in distribution operations, retail operations and cargo shipping Mark-to-market accounting losses in wholesale services overwhelmed excellent commercial activity; losses expected to be offset in future periods 2010: $3.00 diluted GAAP EPS; $3.05 adjusted, excluding Nicor merger costs; 2011: $2.12 diluted GAAP EPS, $2.92 adjusted, excluding Nicor merger costs; 2012: $2.31 diluted GAAP EPS; $2.46 adjusted, excluding Nicor merger costs and Nicor Gas PBR accrual. Please see the appendix to this presentation or visit the investor relations section of www.aglresources.com for a reconciliation to GAAP. 4

Dividend Growth Track Record * 2014 indicated annual dividend rate increase of 4.3% vs. 2013 Management and the Board of Directors have demonstrated a commitment to dividend growth and have established a strong track record of regular dividend increases Increase dividend on a consistent basis, based upon sustainable cash flows primarily from distribution and retail businesses 2010 payout ratio based on adjusted EPS of $3.05; 2011 payout ratio based on adjusted EPS of $2.92; 2012 payout ratio based on adjusted EPS of $2.46. 2014 estimate assumes that Board of Directors approves each quarterly dividend. * 5
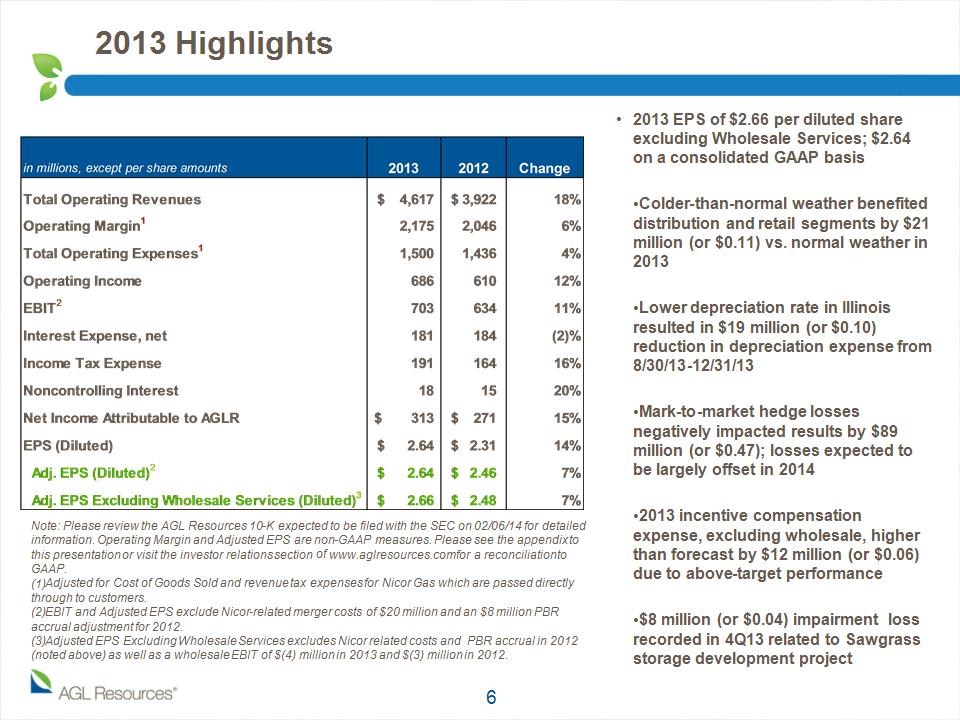
Note: Please review the AGL Resources 10-K expected to be filed with the SEC on 02/06/14 for detailed information. Operating Margin and Adjusted EPS are non-GAAP measures. Please see the appendix to this presentation or visit the investor relations section of www.aglresources.com for a reconciliation to GAAP. Adjusted for Cost of Goods Sold and revenue tax expenses for Nicor Gas which are passed directly through to customers. EBIT and Adjusted EPS exclude Nicor-related merger costs of $20 million and an $8 million PBR accrual adjustment for 2012. Adjusted EPS Excluding Wholesale Services excludes Nicor related costs and PBR accrual in 2012 (noted above) as well as a wholesale EBIT of $(4) million in 2013 and $(3) million in 2012. 2013 EPS of $2.66 per diluted share excluding Wholesale Services; $2.64 on a consolidated GAAP basis Colder-than-normal weather benefited distribution and retail segments by $21 million (or $0.11) vs. normal weather in 2013 Lower depreciation rate in Illinois resulted in $19 million (or $0.10) reduction in depreciation expense from 8/30/13-12/31/13 Mark-to-market hedge losses negatively impacted results by $89 million (or $0.47); losses expected to be largely offset in 2014 2013 incentive compensation expense, excluding wholesale, higher than forecast by $12 million (or $0.06) due to above-target performance $8 million (or $0.04) impairment loss recorded in 4Q13 related to Sawgrass storage development project 2013 Highlights *

4Q13 Highlights * millions Note:. Operating Margin and Adjusted EPS are non-GAAP measures. Please see the appendix to this presentation or visit the investor relations section of www.aglresources.com for a reconciliation to GAAP. Adjusted for Cost of Goods Sold and revenue tax expenses for Nicor Gas which are passed directly through to customers. Adjusted EPS excludes Nicor-related merger costs of $5 million and PBR accrual of $8 million for 4Q12. Adjusted EPS Excluding Wholesale Services excludes Nicor merger related costs and PBR accrual in 4Q12 (noted above) as well as wholesale EBIT of $(28) million for 4Q13 and $10 million for 4Q12. 4Q13 EPS of $0.81 per diluted share excluding Wholesale Services; $0.68 on a consolidated GAAP basis Colder-than-normal weather benefited distribution and retail segments by $10 million (or $0.05) vs. normal weather during 4Q13 Lower depreciation rate in Illinois resulted in $15 million (or $0.08) reduction in depreciation expense for 4Q13 Mark-to-market hedge losses negatively impacted results by $72 million (or $0.38); losses expected to be largely offset in 2014 $8 million (or $0.04) impairment loss recorded in 4Q13 related to Sawgrass Storage development project

2013 EBIT of $582 million, 10% higher vs. 2012 Increased infrastructure investment, colder-than-normal vs. warmer-than-normal 2012 weather and customer growth were primary margin drivers, offset by higher O&M expenses Lower depreciation rate in Illinois reduced depreciation expense by $19 million in 2013 Excluding pass-through expenses, 2013 O&M expense increased 7% year-over-year Strong expense control, offset by higher incentive compensation for 2013 due to above target performance (higher accruals reflected in 4Q13) Excluding variable compensation expense, O&M expense was up less than 2% Weather hedging program in place in Illinois and evaluated on continual basis Customer count trending up Net new customer additions were 26,081 in 2013 vs.16,613 in 2012, an increase of 57% Distribution Operations *

2013 EBIT of $137 million, up 18% vs. 2012 Primary drivers were acquisitions of retail services contracts in January 2013 and energy contracts in June 2013, as well as colder-than-normal weather 2013 Georgia weather 3% colder-than-normal and 39% colder than 2012, contributing to $19 million weather-related EBIT improvement y/y, net of weather hedges Margin improvements were offset by: $10 million decrease related to higher gas costs from lower commercial optimization opportunities and slightly lower retail price spreads, as well as increased bad debt expense related to higher revenues, and Increased O&M expenses related to acquisition of retail services contracts Customers and contracts: Retained leading market share in Georgia Retail services contracts up 65% year-over-year through December, due mainly to acquisition of warranty contracts in 1Q13 Retail Operations *

1Q13 millions 3Q13 2Q13 4Q12 4Q13 2013 EBIT of $(4) million vs. 2012 $(3) million $84 million y/y improvement in commercial activity $90 million hedge loss (including LOCOM) in 2013 vs. $7 million hedge gain (including LOCOM) in 2012 Includes $11 million EBIT gain on sale of Compass Energy in 2Q13 Strong commercial activity driven by ability to capture widening transportation spreads in Northeast region; hedge losses driven by mark-to-market treatment of active contracts that have been hedged but not settled Expect $63 million of the $73 million y/y transportation and forward commodity hedge losses to be offset in 2014 Operating margin components Wholesale Services * millions
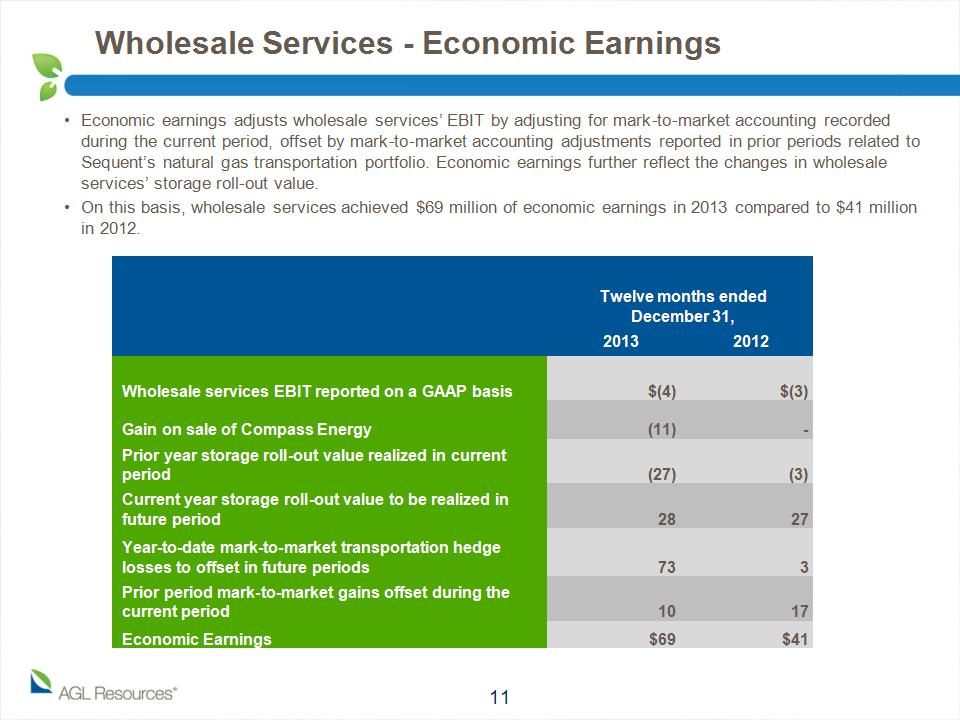
Economic earnings adjusts wholesale services’ EBIT by adjusting for mark-to-market accounting recorded during the current period, offset by mark-to-market accounting adjustments reported in prior periods related to Sequent’s natural gas transportation portfolio. Economic earnings further reflect the changes in wholesale services’ storage roll-out value. On this basis, wholesale services achieved $69 million of economic earnings in 2013 compared to $41 million in 2012. Wholesale Services – Economic Earnings * Twelve months ended December 31, Twelve months ended December 31, Wholesale services EBIT reported on a GAAP basis $(4) $(3) Gain on sale of Compass Energy (11) - Prior year storage roll-out value realized in current period (27) (3) Current year storage roll-out value to be realized in future period 28 27 Year-to-date mark-to-market transportation hedge losses to offset in future periods 73 3 Prior period mark-to-market gains offset during the current period 10 17 Economic Earnings $69 $41 2013 2012

2013 EBIT of $(10) million vs. 2012 EBIT of $10 million Declines driven primarily by $8 million 4Q13 loss related to discontinuation of Sawgrass Storage development project, as well as recontracting capacity at current market rates (primarily at Jefferson Island) Market remains challenging; uncontracted capacity being managed with short-term contracts until conditions improve Midstream Operations * millions Contracted storage capacity as of 12/31/13 Subscribed firm capacity includes 1.5 Bcf at Jefferson Island and 2 Bcf at GTS that are contracted by Sequent.
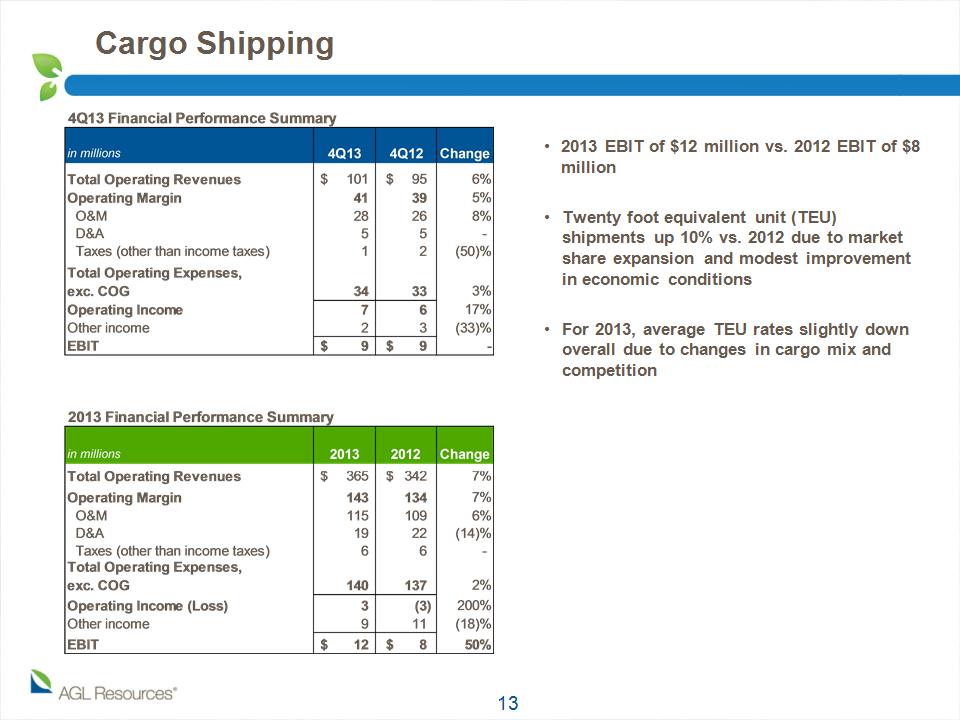
2013 EBIT of $12 million vs. 2012 EBIT of $8 million Twenty foot equivalent unit (TEU) shipments up 10% vs. 2012 due to market share expansion and modest improvement in economic conditions For 2013, average TEU rates slightly down overall due to changes in cargo mix and competition Cargo Shipping * millions

Solid balance sheet with significant opportunity to fund capital requirements Good access to capital markets Company credit metrics support solid, investment-grade ratings $5.0 billion debt outstanding Long-term debt $3.8 billion Short-term debt of $1.2 billion Debt to Cap Ratio: 57% Received unaminous lender approval to extend existing AGL Capital and Nicor Gas credit facilities by one-year to 4Q17 Moody’s upgraded the senior unsecured credit ratings of AGL Resources and its subsidiaries on 1/31/14; AGL Capital upgraded from Baa1 to A3 Balance Sheet Highlights * millions
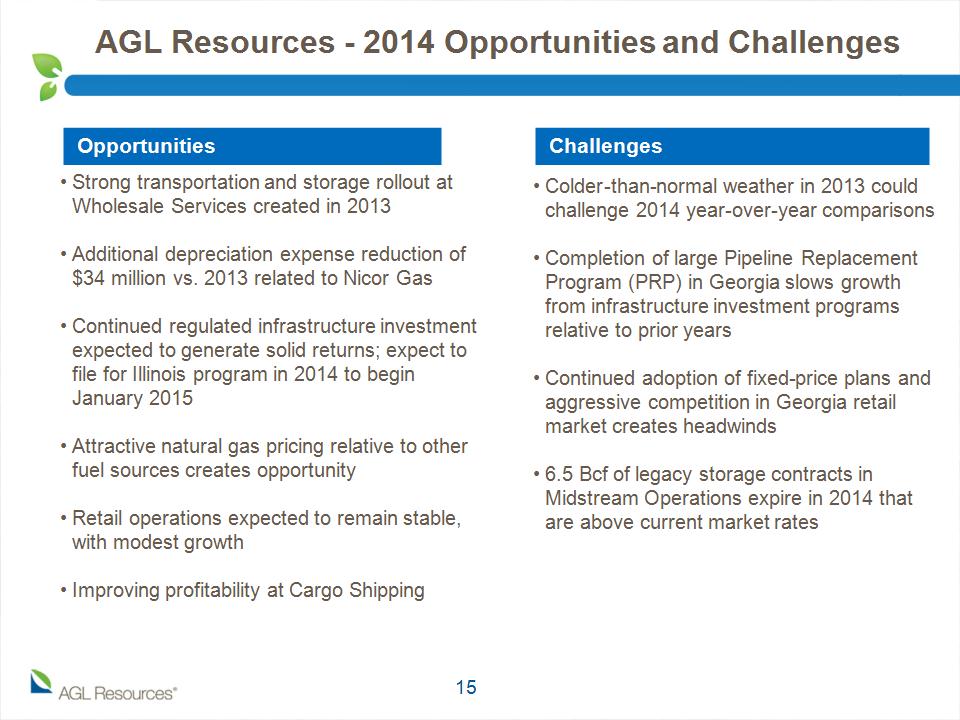
AGL Resources - 2014 Opportunities and Challenges Colder-than-normal weather in 2013 could challenge 2014 year-over-year comparisons Completion of large Pipeline Replacement Program (PRP) in Georgia slows growth from infrastructure investment programs relative to prior years Continued adoption of fixed-price plans and aggressive competition in Georgia retail market creates headwinds 6.5 Bcf of legacy storage contracts in Midstream Operations expire in 2014 that are above current market rates Opportunities Challenges Strong transportation and storage rollout at Wholesale Services created in 2013 Additional depreciation expense reduction of $34 million vs. 2013 related to Nicor Gas Continued regulated infrastructure investment expected to generate solid returns; expect to file for Illinois program in 2014 to begin January 2015 Attractive natural gas pricing relative to other fuel sources creates opportunity Retail operations expected to remain stable, with modest growth Improving profitability at Cargo Shipping *

2014 EPS Guidance Excluding Wholesale Services *

2013 EBIT to 2014 Estimated EBIT Excluding Wholesale * Year-over-year EBIT increase of 7% on a weather-normalized basis

2013 EBIT to 2014 Estimated EBIT – Distribution * Year-over-year EBIT increase of 4.4% on a weather-normalized basis Rate base growth ~5.2%

2014 Guidance Assumptions * AGL Resources expects diluted EPS excluding wholesale services to be in the range of $2.70 - $2.80 for 2014 2014 wholesale services economic earnings expected to be $69 million, in line with 2013; GAAP earnings on a per share basis for wholesale services segment expected to be $0.70, excluding mark-to-market impacts in 2014 (reflects the offset of hedge losses in 2013 related to 2014 transactions, average-year economic generation and incremental economic earnings related to significant market volatility in early 2014) Key assumptions include: Normal weather Exclusion of mark-to-market impacts Pension expense of $38 million to $43 million, before capitalizations Interest expense of $193 million to $197 million Average diluted shares outstanding of 119.4 million Effective tax rate of 37.9% Successful implementation of regulatory infrastructure and rate programs Approximate quarterly earnings contribution percentages Distribution: 1Q – 35%; 2Q – 20%; 3Q – 15%; 4Q – 30% Retail: 1Q – 50%; 2Q – 15%; 3Q – 5%; 4Q – 30% Midstream: 1Q – 15%; 2Q – 35%; 3Q – 25%; 4Q – 25% Cargo Shipping: Expected primarily in 4Q $790 million in consolidated capex, with approximately $740 million in the distribution operations segment, of which 22% is covered under rider-based programs
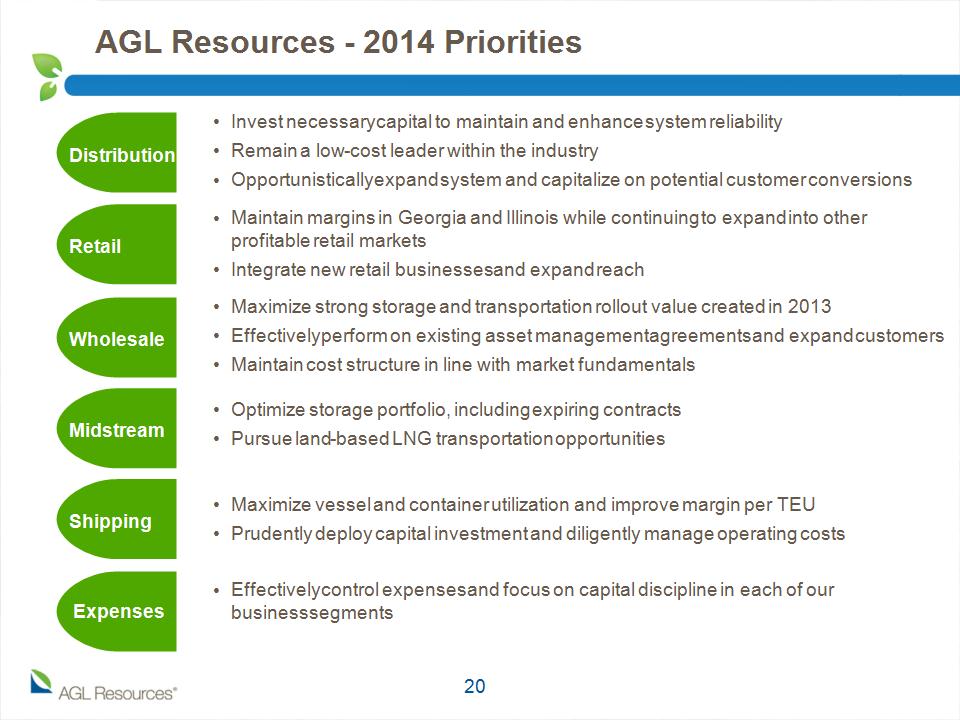
AGL Resources - 2014 Priorities Invest necessary capital to maintain and enhance system reliability Remain a low-cost leader within the industry Opportunistically expand system and capitalize on potential customer conversions Maintain margins in Georgia and Illinois while continuing to expand into other profitable retail markets Integrate new retail businesses and expand reach Maximize strong storage and transportation rollout value created in 2013 Effectively perform on existing asset management agreements and expand customers Maintain cost structure in line with market fundamentals Optimize storage portfolio, including expiring contracts Pursue land-based LNG transportation opportunities Effectively control expenses and focus on capital discipline in each of our business segments Maximize vessel and container utilization and improve margin per TEU Prudently deploy capital investment and diligently manage operating costs Distribution Expenses Wholesale Midstream Shipping Retail 20

Appendix *

Debt Maturities * millions redeemed millions

Rate Case History * millions redeemed Utility Last Rate Case Key Outcomes Nicor Gas Mar. 2009 (Stay out in place until December 2014) $80 million rate increase Bad debt rider approved in February 2010 providing recovery from (or credit to) customers the difference of actual expense and $63 million benchmark Rate case reset heating degree days from 5,830 to 5,600 Atlanta Gas Light Oct. 2010 $27 million rate increase approved Included ~$10 million in new customer service and safety programs Adopted new acquisition synergy sharing policy; begin sharing $5 million annually in 2014 with Georgia customers Virginia Natural Gas Dec. 2011 $11 million rate increase in base rates Recovery of $3.1 million in costs previously recovered through base rates now recovered through PGA Approval to recover gas portion of bad debts through the PGA Elizabethtown Gas Dec. 2009 $3 million rate increase New depreciation rates decreased expense $5 million Two-year rate freeze concluded in 2011 Rate case filing requirement for Sept. 2016 in conjunction with AIR approval Florida City Gas Feb. 2004 $7 million rate increase Approval in late 2007 to include acquisition adjustment amortization expense in operating income and acquisition adjustment asset balance in rate base for regulatory surveillance reporting purposes Chattanooga Gas May 2010 Instituted new rate design that encourages customer conservation First decoupled rate design for TN utility New depreciation rates decreased expense of $2 MM annually

GAAP Reconciliation * The following tables set forth a reconciliation of AGL Resources’ Statement of Income to earnings before interest and taxes (EBIT) by segment for the quarter and year-ended December 31, 2013.

GAAP Reconciliation * The following tables set forth a reconciliation of AGL Resources’ Statement of Income to earnings before interest and taxes (EBIT) by segment for the quarter and year-ended December 31, 2012.

GAAP Reconciliation * The following table provides a reconciliation of AGL Resources’ operating margin to operating income for the quarters and years ended December 31, 2013 and 2012.
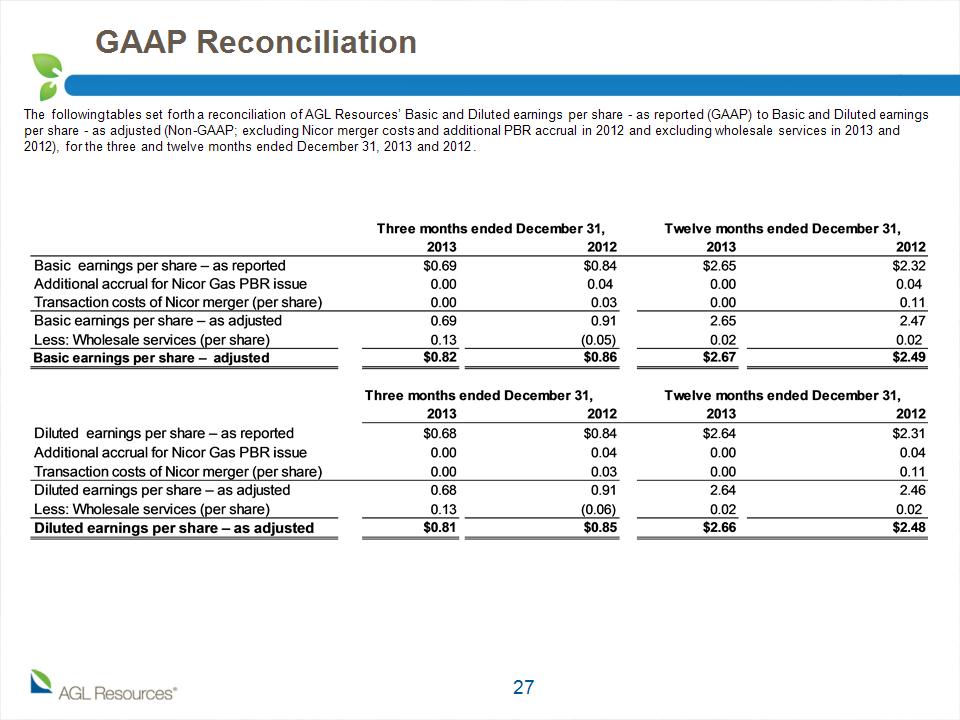
GAAP Reconciliation * The following tables set forth a reconciliation of AGL Resources’ Basic and Diluted earnings per share – as reported (GAAP) to Basic and Diluted earnings per share – as adjusted (Non-GAAP; excluding Nicor merger costs and additional PBR accrual in 2012 and excluding wholesale services in 2013 and 2012), for the three and twelve months ended December 31, 2013 and 2012.