Attached files
| file | filename |
|---|---|
| 8-K - 8-K - W R GRACE & CO | a8-kx121213presentation.htm |

W. R. Grace & Co. December 12, 2013 Analyst and Investor Conference Call © 2013 W. R. Grace & Co.

2 © 2013 W. R. Grace & Co. Disclaimer Safe Harbor Statement under the Private Securities Litigation Reform Act of 1995 This presentation contains forward-looking statements, that is, statements related to future, not past, events. Such statements generally include the words “believes,” “plans,” “intends,” “targets,” “will,” “expects,” “suggests,” “anticipates,” “outlook,” “continues” or similar expressions. Forward-looking statements include, without limitation, all statements regarding Grace’s Chapter 11 case; expected financial positions; results of operations; cash flows; financing plans; business strategy; budgets; capital and other expenditures; competitive positions; growth opportunities for existing products; benefits from new technology and cost reduction initiatives, plans and objectives; and markets for securities. For these statements, Grace claims the protection of the safe harbor for forward-looking statements contained in the Private Securities Litigation Reform Act of 1995. Like other businesses, Grace is subject to risks and uncertainties that could cause its actual results to differ materially from its projections or that could cause other forward-looking statements to prove incorrect. Factors that could cause actual results to materially differ from those contained in the forward-looking statements include, without limitation: developments affecting Grace’s bankruptcy, proposed plan of reorganization and settlements with certain creditors, the cost and availability of raw materials (including rare earth) and energy, developments affecting Grace’s underfunded and unfunded pension obligations, risks related to foreign operations, especially in emerging regions, acquisitions and divestitures of assets and gains and losses from dispositions or impairments, the effectiveness of its research and development and growth investments, its legal and environmental proceedings, costs of compliance with environmental regulation and those factors set forth in Grace’s most recent Annual Report on Form 10-K, quarterly report on Form 10-Q and current reports on Form 8-K, which have been filed with the Securities and Exchange Commission and are readily available on the Internet at www.sec.gov. Reported results should not be considered as an indication of future performance. Readers are cautioned not to place undue reliance on Grace’s projections and forward-looking statements, which speak only as of the date thereof. Grace undertakes no obligation to publicly release any revisions to the forward-looking statements contained in this presentation, or to update them to reflect events or circumstances occurring after the date of this presentation. Non-GAAP Financial Terms These slides contain certain “non-GAAP financial terms” which are defined in the Appendix.
3 © 2013 W. R. Grace & Co. Today’s discussion UNIPOLTM acquisition Emergence status Mark-to-market pension accounting Q&A

4 © 2013 W. R. Grace & Co. Valuation of UNIPOL Polypropylene Licensing & Catalyst Products Business in $ millions UNIPOL Purchase price 500 Sales ~120 Trailing normalized EBITDA ~45 Adjusted EBIT ROIC: at Q3 2013 at Q3 with UNIPOL investment 34% 25% Valuation multiples: Ex synergies With synergies 11.1x 9.2x 11.1 12.4 11.6 9.2 0 5 10 15 UNIPOL Sud Chemie Wholeco Englehard Wholeco Ex synergies With synergies UNIPOL acquisition appropriately valued compared with similar transactions EBITDA Multiple Synergies: • Operating cost savings • Capital expenditure avoidance • Two years to fully achieve synergies Rare opportunity to acquire a high quality, sizable catalyst business
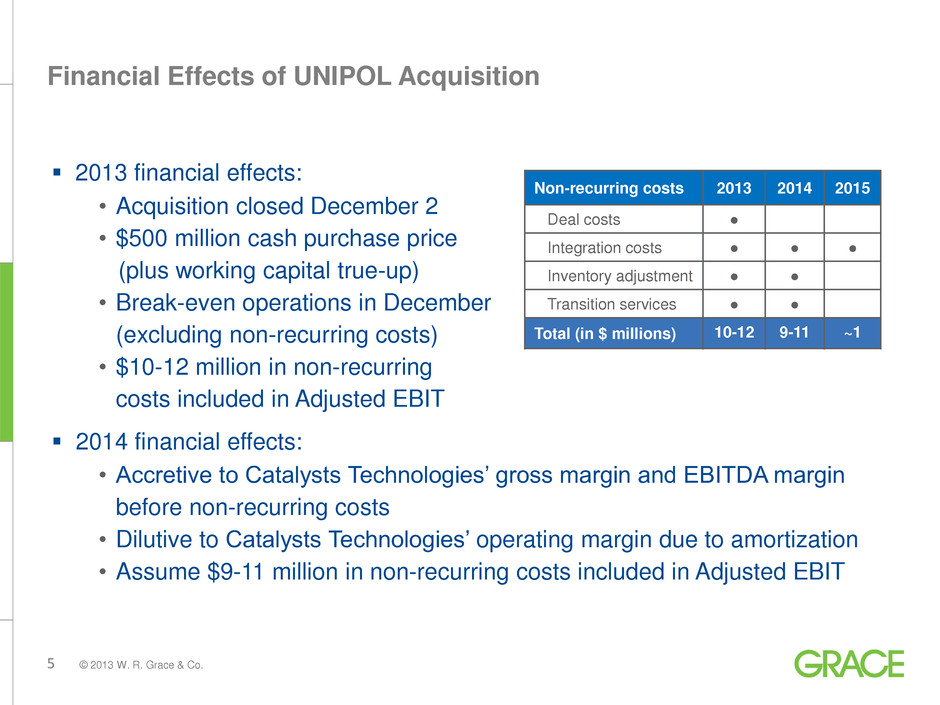
5 © 2013 W. R. Grace & Co. Financial Effects of UNIPOL Acquisition 2013 financial effects: • Acquisition closed December 2 • $500 million cash purchase price (plus working capital true-up) • Break-even operations in December (excluding non-recurring costs) • $10-12 million in non-recurring costs included in Adjusted EBIT 2014 financial effects: • Accretive to Catalysts Technologies’ gross margin and EBITDA margin before non-recurring costs • Dilutive to Catalysts Technologies’ operating margin due to amortization • Assume $9-11 million in non-recurring costs included in Adjusted EBIT Non-recurring costs 2013 2014 2015 Deal costs ● Integration costs ● ● ● Inventory adjustment ● ● Transition services ● ● Total (in $ millions) 10-12 9-11 ~1
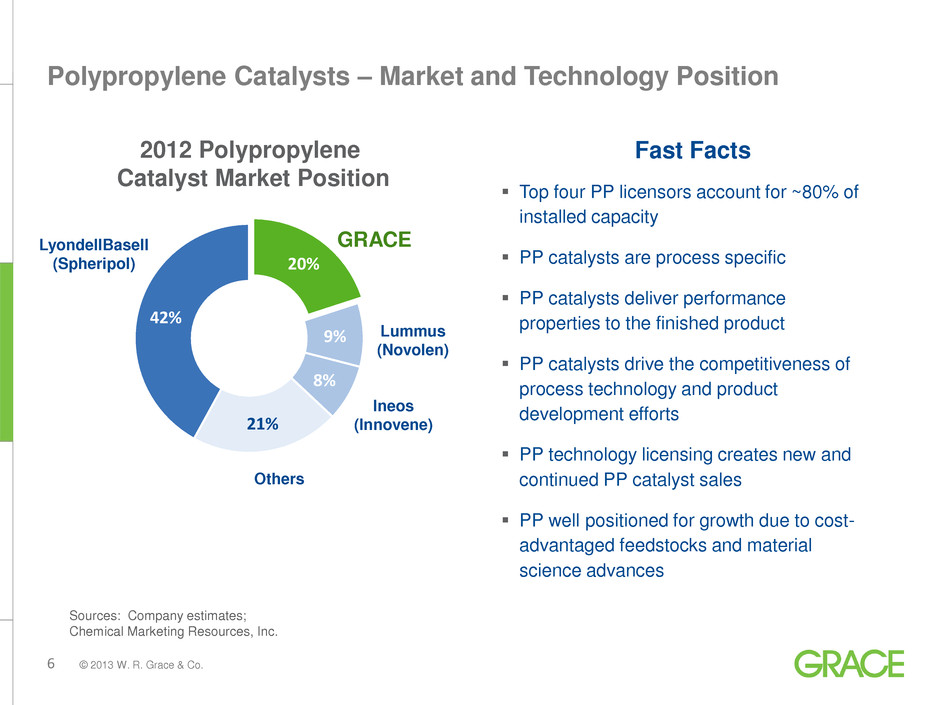
6 © 2013 W. R. Grace & Co. Polypropylene Catalysts – Market and Technology Position Fast Facts Top four PP licensors account for ~80% of installed capacity PP catalysts are process specific PP catalysts deliver performance properties to the finished product PP catalysts drive the competitiveness of process technology and product development efforts PP technology licensing creates new and continued PP catalyst sales PP well positioned for growth due to cost- advantaged feedstocks and material science advances 20% 9% 8% 21% 42% 2012 Polypropylene Catalyst Market Position Sources: Company estimates; Chemical Marketing Resources, Inc. GRACE LyondellBasell (Spheripol) Lummus (Novolen) Others Ineos (Innovene)

7 © 2013 W. R. Grace & Co. 1950-60s – Slurry loop HDPE invented using Grace Cr-silica catalyst 1970-80s – Gas phase LLDPE using Z-N catalyst supported on Grace silica; Magnapore® Cr- based PE catalyst developed for advanced applications 1990-2000s – Single site, metallocene catalyst for high strength PE film applications supported on Grace silica 2002 – Acquired Z-N technology for PE and PP 2005 – Acquired single site technology for PE and PP catalysts 2006 – Acquired PP catalyst manufacturing capacity 2010 – Acquired Synthetech for single site and PP catalyst manufacturing 2011 – Expanded PP catalyst manufacturing capacity 2012 – Launched HYAMPPTM, 6th generation non- phthalate PP catalyst with Dow 2013 – Acquired UNIPOL business UNIPOL acquisition represents a further step in growing our polyolefin catalyst franchise Leadership position began with PE catalyst innovation in 1950s Strategic investment in PP catalyst technology accelerated in 2000s Innovating and commercializing polyolefin catalysts for >60 years

8 © 2013 W. R. Grace & Co. What UNIPOL Brings to Grace An integrated PP technology licensing and catalysts business • One North American manufacturing facility Highly skilled sales, licensing, R&D, tech service and operations teams • Strong cultural fit Leading PP catalyst technology complementary to Grace’s current offering • Broadens our specialty catalysts product line • Enhances our ability to address customer needs Long-standing customer base; established positions in high-growth regions Acquisition enhances GRA’s ability to innovate new PP catalyst technology as a strategic partner to our customers
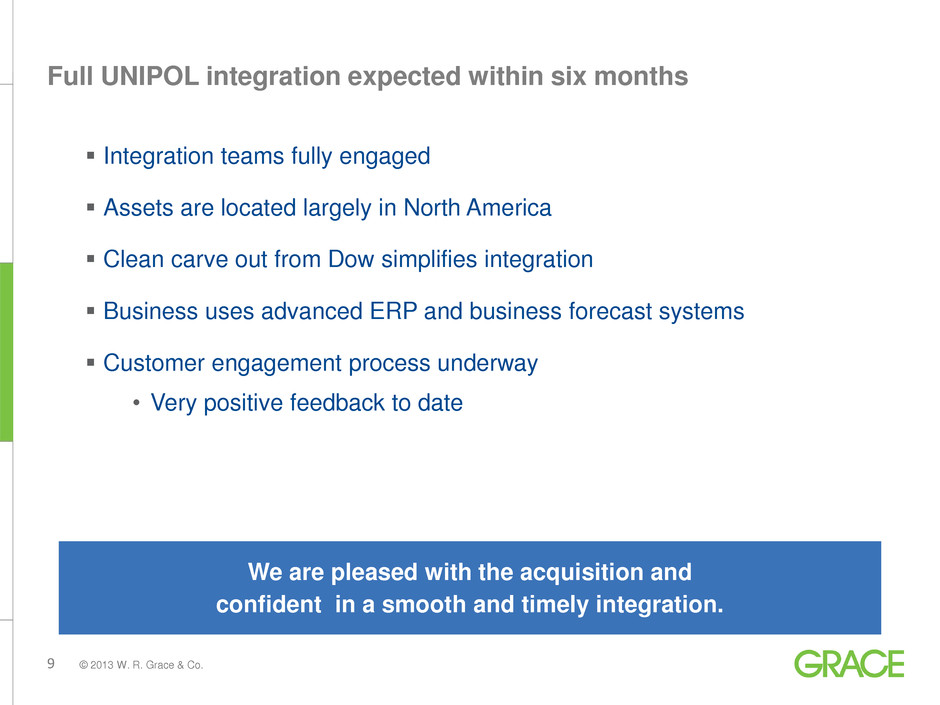
9 © 2013 W. R. Grace & Co. Full UNIPOL integration expected within six months Integration teams fully engaged Assets are located largely in North America Clean carve out from Dow simplifies integration Business uses advanced ERP and business forecast systems Customer engagement process underway • Very positive feedback to date We are pleased with the acquisition and confident in a smooth and timely integration.

10 © 2013 W. R. Grace & Co. Emergence Status Jun Jul Aug Sep Oct Nov Dec Jan 2014 Feb Mar Default Interest Appeal opinion pending as of December 12, 2013 Garlock SCOTUS appeal window X X Asb e s to s -r e la ted a ppe a ls Anderson Memorial SCOTUS appeal window X No en banc appeal Montana SCOTUS appeal window X No en banc appeal Canada SCOTUS appeal window X No en banc appeal N o f ur th e r a p p e a ls Third Circuit Court deliberation En banc appeal window En banc appeal extension = appeal denied X SCOTUS appeal window Emergence: • Will require ~60 days to process and file documents with the bankruptcy court • Waiting on default interest opinion

11 © 2013 W. R. Grace & Co. Emergence Financing Emergence financing estimated at $800 million based on: • UNIPOL acquisition • Partial coverage of warrant settlement • Additional liquidity for general corporate purposes Floating-rate term loan most probable financing structure • Attractive cost, term and covenants • Some floating rate exposure may be hedged • Revolving credit facility of $400 million Emergence financing provides appropriate base layer for long-term capital structure
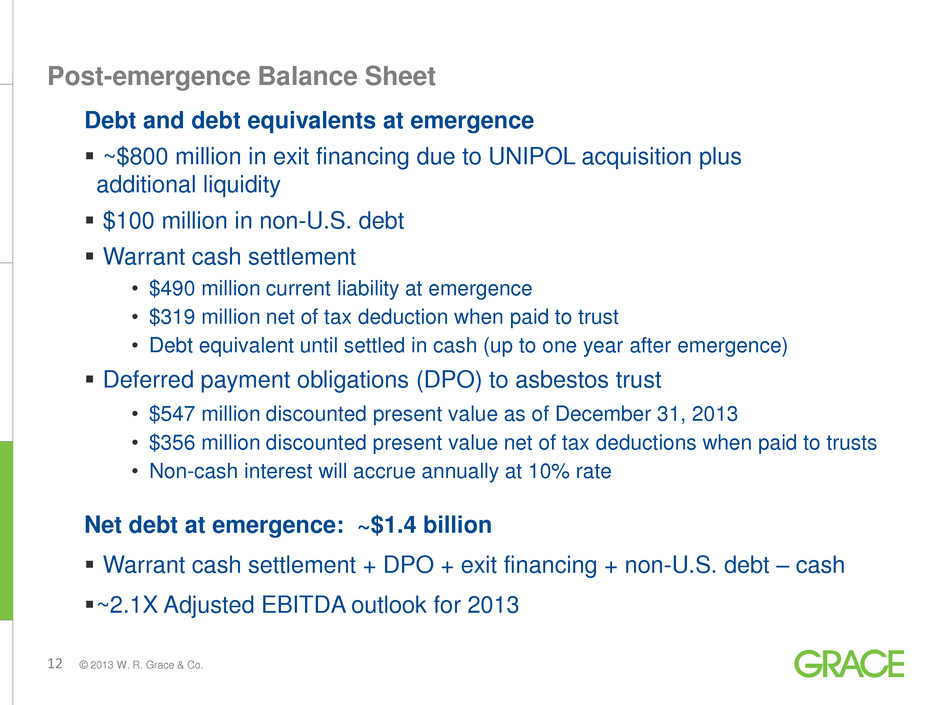
12 © 2013 W. R. Grace & Co. Post-emergence Balance Sheet Debt and debt equivalents at emergence ~$800 million in exit financing due to UNIPOL acquisition plus additional liquidity $100 million in non-U.S. debt Warrant cash settlement • $490 million current liability at emergence • $319 million net of tax deduction when paid to trust • Debt equivalent until settled in cash (up to one year after emergence) Deferred payment obligations (DPO) to asbestos trust • $547 million discounted present value as of December 31, 2013 • $356 million discounted present value net of tax deductions when paid to trusts • Non-cash interest will accrue annually at 10% rate Net debt at emergence: ~$1.4 billion Warrant cash settlement + DPO + exit financing + non-U.S. debt – cash ~2.1X Adjusted EBITDA outlook for 2013

13 © 2013 W. R. Grace & Co. Mark-to-market pension accounting Form 8K issued with updated annual and quarterly financials 2013 Adjusted EBITDA benefit of ~$45 million as previously noted Other changes: • Portion of pension expense will be reclassified to cost of goods sold • Remaining pension expense will be included in SG&A P&L presentation further updated: • Restructuring and environmental expenses combined with other income/expense • Adding line for interest accretion on DPO (non-cash item)

14 © 2013 W. R. Grace & Co. For additional information, please visit www.grace.com or contact: J. Mark Sutherland Vice President, Investor Relations +1 410.531.4590 Mark.Sutherland@grace.com David Joseph Finance Manager, Investor Relations +1 410.531.4590 David.Joseph@grace.com
15 © 2013 W. R. Grace & Co. Appendix: Definitions of Non-GAAP Measures Non-GAAP Financial Terms Adjusted EBIT means net income adjusted for interest income and expense, income taxes, costs related to Chapter 11, asbestos-related costs, restructuring expenses and related asset impairments, certain costs related to divested businesses, product lines, and certain other investments and gains and losses on sales of businesses, product lines, and certain other investments. In the 2013 first quarter, we also adjusted for the currency transaction loss incurred on our Venezuelan cash balances of $6.9 million. Adjusted EBITDA means Adjusted EBIT adjusted for depreciation and amortization. Adjusted Free Cash Flow means net cash provided by or used for operating activities minus capital expenditures plus the net cash flow from costs related to Chapter 11, cash paid to resolve contingencies subject to Chapter 11, accelerated payments under defined benefit pension arrangements, and expenditures for asbestos-related items. Grace uses Adjusted Free Cash Flow as a liquidity measure to evaluate its ability to generate cash to support its ongoing business operations, to invest in its businesses, and to provide a return of capital to shareholders. Adjusted Free Cash Flow also has material limitations as a liquidity measure because it excludes the cash flow effects of capital expenditures plus the net cash flow from Chapter 11 expenses paid, cash paid to resolve contingencies subject to Chapter 11, accelerated payments under defined pension arrangements, and expenditures for asbestos-related items, which historically have been material components of our operations. Adjusted Free Cash Flow should be evaluated together with net cash provided by or used for operating activities as measured under GAAP for a complete understanding of Grace's operating cash flows. Adjusted Earnings Per Share (EPS) means Diluted EPS adjusted for costs related to Chapter11, asbestos-related costs, restructuring expenses and related asset impairments, certain costs related to divested businesses, product lines, and certain other investments and gains and losses on sales of businesses, product lines, and certain other investments, and certain discrete tax items. In the 2013 first quarter, we also adjusted for the currency transaction loss incurred on our Venezuelan cash balances of $0.09 per share. Adjusted EBIT Return On Invested Capital means Adjusted EBIT (on a trailing four quarters basis) divided by the sum of net working capital, properties and equipment and certain other assets and liabilities. We use Adjusted EBIT as a performance measure in significant business decisions and in determining certain incentive compensation. We use Adjusted EBIT as a performance measure because it provides improved period-to-period comparability for decision making and compensation purposes, and because it better measures the ongoing earnings results of our strategic and operating decisions by excluding the earnings effects of our Chapter 11 proceedings, asbestos liabilities, restructuring activities, and divested businesses. Adjusted EBIT, Adjusted EBITDA, Adjusted Free Cash Flow, Adjusted EPS, and Adjusted EBIT Return On Invested Capital do not purport to represent income measures as defined under U.S. GAAP, and should not be used as alternatives to such measures as an indicator of our performance. These measures are provided to investors and others to improve the period-to-period comparability and peer-to-peer comparability of our financial results, and to ensure that investors understand the information we use to evaluate the performance of our businesses. We have provided in the following tables a reconciliation of these non-GAAP measures to the most directly comparable financial measure calculated and presented in accordance with U.S. GAAP. Adjusted EBIT has material limitations as an operating performance measure because it excludes Chapter 11- and asbestos-related costs and may exclude income and expenses from restructuring activities and divested businesses, which historically have been material components of our net income. Adjusted EBITDA also has material limitations as an operating performance measure because it excludes the impact of depreciation and amortization expense. Our business is substantially dependent on the successful deployment of capital, and depreciation and amortization expense is a necessary element of our costs. We compensate for the limitations of these measurements by using these indicators together with net income as measured under U.S. GAAP to present a complete analysis of our results of operations. Adjusted EBIT and Adjusted EBITDA should be evaluated together with net income measured under U.S. GAAP for a complete understanding of our results of operations.
