Attached files
| file | filename |
|---|---|
| 8-K - 8-K - BOISE CASCADE Co | bcc8-kic121113.htm |
0 Boise Cascade Company Investor Presentation July 2013 Investor Presentation December 2013
1 Forward-Looking Statements / Non-GAAP Financial Measures Forward-Looking Statements During the course of this presentation, we may make forward-looking statements or provide forward- looking information. All statements that address expectations or projections about the future are forward-looking statements. Some of these statements include words such as “expects,” “anticipates,” “believes,” “estimates,” “plans,” “intends,” “projects,” and “indicates.” Although they reflect our current expectations, these statements are not guarantees of future performance, but involve a number of risks, uncertainties, and assumptions which are difficult to predict. Some of the factors that may cause actual outcomes and results to differ materially from those expressed in, or implied by, the forward- looking statements include, but are not necessarily limited to, general economic conditions, competitive pressures, the commodity nature of the Company’s products and their price movements, raw material costs and availability, and the ability to retain key employees. The Company does not undertake to update any forward-looking statements as a result of future developments or new information. Non-GAAP Financial Measures Included in this presentation are certain non-GAAP financial measures, including EBITDA and Adjusted EBITDA, designed to complement the financial information presented in accordance with generally accepted accounting principles in the United States of America because management believes such measures are useful to investors. Our non-GAAP financial measures are not necessarily comparable to other similarly titled captions of other companies due to potential inconsistencies in the metrics of calculation. For a reconciliation of net income (loss) to EBITDA and Adjusted EBITDA and segment income (loss) to segment EBITDA and Adjusted EBITDA, see the Appendix to this presentation.
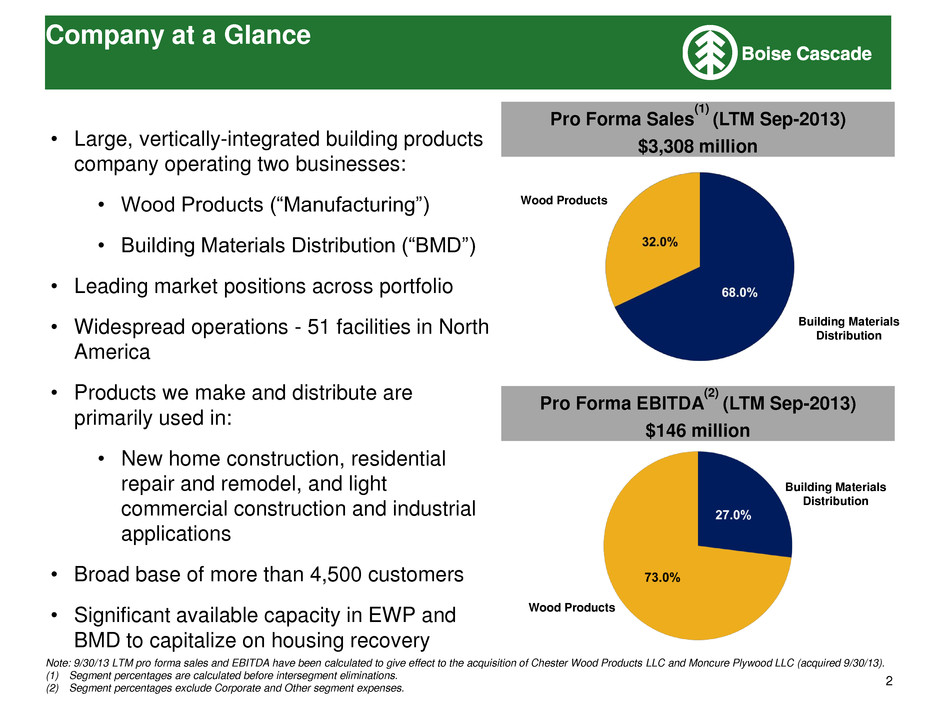
2 Company at a Glance Pro Forma Sales (1) (LTM Sep-2013) $3,308 million Note: 9/30/13 LTM pro forma sales and EBITDA have been calculated to give effect to the acquisition of Chester Wood Products LLC and Moncure Plywood LLC (acquired 9/30/13). (1) Segment percentages are calculated before intersegment eliminations. (2) Segment percentages exclude Corporate and Other segment expenses. • Large, vertically-integrated building products company operating two businesses: • Wood Products (“Manufacturing”) • Building Materials Distribution (“BMD”) • Leading market positions across portfolio • Widespread operations - 51 facilities in North America • Products we make and distribute are primarily used in: • New home construction, residential repair and remodel, and light commercial construction and industrial applications • Broad base of more than 4,500 customers • Significant available capacity in EWP and BMD to capitalize on housing recovery 70% Pro Forma EBITDA (2) (LTM Sep-2013) $146 million Wood Products Wood Products Building Materials Distribution Building Materials Distribution
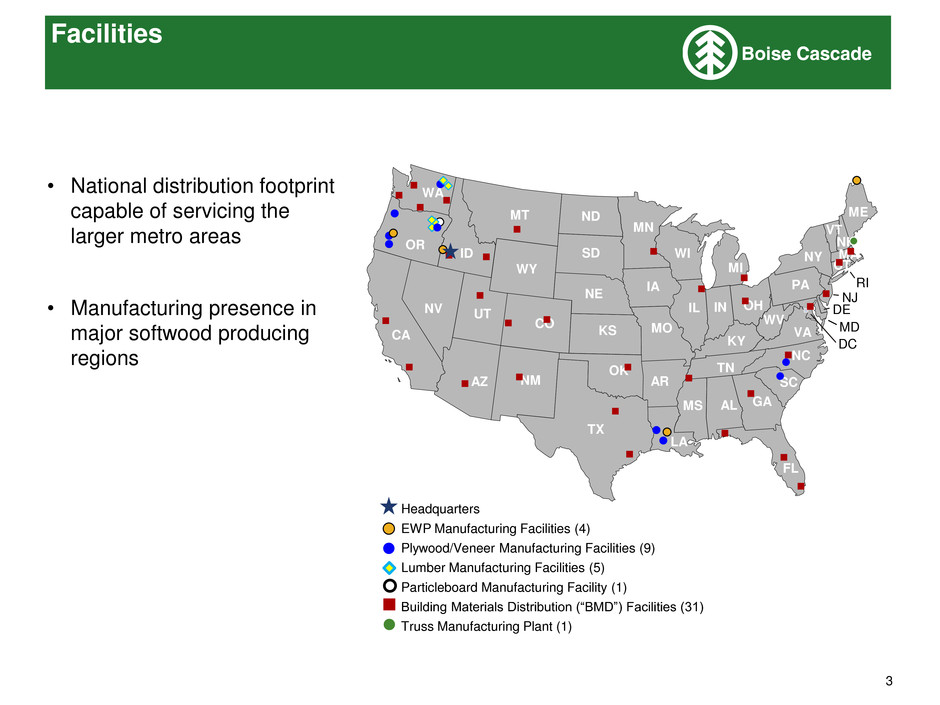
3 Facilities ID FL NM DE MD TX OK KS NE SD ND MT WY CO UT AZ NV WA CA OR KY ME NY VT NH MA RI CT WV IN IL NC TN SC AL MS AR LA MO IA MN WI NJ GA DC VA MI OH PA Headquarters EWP Manufacturing Facilities (4) Plywood/Veneer Manufacturing Facilities (9) Lumber Manufacturing Facilities (5) Particleboard Manufacturing Facility (1) Building Materials Distribution (“BMD”) Facilities (31) Truss Manufacturing Plant (1) • National distribution footprint capable of servicing the larger metro areas • Manufacturing presence in major softwood producing regions
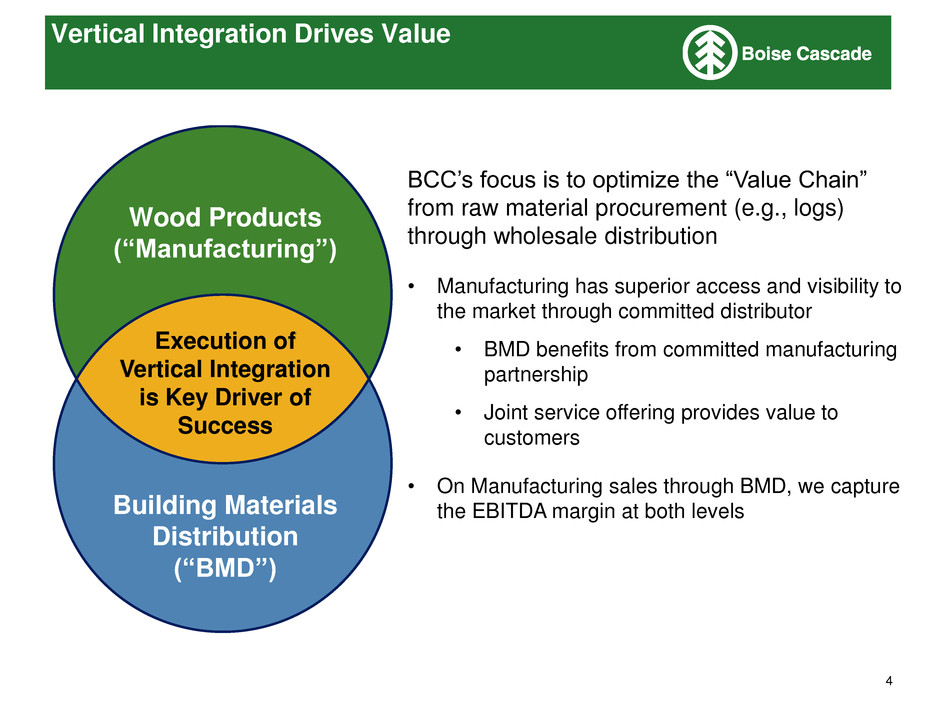
4 BCC’s focus is to optimize the “Value Chain” from raw material procurement (e.g., logs) through wholesale distribution • Manufacturing has superior access and visibility to the market through committed distributor • BMD benefits from committed manufacturing partnership • Joint service offering provides value to customers • On Manufacturing sales through BMD, we capture the EBITDA margin at both levels Vertical Integration Drives Value Building Materials Distribution (“BMD”) Execution of Vertical Integration is Key Driver of Success Wood Products (“Manufacturing”)

5 • Market leading positions across portfolio • #2 EWP producer in North America • #2 plywood producer in North America • Leading producer of Ponderosa Pine lumber • Vertically-integrated from logs to distribution • Allows for optimization and reliable supply • Long-term wood supply agreements • Accounts for ~40% of log consumption Wood Products Manufacturing Segment Description Pro Forma Sales(1) by Product (LTM Sep-2013) (1) Gives effect to the acquisition of Chester Wood Products LLC and Moncure Plywood LLC (acquired 9/30/13).
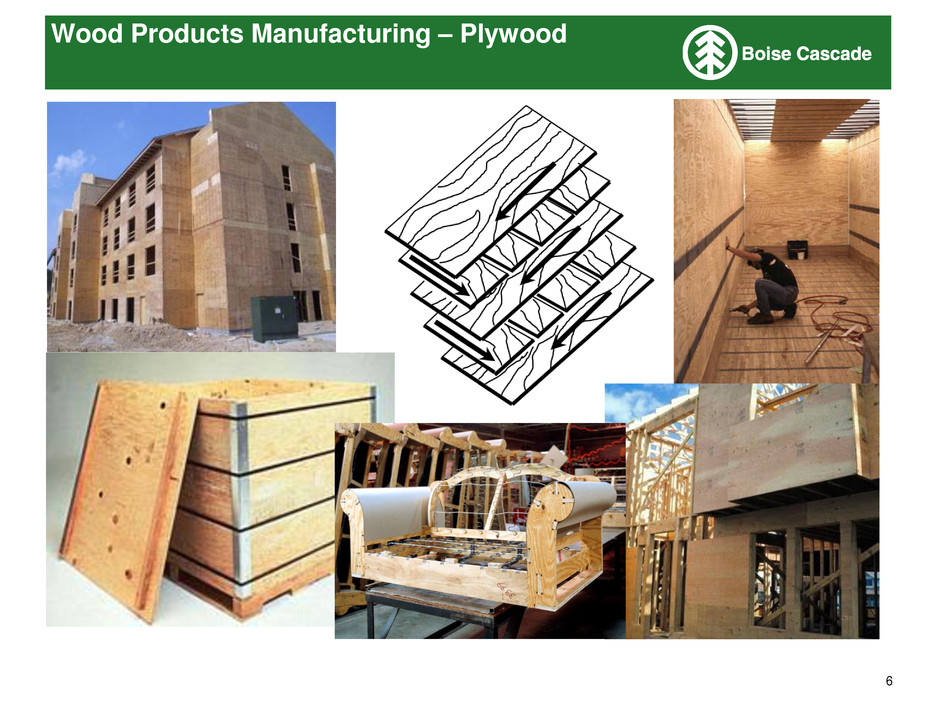
6 Wood Products Manufacturing – Plywood
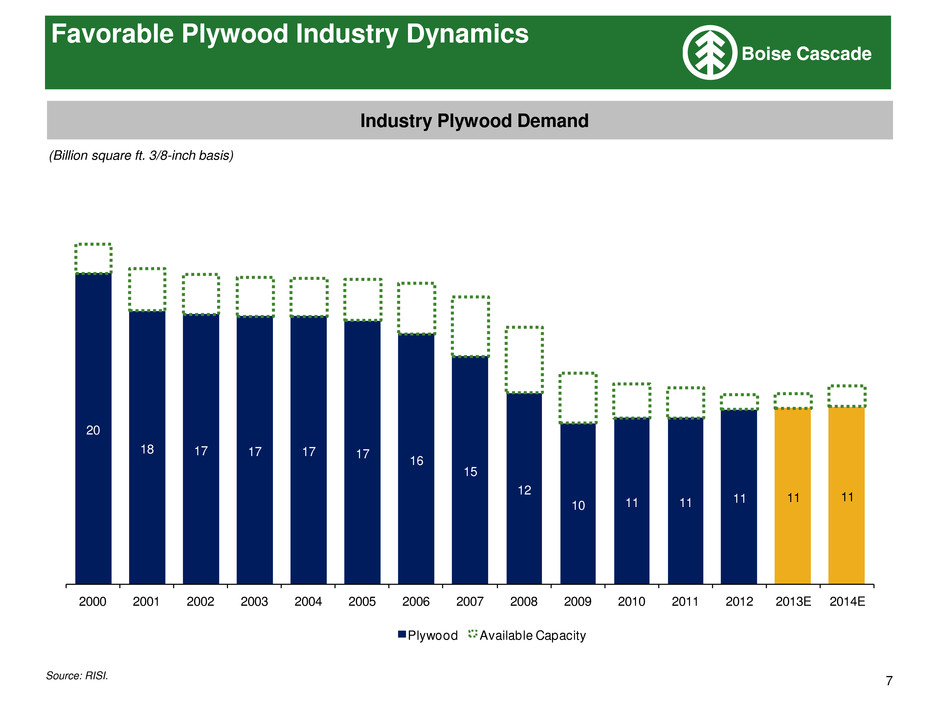
7 Source: RISI. (Billion square ft. 3/8-inch basis) Industry Plywood Demand 20 18 17 17 17 17 16 15 12 10 11 11 11 11 11 2000 2001 2002 2003 2004 2005 2006 2007 2008 2009 2010 2011 2012 2013E 2014E Plywood Available Capacity Favorable Plywood Industry Dynamics
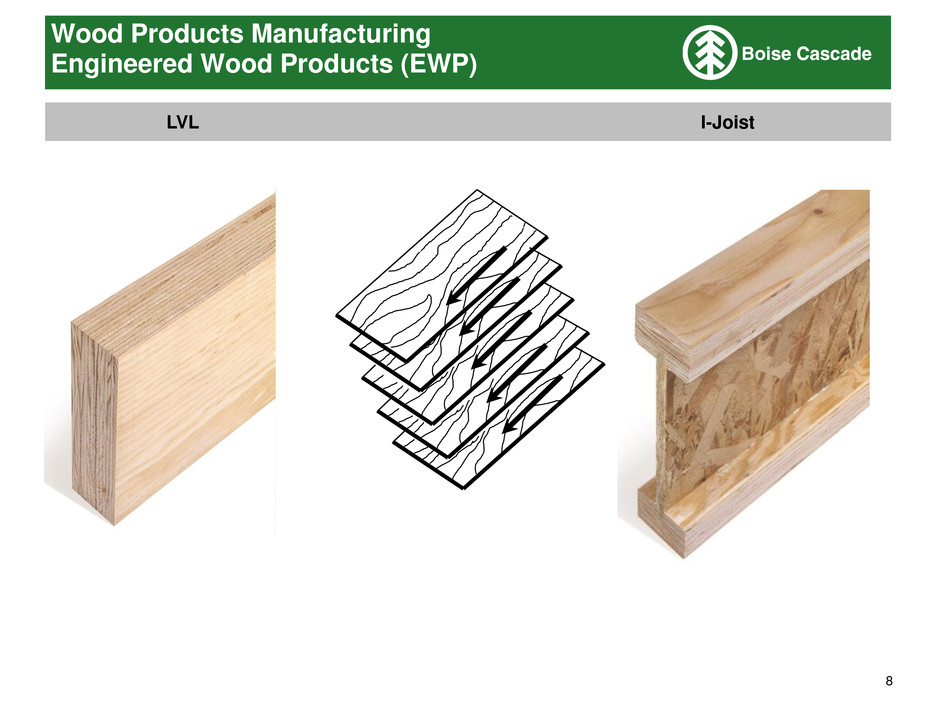
8 Wood Products Manufacturing Engineered Wood Products (EWP) LVL I-Joist
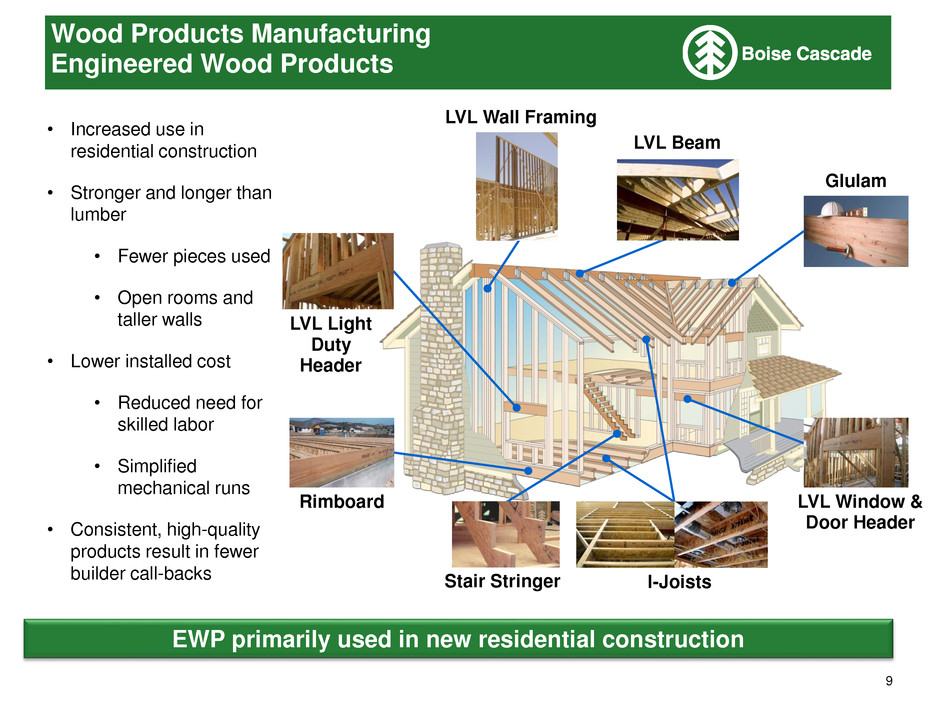
9 Wood Products Manufacturing Engineered Wood Products EWP primarily used in new residential construction • Increased use in residential construction • Stronger and longer than lumber • Fewer pieces used • Open rooms and taller walls • Lower installed cost • Reduced need for skilled labor • Simplified mechanical runs • Consistent, high-quality products result in fewer builder call-backs LVL Light Duty Header LVL Wall Framing LVL Beam Glulam LVL Window & Door Header Rimboard I-Joists Stair Stringer

10 Real Growth in BCC’s EWP Sales Usage of EWP per start per start increasing significantly
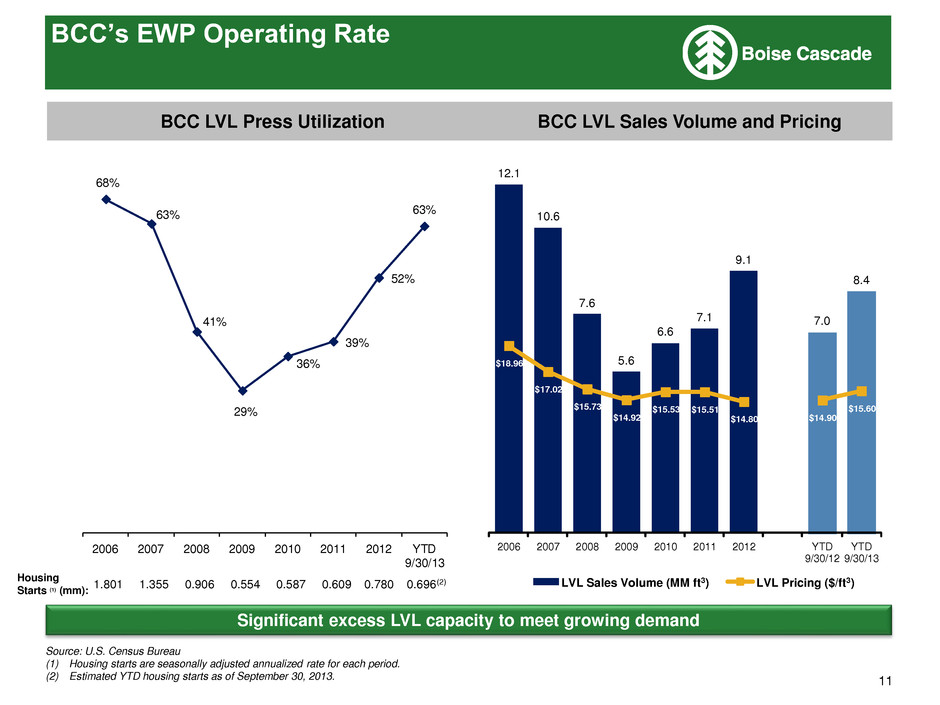
11 68% 63% 41% 29% 36% 39% 52% 63% 2006 2007 2008 2009 2010 2011 2012 YTD 9/30/13 Housing Starts (1) (mm): 1.801 1.355 0.906 0.554 0.587 0.609 0.780 0.696(2) BCC’s EWP Operating Rate BCC LVL Press Utilization BCC LVL Sales Volume and Pricing Significant excess LVL capacity to meet growing demand Source: U.S. Census Bureau (1) Housing starts are seasonally adjusted annualized rate for each period. (2) Estimated YTD housing starts as of September 30, 2013. 12.1 10.6 7.6 5.6 6.6 7.1 9.1 7.0 8.4 $18.96 $17.02 $15.73 $14.92 $15.53 $15.51 $14.80 $14.90 $15.60 $5.00 $7.00 $9.00 $11.00 $13.00 $15.00 $17.00 $19.00 $21.00 $23.00 $25.00 $27.00 $29.00 $31.00 $33.00 $35.00 0.0 2.0 4.0 6.0 8.0 10.0 12.0 2006 2007 2008 2009 2010 2011 2012 YTD 9/30/12 YTD 9/30/13 LVL Sales Volume (MM ft3) LVL Pricing ($/ft3)
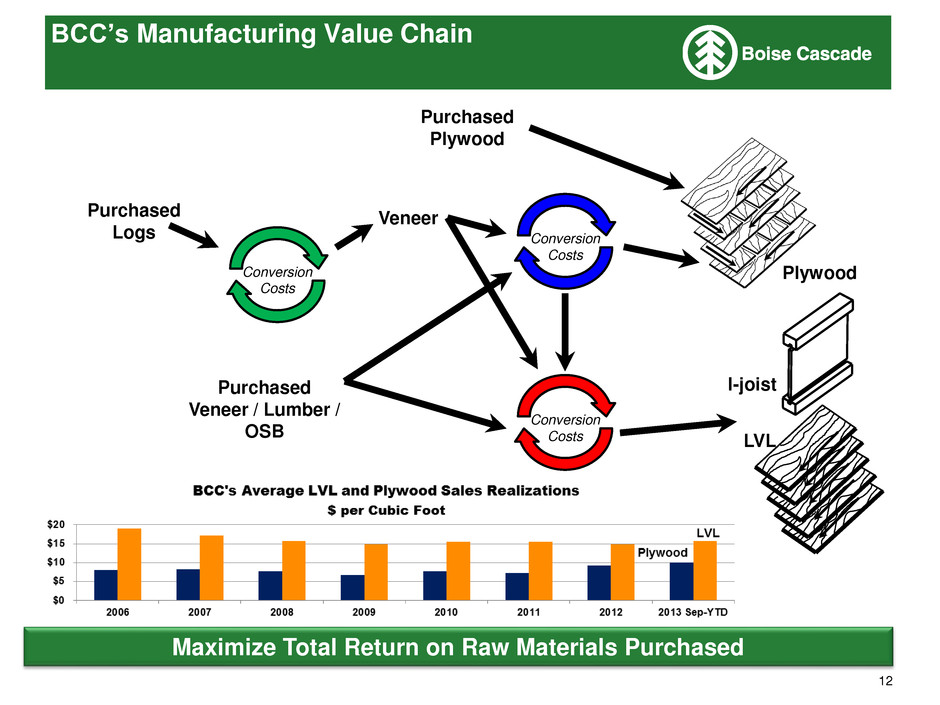
12 BCC’s Manufacturing Value Chain Veneer Purchased Logs Plywood I-joist Conversion Costs Conversion Costs Conversion Costs Purchased Veneer / Lumber / OSB Purchased Plywood Maximize Total Return on Raw Materials Purchased LVL
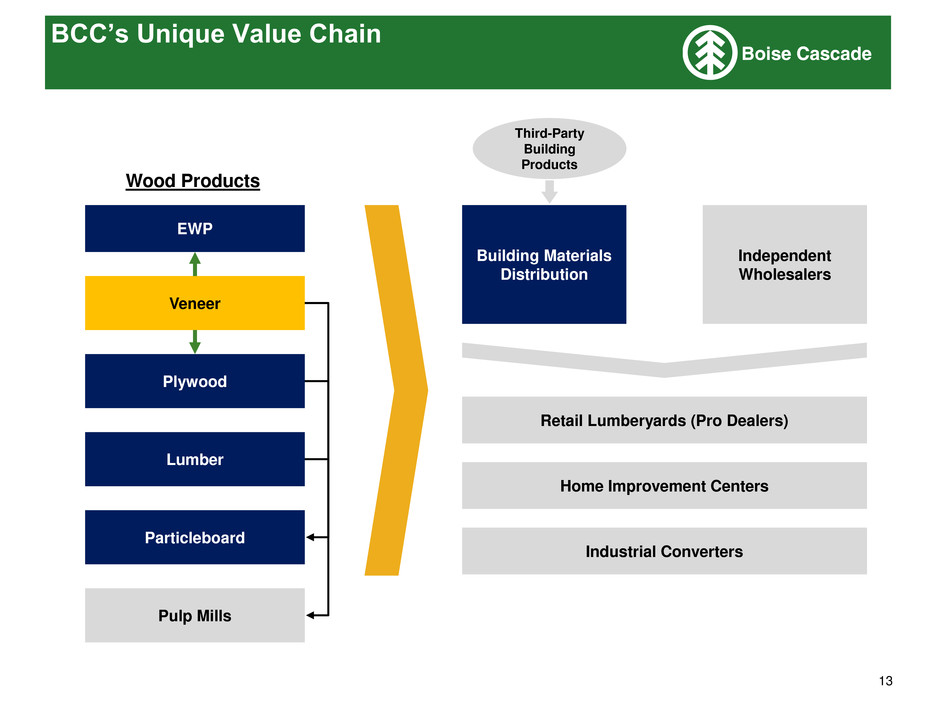
13 BCC’s Unique Value Chain EWP Veneer Plywood Lumber Pulp Mills Particleboard Building Materials Distribution Independent Wholesalers Retail Lumberyards (Pro Dealers) Home Improvement Centers Industrial Converters Third-Party Building Products Wood Products
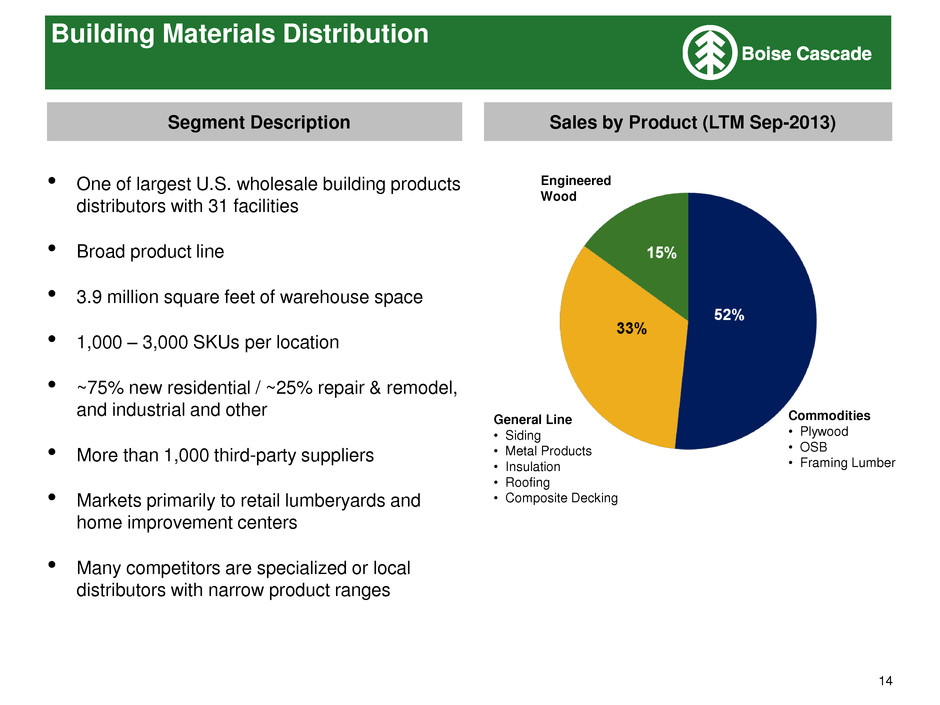
14 Building Materials Distribution • One of largest U.S. wholesale building products distributors with 31 facilities • Broad product line • 3.9 million square feet of warehouse space • 1,000 – 3,000 SKUs per location • ~75% new residential / ~25% repair & remodel, and industrial and other • More than 1,000 third-party suppliers • Markets primarily to retail lumberyards and home improvement centers • Many competitors are specialized or local distributors with narrow product ranges Segment Description Sales by Product (LTM Sep-2013) General Line • Siding • Metal Products • Insulation • Roofing • Composite Decking Commodities • Plywood • OSB • Framing Lumber Engineered Wood
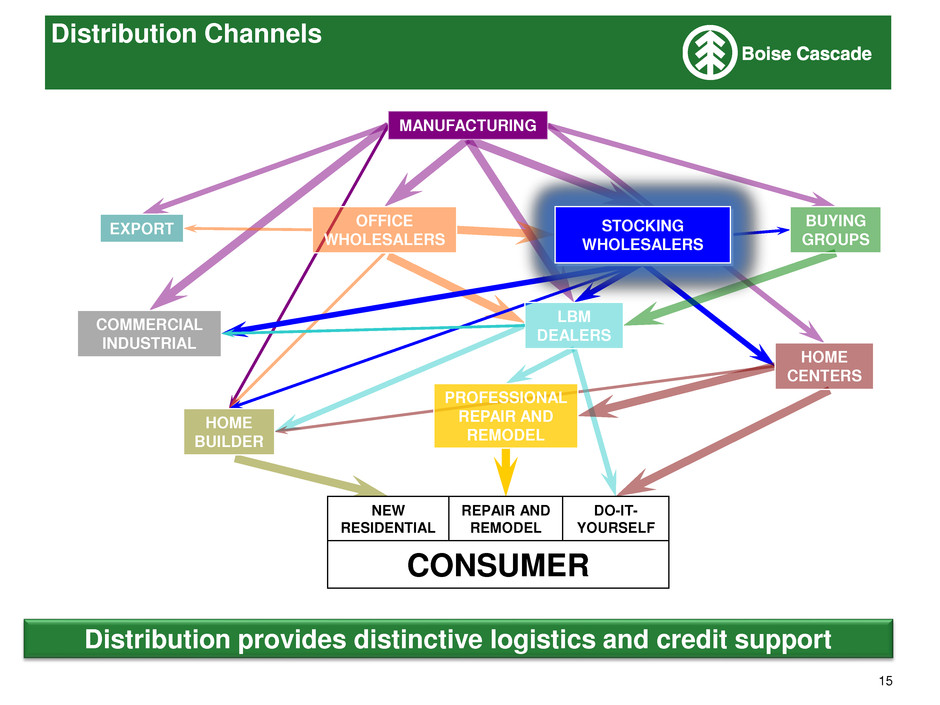
15 Distribution Channels MANUFACTURING EXPORT OFFICE WHOLESALERS STOCKING WHOLESALERS BUYING GROUPS COMMERCIAL INDUSTRIAL HOME BUILDER LBM DEALERS PROFESSIONAL REPAIR AND REMODEL HOME CENTERS CONSUMER DO-IT- YOURSELF REPAIR AND REMODEL NEW RESIDENTIAL Distribution provides distinctive logistics and credit support
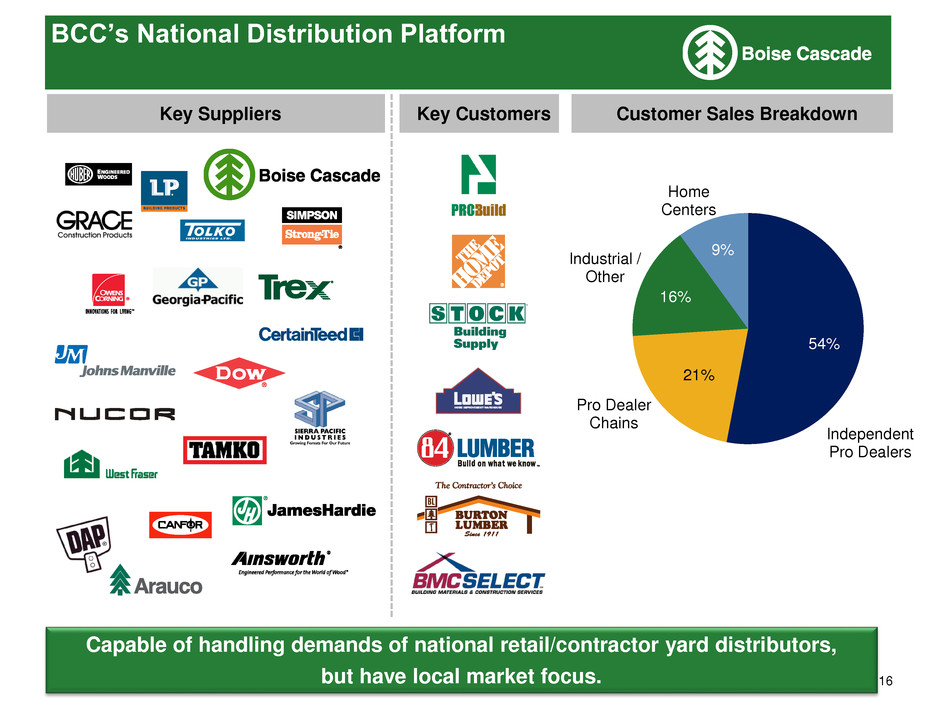
16 Capable of handling demands of national retail/contractor yard distributors, but have local market focus. Independent Pro Dealers Pro Dealer Chains Industrial / Other Home Centers Key Suppliers BCC’s National Distribution Platform 54% 21% 16% 9% Key Customers Customer Sales Breakdown
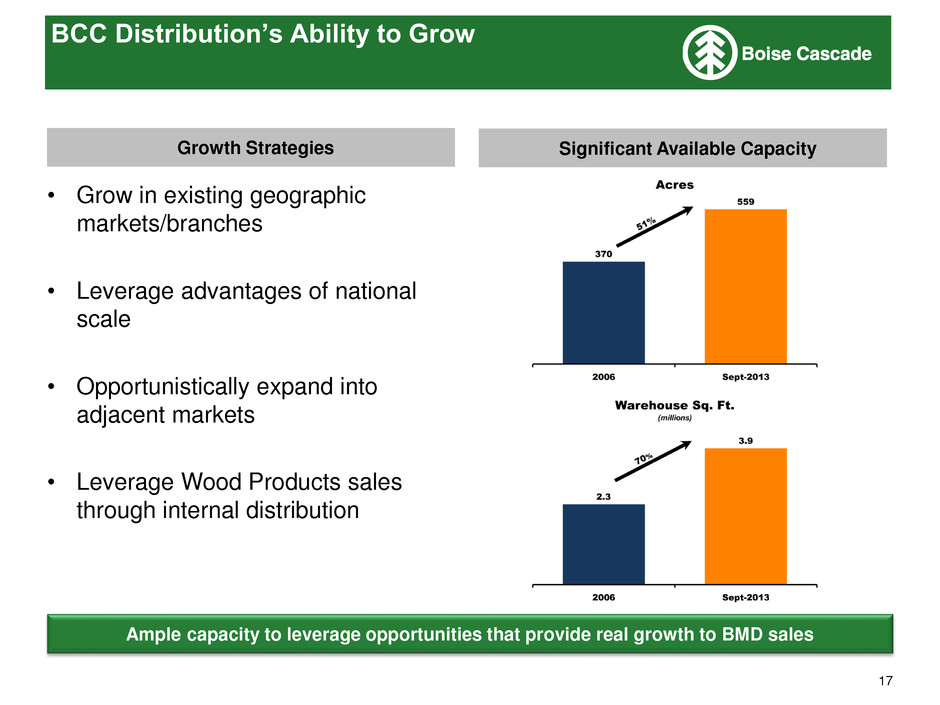
17 Growth Strategies • Grow in existing geographic markets/branches • Leverage advantages of national scale • Opportunistically expand into adjacent markets • Leverage Wood Products sales through internal distribution Significant Available Capacity Ample capacity to leverage opportunities that provide real growth to BMD sales BCC Distribution’s Ability to Grow
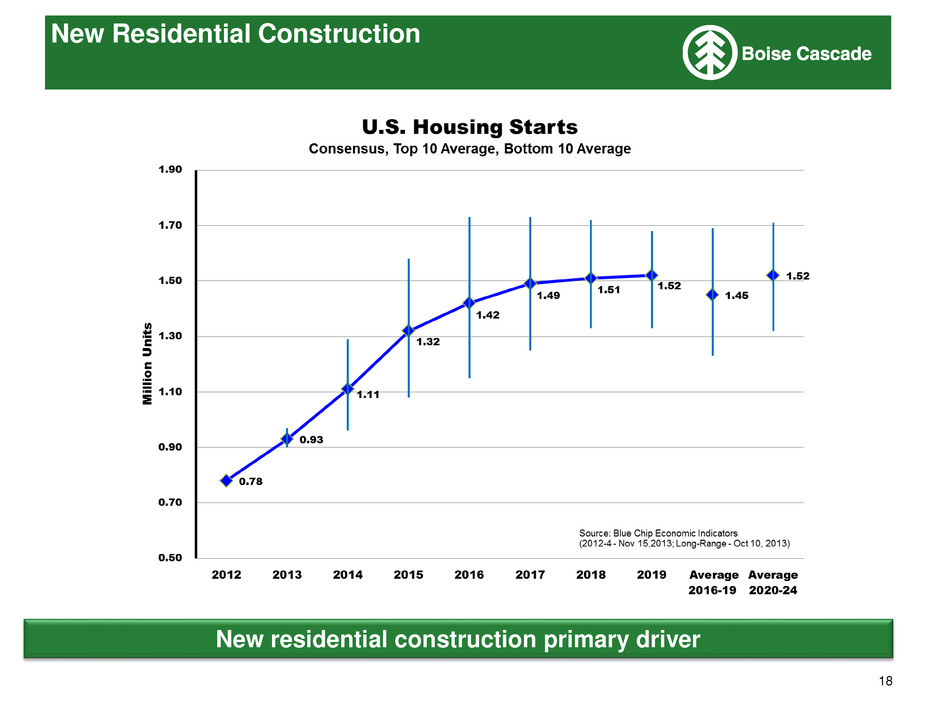
18 New Residential Construction New residential construction primary driver
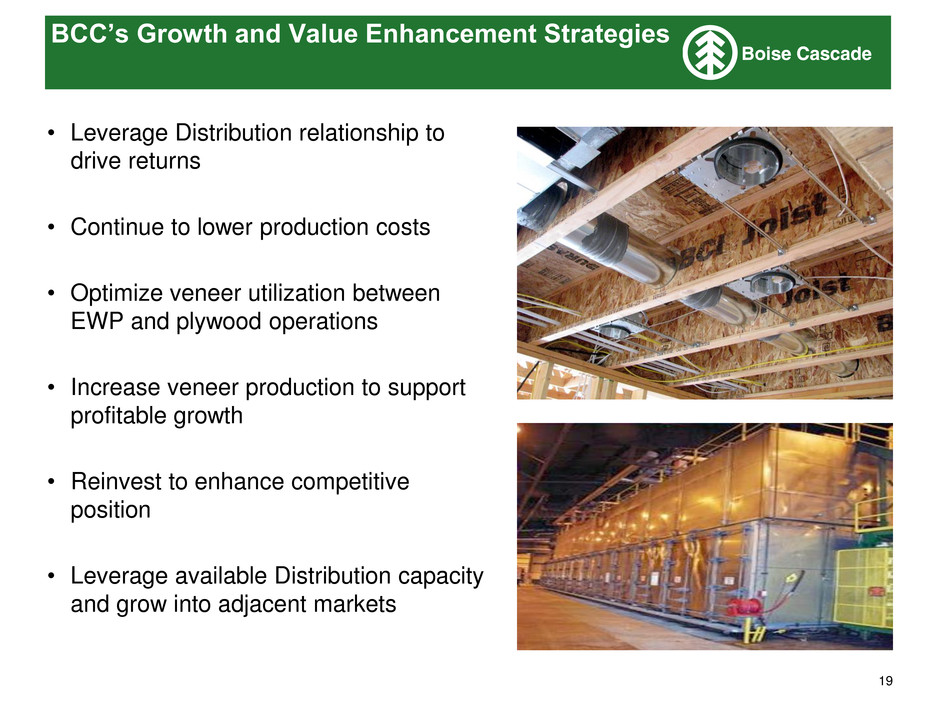
19 BCC’s Growth and Value Enhancement Strategies • Leverage Distribution relationship to drive returns • Continue to lower production costs • Optimize veneer utilization between EWP and plywood operations • Increase veneer production to support profitable growth • Reinvest to enhance competitive position • Leverage available Distribution capacity and grow into adjacent markets
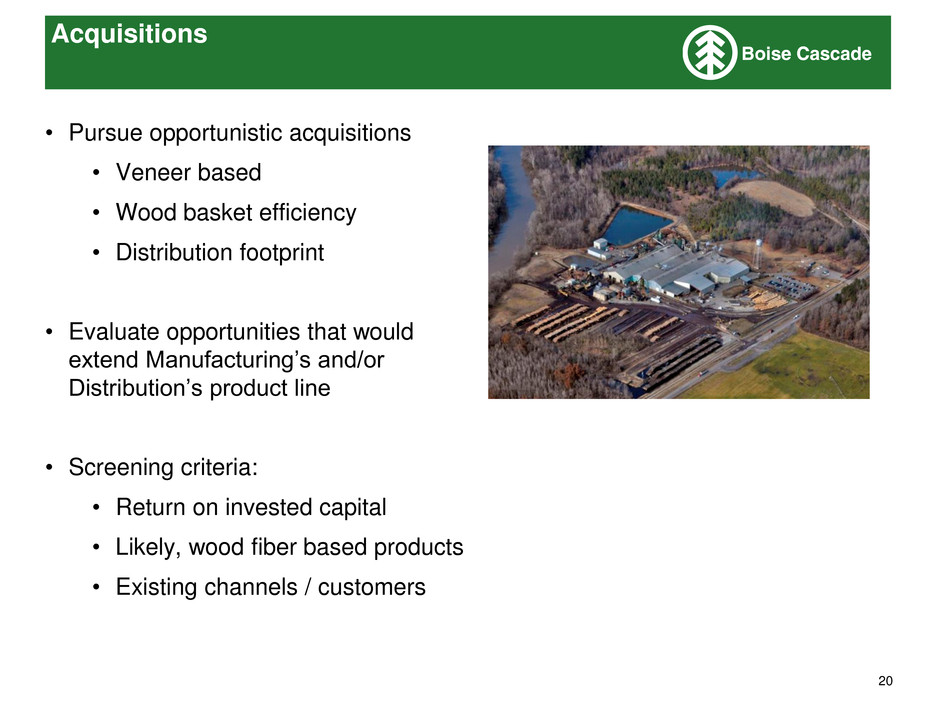
20 Acquisitions • Pursue opportunistic acquisitions • Veneer based • Wood basket efficiency • Distribution footprint • Evaluate opportunities that would extend Manufacturing’s and/or Distribution’s product line • Screening criteria: • Return on invested capital • Likely, wood fiber based products • Existing channels / customers
21 2014 Outlook • Continued improvement in new residential construction • Increased demand for EWP • Higher sales volume and improved operating rates • Leverage on fixed costs • Top-line gains and fixed cost leverage in Distribution • Improved residential construction spending in both new construction and repair and remodeling • Full-year’s benefit of Chester and Moncure plywood facilities acquisition
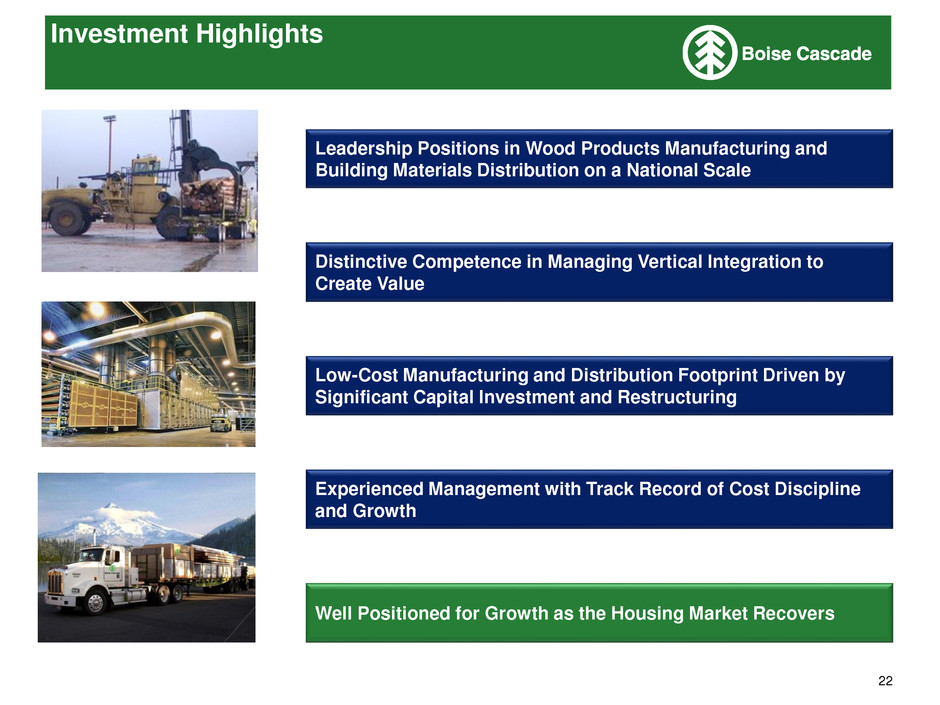
22 Investment Highlights Leadership Positions in Wood Products Manufacturing and Building Materials Distribution on a National Scale Distinctive Competence in Managing Vertical Integration to Create Value Low-Cost Manufacturing and Distribution Footprint Driven by Significant Capital Investment and Restructuring Well Positioned for Growth as the Housing Market Recovers Experienced Management with Track Record of Cost Discipline and Growth
Appendix
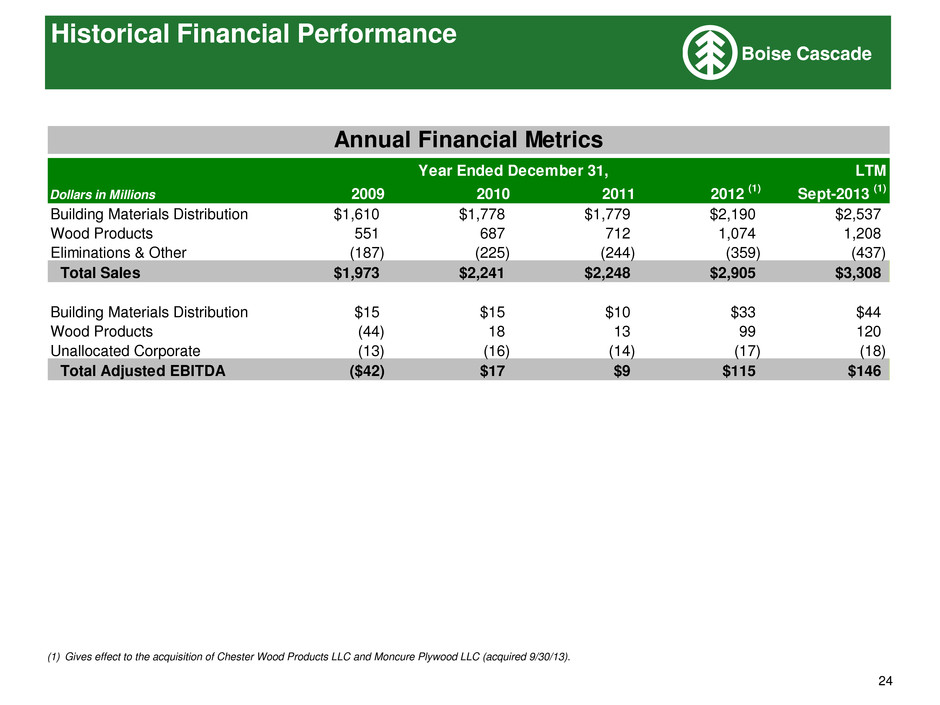
24 Historical Financial Performance (1) Gives effect to the acquisition of Chester Wood Products LLC and Moncure Plywood LLC (acquired 9/30/13). LTM Dollars in Millions 2009 2010 2011 2012 (1) Sept-2013 (1) Building Materials Distribution $1,610 $1,778 $1,779 $2,190 $2,537 Wood Products 551 687 712 1,074 1,208 Eliminations & Other (187) (225) (244) (359) (437) Total Sales $1,973 $2,241 $2,248 $2,905 $3,308 Building Materials Distribution $15 $15 $10 $33 $44 Wood Products (44) 18 13 99 120 Unallocated Corporate (13) (16) (14) (17) (18) Total Adjusted EBITDA ($42) $17 $9 $115 $146 Annual Financial Metrics Year Ended December 31,
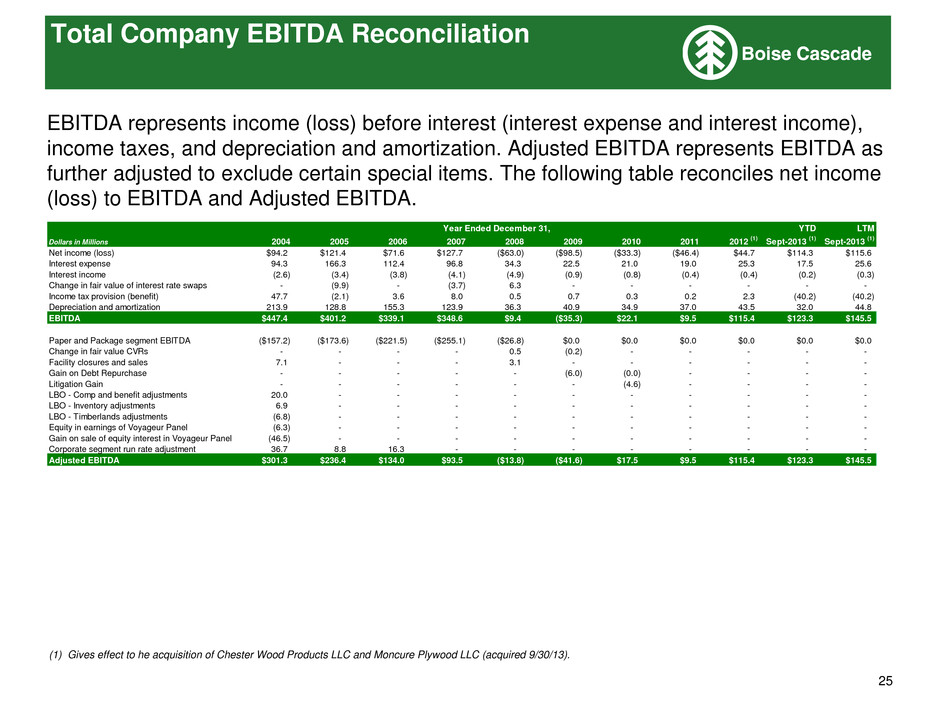
25 Total Company EBITDA Reconciliation EBITDA represents income (loss) before interest (interest expense and interest income), income taxes, and depreciation and amortization. Adjusted EBITDA represents EBITDA as further adjusted to exclude certain special items. The following table reconciles net income (loss) to EBITDA and Adjusted EBITDA. (1) Gives effect to he acquisition of Chester Wood Products LLC and Moncure Plywood LLC (acquired 9/30/13). YTD LTM Dollars in Millions 2004 2005 2006 2007 2008 2009 2010 2011 2012 (1) Sept-2013 (1) Sept-2013 (1) Net income (loss) $94.2 $121.4 $71.6 $127.7 ($63.0) ($98.5) ($33.3) ($46.4) $44.7 $114.3 $115.6 Interest expense 94.3 166.3 112.4 96.8 34.3 22.5 21.0 19.0 25.3 17.5 25.6 Interest income (2.6) (3.4) (3.8) (4.1) (4.9) (0.9) (0.8) (0.4) (0.4) (0.2) (0.3) Change in fair value of interest rate swaps - (9.9) - (3.7) 6.3 - - - - - - Income tax provision (benefit) 47.7 (2.1) 3.6 8.0 0.5 0.7 0.3 0.2 2.3 (40.2) (40.2) Depreciation and amortization 213.9 128.8 155.3 123.9 36.3 40.9 34.9 37.0 43.5 32.0 44.8 EBITDA $447.4 $401.2 $339.1 $348.6 $9.4 ($35.3) $22.1 $9.5 $115.4 $123.3 $145.5 Paper and Package segment EBITDA ($157.2) ($173.6) ($221.5) ($255.1) ($26.8) $0.0 $0.0 $0.0 $0.0 $0.0 $0.0 Change in fair value CVRs - - - - 0.5 (0.2) - - - - - Facility closures and sales 7.1 - - - 3.1 - - - - - - Gain on Debt Repurchase - - - - - (6.0) (0.0) - - - - Litigation Gai - - - - - - (4.6) - - - - LBO - Comp and benefit adjustments 20.0 - - - - - - - - - - L O - Inventory adjustments 6.9 - - - - - - - - - - LBO - Timberlands adjustments (6.8) - - - - - - - - - - Equity in earnings of Voyageur Panel (6.3) - - - - - - - - - - Gain on sale of equity interest in Voyageur Panel (46.5) - - - - - - - - - - Corporate segment run rate adjustment 36.7 8.8 16.3 - - - - - - - - Adjusted EBITDA $301.3 $236.4 $134.0 $93.5 ($13.8) ($41.6) $17.5 $9.5 $115.4 $123.3 $145.5 Year Ended December 31,
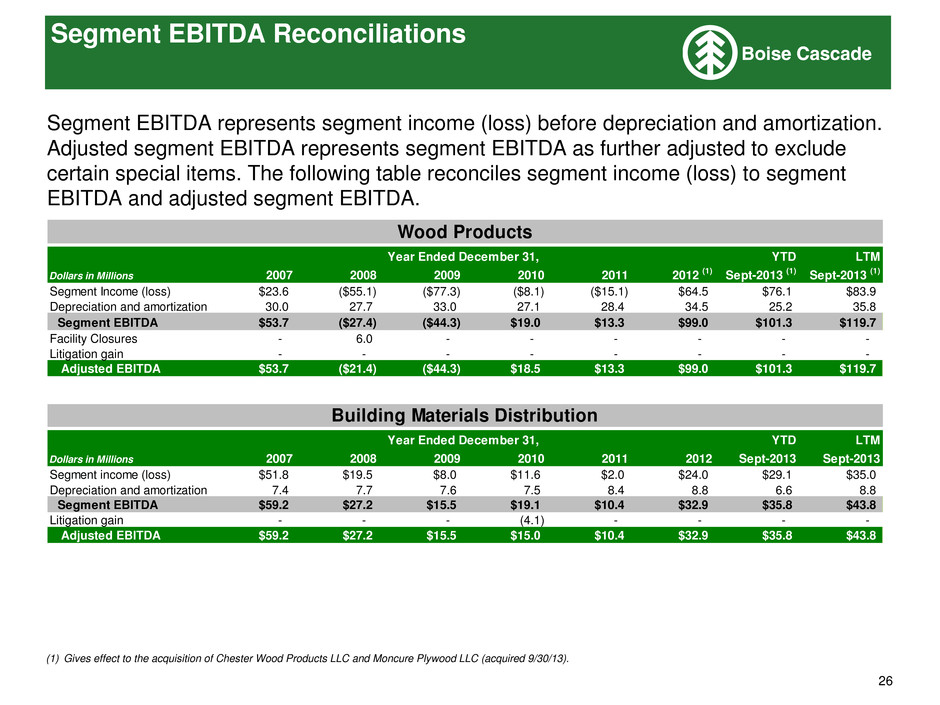
26 Segment EBITDA Reconciliations Segment EBITDA represents segment income (loss) before depreciation and amortization. Adjusted segment EBITDA represents segment EBITDA as further adjusted to exclude certain special items. The following table reconciles segment income (loss) to segment EBITDA and adjusted segment EBITDA. (1) Gives effect to the acquisition of Chester Wood Products LLC and Moncure Plywood LLC (acquired 9/30/13). YTD LTM Dollars in Millions 2007 2008 2009 2010 2011 2012 (1) Sept-2013 (1) Sept-2013 (1) Segment Income (loss) $23.6 ($55.1) ($77.3) ($8.1) ($15.1) $64.5 $76.1 $83.9 Depreciation and amortization 30.0 27.7 33.0 27.1 28.4 34.5 25.2 35.8 Segment EBITDA $53.7 ($27.4) ($44.3) $19.0 $13.3 $99.0 $101.3 $119.7 Facility Closures - 6.0 - - - - - - Litigation gain - - - - - - - - Adjusted EBITDA $53.7 ($21.4) ($44.3) $18.5 $13.3 $99.0 $101.3 $119.7 YTD LTM Dollars in Millions 2007 2008 2009 2010 2011 2012 Sept-2013 Sept-2013 Segment income (loss) $51.8 $19.5 $8.0 $11.6 $2.0 $24.0 $29.1 $35.0 Depreciation and amortization 7.4 7.7 7.6 7.5 8.4 8.8 6.6 8.8 Segment EBITDA $59.2 $27.2 $15.5 $19.1 $10.4 $32.9 $35.8 $43.8 Litigation gain - - - (4.1) - - - - Adjusted EBITDA $59.2 $27.2 $15.5 $15.0 $10.4 $32.9 $35.8 $43.8 Wood Products Year Ended December 31, Building Materials Distribution Year Ended December 31,
