Attached files
| file | filename |
|---|---|
| 8-K - 8-K - PIONEER POWER SOLUTIONS, INC. | v361971_8k.htm |

Pioneer Power Solutions, Inc. Investor Presentation Sixth Annual LD Micro Conference December 4, 2013 © 2013 Pioneer Power Solutions, Inc.

Forward - Looking Statements This presentation contains certain "forward - looking statements" within the meaning of the Private Securities Litigation Reform A ct of 1995, as amended. Such statements may be preceded by the words "intends," "may," "will," "plans," "expects," "anticipates," "projects, " " predicts," "estimates," "aims," "believes," "hopes," "potential" or similar words. Forward - looking statements are not guarantees of future performance, are based on certain assumptions and are subject to various known and unknown risks and uncertainties, many of which are beyond the company's control, and cannot be predicted or quantified and co nse quently, actual results may differ materially from those expressed or implied by such forward - looking statements. Such risks and uncertainties include, without limitation, risks and uncertainties associated with (i) general economic conditions and their effect on demand for electrical equipment, particularly in the commercial construction market, but also in the power generation, indust ria l production, data center, oil and gas, marine and infrastructure industries, (ii) the effects of fluctuations in sales on our business, re ven ues, expenses, net income, earnings per share, margins, profitability, (iii) the fact that many of the Company’s competitors are better establis hed and have significantly greater resources, and may subsidize their competitive offerings with other products and services, which may ma ke it difficult for the Company to attract and retain customers, (iv) the Company’s dependence on Hydro - Quebec Utility Company and Siemens Industry, Inc . for a large portion of its business, and that any change in the level of orders from these customers could have a significant impac t o n the Company’s results of operations, (v) the potential loss or departure of key personnel, including Nathan J. Mazurek, the Company’s chair man , president and chief executive officer, (vi) the Company’s ability to expand its business through strategic acquisitions, (vii) the Company’ s a bility to integrate acquisitions and related businesses, (viii) the Company’s ability to generate internal growth, maintain market acceptance of its existing products and gain acceptance for its new products, (ix) unanticipated increases in raw material prices or that disruptions in supply c oul d increase production costs and adversely affect the Company’s profitability, (x) restrictive loan covenants and/or the Company’s abilit y t o repay or refinance debt under its credit facilities could limit the Company’s future financing options and liquidity position and may lim it its ability to grow its business, (xi) the Company’s ability to realize revenue reported in its backlog, (xii) operating margin risk due to compe tit ive pricing and operating efficiencies, supply chain risk, material, labor or overhead cost increases, interest rate risk and commodity risk, (x iii) strikes or labor disputes with employees may adversely affect the Company’s ability to conduct its business, (xiv) since a majority of the Com pan y’s revenue and a significant portion of its expenditures are derived or spent in Canadian dollars, while the Company reports its financial c ond ition and results of operations in U.S. dollars, fluctuations between the U.S. dollar and the Canadian dollar will impact the amount of the Compan y’s revenues and earnings, (xv) the impact of geopolitical activity on the economy, changes in government regulations such as income taxes, cl ima te control initiatives, the timing or strength of an economic recovery in the Company’s markets and its ability to access capital market s, (xvi) the Company’s chairman controls a majority of the Company’s combined voting power, and may have, or may develop in the future, interests th at may diverge from yours, (xvii) future sales of large blocks of the Company’s common stock may adversely impact the Company’s stock price, an d (xviii) the liquidity and trading volume of the Company’s common stock . More detailed information about the company and the risk factors that may affect the realization of forward - looking statements i s set forth in the company's filings with the Securities and Exchange Commission. Investors and security holders are urged to read these filings fr ee of charge on the SEC's web site at www.sec.gov. The company does not undertake to publicly update or revise its forward - looking statements as a result of new information, future events or otherwise. - 2 -

Company Snapshot Diversified manufacturer of specialty electrical transmission and distribution (T&D) equipment – Headquartered in Fort Lee, NJ – Built through 5 acquisitions, operations in the U.S., Canada and Mexico; ~350 employees Broad range of highly engineered solutions for niche applications within large, growing market segments – Utility, Industrial, Commercial – Backup power and distributed generation Financial – $64.5M market cap (Nasdaq: PPSI) (a) – $84M in 2012 revenue (99% North America) – 2013 guidance: revenue $89 - 95M / EPS $0.76 - 82 – 20+ quarters of consecutive profitability (b) Electrical Transmission & Distribution Equipment Liquid - Filled Transformers Dry - Type Transformers - 3 - Paralleling Switchgear & Generator Controls Custom Switchboard/Switchgear Products 1995 Acquired 2010 Acquired 2011 Acquired 2013 Acquired 2013 (a) Closing price of $8.99 on 11/25/2013. Shares outstanding : 7,172,255 (b) Excluding discontinued operations (2011)

Investment Highlights - 4 - ▪ Management track record of growth ▪ Successful acquisition strategy & integration Organic growth of 10+% (2x industry) (a) – Recurring blue chip customer base – 89% of 2012 revenue originated from repeat customers Engineered - to - order solutions – Higher margin opportunities with near - term target of 10% EBITDA Large addressable market – Aging North American electrical infrastructure needing replacement Experienced management team – Proven track record of growth Stable, Profitable Business Evolving grid requirements – Increasing demands and requirements for grid system stability & efficiency – Growing market for critical power applications M&A strategy – Fragmented electric transmission & distribution equipment market (> $24B in 2012) (b) – Target higher growth/higher margin end markets with complimentary products and services Growth Opportunities (a) Years ending December 2010 through 2012 (b) Freedonia Group study, May 2013 Profitable core business poised for accelerated growth

Pioneer’s Position in the Electrical Grid - 5 - GENERATION Power Station TRANSMISSION Transmission Substation Distribution Substation Distribution / Control Equipment DISTRIBUTION Power Transformers Commercial & Industrial Users Residential Customers Solar Wind Farm Pioneer’s focus is on niche markets and customized applications within the electrical grid ON - SITE BACKUP POWER & DISTRIBUTED GENERATION

Market Positioning by Product Category - 6 - Product Category Low - Voltage Switchboard/ Panelboards Low Voltage Dry - Type Transformers Medium - Voltage “Power - Dry” Transformers Liquid - Filled Transformers Paralleling Switchgear and Generator Controls Business Process Variables Primary End Markets Office and commercial buildings Office, commercial & manufacturing facilities Oil & gas, mining large commercial & residential buildings Utilities, oil & gas, heavy manufacturing Data centers Hospitals Key Customer Types Distributors Contractors Distributors OEMs EPCs End - users End - users EPC s Generator dealers End - users, EPC s Main Competitive Differentiators Price Availability Price Availability Engineering Lead t ime Engineering Lead t ime Engineering Track record Customers per Year 100s/year > 1,000/year Dozens/year Dozens/year Dozens/year Demand Drivers Commercial construction Commercial construction Industrial expansion Commercial construction Replacement/ expansion/retrofit Digital economy growth Need for reliable power Order Value $ Gross Margin % Degree of Customization Sales Cycle Production Turnaround Engineering Content Customer Interaction Application Complexity Made to Stock Made to Order Backlog Sales Velocity

Customers and Markets - 7 - Revenue Distribution 2012A Revenue: $84.0 Million Utilities 32% Industrial 9% Commercial 9% Distributors and EPC Firms 50% 89% of 2012 revenue originated from repeat customers Utilities Industrial EPC Firms and Distributors Commercial

Industry Size and Structure Large and Growing North American Market – Utilities represent the majority of demand (52%) (a) – Next are industrial/nonutility generators (32%) ( a) – High diversity of product and market niches – The majors: ABB, GE, Schneider, Siemens – ~2,400 manufacturers serving North America (b) Global investments in data centers to increase 14.5% in 2013 to $120B, with electrical systems comprising 40% of center development cost (c) Pioneer’s Focus – Classes of transformers and switchgear/board addressing an ~$8.7Bn annual market ( a) – Projects with complex requirements and/or competitive dynamics favoring Pioneer – Segments growing faster than the overall market – Unique power requirements for data centers driving growth for Pioneer’s switchgear solutions - 8 - Value of U.S. T&D Equipment Demand ($ Bn ) (a) 54% 34% 6% 6% 2012 $24.0 Bn (a) Freedonia Group study, May 2013 (b) IBIS World Inc . (c) DatacenterDynamics Industry Census 2007 2012 2017 Switchgear/board apparatus Transformers Meters Pole/line hardware $24.0 $30.4 $21.5

Industry Growth Drivers - 9 - Aging Power Grid Built more than a half century ago, designed for our needs at the time, has not changed since Nearly a majority of T&D infrastructure is near or past its useful service life Demand for Reliable Power Rising number of TLR events demonstrates power grid’s inadequate capacity and lack of redundancy Growing number of mission critical facilities, data center investment expected up 14.5% in 2013 (c) Growing Electricity Consumption U.S. electricity demand to grow 28% from 2011 to 2040 (d) , increasing utility expansion and network maintenance needs Significant new generation capacity additions needed to meet demand (with renewables to grow fastest), requiring new T&D infrastructure U.S. Level 5 TLR Incidents (b) (a) Black & Veatch’s 2009/2010 Third Annual Strategic Directions in the Electric Utility Industry Survey (b) NERC , TLR events (Level 5 Transmission Load Relief events) are triggered when power outages are imminent or in progress (c) 2012 DatacenterDynamics Industry Census (d) U.S . Energy Information Administration, Annual Energy Outlook 2013 0 50 100 150 200 250 300 350 1997 1998 1999 2000 2001 2002 2003 2004 2005 2006 2007 2008 2009 2010 2011 2012 Service Life of the U.S. Electrical Infrastructure (a) 58% 50% 42% 50% 0% 25% 50% 75% 100% Transmission Distribution Within Service Life Near or Past Service Life Higher energy costs, stricter environmental regulations and efficiency standards leading to upgrades, retrofits and equipment replacement
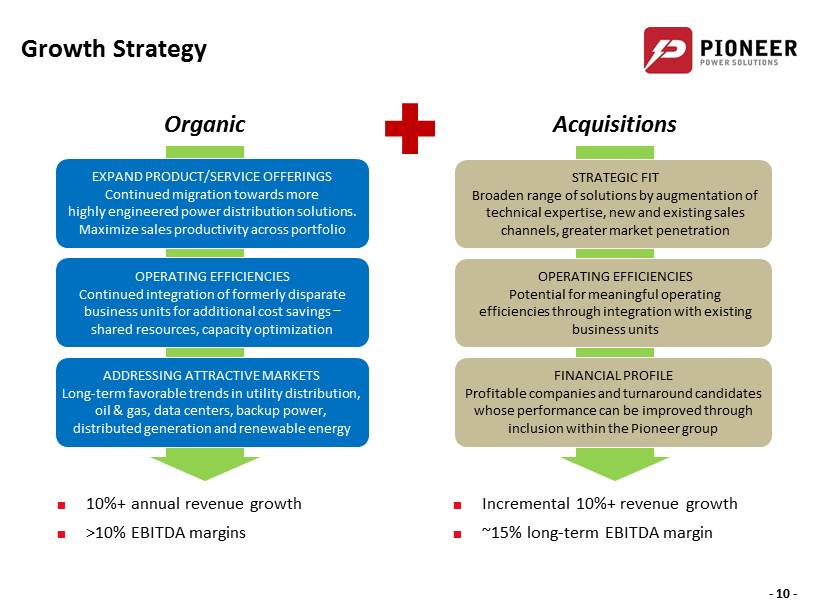
Growth Strategy - 10 - FINANCIAL PROFILE Profitable companies and turnaround candidates whose performance can be improved through inclusion within the Pioneer group OPERATING EFFICIENCIES Potential for meaningful operating efficiencies through integration with existing business units STRATEGIC FIT Broaden range of solutions by augmentation of technical expertise, new and existing sales channels, greater market penetration ADDRESSING ATTRACTIVE MARKETS Long - term favorable trends in utility distribution, oil & gas, data centers, backup power, distributed generation and renewable energy OPERATING EFFICIENCIES Continued integration of formerly disparate business units for additional cost savings − shared resources, capacity optimization EXPAND PRODUCT/SERVICE OFFERINGS Continued migration towards more highly engineered power distribution solutions. Maximize sales productivity across portfolio Organic Acquisitions 10%+ annual revenue growth >10% EBITDA margins Incremental 10%+ revenue growth ~15% long - term EBITDA margin

Financial Overview
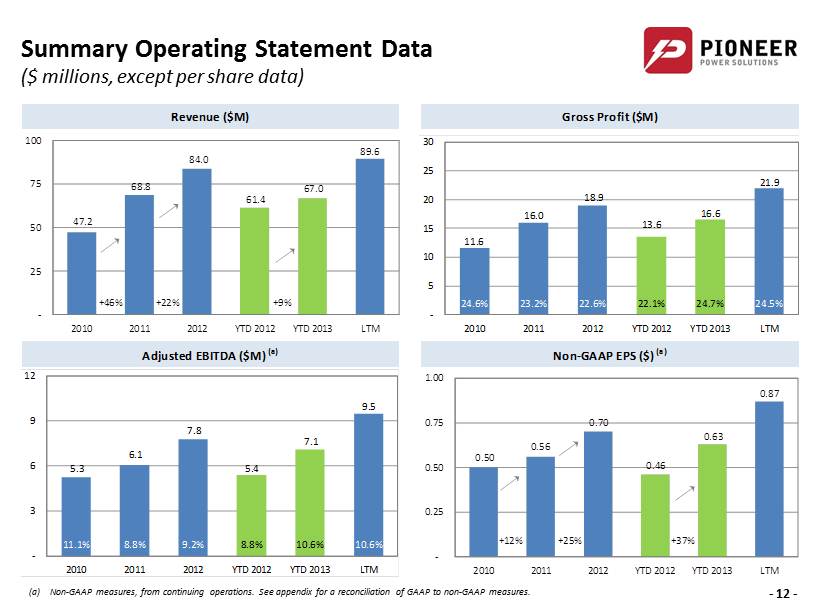
Summary Operating Statement Data ($ millions, except per share data) - 12 - (a) Non - GAAP measures, from continuing operations. See appendix for a reconciliation of GAAP to non - GAAP measures. Revenue ($M) Gross Profit ($M) +46% +22% +9% +25% +23% Adjusted EBITDA ($M) (a) Non-GAAP EPS ($) (a) +12% +25% +37% 47.2 68.8 84.0 61.4 67.0 89.6 - 25 50 75 100 2010 2011 2012 YTD 2012 YTD 2013 LTM 11.6 16.0 18.9 13.6 16.6 21.9 24.6% 23.2% 22.6% 22.1% 24.7% 24.5% - 5 10 15 20 25 30 2010 2011 2012 YTD 2012 YTD 2013 LTM 5.3 6.1 7.8 5.4 7.1 9.5 11.1% 8.8% 9.2% 8.8% 10.6% 10.6% - 3 6 9 12 2010 2011 2012 YTD 2012 YTD 2013 LTM 0.50 0.56 0.70 0.46 0.63 0.87 - 0.25 0.50 0.75 1.00 2010 2011 2012 YTD 2012 YTD 2013 LTM

Financial Position ($ millions) - 13 - Liquidity Measures ($M) Condensed Balance Sheet ($M) (a) Excluding cash and equivalents, current maturities of debt and discontinued operations (b) Demand facilities, subject to annual review for renewal (always classified as due < 1 year) Debt Repayment Schedule ($M) 09/30/13 09/30/13 Assets Cash and cash equivalents 3.3$ Current assets 30.9$ Accounts receivable 12.1 Current liabilities (17.9) Inventories 13.4 Net working capital 13.0$ Prepaid expenses and other current assets 1.2 Current ratio 1.7x Deferred income taxes 0.8 Current assets 30.9 Trade net working capital (a) 14.1$ Property, plant and equipment 12.6 Trade net working capital ratio (a) 2.0x Other long-term assets 1.5 Trade net working capital % of revenue 16% Goodwill and intangibles 13.5 Total assets 58.6$ Debt / total capitalization 30% Net debt / Adjusted EBITDA 1.0x Liabilities and Shareholders' Equity Revolving credit facilities 2.1$ Accounts payable and accrued liabilities 12.4 Current maturities of long-term debt and capital leases 2.3 Other current liabilities 1.1 Current liabilities 17.9 Bank Bank Term Other Total as of Long-term debt, net of current maturities 8.1 Period Revolvers Loans Debt 09/30/13 Other long-term liabilities 3.6 (b) Total liabilities 29.6 2013 2.1$ 0.4$ 0.2$ 2.7$ Common stock paid-in capital 16.1 2014 - 1.4 0.5 2.0 Accumulated other comprehensive income (loss) (1.1) 2015 - 1.9 0.3 2.2 Retained earnings 14.0 2016 - 5.2 0.4 5.5 Total shareholders' equity 29.0 2017+ - - 0.1 0.1 Total liabilities and shareholders' equity 58.6$ 2.1$ 8.8$ 1.6$ 12.5$
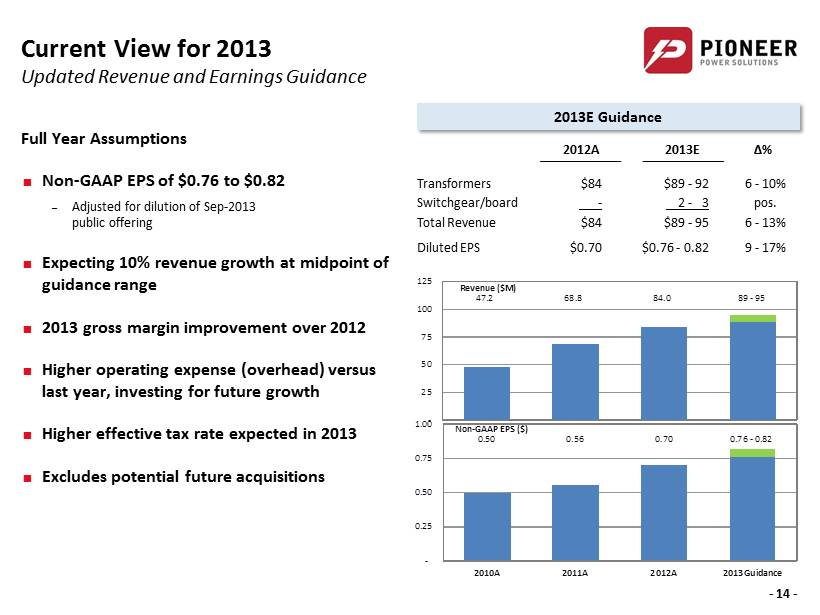
Current View for 2013 Updated Revenue and Earnings Guidance - 14 - Full Year Assumptions Non - GAAP EPS of $0.76 to $0.82 – Adjusted for dilution of Sep - 2013 public offering Expecting 10% revenue growth at midpoint of guidance range 2013 gross margin improvement over 2012 Higher operating expense (overhead) versus last year, investing for future growth Higher effective tax rate expected in 2013 Excludes potential future acquisitions 2013E Guidance 2012A 2013E ∆ % Transformers $84 $89 - 92 6 - 10% Switchgear/board - 2 - 3 pos. Total Revenue $84 $89 - 95 6 - 13% Diluted EPS $0.70 $0.76 - 0.82 9 - 17% Revenue ($M) 47.2 68.8 84.0 89 - 95 Non-GAAP EPS ($) 0.50 0.56 0.70 0.76 - 0.82 - 25 50 75 100 125 - 0.25 0.50 0.75 1.00 2010A 2011A 2012A 2013 Guidance
Investment Summary - 15 - ▪ Stable & profitable core businesses ▪ Recurring blue chip customer base ▪ Aging North American electrical infrastructure needing replacement ▪ Increasing demands and requirements for grid system stability & efficiency ▪ Rising investment in on - site backup power & distributed generation projects ▪ Growth of renewable energy sources needing connection to the power grid ▪ Deep management team with track record of growth, particularly through acquisition

Contact Us - 16 - Investor Relations: Brett Maas Managing Partner Hayden IR, LLC (T) 646.536.7331 brett@haydenir.com www.haydenir.com Corporate Headquarters: Pioneer Power Solutions, Inc. 400 Kelby Street, 9 th Floor Fort Lee, NJ 07024 (T) 212.867.0700 (F) 212.867.1325 www.pioneerpowersolutions.com

Questions & Answers

Supplemental Financial Schedules

Reconciliation of Non - GAAP Measures (In thousands, except per share data) - 19 - Years Ended Nine Months Ended December 31, September 30, 2010 2011 2012 2012 2013 Reconciliation to Non-GAAP Net Earnings and Diluted EPS: Earnings per share from continuing operations (GAAP measure) 0.55$ 0.42$ 0.54$ 0.33$ 0.53$ Earnings from continuing operations (GAAP measure) 3,234$ 2,471$ 3,189$ 1,944$ 3,183$ Amortization of acquisition intangibles 144 252 285 214 213 Stock-based compensation expense 161 254 270 202 140 Stock and warrant issuance expense for services 232 - - - - Non-recurring acquisition and reorganization costs 353 334 55 32 405 (Gain) loss on sale of assets - - (8) (8) (2) Withdrawn financing transaction costs - 487 45 45 - Non-recurring tax (recoveries) non-cash charges, net (831) (26) 411 410 - Tax effects (347) (464) (126) (123) (191) Non-GAAP net earnings 2,945$ 3,307$ 4,121$ 2,716$ 3,748$ Non-GAAP net earnings per diluted share 0.50$ 0.56$ 0.70$ 0.46$ 0.63$ Weighted average diluted shares outstanding 5,931 5,949 5,913 5,910 5,977 Reconciliation to Adjusted EBITDA: Earnings from continuing operations (GAAP measure) 3,234$ 2,471$ 3,189$ 1,944$ 3,183$ Interest expense 182 646 933 699 594 Provision for income taxes 327 773 1,733 1,337 1,674 Depreciation and amortization 763 1,086 1,536 1,124 1,094 Non-recurring acquisition and reorganization costs 353 334 55 32 405 (Gain) loss on sale of assets - - (8) (8) (2) Withdrawn financing transaction costs - 487 45 45 - EBITDA 4,859 5,797 7,483 5,173 6,948 Adjustments to EBITDA: Stock-based compensation expense 161 254 270 202 140 Stock and warrant issuance expense for services 232 - - - - Adjusted EBITDA (Non-GAAP measure) 5,251$ 6,050$ 7,753$ 5,375$ 7,088$

Key Market & Ownership Statistics Ticker Symbol (NASDAQ): PPSI Last Closing Price (11/25/2013): $8.99 Shares Outstanding (M): 7.172 Market Capitalization ($M): $64.5 Freely Traded Float (M): 2.1 - 20 - (a) Based on mid - point of Company’s earnings guidance (b) Beneficial ownership, as adjusted for the public offering of 1.265 million shares completed in September 2013 Market Information Valuation Measures Major Shareholder Ownership Information (b) Stock Trading History Employees and Directors 67.4 % A. Lawrence Carroll Trust 5.9 % WEC Partners LLC 5.4 % Enterprise Value ($M): $70.9 Trailing P/E Ratio ( ttm ) 12.3x Forward P/E Ratio (Dec - 2013) (a) : 9.8x Trailing EBITDA Multiple ( ttm ) 9.4 x Price to Book Ratio ( mrq ) 2.1x