Attached files
| file | filename |
|---|---|
| 8-K - PPBI 8-K INVESTOR PRESENTATION 2013-Q3 - PACIFIC PREMIER BANCORP INC | ppbi_8k-2013q3invpresa.htm |
Exhibit 99.1

Pacific Premier Bancorp, Inc.
Investor Presentation
Third Quarter 2013
Steven R. Gardner
President & Chief Executive Officer

2
Forward-Looking Statements and
Where to Find Additional Information
Where to Find Additional Information
The statements contained in this presentation that are not historical facts are forward-looking statements based on management’s current
expectations and beliefs concerning future developments and their potential effects on Pacific Premier Bancorp, Inc. (the “Company”). Such
statements involve inherent risks and uncertainties, many of which are difficult to predict and are generally beyond the control of the Company.
There can be no assurance that future developments affecting the Company will be the same as those anticipated by management. The Company
cautions readers that a number of important factors could cause actual results to differ materially from those expressed in, or implied or projected
by, such forward-looking statements. These risks and uncertainties include, but are not limited to, the following: the strength of the United States
economy in general and the strength of the local economies in which the Company conducts operations; the effects of, and changes in, trade,
monetary and fiscal policies and laws, including interest rate policies of the Board of Governors of the Federal Reserve System; inflation, interest rate,
market and monetary fluctuations; the timely development of competitive new products and services and the acceptance of these products and
services by new and existing customers; the willingness of users to substitute competitors’ products and services for the Company’s products and
services; the impact of changes in financial services policies, laws and regulations (including the Dodd-Frank Wall Street Reform and Consumer
Protection Act) and of governmental efforts to restructure the U.S. financial regulatory system; technological changes; the effect of acquisitions that
the Company has made or may make; changes in the level of the Company’s nonperforming assets and charge-offs; oversupply of inventory and
continued deterioration in values of California real estate, both residential and commercial; the effect of changes in accounting policies and practices,
as may be adopted from time-to-time by bank regulatory agencies, the Securities and Exchange Commission (“SEC”), the Public Company Accounting
Oversight Board, the Financial Accounting Standards Board or other accounting standards setters; possible other-than-temporary impairments of
securities held by the Company; changes in consumer spending, borrowing and savings habits; the effects of the Company’s lack of a diversified loan
portfolio, including the risks of geographic and industry concentrations; ability to attract deposits and other sources of liquidity; changes in the
financial performance and/or condition of the Company’s borrowers; changes in the competitive environment among financial and bank holding
companies and other financial service providers; unanticipated regulatory or judicial proceedings; and the Company’s ability to manage the risks
involved in the foregoing.
Additional factors that could cause actual results to differ materially from those expressed in the forward-looking statements are discussed in the
Company’s 2012 Annual Report on Form 10-K, as amended, filed with the SEC and other filings made by the Company with the SEC. The Company
specifically disclaims any obligation to update any factors or to publicly announce the result of revisions to any of the forward-looking statements
included herein to reflect future events or developments.
3
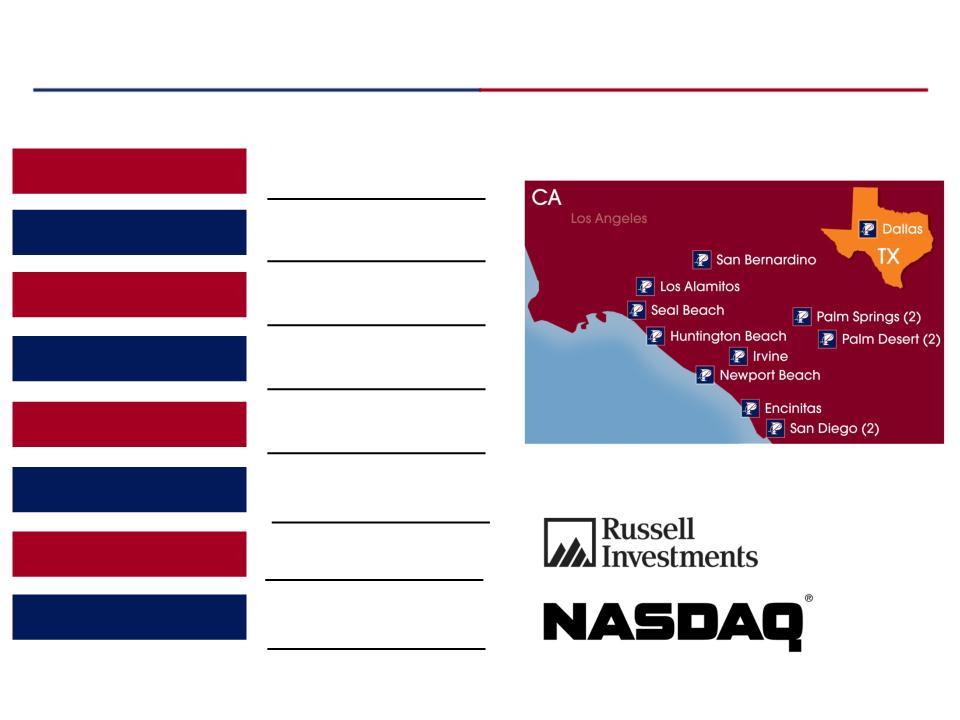
13 Full-Service
Branch Locations
Company Profile
Exchange / Listing
NASDAQ: PPBI
Focus
Small & Mid-Market
Businesses
Businesses
Total Assets
$1.6 Billion
Branch Network
Note: Financial information as of the quarter ending 9/30/2013
Note: Market data as of 12/2/13
Pacific Premier Footprint
Headquarters
Irvine, CA
# of Research Analysts
5 Analysts
Market Cap
$242.2 Million
Avg. Daily Volume
50,309 Shares

4
Where We’ve Been and Where We’re Going
Strategic Plan -
Pre 2008 Stage
§ Conversion from a thrift to a commercial banking platform
§ Improve deposit base - diversify loan portfolio
§ Regimented approach to credit management
Strategic Plan -
Current Stage
§ Organic growth driven by high performing sales culture
§ Geographic and product expansion through disciplined acquisitions
§ Canyon National Bank (CNB) - $209 million in assets at closing on 2/11/2011 (FDIC-Assisted)
§ Palm Desert National Bank (PDNB) - $121 million in assets at closing on 4/27/2012 (FDIC-Assisted)
§ First Associations Bank (FAB) - $394 million in assets at closing on 3/15/2013 (Whole Bank)
§ San Diego Trust Bank (SDTB) - $201 million in assets at closing on 6/25/2013 (Whole Bank)
§ Infinity Franchise Holdings (IFH) - $75 million in assets, pending (Specialty Finance Lender)
Strategic Plan -
Next Stage
§ Focus on producing quality EPS growth
§ Increase revenue from recurring fee income - SBA lending
§ Increase non-interest bearing deposit accounts to over 35% of deposit base
5
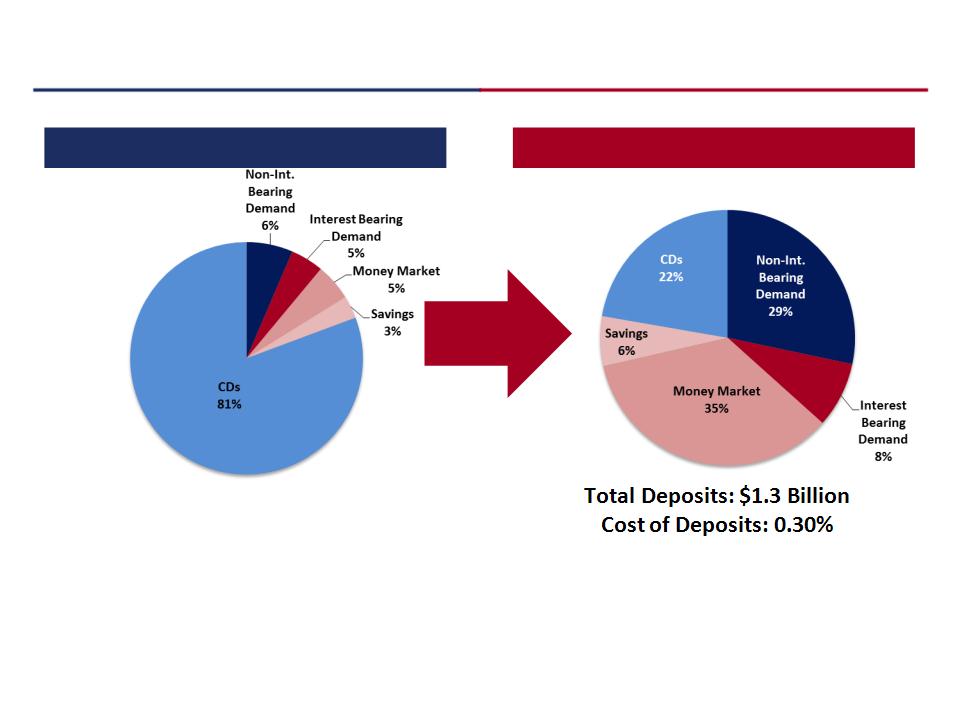
Commercial Bank Transformation - Deposit Composition
Deposit Composition - 12/31/2008
Deposit Composition - 9/30/2013
§ 78% of deposits are non-CD deposits
§ 29% of deposit balances are non-interest bearing deposits
Total Deposits: $457.1 Million
Cost of Deposits: 3.51%
6
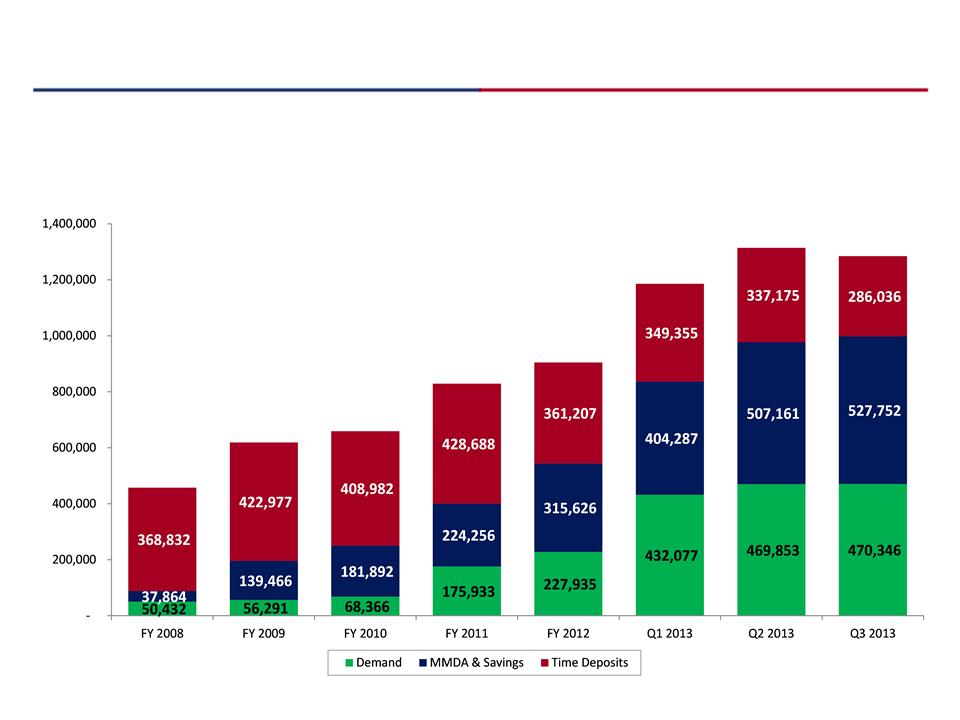
Deposit Franchise Value Creation
§ Transformation from a high-cost, thrift-like deposit base to a low-cost commercial banking deposit base
- cost of deposits of 0.30% at the end of Q3 2013
- cost of deposits of 0.30% at the end of Q3 2013
§ Demand deposits have grown from $50.4 million in 2008 to $470.3 million as of Q3 2013
7
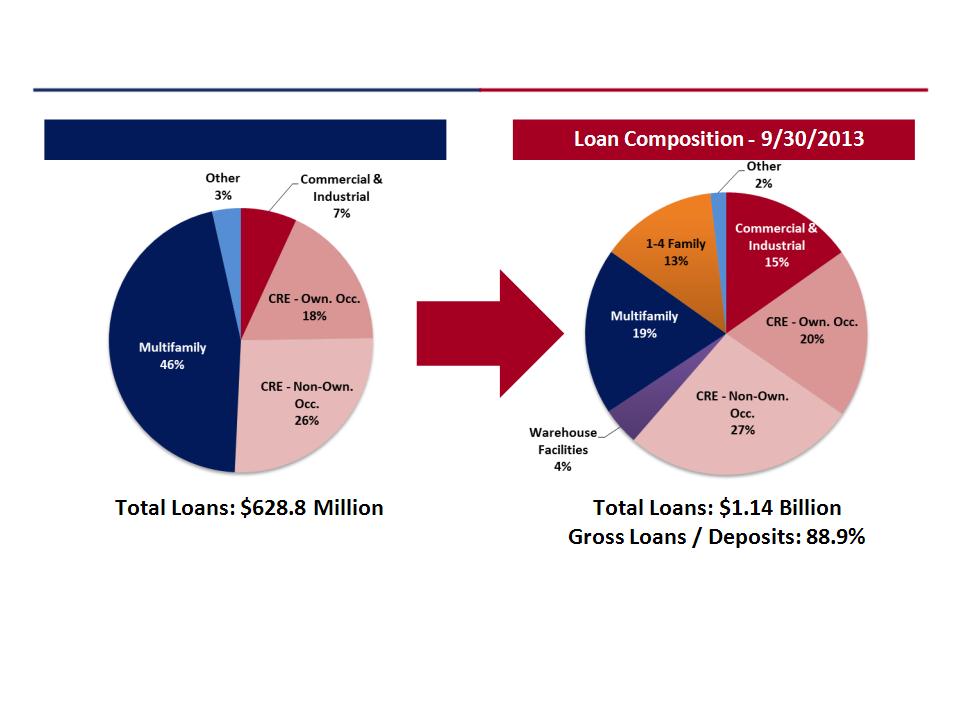
Commercial Bank Transformation - Loan Composition
Loan Composition - 12/31/2008
§ Management has significantly transformed the loan portfolio from one with significant real estate
exposure to a more balanced and well-diversified portfolio
exposure to a more balanced and well-diversified portfolio
§ Total business loans represent 40% of total loans
Gross Loans / Deposits: 137.5%
8
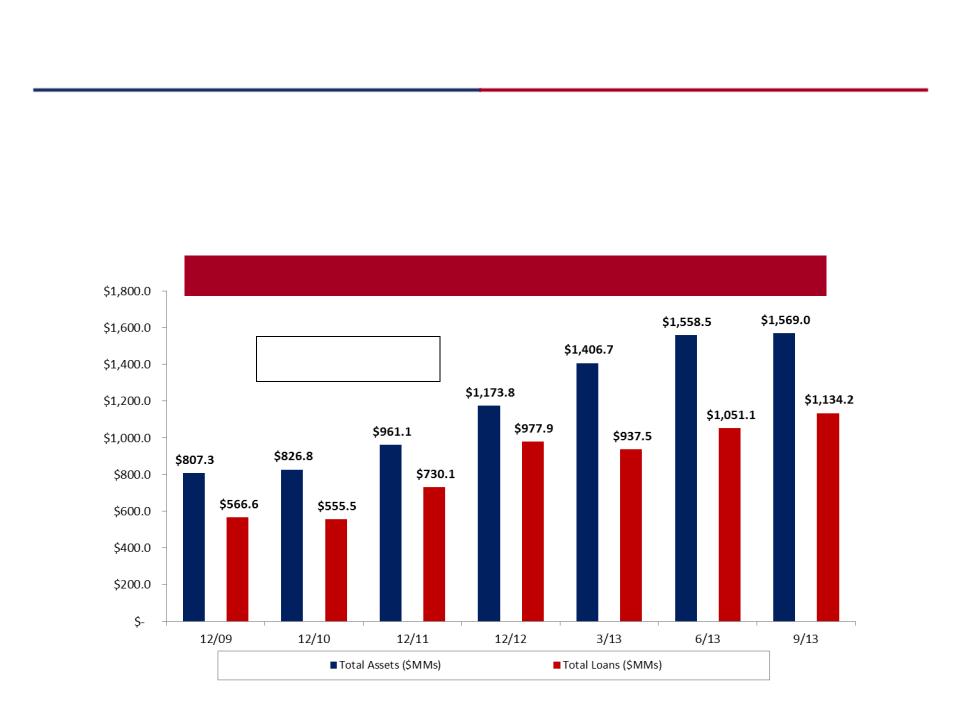
Asset Growth
Total Assets & Total Loans
§ The Company has grown from $807.3 million assets at the end of 2009 to
approximately $1.57 billion as of Q3 2013
approximately $1.57 billion as of Q3 2013
§ Total assets compound annual growth rate of above 19% since 2009
§ Results driven by focus on both organic and acquisitive growth
*CAGR since 12/31/2009
Total Assets CAGR*: 19.4%
Total Loans CAGR*: 20.3%
9
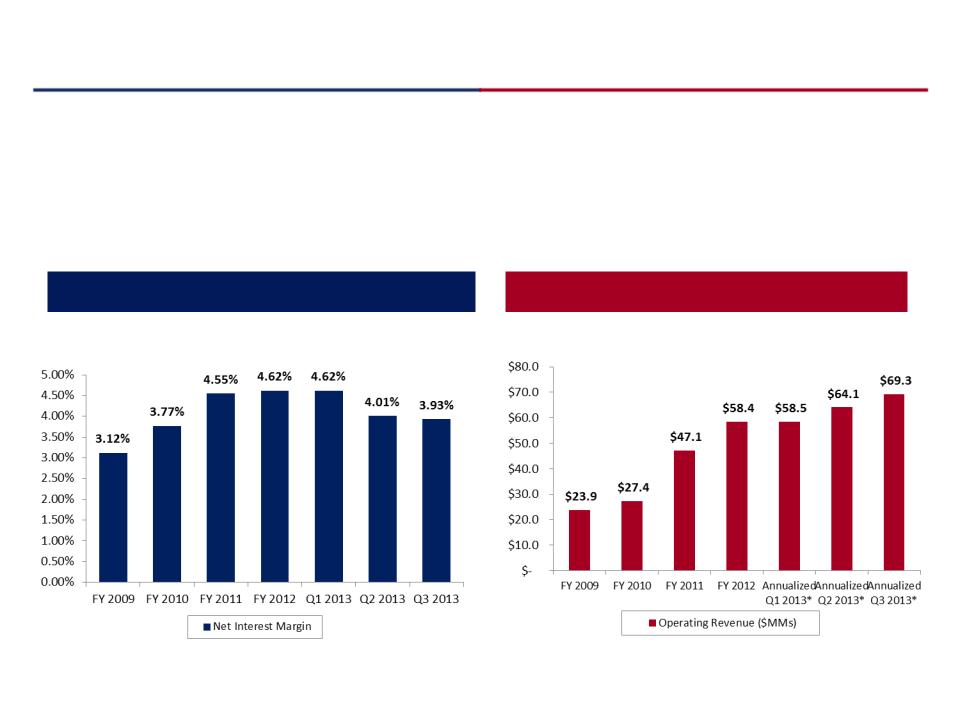
Net Interest Margin & Revenue Growth
Net Interest Margin
Operating Revenue
§ Strength in net interest margin as the Company continues to shift from a legacy thrift to a
commercial banking balance sheet mix
commercial banking balance sheet mix
§ The Company has consistently delivered meaningful operating revenue growth in each of the
last several years
last several years
Note: Operating revenue = net interest income + non-interest income
10
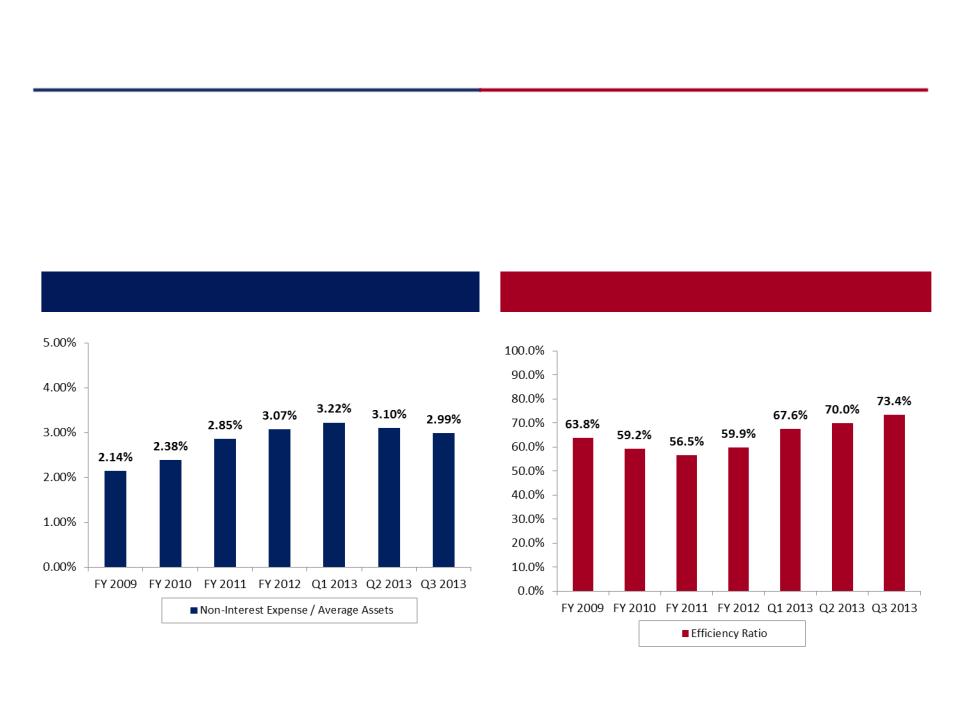
Expenses & Efficiency
Non-Interest Expense / Avg. Assets
Efficiency Ratio
§ The Company continues to support its growth efforts by making significant
investments and hiring talented producers
investments and hiring talented producers
§ The Company will realize benefits from economies of scale as it continues to grow
Note: Exclude s impact from non-recurring merger expense s related to the Company’s
recent acquisitions in Q1 and Q2
recent acquisitions in Q1 and Q2
11
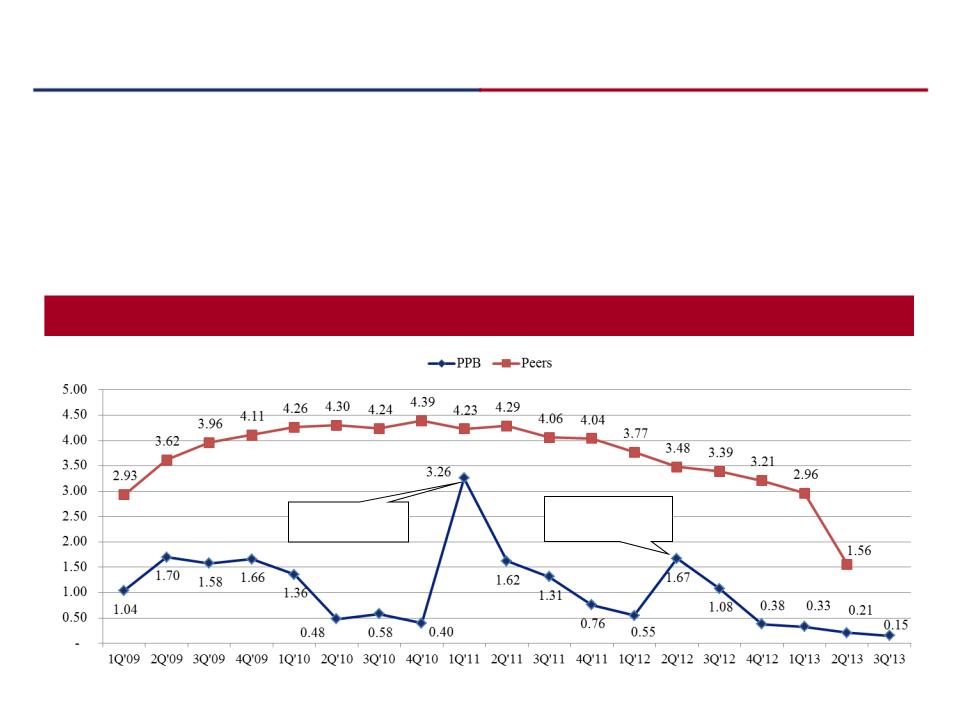
Conservative Credit Culture
Nonperforming Assets to Total Assets
§ The Company has a history of pro-actively addressing credit issues through aggressive problem-asset
resolution, which is demonstrated by its significant outperformance of peers over the last several years
resolution, which is demonstrated by its significant outperformance of peers over the last several years
§ No troubled debt restructurings (“TDRs”)
§ Loan sales utilized strategically to manage risk
CNB Acquisition
2/11/11
PDNB Acquisition
4/27/12
* California peer group consists of all insured California institutions, from SNL Financial.

12
§ Ranked #2 in SNL Financial’s Top Performing Banks of 2012 ($500MM - $5.0B Assets)
§ Raymond James Community Bankers Cup Winner (2012)
§ Top 10% of banks based on profitability, operational efficiency and balance sheet metrics ($500MM - $10.0B Assets)
§ Ranked #52 in American Banker’s Top 200 Community Banks (2012)
§ Based on average ROAE over the last 3 years
§ Ranked #7 top performer by Independent Community Bankers of America (“ICBA”)
§ Performance measured by return on average equity for banks with assets > $1.0B
§ Sandler O’Neill + Partners “Sm-All” Star - Class of 2011
§ Top 25 bank & thrifts with a market capitalization < $2.0B
§ BauerFinancial 5-Star rating - recognition as a “Superior Bank” by the nation’s leading independent bank rating
service (2011)
service (2011)
Pacific Premier Bancorp, Inc. has received industry recognition and numerous
awards for its outstanding client service and performance
awards for its outstanding client service and performance
Award Winning Performance
COMMUNITY BANKERS CUP
13
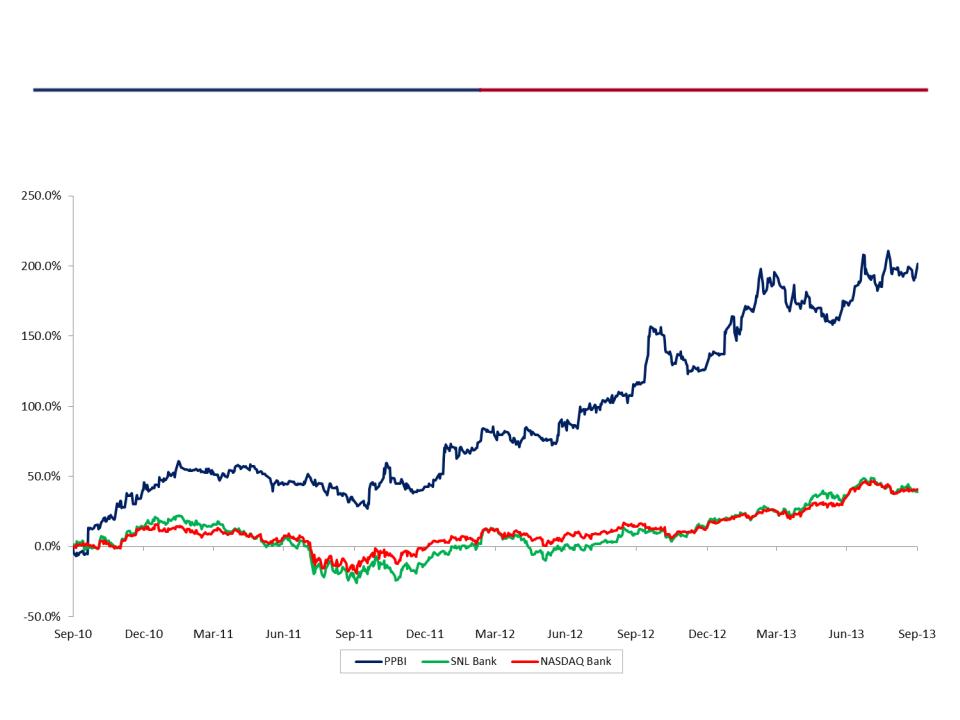
Superior Market Performance (PPBI)
Source: SNL Financial, market information as of 9/30/2013
§ The Company has significantly outperformed its publicly traded bank peers (SNL Bank Index / NASDAQ Bank Index) in the
market over the last 3 years
market over the last 3 years
§ Since September 2010, PPBI’s stock price is up 202% versus the SNL Bank at 39% and NASDAQ bank indices at 41%
+202%
+39%
+41%

14
Overview of Q3 2013 Results
§ Third Quarter 2013 Shareholder Highlights
§ Diluted earnings per share of $0.18
§ Return on average assets of 0.78%
§ Return on average equity of 7.29%
§ Tangible book value per share increases $0.20 to $8.82
§ Third Quarter 2013 Performance
§ Total assets of approximately $1.6 billion, up 33.7% since December 31, 2012
§ Cost of deposits dropped five basis point to 0.30%
§ Non-interest bearing deposits increase by 5% to $364 million, or 28% of total deposits
§ Net Interest margin of 3.93% (reflects excess liquidity following acquisitions)
§ Pristine credit quality - nonperforming assets / total assets of 0.15%
§ Other Highlights
§ Significant business development momentum
§ Total loans increased 8% to $1.1 billion as excess liquidity was deployed
§ System conversions completed for both FAB and SDTB
(1) Adjusted excludes merger related expenses
15
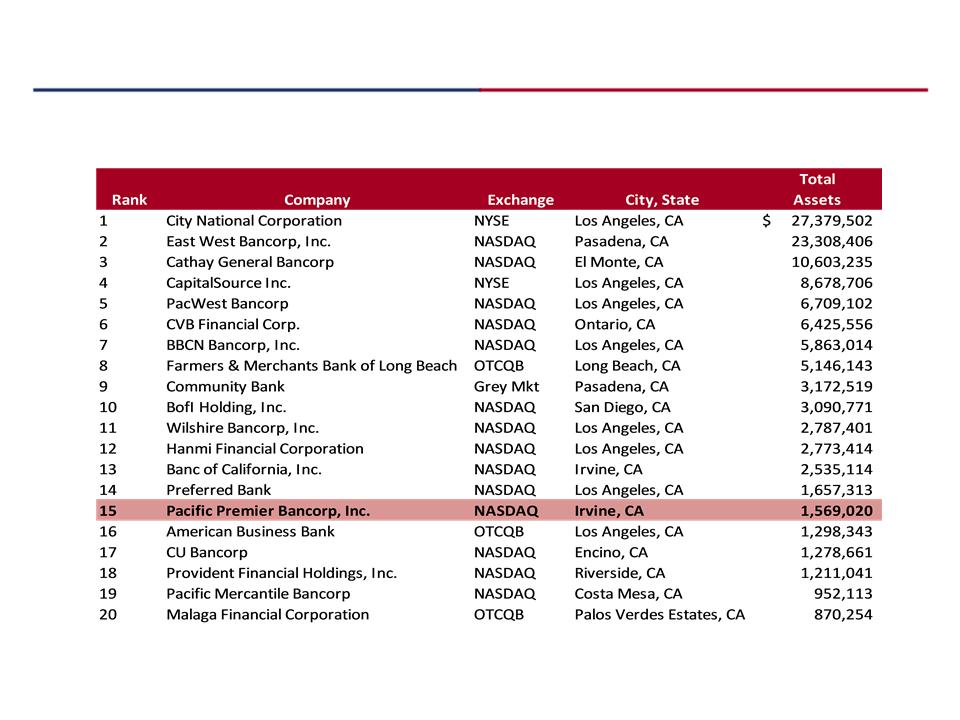
Scarcity Value - Public Banks in Southern CA*
*Southern CA includes Los Angeles, Orange, Imperial, Riverside ,
San Bernardino and San Diego counties
§ 15th largest exchange listed banks by total assets in Southern California* (top 20
shown below)
shown below)
Source: SNL Financial, as of 6/30/2013, PPBI as of 9/30/13
Note: Includes banks listed on NASDAQ/NYSE/OTCB

16
Keys to Building Out the Franchise
§ Relationship Banking Model - Strong Sales Culture
§ Growing Low-Cost Core Deposit Base - Increasing Franchise Value
§ Robust Earnings Stream - Building Book Value
§ Disciplined Approach to Acquisitive Growth and Integration
§ Strong Capital Management - Leveraging Capital Base
§ Diligent Credit Underwriting and Excellent Asset Quality

17
High Performing Sales Culture Drives Organic Growth
§ Business development team consists of early career sales executives
with real estate or financial services experience
with real estate or financial services experience
§ Consistent calling effort identifies prospects
§ Diligent monitoring and management of quantity and quality of lead
generation
generation
§ Senior commercial bankers utilized to close new relationships
Business
Development /
Sales Infrastructure
Development /
Sales Infrastructure
Consistent
Contact
Contact
Lead
Generation
Management
Generation
Management
Senior Commercial
Bankers Close New
Relationships
Bankers Close New
Relationships

18
§ Small and middle market business banking focus
§ Full suite of business banking services, including: cash
management, payroll and merchant card services
management, payroll and merchant card services
§ Customized C&I and commercial real estate loans
Commercial Banking Business Units
Business Banking
SBA Lending
HOA Banking & Lending
Warehouse Lending
Income Property Lending
§ Small Business Administration (“SBA”) Loans
§ California Capital Access Program (“Cal CAP”) Loans
§ United State Department of Agriculture (“USDA”) Loans
§ Bureau of Indian Affairs (“BIA”) Loans
§ Nationwide leader of customized cash management,
electronic banking services and credit facilities for:
electronic banking services and credit facilities for:
§ Home Owner Association (“HOA”) Companies
§ HOA Management Companies
§ Property Management Firms
§ Credit facilities and electronic banking services
exclusively designed for large and small mortgage
banking concerns
exclusively designed for large and small mortgage
banking concerns
§ Credit facilities and banking services for commercial
real estate (“CRE”) investors
real estate (“CRE”) investors
§ Structured CRE and bridge loan flexibility
Construction Lending
§ Construction loans for developers and owner users on
residential and CRE properties
residential and CRE properties
§ New team assembled in first half of 2013

19
Acquisition & Integration Strategy
General Acquisition Criteria
Integration Strategy
§ Look for strategic, financially compelling and
culturally compatible organizations
culturally compatible organizations
§ Favorable markets / demographics
§ Business line diversification / cross-sell
opportunity
opportunity
§ Disciplined approach to analysis, pricing and
structuring of each transaction
structuring of each transaction
§ Realistic cost savings assumptions
§ Core customer retention
§ Keeping franchise value intact
§ Immediately accretive to EPS
§ Minimum 15% internal rate of return
§ Maximum 10% dilution to tangible book value
per share (Earn-back period of 4 years or less)
per share (Earn-back period of 4 years or less)
§ Aggressive approach to timely and effective
integration
integration
§ Identify key players that fit into our culture
and who can add value to the organization
and who can add value to the organization
§ Immediately meet with new customer base to
begin cross-selling products and services
begin cross-selling products and services
§ Aggressive approach to disposition of any
problem assets inherited in a transaction
problem assets inherited in a transaction
§ Diligent approach to acquisitive growth and business integration

20
Infinity Franchise Holdings
|
Strategic
Rationale |
§ Expanding PPBI’s commercial banking franchise with acquisition of specialty finance lender
§ Lender to established franchisees of Quick Serve Restaurants “QSR” such as Dunkin’ Donuts, Burger King,
Wendy’s, Jack in the Box, Taco Bell, etc. § Further diversifies PPBI’s loan portfolio with C&I and Owner-Occupied CRE loans
§ Asset generating platform with attractive loan yields which will enhance PPBI’s net interest margin
|
|
Financially
Attractive |
§ Valuation multiples below other recent comparable specialty finance transactions
§ Limited credit risk due to clean loan portfolio, no delinquencies or classified assets
§ Combined company is better positioned to drive long-term EPS growth
|
|
Structure and
Team |
§ IFH will operate as a separate division of Pacific Premier Bank (“PPB”)
§ Management team has been together for nearly 20 years and originated over $1.7 billion in franchise loans
§ PPBI will retain most IFH employees
|
|
Transaction
Detail |
§ Deal consideration of approximately $16 million consisting of a 50/50 stock/cash mix (1)
§ Anticipated closing in early Q1 2014, subject to customary regulatory approvals
§ Due diligence included extensive review of loan portfolio and operations
§ Attractive economics for PPBI - Accretive to 2014 EPS, 1.4% dilutive to tangible book value per share, 1.2
year tangible book value payback and 20%+ IRR |
(1) Shares issued based on PPBI stock price of $13.94 subject to a 5% +/- collar. Total consideration will adjust based on the change in IFH’s Adjusted Net Asset Value
between 9/30/2013 and the closing date.
between 9/30/2013 and the closing date.
21
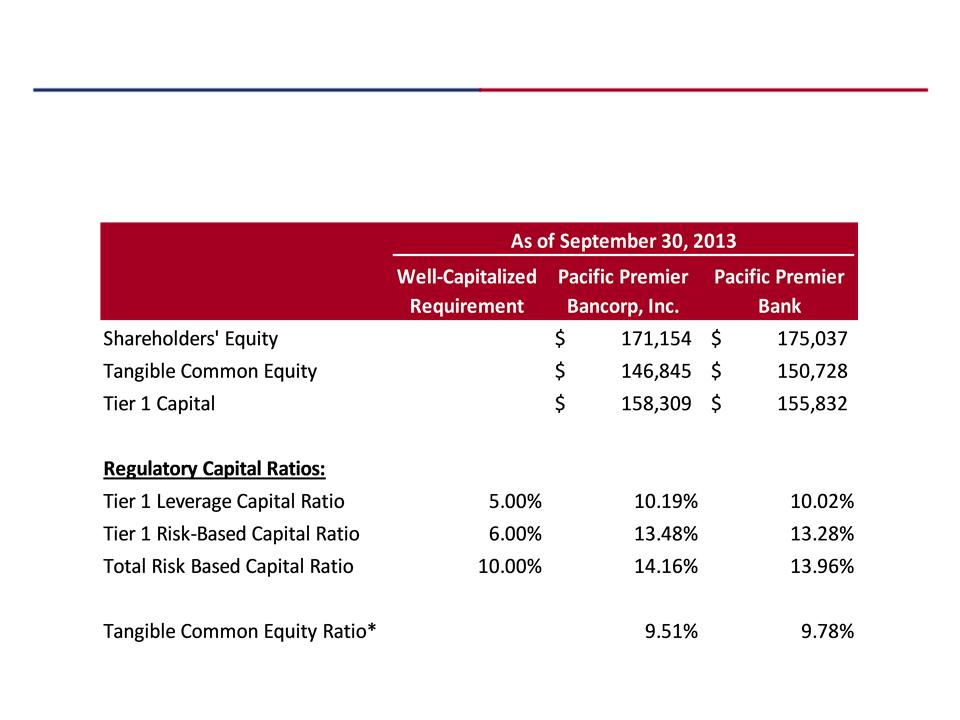
Capital Resources
§ Well capitalized and equipped with the necessary capital resources to continue to execute on
the Company’s growth strategy by pursuing organic and acquisitive growth opportunities
the Company’s growth strategy by pursuing organic and acquisitive growth opportunities
§ Pure common equity capital structure (no TARP / preferred equity)
*Please refer to non-GAAP reconciliation

22
§ New bankers positively impacting organic loan portfolio growth
§ SBA loan production generating meaningful non-interest income
§ Liquidity and deposit platform to fund future loan growth
§ California presents significant acquisition opportunities
§ Proven management team with a track record of executing on acquisitions
Outlook
Continued Focus on Building Long-term Franchise Value
23
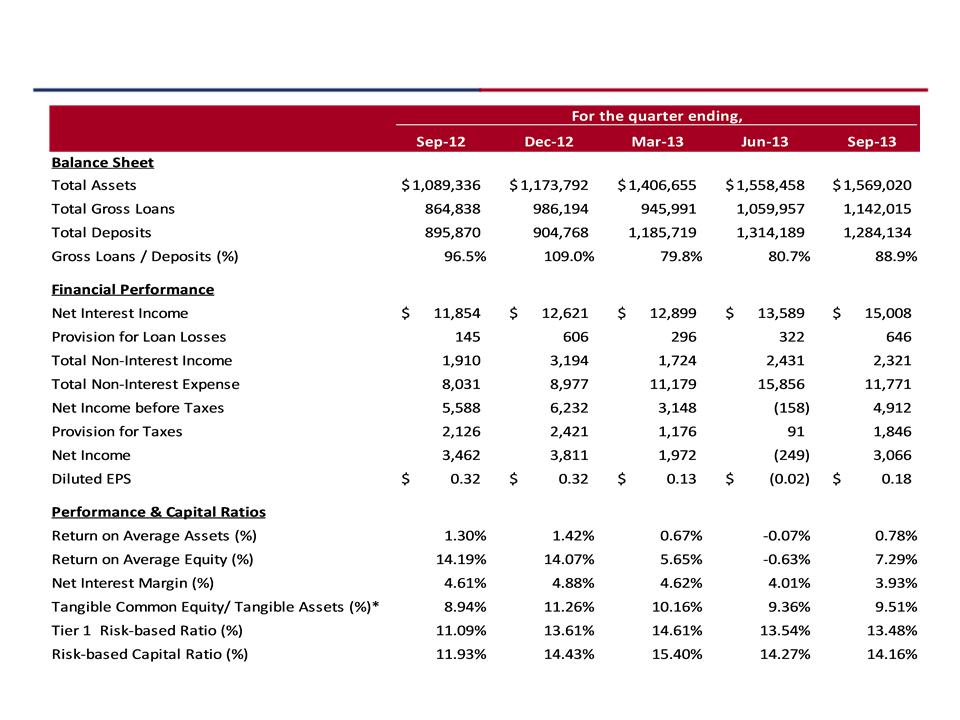
Financial Highlights
Note: All dollars in thousands, except per share
*Please refer to non-GAAP reconciliation
24
Non-GAAP Financial Measures
Tangible common equity and tangible book value per share are non-GAAP financial measures derived from GAAP-based amounts. We calculate tangible common equity by excluding
the balance of intangible assets from common stockholders’ equity. We calculate tangible book value per share by dividing tangible common equity by common shares outstanding,
as compared to book value per common share, which we calculate by dividing common stockholders’ equity by common shares outstanding. We believe that this is consistent with
the treatment by bank regulatory agencies, which exclude intangible assets from the calculation of risk-based capital ratios. Accordingly, we believe that these non-GAAP financial
measures provide information that is important to investors and that is useful in understanding our capital position and ratios. However, these non-GAAP financial measures are
supplemental and are not a substitute for an analysis based on GAAP measures. As other companies may use different calculations for these measures, this presentation may not be
comparable to other similarly titled measures reported by other companies. A reconciliation of the non-GAAP measures of tangible common equity and tangible book value per
share to the GAAP measures of common stockholders’ equity and book value per share is set forth.
|
|
PPBI
|
PPB
|
|
|
9/30/2013
|
9/30/2013
|
|
Common Stockholders’ Equity
|
$171,154
|
$175,037
|
|
Less: Intangible Assets
|
(24,309)
|
(24,309)
|
|
Tangible Common Equity
|
$146,845
|
$150,728
|
|
Book Value per Share
|
$10.28
|
-
|
|
Less: Intangible Assets per Share
|
(1.46)
|
-
|
|
Tangible Book Value per Share
|
$8.82
|
-
|
|
Total Assets
|
$1,569,020
|
$1,565,002
|
|
Less: Intangible Assets
|
(24,309)
|
(24,309)
|
|
Tangible Assets
|
$1,544,711
|
$1,540,693
|
|
Tangible Common Equity Ratio
|
9.51%
|
9.78%
|