Attached files
| file | filename |
|---|---|
| 8-K - 8-K - GUE Liquidation Companies, Inc. | a13-25440_18k.htm |
Exhibit 99.1
|
|
FTD Companies, Inc. Investor Presentation December 2013 FTD Group, Inc. |

|
|
Forward-Looking Statements and Risk Factors This presentation contains forward-looking statements within the meaning of the “safe harbor” provisions of the Private Securities Litigation Reform Act of 1995, as amended, based on our current expectations, estimates and projections about our operations, industry, financial condition, performance, results of operations, and liquidity. Statements containing words such as “may,” “believe,” “anticipate,” “expect,” “intend,” “plan,” “project,” “projections,” “business outlook,” “estimate,” or similar expressions constitute forward-looking statements. These forward-looking statements include, but are not limited to, statements about our strategies; the expected benefits of our separation from United Online; future financial performance; revenues; metrics; operating expenses; market trends, including those in the markets in which we compete; liquidity; cash flows and uses of cash; dividends; capital expenditures; depreciation and amortization; tax payments; foreign currency exchange rates; hedging arrangements; our ability to repay indebtedness and invest in initiatives; our products and services; pricing; marketing plans; competition; settlement of legal matters; and the impact of accounting pronouncements. Potential factors that could affect the matters about which the forward-looking statements are made include, among others, the factors disclosed in the Company’s filings with the Securities and Exchange Commission (www.sec.gov), including without limitation, information under the captions “Management’s Discussion and Analysis of Financial Condition and Results of Operations” and “Risk Factors.” Readers are cautioned not to place undue reliance on these forward-looking statements, which reflect management’s analysis only as of the date hereof. Any such forward-looking statements are not guarantees of future performance or results and involve risks and uncertainties that may cause actual performance and results to differ materially from those predicted. Reported results should not be considered an indication of future performance. Except as required by law, we undertake no obligation to publicly release the results of any revision to these forward-looking statements that may be made to reflect events or circumstances after the date hereof or to reflect the occurrence of unanticipated events. FTD reserves all rights to our trademarks, trade names and service marks, regardless of the manner in which we refer to them in this presentation. All other trademarks, trade names and service marks appearing in this presentation are the property of their respective owners. |

|
|
I. Business Overview II. Why Invest in FTD? III. Financial Information Table of Contents 2 |

|
|
I. Business Overview 3 |

|
|
Company History 2004 2005 2006 2007 2008 2009 2010 2011 2012 February 2004 – Leonard Green & Partners acquires FTD August 2008 – United Online, Inc. acquires FTD Group, Inc. April 2012 – Interflora British Unit acquires Gifts division of Flying Brands, comprised of Flying Flowers, Flowers Direct and Drake Algar businesses July 2006 – FTD acquires Interflora British Unit February 2005 – FTD Group, Inc. files an IPO to be listed on NYSE under the ticker “FTD” 2013 November 2013 – United Online, Inc. completes tax-free Spin-Off to make FTD Companies, Inc. an independent, publicly-traded company listed on NASDAQ under the ticker “FTD” 2002 1999 1923 1910 1910 – FTD is founded in Rochester, NY by John A. Valentine 1923 – A British Unit of FTD is formed in response to the success of the network in America, now known as Interflora 1999 – FTD.COM files an IPO to be listed on NASDAQ under the ticker “EFTD” 2002 – FTD, Inc. completes a reverse merger with FTD.COM pursuant to which FTD, Inc. became listed on NASDAQ under the ticker "FTDI" |

|
|
About FTD FTD Companies, Inc. is a premier floral and gift products and services company which uses the highly-recognized FTD® and Interflora® brands, both supported by the iconic Mercury Man logo that is displayed in nearly 40,000 floral shops worldwide. The business is made up of: a domestic business-to-consumer (“B2C”) business a domestic business-to-business (“B2B”) floral network business an international business with both B2C and B2B businesses FTD vision statement “To be the leading and most trusted floral and gifting brands in the world.” FTD mission statement “To inspire, support, and delight our customers when expressing life’s most important sentiments.” International Rev: $157.1mm 25% of total Florist Rev: $158.2mm 26% of total Consumer International Florist 2012 Revenues: $613.5mm |

|
|
Widely-Recognized Brands in FTD, Interflora and the Iconic Mercury Man FTD BRAND INTERFLORA BRAND FTD and Interflora actively market their domestic and international brands online, and through integrated marketing campaigns FTD has high brand awareness in the floral and retail industries Interflora has the highest unaided brand awareness compared to its floral industry competitors1 High degree of repeat customers evidences brand loyalty Mercury Man is one of the most recognized brand symbols worldwide FTD and Interflora have established premier brands that resonate with consumers and florists Note: 1. Source: Interflora Brand Awareness. Aurora Market Research 6 |
|
|
FTD Operates Complementary Businesses CONSUMER BUSINESSES FLORIST BUSINESSES Online-oriented direct marketer of floral and gift products, with high consumer brand recognition ~90% of orders placed online vs. ~10% via phone Products delivered by FTD or Interflora member florists or third parties in an elegant, award winning gift box Benefits from low-inventory and negative working capital business model, with consumers paying for their orders in advance of delivery Large florist network fulfills the majority of FTD and Interflora consumer orders DOMESTIC INTERNATIONAL CONSUMER FLORIST CONSUMER FLORIST U.S. services include: Membership / use of brand Order transmission Systems access and support Hosting websites Advertising programs Credit card processing Customer support U.S. products include: POS systems Hard goods Fresh flowers U.K. services include: Membership / brand licensing Order transmission Hosting websites U.K. products include: Hard goods Fresh flowers We also offer business to business products and services to other retail locations, funeral directors and other corporations looking for floral and gifting solutions. 7 |
|
|
Strong Operating Performance Consolidated Revenues have increased steadily with a 5% CAGR1 from 2010 to 2012 (excluding changes in fx rates) Consolidated Revenues have grown across all divisions since 2010 Consolidated Adjusted EBITDA has increased at a 7% CAGR1 from 2010 to 2012 (excluding changes in fx rates) Business delivers strong and consistent cash flows FTD’s steady revenue growth has produced strong operating cash flows Consolidated Revenues ($MM) Consolidated Adjusted EBITDA2 and Margin ($MM) Notes: CAGRs exclude the impact of changes in foreign exchange (“fx”) rates. Including the impact of changes in fx rates, the revenue CAGR from 2010 to 2012 was 5% and the Adjusted EBITDA CAGR was 8%. Adjusted EBITDA is non-GAAP. See appendix for non-GAAP to GAAP definitions and reconciliations. 5% CAGR 78% Products Revenue 22% Services 26% Internat’l 74% Domestic Revenue |
|
|
Floral Industry Overview $28 billion industry1 Approximately 15,000 retail florists2 with $7 billion in retail sales2 Supermarket / mass market sales of $7 billion3 Estimated online floral sales of $4 billion4 Notes: 1. Source: U.S. Department of Commerce / Bureau of Economic Analysis (2013) 2. Source: U.S. Department of Commerce (2011) 3. Source: Superfloral retailing website (2007) 4. Source: Forrester (2008) 5. Source: Mintel, a market research company (2008 survey) U.S. FLORAL INDUSTRY U.K. FLORAL INDUSTRY £2 billion industry 5 California Colombia / Ecuador Holland Flowers Grown MAJOR AREAS OF FLORAL PRODUCTION |
|
|
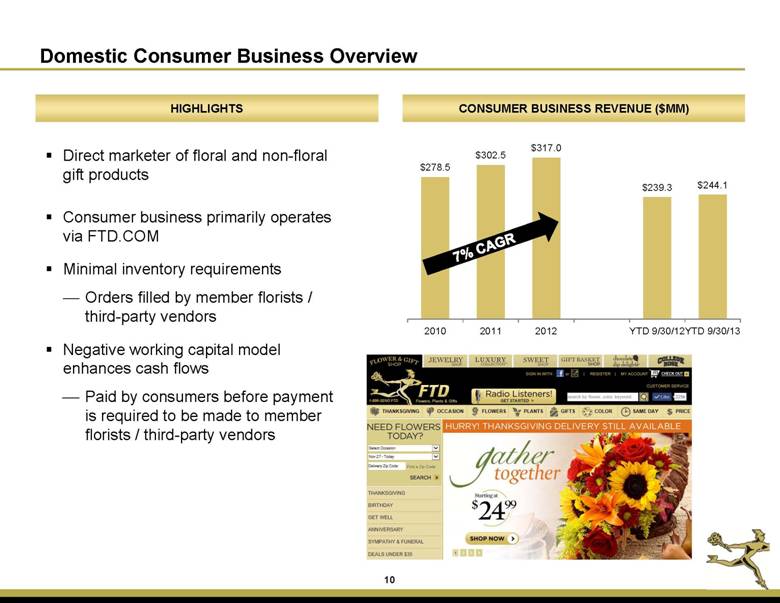
Domestic Consumer Business Overview HIGHLIGHTS CONSUMER BUSINESS REVENUE ($MM) Direct marketer of floral and non-floral gift products Consumer business primarily operates via FTD.COM Minimal inventory requirements Orders filled by member florists / third-party vendors Negative working capital model enhances cash flows Paid by consumers before payment is required to be made to member florists / third-party vendors 7% CAGR |
|
|
Domestic Florist Business Overview Order Related Transaction fees paid by member florists to FTD for orders routed for fulfillment Membership Fees Fees paid by member florists for inclusion in network, use of the brand Publications Advertising revenue for member florists to be included in print and online directory Support and Access Access to the Mercury Network and technology support Online Services Revenue related to FTD’s management, hosting and advertising of member florists’ websites Other Services Includes Credit Card, International, “Flowers All Hours” and Member Marketing Fresh Flowers Fresh cut flowers FTD sells to member florists and other non-member retailers Containers Holiday and everyday branded vases and containers Point of Sale Systems FTD technology solutions, including the Mercury POS system, which connects member florists to the Mercury Network Other Products Non-branded hard goods and web gifts Services Products HIGHLIGHTS Member florists include traditional retail florists and other non florist retail locations Long-standing relationships with member florists Significant recurring revenues from order, membership and other service fees Leverages significant order flow from FTD’s Consumer business Minimal inventory required FLORIST BUSINESS REVENUE ($MM) 2% CAGR |

|
|
International Business Overview Interflora operates a consumer business and a florist business, similar to the U.S. businesses Similar to the U.S. businesses, minimal inventory requirements, as orders are filled by member florists and third-party vendors Strong and long-standing brand recognition since its establishment in 1923, with highest consumer awareness in the U.K. for flower delivery1 Note: Source: Aurora Market Research 4% CAGR excluding the impact of fluctuations in fx rates. Including changes in fx rates, the CAGR was 5%. 4% CAGR2 HIGHLIGHTS INTERNATIONAL BUSINESS REVENUE ($MM) |

|
|
II. Why Invest in FTD? 13 |

|
|
Investment Highlights Premier Brands: FTD, Interflora and the Iconic Mercury Man Strong Consistent Cash Flows Driven by Business Model Continued Innovative and Differentiated Products and Services Differentiation Through “Best In Class” Partner Brands Gift Business Expansion 1 |

|
|
Premier Brands, Experienced Management Team FTD and Interflora both are among the leading and most trusted floral and gifting brands in the world FTD and Interflora have high unaided brand awareness with consumers Iconic Mercury Man logo in nearly 40,000 floral shops globally and one of the most recognized global floral symbols worldwide Extensive network of member florists and customers in the U.S., Canada, the U.K., and the Republic of Ireland Experienced management team has successfully executed numerous operating and marketing initiatives to enhance the business in the challenging economic environment since 2008 FTD, a true American iconic brand with over a 100 year history, and Interflora, an iconic brand with a 90 year history in the U.K. |

|
|
Strong Consistent Cash Flows Driven by Business Model Business Model The majority of florist business revenues are derived from recurring order, membership and other service fees Florist Business Revenues Are Largely Recurring Consumers pay FTD before FTD is required to pay its floral network members or third parties for fulfillment Negative Working Capital Limited capital expenditures required to support the business Limited Capex Requirements Floral network members and third-party vendors fulfill consumer floral and gift orders Limited Inventory |

|
|
Innovative and Differentiated Products FTD’s continued product innovations advance its competitive positioning with both consumers and florists COLOR YOUR DAY™ FTD COLLEGE ROSE COLLECTION™ FTD FLORAL JEWELS™ Best seller for Birthdays and Get Well Expanded to more than 55 schools on FTD.COM Print, TV, and social media coverage on College Roses Created a floral and jewelry gifting solution around birthdays |

|
|
Innovative and Differentiated Products (cont’d) LUXURY MY INTERFLORA CREATION Created the luxury category in the online floral industry Caters to untapped floral market for special luxury arrangements/higher AOVs1 FTD’s continued product innovations advance its competitive positioning with both consumers and florists Customer builds their own bouquet with their own design that they create on the Interflora website Note: 1. Average Order Value (“AOV”) represents average amount received for consumer orders delivered during a period; Consumer Orders represent orders delivered during the period |
|
|
Innovative and Differentiated Products (cont’d) Exclusive partnership Special Better Homes & Gardens arrangements created in collaboration with FTD and Better Homes & Gardens designers Exclusive partnership Created in collaboration with FTD and Vera Wang designers |
|
|
FTD revolutionized merchandising in the floral industry with its “Good, Better, Best” (“GBB”) upsell marketing strategy Innovative and Differentiated Products (cont’d) |
|
|
Differentiation Through “Best In Class” Partner Brands Trademarks are registered and unregistered trademarks of their respective owners. 21 |
|
|
Launched gift stores-within-a-store concept to provide broad assortment of gift verticals and capture consumer demand with floral or stand alone gift purchase New Gift Stores – Launched Stores Within FTD.COM 22 |
|
|
III. Financial Information |

|
|
Strong Operating Performance Consolidated Revenues have increased steadily with a 5% CAGR1 from 2010 to 2012 (excluding changes in fx rates) Consolidated Revenues have grown across all divisions since 2010 Consolidated Adjusted EBITDA has increased at a 7% CAGR1 from 2010 to 2012 (excluding changes in fx rates) Business delivers strong and consistent cash flows FTD’s steady revenue growth has produced strong operating cash flows Consolidated Revenues ($MM) Consolidated Adjusted EBITDA2 and Margin ($MM) Notes: 1. CAGRs exclude the impact of changes in fx rates. Including the impact of changes in fx rates, the revenue CAGR from 2010 to 2012 was 5% and the Adjusted EBITDA CAGR was 8%. 2. Adjusted EBITDA is non-GAAP. See appendix for non-GAAP to GAAP definitions and reconciliations. 5% CAGR 78% Products Revenue 22% Services 26% Internat’1 74% Domestic Revenue 24 |

|
|
Cash Flow Summary FTD’s consumer businesses operate with negative working capital as consumers pay FTD before FTD is required to pay floral network members or fulfillment partners Limited capital expenditures required to support business Strong free cash flow Capital Expenditures ($MM) Negative Working Capital ($MM) 2 Free Cash Flow ($MM) 1 Notes: Free Cash Flow is non-GAAP. See appendix for non-GAAP to GAAP definitions and reconciliations. Working capital is non-GAAP and is defined as current assets, excluding cash and cash equivalents, less current liabilities, excluding the current portion of long-term debt, payable to United Online, Inc. and current income taxes payable. See appendix for non-GAAP to GAAP reconciliations. At December 31, 2012 the Company had $1.2 million of property and equipment that was not yet paid for and was included in accounts payable and other liabilities in the consolidated balance sheet. 3 |
|
|
Net Debt and Capitalization Net Debt ($MM) 1 Note: Net debt is non-GAAP and is defined as total debt, net of discounts, less cash and cash equivalents. See appendix for non-GAAP to GAAP definitions and reconciliations. $350MM 5 year revolving credit facility $220MM drawn at 9/30/13 2% interest rate as of 9/30/13 18.6 million shares at 11/1/13 |

|
|
Historical Operating Margins Sales and Marketing General and Administrative Total Cost of Revenues Consistent operating costs as a percentage of total revenues, across all categories. |

|
|
Q&A |

|
|
Appendix |

|
|
Economics of an FTD Order CUSTOMER ORDER FTD.COM 1-800-SEND-FTD Florist to Florist Order Gatherers FTD CLEARINGHOUSE END CUSTOMER FTD DIRECT SHIP 3rd party floral & gift vendors Specialty plants Gift baskets FTD MEMBER FLORIST 80 / 20 Split (Sender 20% / Filler 80%) 7% Clearinghouse Fee Transmission Fee per Order |

|
|
Revenue Reconciliation 2010 2011 2012 YTD 9/30/12 YTD 9/30/13 Consumer Business 278,468 $ 302,479 $ 317,018 $ 239,342 $ 244,102 $ Florist Business 152,036 151,854 158,165 119,031 124,976 International Business 141,403 150,935 157,081 115,920 118,217 Intercompany Eliminations (17,331) (18,019) (18,750) (13,957) (14,206) Consolidated Revenues 554,576 $ 587,249 $ 613,514 $ 460,336 $ 473,089 $ |
|
|
Net Income to Adjusted EBITDA1 Reconciliation Note: For the definition of EBITDA and Adjusted EBITDA, please see following non-GAAP definitions. 2010 2011 2012 YTD 9/30/12 YTD 9/30/13 Net income, as reported (GAAP basis) 6,607 $ 15,721 $ 21,174 $ 15,625 $ 14,955 $ Interest expense, net 22,536 21,644 12,812 9,737 9,954 Provision for income taxes 3,396 5,592 10,830 7,472 6,958 Depreciation and amortization 33,802 34,022 35,358 26,573 25,151 EBITDA 1 66,341 76,979 80,174 59,407 57,018 Stock-based compensation 5,777 5,074 5,113 3,841 3,598 Restructuring and other exit costs 1,574 876 - - - Transaction Related Costs - - 593 619 4,722 Litigation or Dispute Settlement Charges (Gains) 400 75 (193) (193) 578 Adjusted EBITDA 1 74,092 $ 83,004 $ 85,687 $ 63,674 $ 65,916 $ |

|
|
Net Cash Provided by Operating Activities to Free Cash Flow1 Reconciliation Note: For the definition of Free Cash Flow, please see following non-GAAP definitions. 2010 2011 2012 YTD 9/30/12 YTD 9/30/13 Net cash provided by operating activities 56,220 $ 43,688 $ 66,955 $ 30,533 $ 14,568 $ Capital expenditures (9,588) (8,064) (6,507) (3,772) (6,473) Cash paid for restructuring and other exit costs 1,293 765 472 387 - Cash paid for Transaction Related Costs - - 551 549 427 Cash paid for litigation or dispute settlement charges (gains) - - (118) (118) 578 Change in Intercompany with United Online, Inc. (11,695) 12,428 (66) (111) (1,267) Change in current income taxes payable 4,835 (500) (7,238) (5,620) 4,424 Free Cash Flow 41,065 $ 48,317 $ 54,049 $ 21,848 $ 12,257 $ |
|
|
Calculation of Working Capital and Net Debt Note: Working capital is non-GAAP and is defined as current assets, excluding cash and cash equivalents, less current liabilities, excluding the current portion of long-term debt, payable to United Online, Inc. and current income taxes payable. 12/31/08 12/31/09 12/31/10 12/31/11 12/31/12 9/30/13 Current assets 80,731 $ 81,810 $ 74,530 $ 91,190 $ 112,865 $ 73,663 $ Exclude: cash (27,871) (35,714) (31,875) (47,058) (67,347) (28,347) Net current assets 52,860 46,096 42,655 44,132 45,518 45,316 Current liabilities 83,074 80,800 89,108 79,426 107,593 71,253 Exclude: current portion of long-term debt (7,219) - - (2,650) (10,856) - Exclude: Intercompany payable to United Online, Inc. (3,877) (2,320) (14,015) (1,587) (1,653) (2,920) Exclude: current income taxes payable (977) (6,187) (1,449) (1,735) (9,033) (4,659) Net current liabilities 71,001 72,293 73,644 73,454 86,051 63,674 Working capital (18,141) $ (26,197) $ (30,989) $ (29,322) $ (40,533) $ (18,358) $ 12/31/08 12/31/09 12/31/10 12/31/11 12/31/12 9/30/13 Total debt, net of discounts 358,618 $ 304,563 $ 258,084 $ 261,124 $ 244,000 $ 220,000 $ Cash (27,871) (35,714) (31,875) (47,058) (67,347) (28,347) Net debt 330,747 $ 268,849 $ 226,209 $ 214,066 $ 176,653 $ 191,653 $ |

|
|
Non-GAAP Definitions Adjusted earnings before interest, taxes, depreciation and amortization (“Adjusted EBITDA”) is defined by FTD Companies, Inc. (the “Company”) as net income before net interest expense; provision (benefit) for income tax expense; depreciation; amortization; stock-based compensation; Litigation or Dispute Settlement charges or gains; Transaction Related Costs; restructuring and other exit costs; and impairment of goodwill, intangible assets and long-lived assets. The Company's definition of Adjusted EBITDA may be modified from time to time. Management believes that because Adjusted EBITDA excludes (i) certain non-cash expenses (such as depreciation, amortization, and stock-based compensation) and (ii) expenses that are not reflective of the Company’s core operations, this measure provides investors with additional useful information to measure the Company’s financial performance, particularly with respect to changes in performance from period to period. Management uses Adjusted EBITDA to measure the Company’s performance. Adjusted EBITDA is used as a performance measure under the Company’s senior secured credit facility and includes adjustments such as the items defined above and others, which are defined in the senior secured credit facility. The Company will use this measure as a basis in determining certain compensation incentives for certain members of the Company’s management. Adjusted EBITDA is not determined in accordance with GAAP and should be considered in addition to, not as a substitute for or superior to, financial measures determined in accordance with GAAP. A limitation associated with the use of Adjusted EBITDA is that it does not reflect the periodic costs of certain tangible and intangible assets used in generating revenues in the Company’s business. Management evaluates the costs of such tangible and intangible assets through other financial activities such as evaluations of capital expenditures and purchase accounting. An additional limitation associated with this measure is that it does not include stock-based compensation expenses related to the Company’s workforce. Management compensates for this limitation by providing a summary of stock-based compensation expenses within the accompanying tables and in the footnotes accompanying its financial statements. A further limitation associated with the use of this measure is that it does not reflect expenses or gains that are not considered reflective of the Company’s core operations. Management compensates for this limitation by providing supplemental information about such charges, gains and costs within its financial press releases and SEC filings, when applicable. An additional limitation associated with the use of this measure is that the term “Adjusted EBITDA” does not have a standardized meaning. Therefore, other companies may use the same or a similarly named measure but exclude different items or use different computations, which may not provide investors a comparable view of the Company’s performance in relation to other companies. Management compensates for this limitation by presenting the most comparable GAAP measure, net income, directly ahead of Adjusted EBITDA within its financial press releases and by providing a reconciliation that shows and describes the adjustments made. A reconciliation to net income is provided in the accompanying tables. In addition, many of the adjustments to our GAAP financial measures reflect the exclusion of items that are recurring in nature and will be reflected in our financial results for the foreseeable future. Free Cash Flow is defined by the Company as net cash provided by operating activities, adjusted to exclude the impact of payables to United Online, Inc. and current income taxes payable, less capital expenditures and cash received for litigation or dispute settlement gains, and plus cash paid for restructuring and other exit costs, cash paid for litigation or dispute settlement charges, and cash paid for transaction-related costs. Management believes that free cash flow provides investors with additional useful information to measure operating liquidity because it reflects the company’s operating cash flows after investing in capital assets and prior to cash paid for restructuring and other exit costs, cash paid or received for litigation or dispute settlement charges or gains, and cash paid for transaction-related costs. This measure is used by management, and may also be useful for investors, to assess the company’s ability to repay debt obligations, generate cash flow for a variety of strategic opportunities, including reinvestment in the business, and effect potential acquisitions. Free cash flow is not determined in accordance with GAAP and should be considered in addition to, not as a substitute for or superior to, measures determined in accordance with GAAP. A limitation of free cash flow is that it does not represent the total increase or decrease in cash during the period. An additional limitation associated with the use of this measure is that the term “free cash flow” does not have a standardized meaning. Therefore, other companies may use the same or a similarly named measure but exclude different items or use different computations, which may not provide investors a comparable view of the company’s performance in relation to other companies. A reconciliation to net cash provided by operating activities is provided in the accompanying tables. Average order value (“AOV”) represents the average U.S. Dollar amount received for consumer orders delivered during a period. For orders placed outside the U.S. (principally in the U.K. and the Republic of Ireland), this average U.S. Dollar amount is determined after translating the local currency amounts received into U.S. Dollars. Average order value includes merchandise revenues and shipping, handling and service fees paid by the consumer, less discounts and refunds (net of refund-related fees charged to floral network members). Litigation or Dispute Settlement Charges or Gains include estimated losses for which we have established a reserve, as well as actual settlements, judgments, fines, penalties, assessments or other resolutions against, or in favor of, the Company related to litigation, arbitration, investigations, disputes or similar matters. Insurance recoveries received by the Company related to such matters are also included in these adjustments. Transaction Related Costs are certain expense items resulting from actual or potential transactions such as business combinations, mergers, acquisitions, dispositions, spin offs, financing transactions, and other strategic transactions, including, without limitation, (i) compensation expenses and (ii) expenses for advisors and representatives such as investment bankers, consultants, attorneys, and accounting firms. Transaction Related Costs may also include, without limitation, transition and integration costs such as retention bonuses and acquisition-related milestone payments to acquired employees. A portion of these costs relating to the spin off have been and will be incurred by and allocated to us by United Online. |