Attached files
| file | filename |
|---|---|
| 8-K - 8-K - Apple REIT Ten, Inc. | applereitten8k120213.htm |
Exhibit 99.1
 |
|||
|
The Apple REIT Ten, Inc. portfolio includes 43 Marriott®- and Hilton®-branded hotels with 5,452 guestrooms strategically diversified across 17 states. I am pleased to report that as of October 31, 2013, gross proceeds raised for the Company totaled $879 million. Our team remains focused on providing our shareholders with attractive returns through the acquisition and ownership of hotels and strategic capital management.
The Apple REIT Ten portfolio of hotels achieved revenue per available room (RevPAR) of $84 for the third quarter of 2013, an average occupancy rate of 74 percent and an average daily rate (ADR) of $114. For the nine-month period ending September 30, 2013, RevPAR was $85, occupancy was 73 percent and ADR was $116. Based on hotel industry reports, we are entering the lodging marketplace at a time when new hotel supply across the broader markets remains constrained and demand for travel continues to strengthen. Although uncertainty surrounding U.S. government fiscal policies and associated potential government spending reductions could impact some of our markets, hotel industry analysts have continued to forecast industry improvement in revenue for the remainder of 2013 and into 2014 as compared to the previous year.
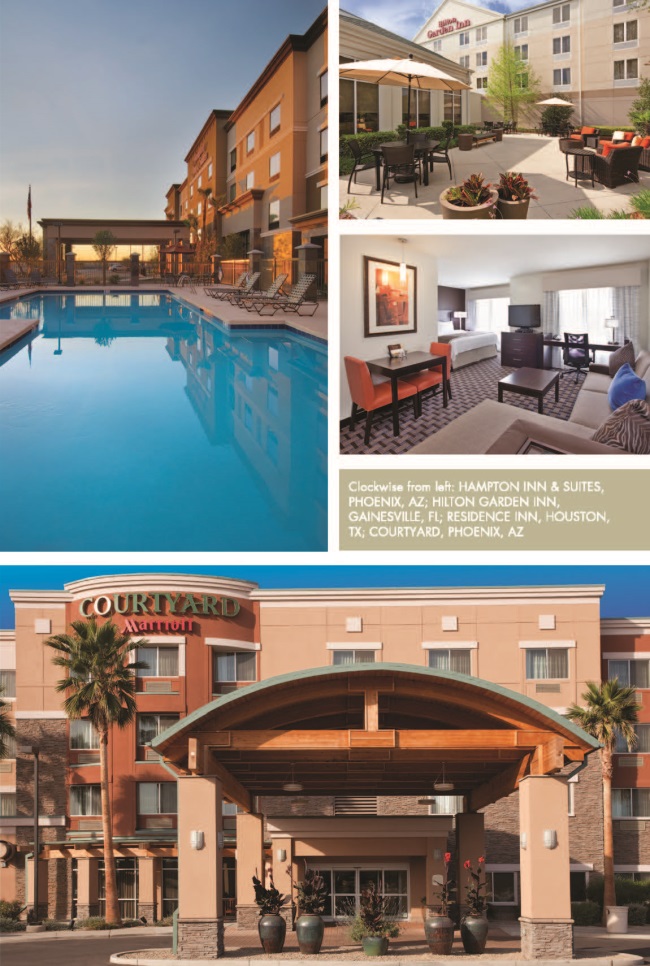
During the third quarter of this year, Apple REIT Ten acquired eight hotels which included: a 120-room Hilton Garden Inn® in Maple Grove, MN; a 90-room Homewood Suites by Hilton® in Oklahoma City, OK; a 107-room Homewood Suites by Hilton® in Denton, TX; a 125-room Hampton Inn & Suites®, a 134- room Homewood Suites by Hilton® and a 127-room Courtyard® by Marriott® in Phoenix, AZ; and a 139- room Hampton Inn & Suites® and 123-room Homewood Suites by Hilton® in downtown Omaha, NE. In addition, Apple REIT Ten completed its $100 million investment in Cripple Creek Energy, LLC (CCE). Under the terms of the agreement, Apple REIT Ten’s investment will have a one year holding period which may be extended by CCE for an additional year. CCE has investments in the oil and gas business and Apple REIT Ten has a preferred interest in all of its assets. Apple REIT Ten will receive an annual return on this investment of 14 percent.
|
Modified funds from operations (MFFO) for the third quarter of this year totaled $16.9 million, or $0.23 per share, and for the nine-month period ending September 30, 2013, MFFO was $40.2 million, or $0.57 per share. MFFO results for the same periods last year were $10.2 million, or $0.17 per share, and $26.5 million, or $0.51 per share, respectively. As our acquisition activity begins to stabilize and our period of ownership lengthens, year-over-year comparisons will become more meaningful. Apple REIT Ten paid distributions of $0.21 per share during the third quarter of this year. Our annualized distribution rate of approximately $0.825 is closely monitored, taking into account varying economic cycles and capital improvements, as well as current and projected hotel performance. Although we strive for consistency over the life of our program, we may make adjustments as needed, based on available cash resources. Also, due to the timing of acquisitions, depreciation deductions and fundraising, a portion of your 2013 distribution will be treated as return of capital for tax purposes.
The Company currently has seven additional hotels under contract for purchase and our acquisition team continues to work to identify additional strategic real estate opportunities that we believe will grow the value of your investment and match fundraising. I am confident that our steady approach to hotel ownership and capital management will enable us to meet our goals over the long term. Thank you for your investment in Apple REIT Ten.
Sincerely,
 Glade M. Knight,
Chairman and Chief Executive Officer
|
||
|
Statements of Operations (Unaudited)
|
||||||||||||||||
|
(In thousands except statistical data)
|
Three months ended
Sept 30, 2013
|
Three months ended
Sept 30, 2012
|
Nine months ended
Sept 30, 2013
|
Nine months ended
Sept 30, 2012
|
||||||||||||
|
REVENUES
|
||||||||||||||||
|
Room revenue
|
$ | 40,166 | $ | 29,627 | $ | 104,647 | $ | 80,422 | ||||||||
|
Other revenue
|
3,595 | 2,855 | 10,922 | 8,004 | ||||||||||||
|
Total revenue
|
$ | 43,761 | $ | 32,482 | $ | 115,569 | $ | 88,426 | ||||||||
|
EXPENSES
|
||||||||||||||||
|
Direct operating expense
|
$ | 11,028 | $ | 8,069 | $ | 28,956 | $ | 21,763 | ||||||||
|
Other hotel operating expenses
|
16,804 | 11,905 | 43,731 | 33,215 | ||||||||||||
|
General and administrative
|
1,119 | 1,148 | 3,305 | 3,470 | ||||||||||||
|
Depreciation
|
5,748 | 4,094 | 15,082 | 11,582 | ||||||||||||
|
Acquisition-related costs
|
2,935 | 607 | 4,904 | 1,541 | ||||||||||||
|
Investment income
|
(3,533 | ) | (73 | ) | (4,467 | ) | (134 | ) | ||||||||
|
Interest expense
|
1,478 | 1,213 | 3,802 | 3,596 | ||||||||||||
|
Total expenses
|
$ | 35,579 | $ | 26,963 | $ | 95,313 | $ | 75,033 | ||||||||
|
NET INCOME
|
||||||||||||||||
|
Net income
|
$ | 8,182 | $ | 5,519 | $ | 20,256 | $ | 13,393 | ||||||||
|
Net income per share
|
$ | 0.11 | $ | 0.09 | $ | 0.29 | $ | 0.26 | ||||||||
|
MODIFIED FUNDS FROM OPERATIONS (A)
|
||||||||||||||||
|
Net income
|
$ | 8,182 | $ | 5,519 | $ | 20,256 | $ | 13,393 | ||||||||
|
Depreciation of real estate owned
|
5,748 | 4,094 | 15,082 | 11,582 | ||||||||||||
|
Funds from operations (FFO)
|
$ | 13,930 | $ | 9,613 | $ | 35,338 | $ | 24,975 | ||||||||
|
Acquisition-related costs
|
2,935 | 607 | 4,904 | 1,541 | ||||||||||||
|
Modified funds from operations (MFFO)
|
$ | 16,865 | $ | 10,220 | $ | 40,242 | $ | 26,516 | ||||||||
|
FFO per share
|
$ | 0.19 | $ | 0.16 | $ | 0.50 | $ | 0.48 | ||||||||
|
MFFO per share
|
$ | 0.23 | $ | 0.17 | $ | 0.57 | $ | 0.51 | ||||||||
|
WEIGHTED-AVERAGE SHARES OUTSTANDING
|
74,887 | 58,701 | 70,308 | 52,066 | ||||||||||||
|
OPERATING STATISTICS
|
||||||||||||||||
|
Occupancy
|
74 | % | 73 | % | 73 | % | 71 | % | ||||||||
|
Average daily rate
|
$ | 114 | $ | 115 | $ | 116 | $ | 114 | ||||||||
|
RevPAR
|
$ | 84 | $ | 84 | $ | 85 | $ | 81 | ||||||||
|
Number of hotels
|
43 | 31 | ||||||||||||||
|
Distributions per Share
|
$ | 0.21 | $ | 0.21 | $ | 0.62 | $ | 0.62 | ||||||||
|
Balance Sheet Highlights (Unaudited)
|
||||||||
|
(In thousands)
|
September 30, 2013
|
December 31, 2012
|
||||||
|
ASSETS
|
||||||||
|
Investment in real estate, net
|
$ | 675,130 | $ | 506,689 | ||||
|
Cash and cash equivalents
|
- | 146,530 | ||||||
|
Energy investment
|
100,329 | - | ||||||
|
Other assets
|
18,989 | 14,566 | ||||||
|
Total assets
|
$ | 794,448 | $ | 667.785 | ||||
|
LIABILITIES AND SHAREHOLDERS’ EQUITY
|
||||||||
|
Notes payable
|
$ | 115,075 | $ | 81,186 | ||||
|
Other liabilities
|
9,123 | 7,074 | ||||||
|
Total liabilities
|
124,198 | 88,260 | ||||||
|
Total shareholders’ equity
|
670,250 | 579,525 | ||||||
|
Total liabilities & shareholders’ equity
|
$ | 794,448 | $ | 667,785 | ||||
(A) Funds from operations (FFO) is defined as net income (computed in accordance with generally accepted accounting principles – GAAP) excluding gains and losses from sales of depreciable property, plus depreciation and amortization. Modified funds from operations (MFFO) excludes the costs associated with the acquisition of real estate. The Company considers FFO and MFFO in evaluating property acquisitions and its operating performance and believes that FFO and MFFO should be considered along with, but not as an alternative to, net income and cash flows as a measure of the Company’s activities in accordance with GAAP. FFO and MFFO are not necessarily indicative of cash available to fund cash needs.
The financial information furnished reflects all adjustments necessary for a fair presentation of financial position at September 30, 2013, and the results of operations for the interim period ended September 30, 2013. Such interim results are not necessarily indicative of the results that can be expected for a full year. The accompanying financial statements should be read in conjunction with the audited financial statements and related notes appearing in the Apple REIT Ten, Inc. 2012 Annual Report.
 C O R P O R A T E P R O F I L E Apple REIT Ten, Inc. is a real estate investment trust (REIT) focused on the acquisition and ownership of income-producing real estate that generates attractive returns for our shareholders. Our hotels operate under the Courtyard® by Marriott®, Fairfield Inn & Suites® by Marriott®, Residence Inn® by Marriott®, SpringHill Suites® by Marriott®, TownePlace Suites® by Marriott®, Marriott® Hotels & Resorts, Hilton Garden Inn®, Homewood Suites by Hilton®, Home2 Suites by Hilton® and Hampton Inn & Suites® brands. As of November 1, 2013, the Apple REIT Ten portfolio consisted of 43 hotels with 5,452 guestrooms in 17 states. M I S S I O N Apple REIT Ten, Inc. is a premier real estate investment company committed to providing maximum value for our shareholders. C O R P O R A T E P R O F I L E Apple REIT Ten, Inc. is a real estate investment trust (REIT) focused on the acquisition and ownership of income-producing real estate that generates attractive returns for our shareholders. Our hotels operate under the Courtyard® by Marriott®, Fairfield Inn & Suites® by Marriott®, Residence Inn® by Marriott®, SpringHill Suites® by Marriott®, TownePlace Suites® by Marriott®, Marriott® Hotels & Resorts, Hilton Garden Inn®, Homewood Suites by Hilton®, Home2 Suites by Hilton® and Hampton Inn & Suites® brands. As of November 1, 2013, the Apple REIT Ten portfolio consisted of 43 hotels with 5,452 guestrooms in 17 states. M I S S I O N Apple REIT Ten, Inc. is a premier real estate investment company committed to providing maximum value for our shareholders. |
||
|
This quarterly report contains forward-looking statements within the meaning of Section 27A of the Securities Act of 1933, as amended, and Section 21E of the Securities Exchange Act of 1934, as amended. Such statements involve known and unknown risks, uncertainties, and other factors which may cause the actual results, performance, or achievements of the company to be materially different from any future results, performance or achievements expressed or implied by such forward-looking statements. Such factors include: the availability and terms of financing; changes in national, regional and local economies and business conditions; competitors within the hotel industry; the outcome of current and future litigation and regulatory proceedings or inquiries; changes in laws or regulations or interpretations of current laws and regulations that impact the company’s business, assets or classification as a real estate investment trust; the ability of the company to implement its operating strategy and to manage planned growth; and the ability to repay or refinance debt as it becomes due.
Although the company believes that the assumptions underlying the forward-looking statements contained herein are reasonable, any of the assumptions could be inaccurate; therefore, there can be no assurance that such statements included in this quarterly report will prove to be accurate. In addition, the timing and level of distributions to shareholders are within the discretion of the company’s board of directors. In light of the significant uncertainties inherent in the forward-looking statements included herein, the inclusion of such information should not be regarded as a representation by the company or any other person that the results or conditions described in such statements or the objectives and plans of the company will be achieved.
“Courtyard® by Marriott®,” “Fairfield Inn & Suites® by Marriott®,” “Marriott® Hotels & Resorts,” “Residence Inn® by Marriott®,” “SpringHill Suites® by Marriott®,” and “TownePlace Suites® by Marriott®” are each a registered trademark of Marriott International, Inc. or one of its affiliates. All references to “Marriott” mean Marriott International and all of its affiliates and subsidiaries, and their respective officers, directors, agents, employees, accountants and attorneys. Marriott is not responsible for the content of this correspondence, whether relating to the hotel information, operating information, financial information, Marriott’s relationship with Apple REIT Ten or otherwise. Marriott is not involved in any way whether as an “issuer” or “underwriter” or otherwise in the Apple REIT Ten offering and receives no proceeds from the offering. Marriott has not expressed any approval or disapproval regarding this correspondence, and the grant by Marriott of any franchise or other rights to Apple REIT Ten shall not be construed as any expression of approval or disapproval. Marriott has not assumed and shall not have any liability in connection with this report.
“Hampton Inn & Suites®,” “Hilton Garden Inn®,” “Home2 Suites by Hilton®,” and “Homewood Suites by Hilton®” are each a registered trademark of Hilton Worldwide or one of its affiliates. All references to “Hilton” mean Hilton Worldwide and all of its affiliates and subsidiaries, and their respective officers, directors, agents, employees, accountants and attorneys. Hilton is not responsible for the content of this correspondence, whether relating to hotel information, operating information, financial information, Hilton’s relationship with Apple REIT Ten, Inc., or otherwise. Hilton is not involved in any way, whether as an “issuer” or “underwriter” or otherwise, in the Apple REIT Ten offering and receives no proceeds from the offering. Hilton has not expressed any approval or disapproval regarding this correspondence, and the grant by Hilton of any franchise or other rights to Apple REIT Ten shall not be construed as any expression of approval or disapproval. Hilton has not assumed and shall not have any liability in connection with this report.
|
||
|
Market Diversity
|
|||
|
STATE/CITY
|
Portfolio of hotels
|
||
|
ALABAMA
|
|||
|
Huntsville (2), Mobile
|
|||
|
ARIZONA
|
|||
|
Phoenix (3), Scottsdale
|
|||
|
CALIFORNIA
|
|||
|
San Diego/Oceanside
|
|||
|
COLORADO
|
|||
|
Denver
|
|||
|
FLORIDA
|
|||
|
Boca Raton, Gainesville (2), Pensacola, Tallahassee
|
|||
|
ILLINOIS
|
|||
|
Des Plaines, Hoffman Estates, Skokie
|
|||
|
INDIANA
|
|||
|
Merrillville, South Bend
|
|||
|
IOWA
|
|||
|
Cedar Rapids (2), Davenport
|
|||
|
MINNESOTA
|
|||
|
Maple Grove
|
|||
|
NORTH CAROLINA
|
 |
||
|
Charlotte/Matthews, Jacksonville, Winston-Salem
|
|||
|
NEBRASKA
|
|||
|
Omaha (3)
|
|||
|
OHIO
|
|||
|
Cincinnati/Mason
|
|||
|
OKLAHOMA
|
CORPORATE HEADQUARTERS
814 East Main Street
Richmond, Virginia 23219
(804) 344-8121
(804) 344-8129 FAX
www.applereitten.com
INVESTOR INFORMATION
For additional information about the
Company, please contact: Kelly Clarke,
Director of Investor Services
(804) 727-6321 or kclarke@applereit.com
As always, we encourage our
shareholders to know their investment and
stay informed by reviewing information
on our website at www.applereitten.com,
as well as our filings with the Securities
and Exchange Commission, which can be
found on their website at www.sec.gov.
|
||
|
Oklahoma City
|
|||
|
SOUTH CAROLINA
|
|||
|
Charleston, Columbia
|
|||
|
TENNESSEE
|
|||
|
Knoxville (3), Nashville
|
|||
|
TEXAS
|
|||
|
Austin/Round Rock, Denton, Houston (2)
|
|||
|
VIRGINIA
|
|||
|
Fairfax, Richmond/Henrico
|
|||
Cover image: HOMEWOOD SUITES, OMAHA, NE