Attached files
| file | filename |
|---|---|
| 8-K - 8-K - STONEGATE MORTGAGE CORP | d631554d8k.htm |
Exhibit 99.1
|
|

Investor Presentation
November 2013
|
|
Forward Looking Statements
FORWARD-LOOKING STATEMENTS:
Our presentation contains certain forward-looking statements. These forward-looking statements may be identified by a reference to a future period or by the use of forward-looking terminology. They involve risks and uncertainties that could cause the company’s actual results to differ materially from the results discussed in the forward-looking statements. Important factors that could cause actual results to differ include, but are not limited to, our future production, revenues, income, capital spending, related general economic and market conditions, delinquency rates, trends for home prices, uncertainties related to acquisitions, including our ability to integrate the systems, procedures and personnel from other companies, as well as other risks discussed in the “Risk Factors” section within our Registration Statement on Form S-1, as amended, which has been filed with the U.S. Securities and Exchange Commission. The forward-looking statements speak only as of the date they are made and except for our ongoing obligations under the U.S. federal securities laws, we undertake no obligation to update or revise forward-looking statements whether as a result of new information, future events or otherwise.
NON-GAAP MEASURES:
Our presentation contains non-GAAP performance measures, such as our references to “adjusted net income”, “adjusted revenue”, “non-GAAP EPS”, “adjusted EPS”, and “adjusted net income per share”. We believe these non-GAAP performance measures provide additional meaningful comparisons between current results and results in prior periods. Non-GAAP performance measures should be viewed in addition to, and not as an alternative for, the Company’s reported results under accounting principles generally accepted in the United States. In addition, our calculations of non-GAAP performance measures may be different from the calculations used by other companies and, therefore, comparability may be limited. Please refer to the Appendix of this presentation for a reconciliation of these non-GAAP performance measures to the most comparable GAAP measure.
2
|
|
Management Presenters
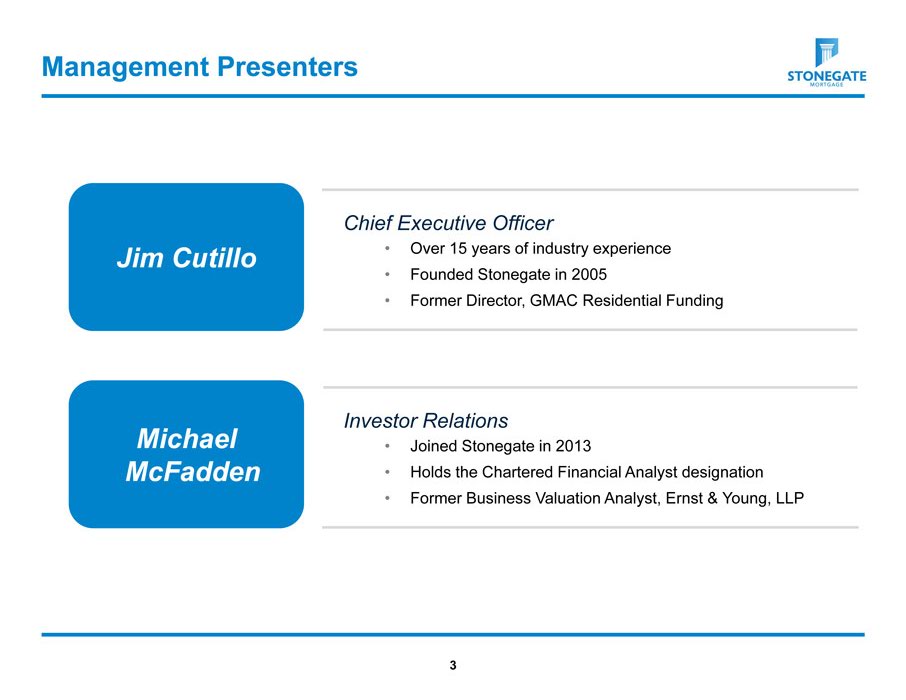
Chief Executive Officer
Jim Cutillo Over 15 years of industry experience
Founded Stonegate in 2005
Former Director, GMAC Residential Funding
Investor Relations
Michael Joined Stonegate in 2013
McFadden Holds the Chartered Financial Analyst designation
Former Business Valuation Analyst, Ernst & Young, LLP
3
|
|
Stonegate Overview
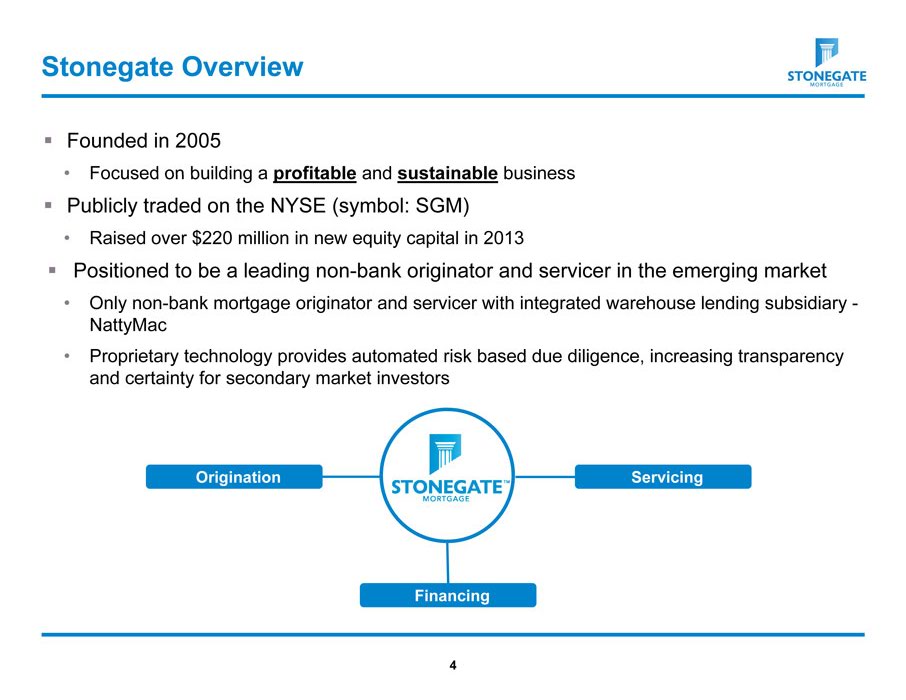
Founded in 2005
Focused on building a profitable and sustainable business
Publicly traded on the NYSE (symbol: SGM)
Raised over $220 million in new equity capital in 2013
Positioned to be a leading non-bank originator and servicer in the emerging market
Only non-bank mortgage originator and servicer with integrated warehouse lending subsidiary -NattyMac
Proprietary technology provides automated risk based due diligence, increasing transparency and certainty for secondary market investors
Origination Servicing
Financing
4
|
|
Recent Developments
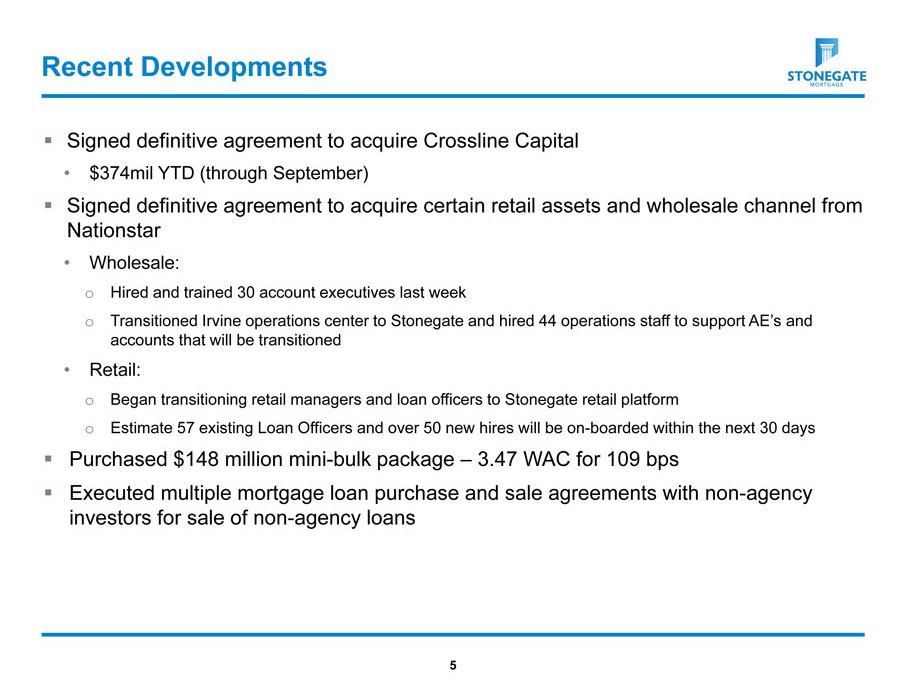
Signed definitive agreement to acquire Crossline Capital
$374mil YTD (through September)
Signed definitive agreement to acquire certain retail assets and wholesale channel from Nationstar
Wholesale:
Hired and trained 30 account executives last week Transitioned Irvine operations center to Stonegate and hired 44 operations staff to support AE’s and accounts that will be transitioned
Retail:
Began transitioning retail managers and loan officers to Stonegate retail platform Estimate 57 existing Loan Officers and over 50 new hires will be on-boarded within the next 30 days
Purchased $148 million mini-bulk package – 3.47 WAC for 109 bps
Executed multiple mortgage loan purchase and sale agreements with non-agency investors for sale of non-agency loans
5
|
|
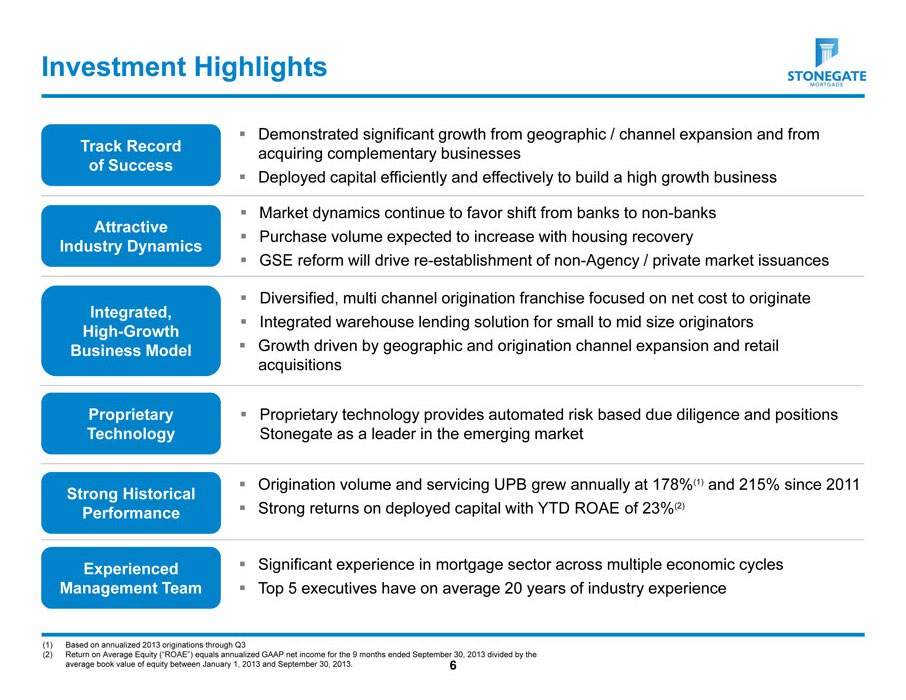
Investment Highlights
Track Record of Success
Demonstrated significant growth from geographic / channel expansion and from acquiring complementary businesses
Deployed capital efficiently and effectively to build a high growth business
Attractive Industry Dynamics
Market dynamics continue to favor shift from banks to non-banks
Purchase volume expected to increase with housing recovery
GSE reform will drive re-establishment of non-Agency / private market issuances
Integrated, High-Growth Business Model
Diversified, multi channel origination franchise focused on net cost to originate
Integrated warehouse lending solution for small to mid size originators
Growth driven by geographic and origination channel expansion and retail acquisitions
Proprietary Technology
Proprietary technology provides automated risk based due diligence and positions Stonegate as a leader in the emerging market
Strong Historical Performance
Origination volume and servicing UPB grew annually at 178%(1) and 215% since 2011 Strong returns on deployed capital with YTD ROAE of 23%(2)
Experienced Management Team
Significant experience in mortgage sector across multiple economic cycles Top 5 executives have on average 20 years of industry experience
(1) Based on annualized 2013 originations through Q3
(2) Return on Average Equity (“ROAE”) equals annualized GAAP net income for the 9 months ended September 30, 2013 divided by the average book value of equity between January 1, 2013 and September 30, 2013. 6
|
|
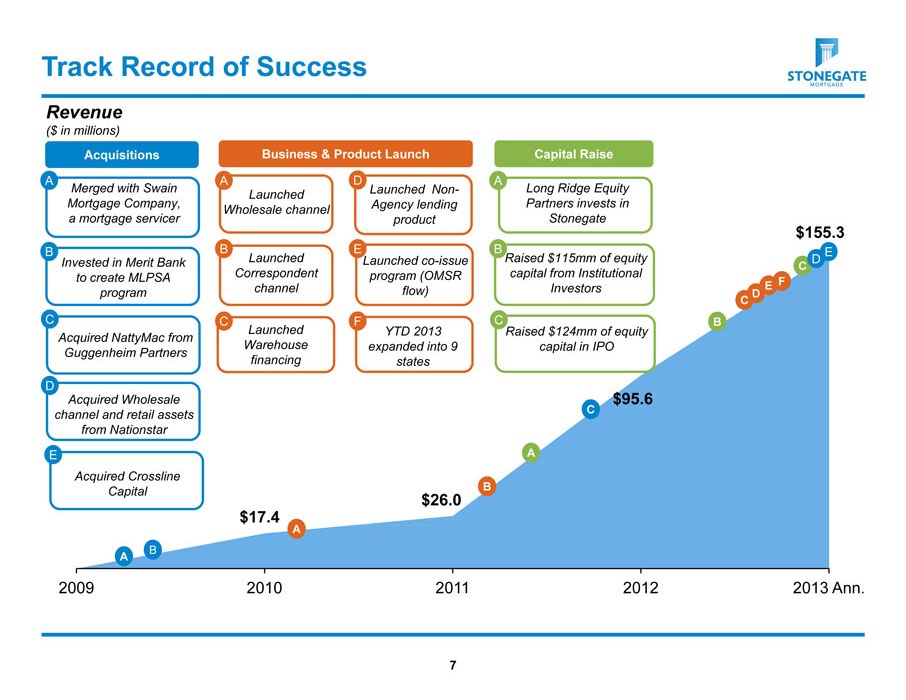
Track Record of Success
Revenue
($ in millions)
Acquisitions Business & Product Launch Capital Raise
A
Merged with Swain Mortgage Company, a mortgage servicer
A
Launched Wholesale channel
D
Launched Non-Agency lending product
A
Long Ridge Equity Partners invests in Stonegate
B
Invested in Merit Bank to create MLPSA program
B
Launched Correspondent channel
E
Launched co-issue program (OMSR flow)
B
Raised $115mm of equity capital from Institutional Investors
C
Acquired NattyMac from Guggenheim Partners
D
Acquired Wholesale channel and retail assets from Nationstar
E
Acquired Crossline Capital
2009 2010 2011 2012 2013 Ann.
$26.0
$17.4 A
B
A
B
A
$95.6
C
$155.3
E D
C E F
D C
B
7
|
|
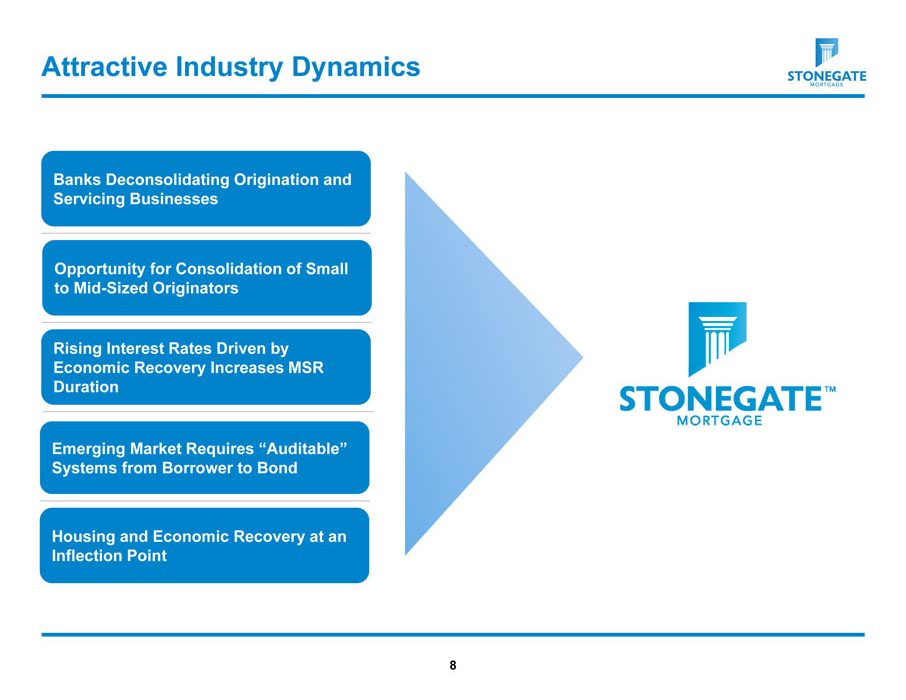
Attractive Industry Dynamics
Banks Deconsolidating Origination and Servicing Businesses
Opportunity for Consolidation of Small to Mid-Sized Originators
Rising Interest Rates Driven by Economic Recovery Increases MSR Duration
Emerging Market Requires “Auditable” Systems from Borrower to Bond
Housing and Economic Recovery at an Inflection Point
8
|
|
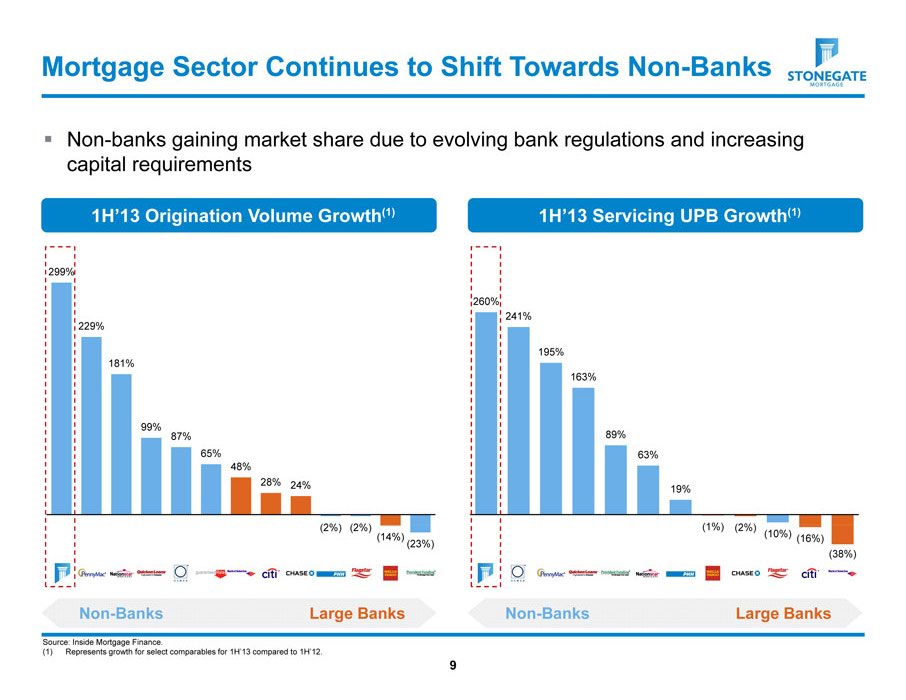
Mortgage Sector Continues to Shift Towards Non-Banks
Non-banks gaining market share due to evolving bank regulations and increasing capital requirements
1H’13 Origination Volume Growth(1)
1H’13 Servicing UPB Growth(1)
299%
260% 241% 229%
195% 181% 163%
99%
87% 89% 65% 63% 48% 28% 24% 19%
(2%) (2%) (1%) (2%) (14%) (10%) (16%) (23%) (38%)
Source: Inside Mortgage Finance.
(1) Represents growth for select comparables for 1H’13 compared to 1H’12.
9
|
|
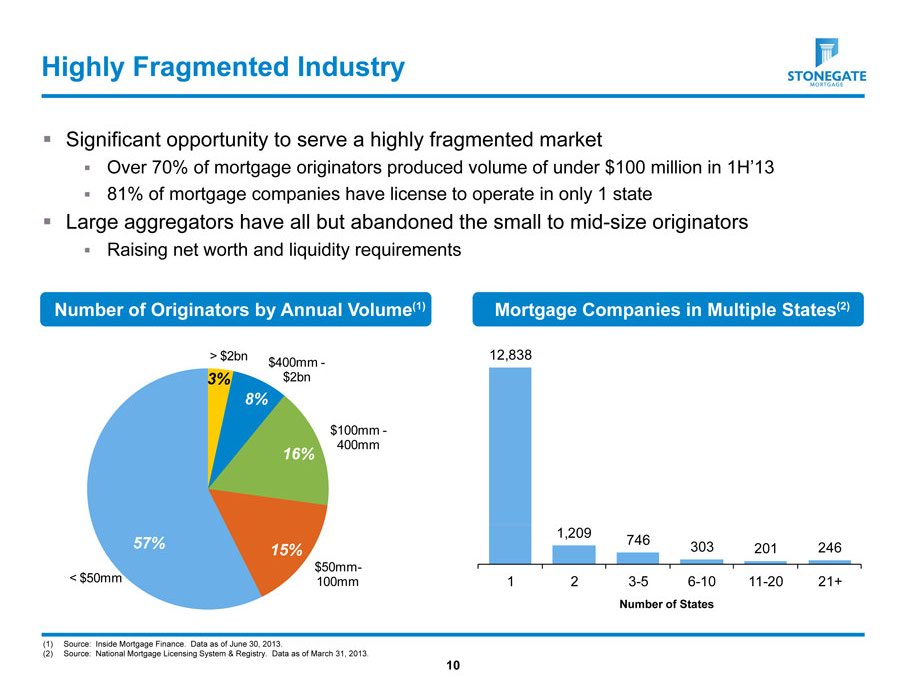
Highly Fragmented Industry
Significant opportunity to serve a highly fragmented market
Over 70% of mortgage originators produced volume of under $100 million in 1H’13
81% of mortgage companies have license to operate in only 1 state
Large aggregators have all but abandoned the small to mid-size originators
Raising net worth and liquidity requirements
Number of Originators by Annual Volume(1)
Mortgage Companies in Multiple States(2)
> $2bn 12,838
$400mm -
3% $2bn
8%
$100mm -
400mm
16%
1,209
57% 746
15% 303 201 246
$50mm-
< $50mm 100mm 1 2 3-5 6-10 11-20 21+
Number of States
(1) Source: Inside Mortgage Finance. Data as of June 30, 2013.
(2) Source: National Mortgage Licensing System & Registry. Data as of March 31, 2013.
10
|
|
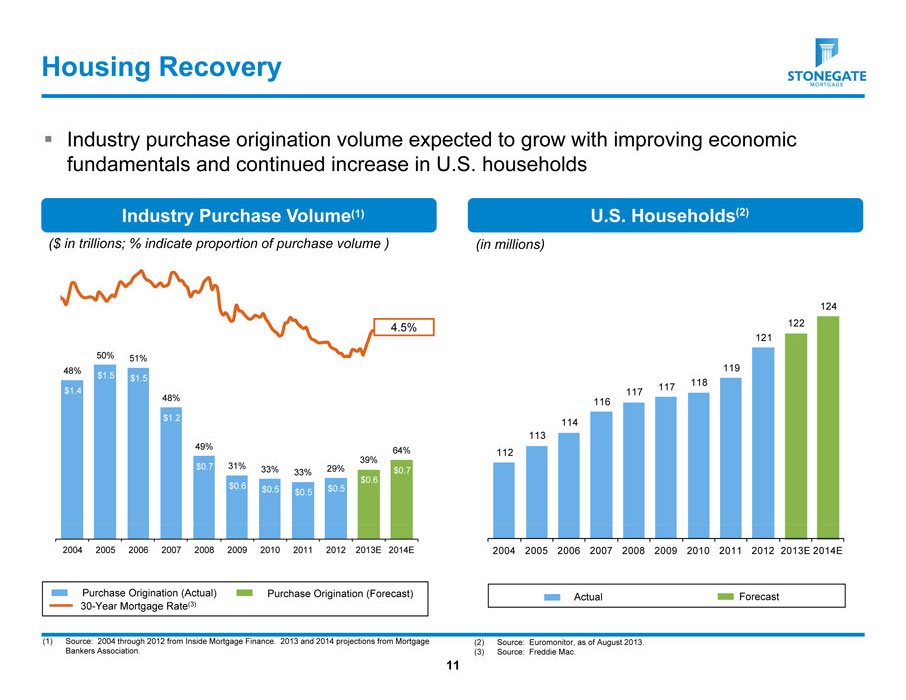
Housing Recovery
Industry purchase origination volume expected to grow with improving economic fundamentals and continued increase in U.S. households
Industry Purchase Volume(1) U.S. Households(2)
($ in trillions; % indicate proportion of purchase volume ) (in millions)
124
4.5% 122 121
50% 51%
48% 119 $1.5 $1.5
118
$1.4 117 117 48% 116
$1.2 114 113
49% 64%
112
39% $0.7 31% 33% 29% 33% $0.7
$0.6
$0.6 $0.5 $0.5 $0.5
2004 2005 2006 2007 2008 2009 2010 2011 2012 2013E 2014E 2004 2005 2006 2007 2008 2009 2010 2011 2012 2013E 2014E
Purchase Origination (Actual) Purchase Origination (Forecast) Actual Forecast
30-Year Mortgage Rate(3)
(1) Source: 2004 through 2012 from Inside Mortgage Finance. 2013 and 2014 projections from Mortgage (2) Source: Euromonitor, as of August 2013. Bankers Association. (3) Source: Freddie Mac.
11
|
|
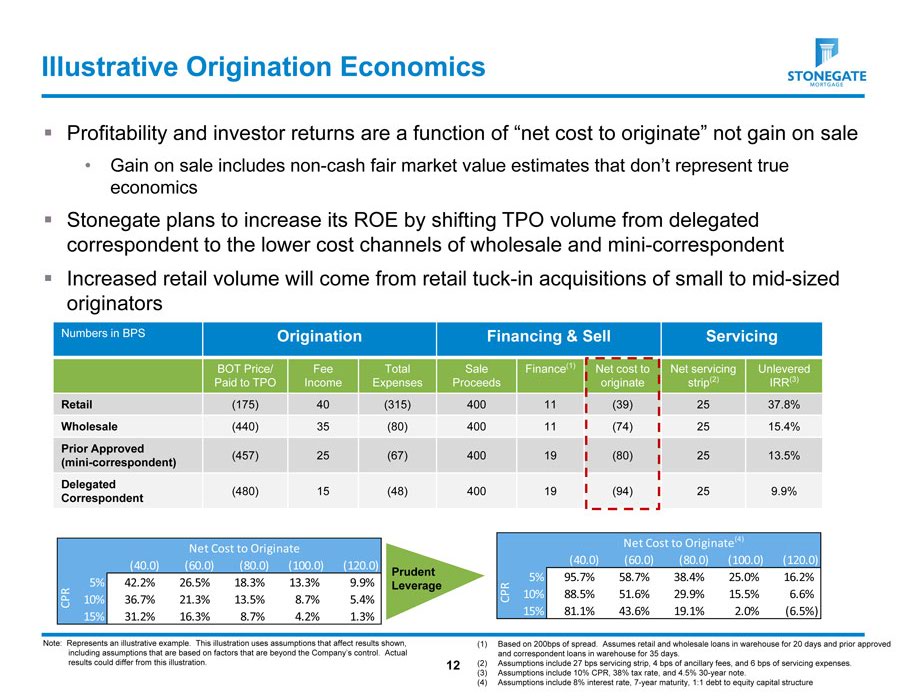
Illustrative Origination Economics
Profitability and investor returns are a function of “net cost to originate” not gain on sale
Gain on sale includes non-cash fair market value estimates that don’t represent true economics
Stonegate plans to increase its ROE by shifting TPO volume from delegated correspondent to the lower cost channels of wholesale and mini-correspondent
Increased retail volume will come from retail tuck-in acquisitions of small to mid-sized originators
Numbers in BPS Origination Financing & Sell Servicing
BOT Price/ Fee Total Sale Finance(1) Net cost to Net servicing Unlevered Paid to TPO Income Expenses Proceeds originate strip(2) IRR(3) Retail (175) 40 (315) 400 11 (39) 25 37.8% Wholesale (440) 35 (80) 400 11 (74) 25 15.4%
Prior Approved
(457) 25 (67) 400 19 (80) 25 13.5%
(mini-correspondent) Delegated
(480) 15 (48) 400 19 (94) 25 9.9%
Correspondent
Net Cost to Originate(4) Net Cost to Originate
(40.0) (60.0) (80.0) (100.0) (120.0) (40.0) (60.0) (80.0) (100.0) (120.0)
Prudent
5% 95.7% 58.7% 38.4% 25.0% 16.2%
5% 42.2% 26.5% 18.3% 13.3% 9.9% Leverage
CPR 10% 88.5% 51.6% 29.9% 15.5% 6.6% CPR 10% 36.7% 21.3% 13.5% 8.7% 5.4% 15% 81.1% 43.6% 19.1% 2.0% (6.5%) 15% 31.2% 16.3% 8.7% 4.2% 1.3%
Note: Represents an illustrative example. This illustration uses assumptions that affect results shown, (1) Based on 200bps of spread. Assumes retail and wholesale loans in warehouse for 20 days and prior approved including assumptions that are based on factors that are beyond the Company’s control. Actual and correspondent loans in warehouse for 35 days. results could differ from this illustration. 12 (2) Assumptions include 27 bps servicing strip, 4 bps of ancillary fees, and 6 bps of servicing expenses.
(3) Assumptions include 10% CPR, 38% tax rate, and 4.5% 30-year note.
(4) Assumptions include 8% interest rate, 7-year maturity, 1:1 debt to equity capital structure
|
|
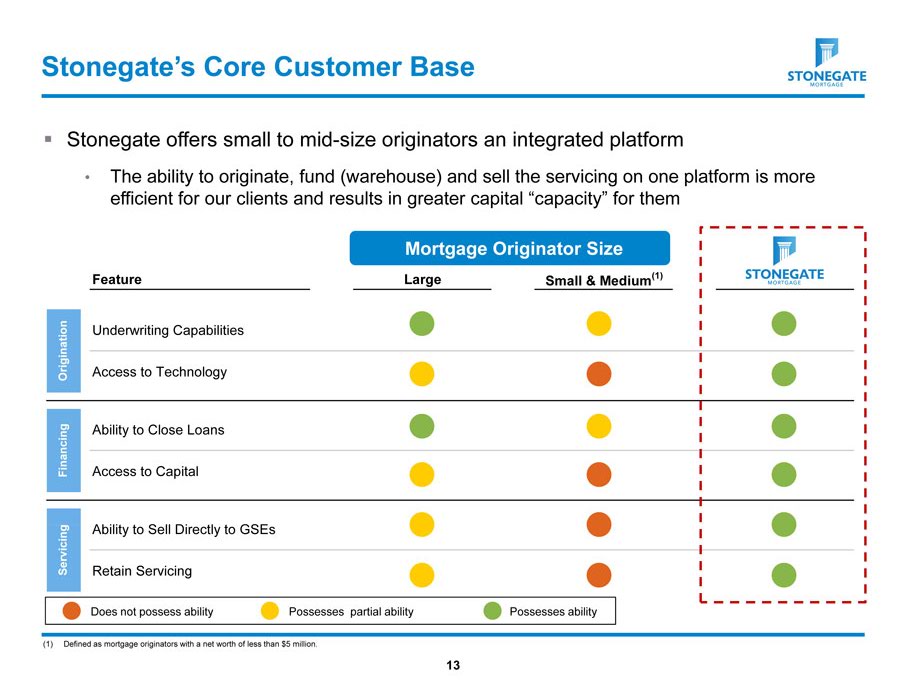
Stonegate’s Core Customer Base
Stonegate offers small to mid-size originators an integrated platform
The ability to originate, fund (warehouse) and sell the servicing on one platform is more efficient for our clients and results in greater capital “capacity” for them
Mortgage Originator Size
Feature Large Small & Medium(1)
Underwriting Capabilities Origination Access to Technology Ability to Close Loans Financing Access to Capital Servicing Ability to Sell Directly to GSEs Retain Servicing
Does not possess ability Possesses partial ability Possesses ability
(1) Defined as mortgage originators with a net worth of less than $5 million.
13
|
|
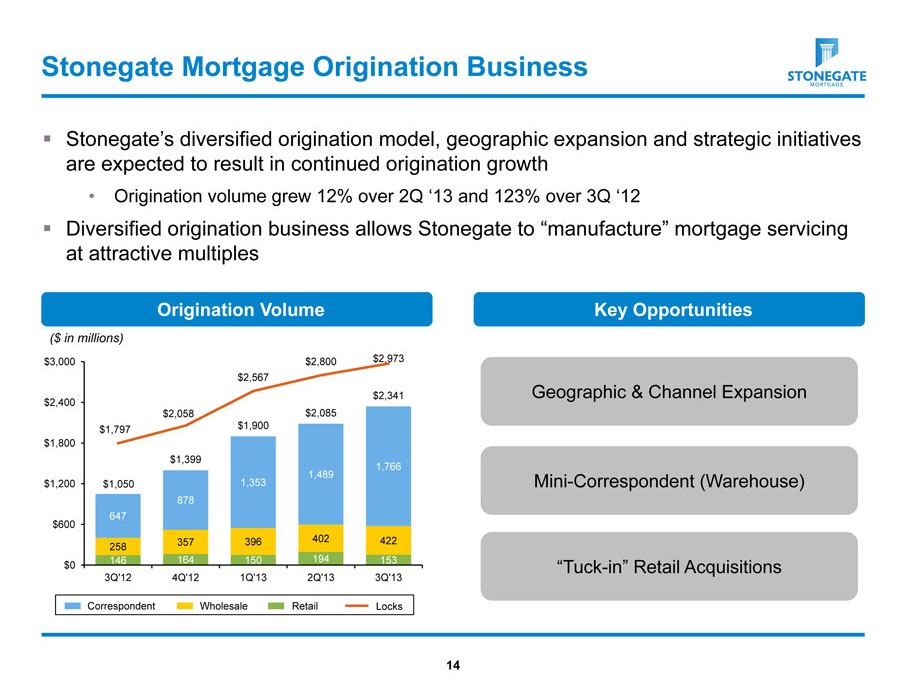
Stonegate Mortgage Origination Business
Stonegate’s diversified origination model, geographic expansion and strategic initiatives are expected to result in continued origination growth
Origination volume grew 12% over 2Q ‘13 and 123% over 3Q ‘12
Diversified origination business allows Stonegate to “manufacture” mortgage servicing at attractive multiples
Origination Volume Key Opportunities
($ in millions) $3,000 $2,800 $2,973 $2,567
$2,341 Geographic & Channel Expansion
$2,400 $2,058 $2,085 $1,797 $1,900 $1,800 $1,399
1,766 1,489
$1,200 $1,050 1,353 Mini-Correspondent (Warehouse)
878 647 $600
357 396 402 422 258 146 164 150 194 153
$0 “Tuck-in” Retail Acquisitions
3Q’12 4Q’12 1Q’13 2Q’13 3Q’13
Correspondent Wholesale Retail Locks
14
|
|
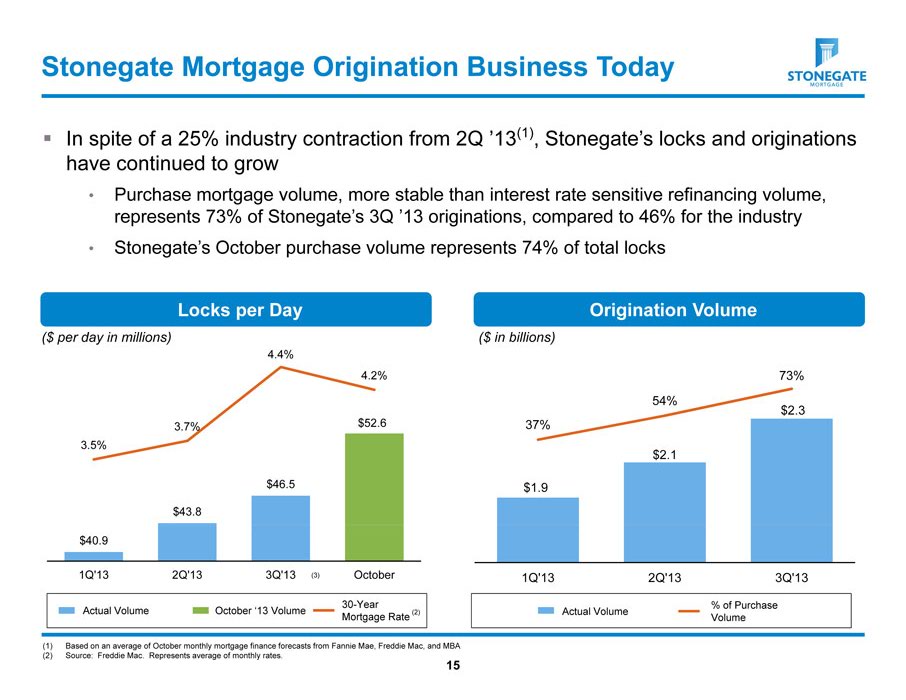
Stonegate Mortgage Origination Business Today
In spite of a 25% industry contraction from 2Q ‘13(1), Stonegate’s locks and originations have continued to grow
Purchase mortgage volume, more stable than interest rate sensitive refinancing volume, represents 73% of Stonegate’s 3Q ‘13 originations, compared to 46% for the industry
Stonegate’s October purchase volume represents 74% of total locks
Locks per Day Origination Volume
($ per day in millions) ($ in billions)
4.4%
4.2% 73% 54%
$2.3
3.7% $52.6 37%
3.5%
$2.1
$46.5 $1.9
$43.8
$40.9
1Q’13 2Q’13 3Q’13 (3) October 1Q’13 2Q’13 3Q’13
30-Year % of Purchase Actual Volume October ‘13 Volume (2) Actual Volume Mortgage Rate Volume
(1) Based on an average of October monthly mortgage finance forecasts from Fannie Mae, Freddie Mac, and MBA (2) Source: Freddie Mac. Represents average of monthly rates. 15
|
|
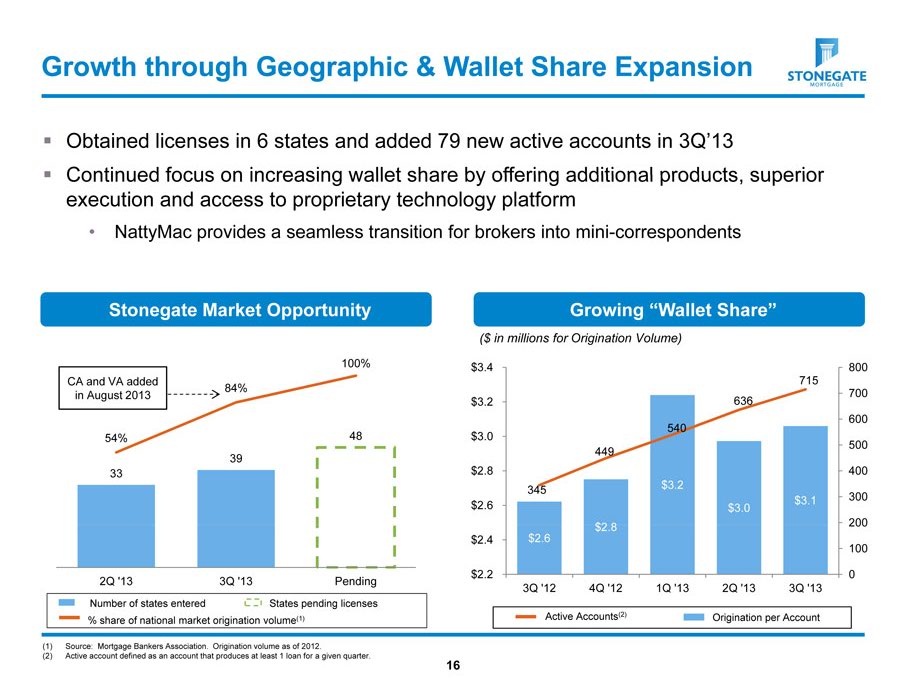
Growth through Geographic & Wallet Share Expansion
Obtained licenses in 6 states and added 79 new active accounts in 3Q’13
Continued focus on increasing wallet share by offering additional products, superior execution and access to proprietary technology platform
NattyMac provides a seamless transition for brokers into mini-correspondents
Stonegate Market Opportunity Growing “Wallet Share”
($ in millions for Origination Volume)
100% $3.4 800 CA and VA added 715 84% 700 in August 2013
$3.2 636
600 540 54% 48 $3.0 500 449 39
33 $2.8 400 345 $3.2
$3.1 300
$2.6 $3.0
$2.8 200
$2.4 $2.6 100
$2.2 0
2Q ‘13 3Q ‘13 Pending
3Q ‘12 4Q ‘12 1Q ‘13 2Q ‘13 3Q ‘13
Number of states entered States pending licenses
Active Accounts(2)
% share of national market origination volume(1) Origination per Account
(1) Source: Mortgage Bankers Association. Origination volume as of 2012.
(2) Active account defined as an account that produces at least 1 loan for a given quarter. 16
|
|
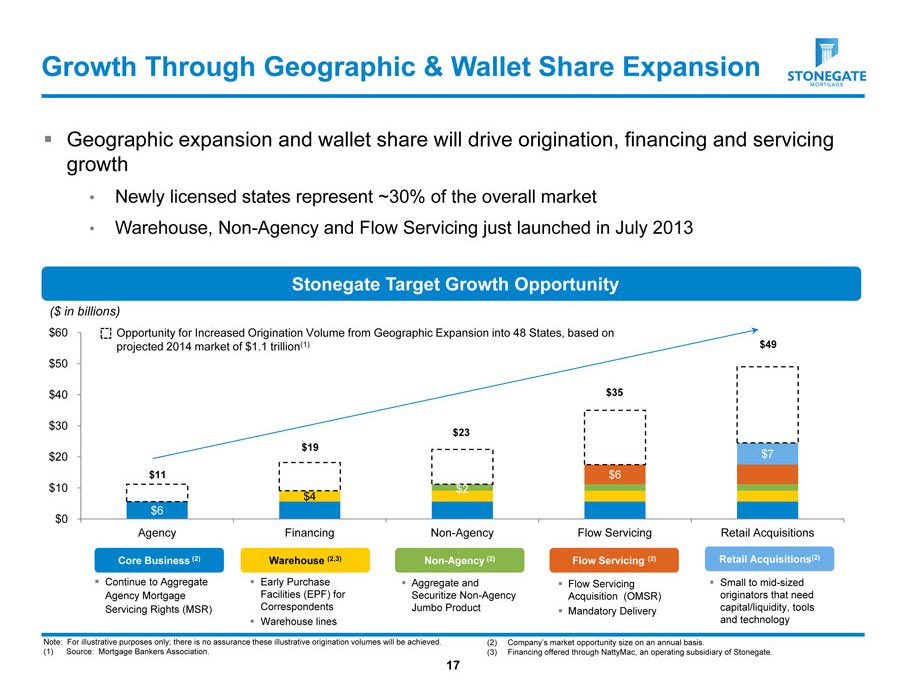
Growth Through Geographic & Wallet Share Expansion
Geographic expansion and wallet share will drive origination, financing and servicing growth
Newly licensed states represent ~30% of the overall market
Warehouse, Non-Agency and Flow Servicing just launched in July 2013
Stonegate Target Growth Opportunity
($ in billions)
$60 Opportunity for Increased Origination Volume from Geographic Expansion into 48 States, based on projected 2014 market of $1.1 trillion(1) $49 $50
$40 $35
$30 $23 $19
$20 $7
$11 $6
$10 $2 $4 $6 $0
Agency Financing Non-Agency Flow Servicing Retail Acquisitions
Core Business (2) Warehouse (2,3) Non-Agency (2) Flow Servicing (2) Retail Acquisitions(2)
Continue to Aggregate Early Purchase Aggregate and Flow Servicing Small to mid-sized Agency Mortgage Facilities (EPF) for Securitize Non-Agency Acquisition (OMSR) originators that need Servicing Rights (MSR) Correspondents Jumbo Product Mandatory Delivery capital/liquidity, tools
Warehouse lines and technology
Note: For illustrative purposes only; there is no assurance these illustrative origination volumes will be achieved. (2) Company’s market opportunity size on an annual basis.
(1) Source: Mortgage Bankers Association. (3) Financing offered through NattyMac, an operating subsidiary of Stonegate.
17
|
|
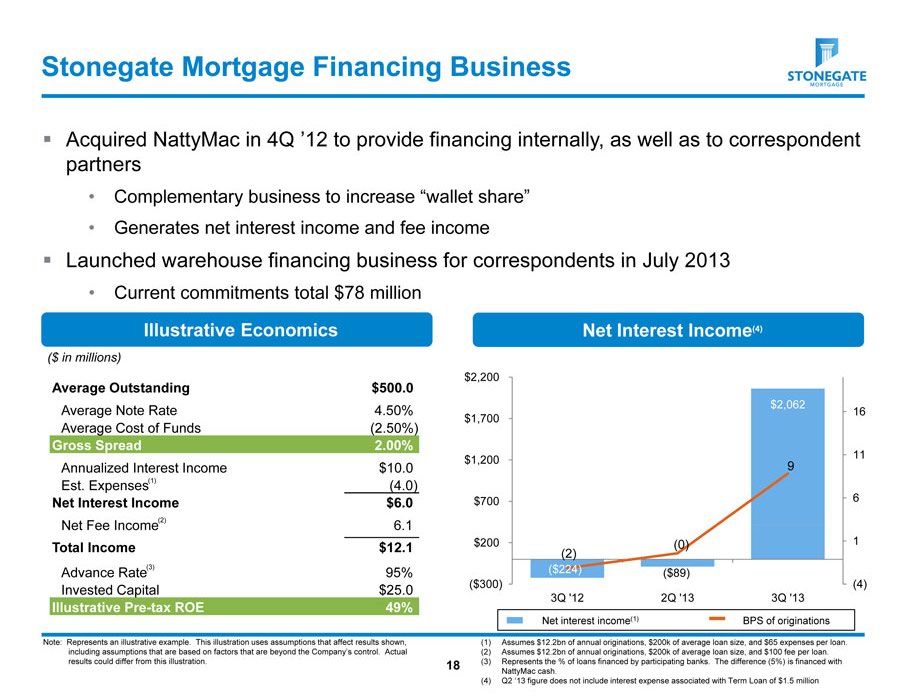
Stonegate Mortgage Financing Business
Acquired NattyMac in 4Q ‘12 to provide financing internally, as well as to correspondent partners
Complementary business to increase “wallet share”
Generates net interest income and fee income
Launched warehouse financing business for correspondents in July 2013
Current commitments total $78 million
Illustrative Economics Net Interest Income(4)
($ in millions) $2,200
Average Outstanding $500.0
Average Note Rate 4.50% $2,062
16 $1,700
Average Cost of Funds (2.50%)
Gross Spread 2.00% $1,200 9 11
Annualized Interest Income $10.0 Est. Expenses(1) (4.0)
Net Interest Income $6.0 $700 6
Net Fee Income(2) 6.1 $200 (0) 1
Total Income $12.1 (2)
(3) ($224)
Advance Rate 95% ($89)
Invested Capital $25.0 ($300) (4)
3Q ‘12 2Q ‘13 3Q ‘13
Illustrative Pre-tax ROE 49%
Net interest income(1) BPS of originations
Note: Represents an illustrative example. This illustration uses assumptions that affect results shown, (1) Assumes $12.2bn of annual originations, $200k of average loan size, and $65 expenses per loan. including assumptions that are based on factors that are beyond the Company’s control. Actual (2) Assumes $12.2bn of annual originations, $200k of average loan size, and $100 fee per loan. results could differ from this illustration. 18 (3) Represents the % of loans financed by participating banks. The difference (5%) is financed with NattyMac cash.
(4) Q2 ‘13 figure does not include interest expense associated with Term Loan of $1.5 million
|
|
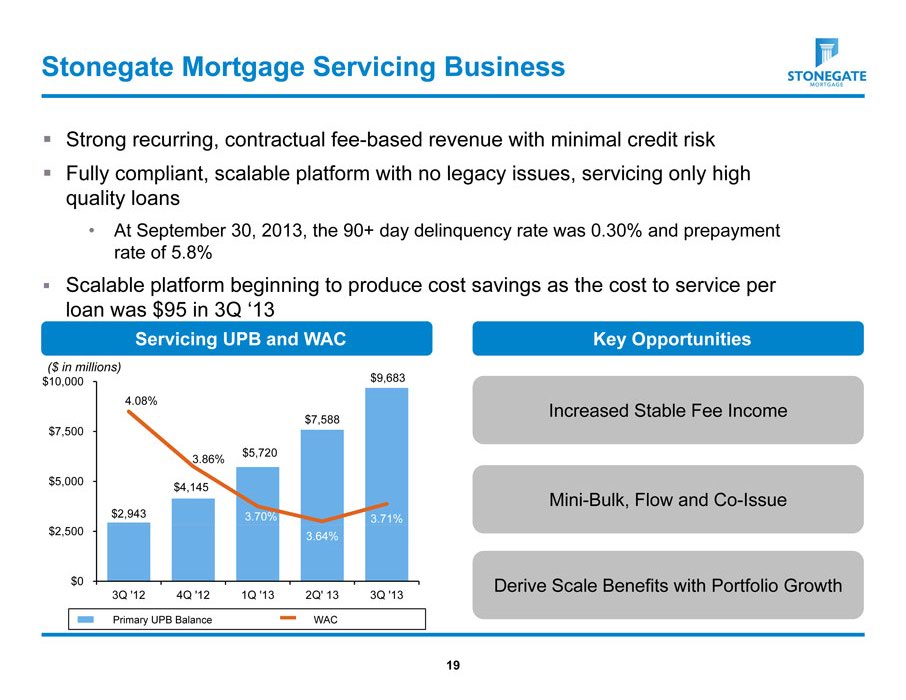
Stonegate Mortgage Servicing Business
Strong recurring, contractual fee-based revenue with minimal credit risk
Fully compliant, scalable platform with no legacy issues, servicing only high quality loans
At September 30, 2013, the 90+ day delinquency rate was 0.30% and prepayment rate of 5.8%
Scalable platform beginning to produce cost savings as the cost to service per loan was $95 in 3Q ‘13 Servicing UPB and WAC Key Opportunities
($ in millions) $9,683 $10,000
4.08%
Increased Stable Fee Income
$7,588 $7,500 $5,720
3.86% $5,000 $4,145
Mini-Bulk, Flow and Co-Issue
$2,943 3.70% 3.71% $2,500 3.64%
$0 Derive Scale Benefits with Portfolio Growth
3Q ‘12 4Q ‘12 1Q ‘13 2Q’ 13 3Q ‘13
Primary UPB Balance WAC
19
|
|
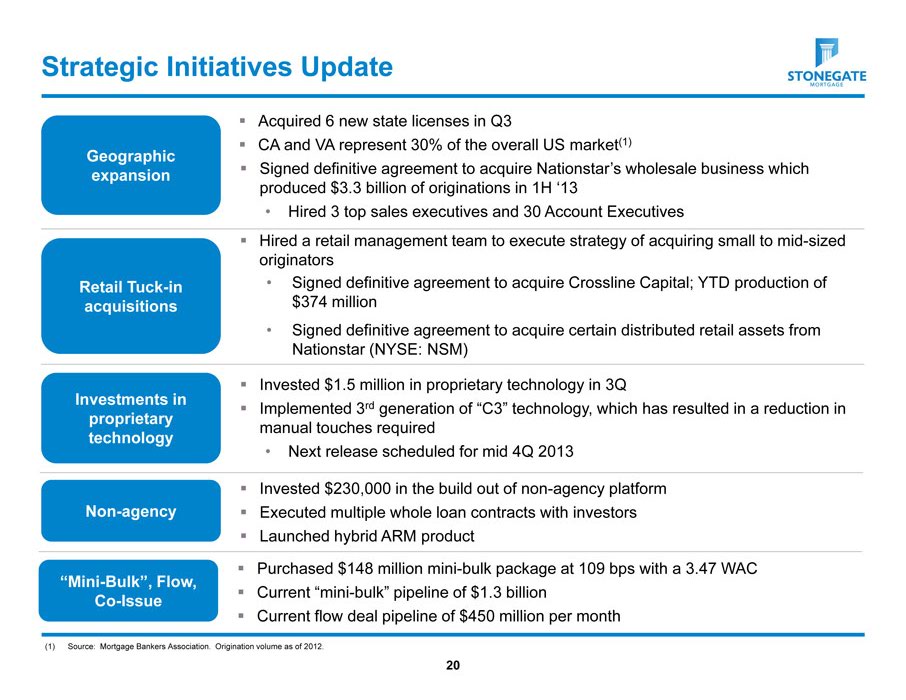
Strategic Initiatives Update
Acquired 6 new state licenses in Q3
CA and VA represent 30% of the overall US market(1)
Geographic expansion Signed definitive agreement to acquire Nationstar’s wholesale business which produced $3.3 billion of originations in 1H ‘13
Hired 3 top sales executives and 30 Account Executives
Hired a retail management team to execute strategy of acquiring small to mid-sized originators Retail Tuck-in Signed definitive agreement to acquire Crossline Capital; YTD production of acquisitions $374 million
Signed definitive agreement to acquire certain distributed retail assets from Nationstar (NYSE: NSM)
Investments in Invested $1.5 million in proprietary technology in 3Q proprietary Implemented 3rd generation of “C3” technology, which has resulted in a reduction in manual touches required technology
Next release scheduled for mid 4Q 2013
Invested $230,000 in the build out of non-agency platform Non-agency Executed multiple whole loan contracts with investors
Launched hybrid ARM product
Purchased $148 million mini-bulk package at 109 bps with a 3.47 WAC
“Mini-Bulk”, Flow,
Current “mini-bulk” pipeline of $1.3 billion
Co-Issue
Current flow deal pipeline of $450 million per month
(1) Source: Mortgage Bankers Association. Origination volume as of 2012.
20
|
|

Geographic Expansion Opportunity
Stonegate is currently licensed in 39 states which represent 84%(1) of the total U.S. residential mortgage market
Through 3Q ‘13, 92% of Stonegate’s origination volume has come from the 30 states it was licensed in as of 12/31/2012, which represents 51%(1) of the total market
WA
M
MT
ND MN E VT
OR
N
ID H SD WI NY MA
CT
WY MI
RI IA PA
NE NJ NV IN OH
UT I DE CO L WV MD & DC
CA VA KS MO
KY
NC
TN OK
AZ SC NM AR
MS AL GA
= Current SGM Retail
TX LA
Locations
= SGM License prior to = Pending Crossline Retail 2012 FL
= SGM Licensed in 2012 = Pending NSM Sales Office
= Current SGM Operations Centers
= SGM Licensed in 2013
= Pending NSM Sales Office with Processing
= Not yet licensed = Pending NSM Sales and Operations Office
(1) Source: Mortgage Bankers Association. Origination volume as of 2012.
21
|
|
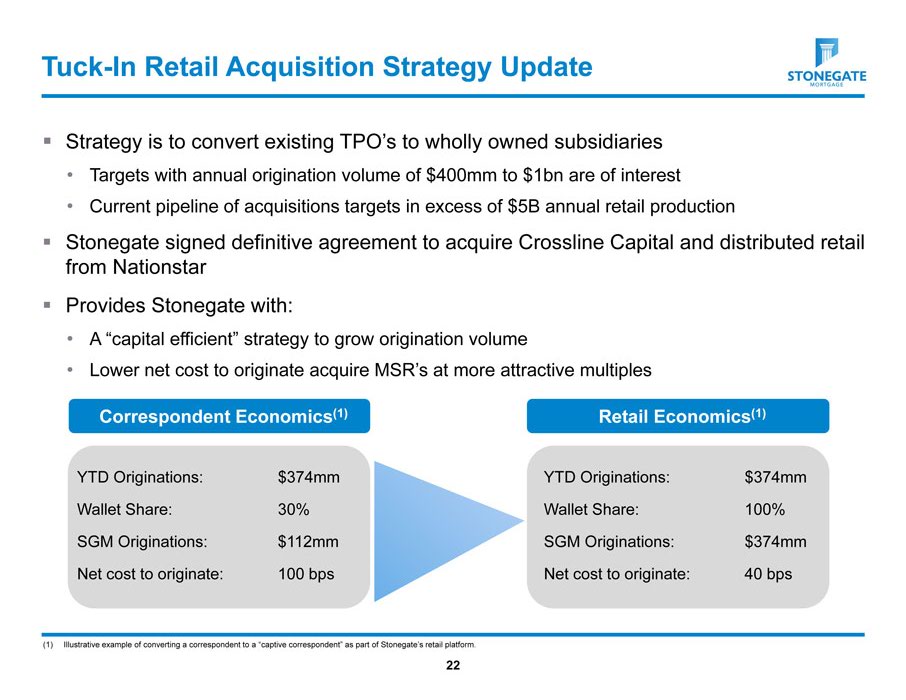
Tuck-In Retail Acquisition Strategy Update
Strategy is to convert existing TPO’s to wholly owned subsidiaries
Targets with annual origination volume of $400mm to $1bn are of interest
Current pipeline of acquisitions targets in excess of $5B annual retail production
Stonegate signed definitive agreement to acquire Crossline Capital and distributed retail from Nationstar
Provides Stonegate with:
A “capital efficient” strategy to grow origination volume
Lower net cost to originate acquire MSR’s at more attractive multiples
Correspondent Economics(1) Retail Economics(1)
YTD Originations: $374mm YTD Originations: $374mm Wallet Share: 30% Wallet Share: 100% SGM Originations: $112mm SGM Originations: $374mm Net cost to originate: 100 bps Net cost to originate: 40 bps
(1) Illustrative example of converting a correspondent to a “captive correspondent” as part of Stonegate’s retail platform.
22
|
|
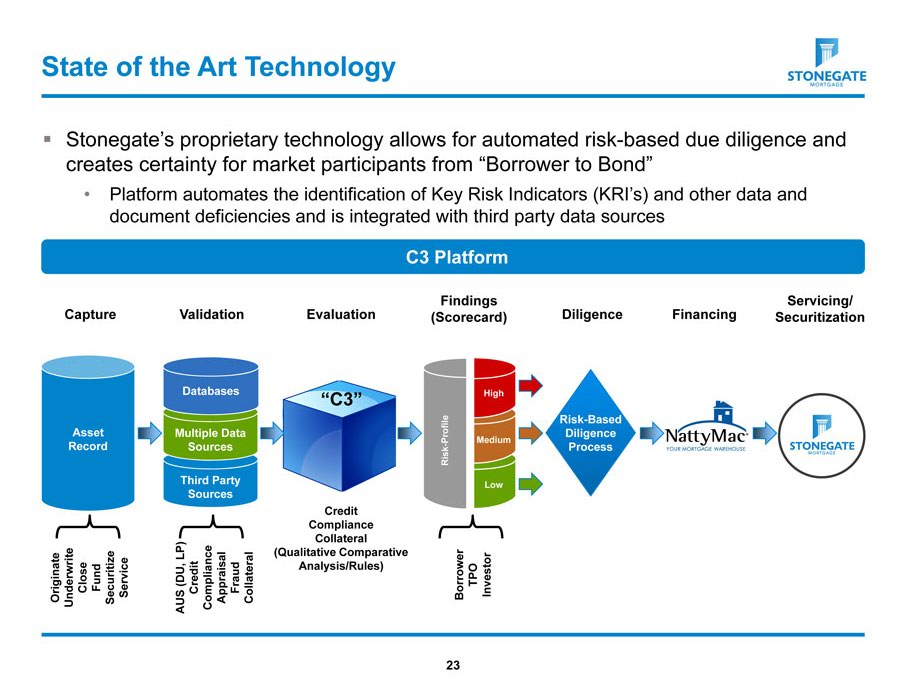
State of the Art Technology
Stonegate’s proprietary technology allows for automated risk-based due diligence and creates certainty for market participants from “Borrower to Bond”
Platform automates the identification of Key Risk Indicators (KRI’s) and other data and document deficiencies and is integrated with third party data sources
C3 Platform
Findings Servicing/ Capture Validation Evaluation (Scorecard) Diligence Financing Securitization
Databases “C3” High Asset Multiple Data Asset Profile
Record P - Medium
Record Sources Process
Risk
Third Party Low Sources Credit Compliance Collateral LP) (Qualitative Comparative (DU, Analysis/Rules) TPO
Originate Underwrite Close Fund Securitize Service AUS Credit Compliance Appraisal Fraud Collateral Borrower Investor
23
|
|
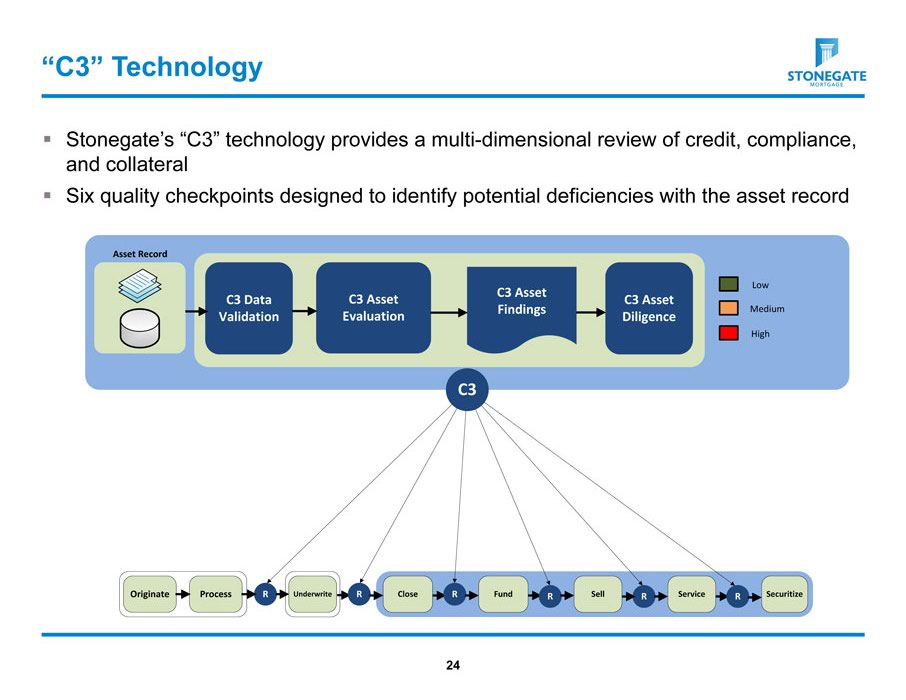
“C3” Technology
Stonegate’s “C3” technology provides a multi-dimensional review of credit, compliance, and collateral
Six quality checkpoints designed to identify potential deficiencies with the asset record
24
|
|
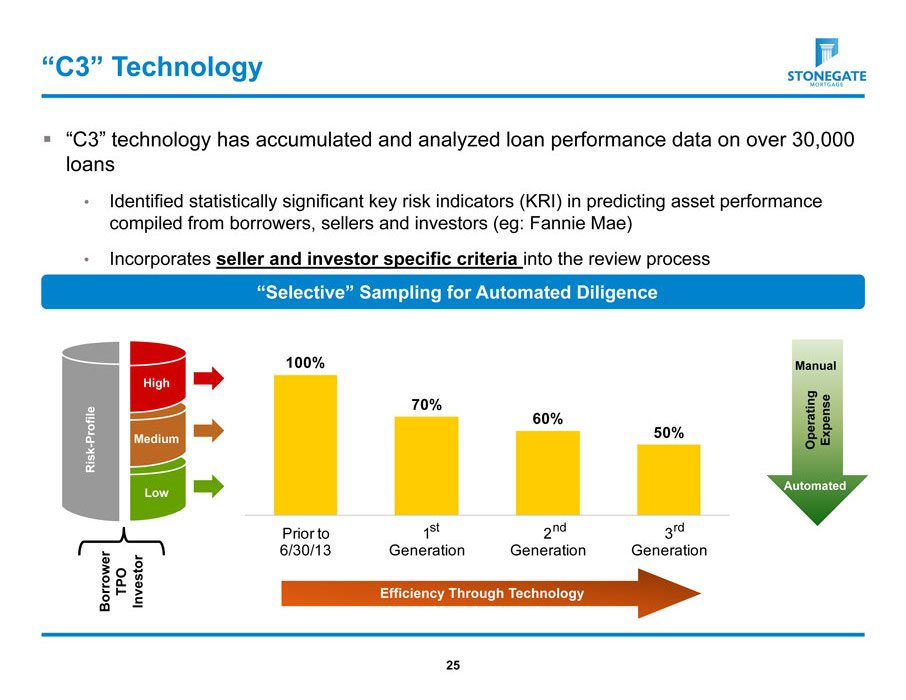
“C3” Technology
“C3” technology has accumulated and analyzed loan performance data on over 30,000 loans
Identified statistically significant key risk indicators (KRI) in predicting asset performance compiled from borrowers, sellers and investors (eg: Fannie Mae)
Incorporates seller and investor specific criteria into the review process “Selective” Sampling for Automated Diligence
100% Manual High
70% 60%
rofile 50% perating xpense
P Medium E Risk - O
Automated Low
Prior to 1st 2nd 3rd 6/30/13 Generation Generation Generation
Borrower TPO Investor Efficiency Through Technology
25
|
|
Appendix
|
|
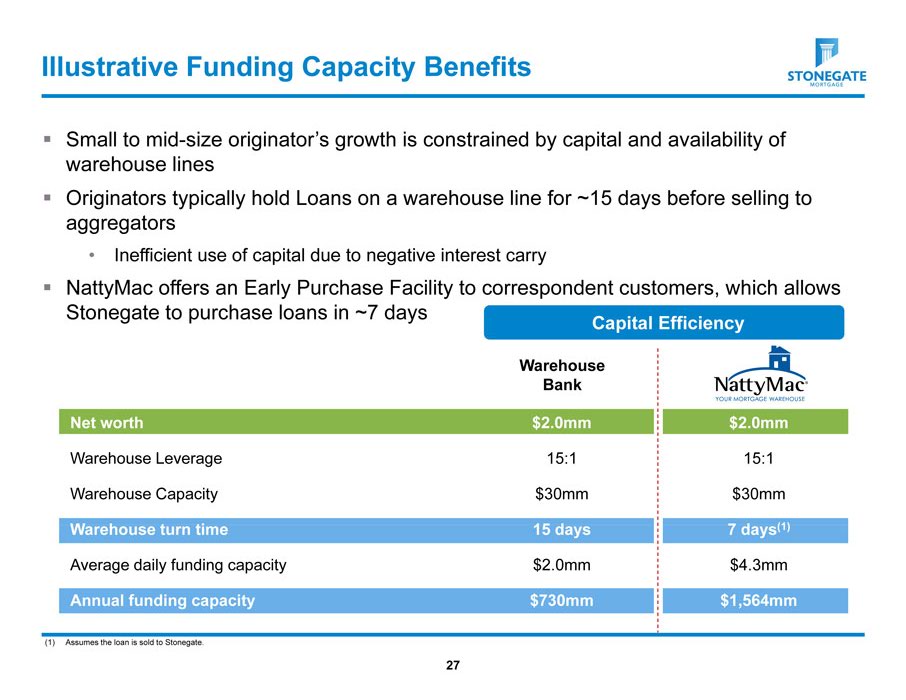
Illustrative Funding Capacity Benefits
Small to mid-size originator’s growth is constrained by capital and availability of warehouse lines
Originators typically hold Loans on a warehouse line for ~15 days before selling to aggregators
Inefficient use of capital due to negative interest carry
NattyMac offers an Early Purchase Facility to correspondent customers, which allows Stonegate to purchase loans in ~7 days
Capital Efficiency
Warehouse Bank
Net worth $2.0mm $2.0mm
Warehouse Leverage 15:1 15:1
Warehouse Capacity $30mm $30mm
Warehouse turn time 15 days 7 days(1)
Average daily funding capacity $2.0mm $4.3mm
Annual funding capacity $730mm $1,564mm
(1) Assumes the loan is sold to Stonegate.
27
|
|
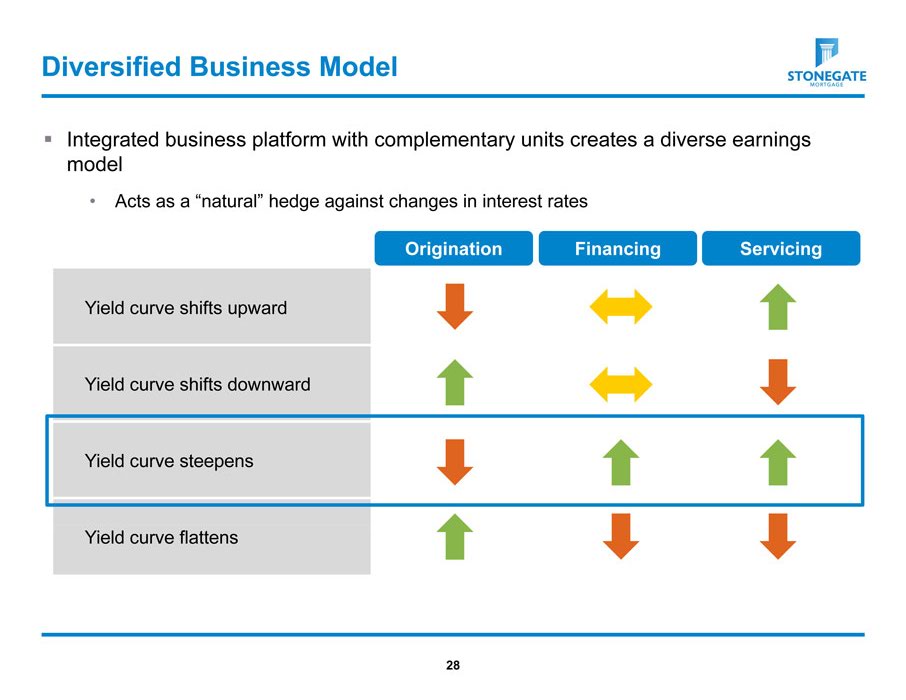
Diversified Business Model
Integrated business platform with complementary units creates a diverse earnings model
Acts as a “natural” hedge against changes in interest rates
Origination Financing Servicing
Yield curve shifts upward Yield curve shifts downward Yield curve steepens Yield curve flattens
28
|
|
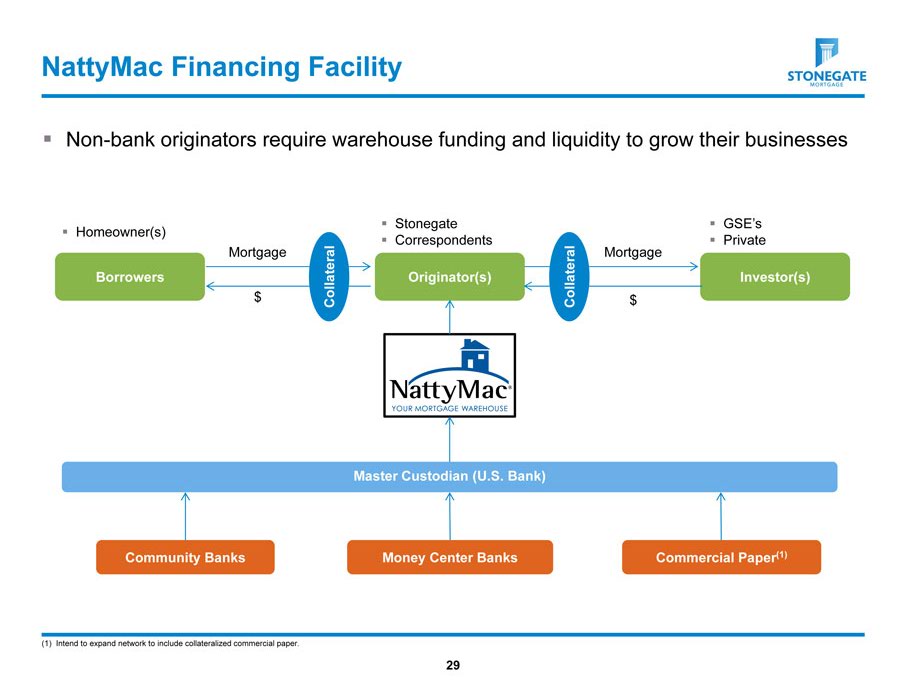
NattyMac Financing Facility
Non-bank originators require warehouse funding and liquidity to grow their businesses
Stonegate GSE’s
Homeowner(s)
Mortgage Correspondents Mortgage Private ral ral Borrowers Originator(s) Investor(s) $ Collate Collate $
Master Custodian (U.S. Bank)
Community Banks Money Center Banks Commercial Paper(1)
(1) Intend to expand network to include collateralized commercial paper.
29
|
|
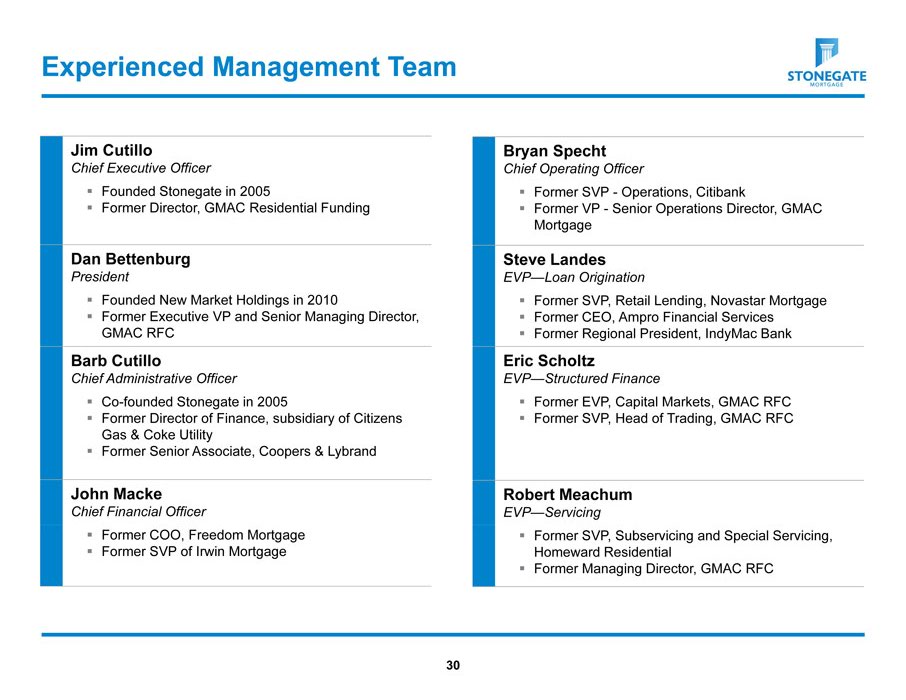
Experienced Management Team
Jim Cutillo Bryan Specht
Chief Executive Officer Chief Operating Officer
Founded Stonegate in 2005 Former SVP - Operations, Citibank
Former Director, GMAC Residential Funding Former VP - Senior Operations Director, GMAC
Mortgage
Dan Bettenburg Steve Landes
President EVP—Loan Origination
Founded New Market Holdings in 2010 Former SVP, Retail Lending, Novastar Mortgage
Former Executive VP and Senior Managing Director, Former CEO, Ampro Financial Services GMAC RFC Former Regional President, IndyMac Bank
Barb Cutillo Eric Scholtz
Chief Administrative Officer EVP—Structured Finance
Co-founded Stonegate in 2005 Former EVP, Capital Markets, GMAC RFC
Former Director of Finance, subsidiary of Citizens Former SVP, Head of Trading, GMAC RFC Gas & Coke Utility
Former Senior Associate, Coopers & Lybrand
John Macke Robert Meachum
Chief Financial Officer EVP—Servicing
Former COO, Freedom Mortgage Former SVP, Subservicing and Special Servicing,
Former SVP of Irwin Mortgage Homeward Residential
Former Managing Director, GMAC RFC 30