Attached files
| file | filename |
|---|---|
| EX-3.2 - EX-3.2 - PENNANTPARK INVESTMENT CORP | d623846dex32.htm |
| EX-21.1 - EX-21.1 - PENNANTPARK INVESTMENT CORP | d623846dex211.htm |
| EX-14.1 - EX-14.1 - PENNANTPARK INVESTMENT CORP | d623846dex141.htm |
| EX-31.1 - EX-31.1 - PENNANTPARK INVESTMENT CORP | d623846dex311.htm |
| EX-31.2 - EX-31.2 - PENNANTPARK INVESTMENT CORP | d623846dex312.htm |
| EX-32.1 - EX-32.1 - PENNANTPARK INVESTMENT CORP | d623846dex321.htm |
| EX-32.2 - EX-32.2 - PENNANTPARK INVESTMENT CORP | d623846dex322.htm |
Table of Contents
UNITED STATES
SECURITIES AND EXCHANGE COMMISSION
WASHINGTON, D.C. 20549
FORM 10-K
(Mark One)
| x | ANNUAL REPORT PURSUANT TO SECTION 13 OR 15(d) OF THE SECURITIES EXCHANGE ACT OF 1934 |
FOR THE FISCAL YEAR ENDED SEPTEMBER 30, 2013
OR
| ¨ | TRANSITION REPORT PURSUANT TO SECTION 13 OR 15(d) OF THE SECURITIES EXCHANGE ACT OF 1934 |
FOR THE TRANSITION PERIOD FROM TO
COMMISSION FILE NUMBER: 814-00736
PENNANTPARK INVESTMENT CORPORATION
(Exact name of registrant as specified in its charter)
| MARYLAND | 20-8250744 | |
| (State or other jurisdiction of incorporation or organization) | (I.R.S. Employer Identification No.) | |
| 590 Madison Avenue, 15th Floor New York, N.Y. |
10022 | |
| (Address of principal executive offices) | (Zip Code) | |
Registrant’s telephone number, including area code (212)-905-1000
Securities registered pursuant to Section 12(b) of the Act:
| Title of Each Class | Name of Each Exchange on Which Registered | |
| Common Stock, par value $0.001 per share 6.25% Senior Notes due 2025 |
The NASDAQ Stock Market LLC The New York Stock Exchange |
Securities registered pursuant to Section 12(g) of the Act: None
Indicate by check mark if the registrant is a well-known seasoned issuer, as defined in Rule 405 of the Securities Act. Yes ¨ No x.
Indicate by check mark if the registrant is not required to file reports pursuant to Section 13 or Section 15(d) of the Act. Yes ¨ No x.
Indicate by check mark whether the registrant (1) has filed all reports required to be filed by Section 13 or 15(d) of the Securities Exchange Act of 1934 during the preceding 12 months (or for such shorter period that the registrant was required to file such reports), and (2) has been subject to such filing requirements for the past 90 days. Yes x No ¨.
Indicate by check mark whether the registrant has submitted electronically and posted on its corporate Web site, if any, every Interactive Data File required to be submitted and posted pursuant to Rule 405 of Regulation S-T (§232.405 of this chapter) during the preceding 12 months (or for such shorter period that the registrant was required to submit and post such files). Yes ¨ No ¨
Indicate by check mark if disclosure of delinquent filers pursuant to Item 405 of Regulation S-K (§229.405 of this chapter) is not contained herein, and will not be contained, to the best of registrant’s knowledge, in definitive proxy or information statements incorporated by reference in Part III of this Form 10-K or any amendment to this Form 10-K. ¨
Indicate by check mark whether the registrant is a large accelerated filer, an accelerated filer, a non-accelerated filer or a smaller reporting company. See the definitions of “large accelerated filer,” “accelerated filer” and “smaller reporting company” in Rule 12b-2 of the Exchange Act. (Check one):
| Large accelerated filer x. |
Accelerated filer ¨. | Non-accelerated filer (Do not check if smaller reporting company) ¨. | Smaller Reporting Company ¨ |
Indicate by check mark whether the registrant is a shell company (as defined in Rule 12b-2 of the Exchange Act). Yes ¨ No x.
The aggregate market value of common stock held by non-affiliates of the Registrant on March 28, 2013 based on the closing price on that date of $11.30 on the NASDAQ Global Select Market was approximately $737 million. For the purposes of calculating this amount only, all directors and executive officers of the Registrant have been treated as affiliates. There were 66,546,734 shares of the Registrant’s common stock outstanding as of November 13, 2013.
Documents Incorporated by Reference: Portions of the Registrant’s Proxy Statement relating to the Registrant’s 2014 Annual Meeting of Stockholders to be filed not later than 120 days after the end of the fiscal year covered by this Annual Report on Form 10-K are incorporated by reference into Part III of this Report.
Table of Contents
PENNANTPARK INVESTMENT CORPORATION
FORM 10-K
FOR THE FISCAL YEAR ENDED SEPTEMBER 30, 2013
| PART I | ||||||
| Item 1. |
1 | |||||
| Item 1A. |
14 | |||||
| Item 1B. |
28 | |||||
| Item 2. |
28 | |||||
| Item 3. |
28 | |||||
| Item 4. |
28 | |||||
| PART II | ||||||
| Item 5. |
29 | |||||
| Item 6. |
32 | |||||
| Item 7. |
Management’s Discussion and Analysis of Financial Condition and Results of Operations |
33 | ||||
| Item 7A. |
40 | |||||
| Item 8. |
41 | |||||
| Item 9. |
Changes in and Disagreements with Accountants on Accounting and Financial Disclosure |
68 | ||||
| Item 9A. |
68 | |||||
| Item 9B. |
68 | |||||
| PART III | ||||||
| Item 10. |
69 | |||||
| Item 11. |
69 | |||||
| Item 12. |
Security Ownership of Certain Beneficial Owners and Management and Related Stockholder Matters |
69 | ||||
| Item 13. |
Certain Relationships and Related Transactions, and Director Independence |
69 | ||||
| Item 14. |
69 | |||||
| PART IV | ||||||
| Item 15. |
70 | |||||
| 71 | ||||||
Table of Contents
In this annual report on Form 10-K, or the Report, except where the context suggests otherwise, the terms “we,” “us” or “our” refer to PennantPark Investment Corporation and its consolidated subsidiaries; “PennantPark Investment” refers to only PennantPark Investment Corporation; “our SBIC Funds” refers collectively to our consolidated subsidiaries, PennantPark SBIC LP, or SBIC LP, and its general partner, PennantPark SBIC GP, LLC, and PennantPark SBIC II LP, or SBIC II, and its general partner, PennantPark SBIC GP II, LLC; “PennantPark Investment Advisers” or “Investment Adviser” refers to PennantPark Investment Advisers, LLC; and “PennantPark Investment Administration” or “Administrator” refers to PennantPark Investment Administration, LLC. “SBA” refers to the Small Business Administration; “SBIC” refers to a Small Business Investment Company; “Credit Facility” refers to our multi-currency, senior secured revolving credit facility; “2025 Notes” refers to our 6.25% senior notes due 2025; “1940 Act” refers to the Investment Company Act of 1940, as amended; “Code” refers to the Internal Revenue Code of 1986, as amended; “RIC” refers to a regulated investment company under the Code ; and “BDC” refers to a business development company under the 1940 Act. References to our portfolio, our investments and our business include investments we make through our SBIC Funds and other consolidated subsidiaries. Some of the statements in this annual report constitute forward-looking statements, which apply to us and relate to future events, future performance or future financial condition. The forward-looking statements involve risks and uncertainties for us and actual results could differ materially from those projected in the forward-looking statements for any reason, including those factors discussed in “Risk Factors” and elsewhere in this Report.
| Item 1. | Business |
General Business of PennantPark Investment Corporation
PennantPark Investment Corporation is a BDC whose objectives are to generate both current income and capital appreciation through debt and equity investments primarily in U.S. middle-market companies in the form of senior secured loans, mezzanine debt and equity investments.
We believe middle-market companies offer attractive risk-reward to investors due to the limited amount of capital available for such companies. We seek to create a diversified portfolio that includes senior secured loans, mezzanine debt and equity investments by investing approximately $10 million to $50 million of capital, on average, in the securities of middle-market companies. We expect this investment size to vary proportionately with the size of our capital base. We use the term “middle-market” to refer to companies with annual revenues between $50 million and $1 billion. The companies in which we invest are typically highly leveraged, and, in most cases, are not rated by national rating agencies. If such companies were rated, we believe that they would typically receive a rating below investment grade (between BB and CCC under the Standard & Poor’s system) from the national rating agencies. Our debt investments may generally range in maturity from three to ten years and, are made to U.S. and to a limited extent, non-U.S. corporations, partnerships and other business entities which operate in various industries and geographical regions.
Our investment activity depends on many factors, including the amount of debt and equity capital available to middle-market companies, the level of merger and acquisition activity for such companies, the general economic environment and the competitive environment for the types of investments we make. We have used, and expect to continue to use our Credit Facility, SBA debentures, proceeds from the rotation of our portfolio and proceeds from public and private offerings of securities to finance our investment objectives.
Organization and Structure of PennantPark Investment Corporation
PennantPark Investment Corporation, a Maryland corporation organized in January 2007, is a closed-end, externally managed, non-diversified investment company that has elected to be treated as a BDC under the 1940 Act. In addition, for federal income tax purposes we have elected to be treated, and intend to qualify annually, as a RIC under the Code.
Our wholly owned subsidiaries, SBIC LP and SBIC II, were organized as Delaware limited partnerships in May 2010 and July 2012, respectively. SBIC LP and SBIC II received licenses from the SBA to operate as SBICs, under Section 301(c) of the Small Business Investment Act of 1958, as amended, or the 1958 Act, in July 2010 and January 2013, respectively. Our SBIC Funds’ objectives are to generate both current income and capital appreciation through debt and equity investments generally by investing with us in SBA eligible businesses that meet the investment criteria used by PennantPark Investment.
Our Investment Adviser and Administrator
We utilize the investing experience and contacts of PennantPark Investment Advisers in developing what we believe is an attractive and diversified portfolio. The senior investment professionals of the Investment Adviser have worked together for many years and average over 25 years of experience in the mezzanine lending, leveraged finance, distressed debt and private equity businesses. In addition, our senior investment professionals have been involved in originating, structuring, negotiating, managing and monitoring investments in each of these businesses across economic and market cycles. We believe this experience and history has resulted in a strong reputation with financial sponsors, management teams, investment bankers, attorneys and accountants, which provides us with access to substantial investment opportunities across the capital markets. Our Investment Adviser has a rigorous investment approach, which is based upon intensive financial analysis with a focus on capital preservation, diversification and active management. Since our Investment Adviser’s inception in 2007, it has raised approximately $1.8 billion in debt and equity capital and has invested approximately $3.0 billion in almost 300 companies with 125 different financial sponsors through its managed funds.
Our Administrator has experienced professionals with substantial backgrounds in finance and administration of registered investment companies. In addition to furnishing us with clerical, bookkeeping and record keeping services, the Administrator also oversees our financial records as well as the preparation of our reports to stockholders and reports filed with the Securities and Exchange Commission, or the SEC, and the SBA. The Administrator assists in the determination and publication of our net asset value, or NAV, oversees the preparation and filing of our tax returns, and monitors the payment of our expenses as well as the performance of administrative and professional services rendered to us by others. Furthermore, our Administrator provides, on our behalf, managerial assistance to those portfolio companies to which we are required to offer such assistance. See “Risk Factors—Risks Relating to our Business and Structure—There are significant potential conflicts of interest which could impact our investment returns” for more information.
Market Opportunity
We believe that the limited amount of capital available to the middle-market companies, coupled with the desire of these companies for flexible sources of capital, creates an attractive investment environment for us.
| • | We believe middle-market companies have faced increasing difficulty in raising debt through the capital markets. While many middle-market companies were formerly able to raise funds by issuing high-yield bonds, we believe this approach to financing has become more difficult as institutional investors have sought to invest in larger, more liquid offerings. We believe this has made it harder for middle-market companies to raise funds by issuing high-yield debt securities. |
| • | We believe middle-market companies have faced difficulty raising debt in private markets. From time to time, banks, finance companies, hedge funds and collateralized loan obligation, or CLO, funds have, and may again, withdraw capital from the middle-market, resulting in opportunities for alternative funding sources. |
1
Table of Contents
| • | We believe that the current credit market dislocation for middle-market companies improves the risk-adjusted returns of our investments. In the current credit environment, market participants have reduced lending to middle-market and non-investment grade borrowers. As a result, there is less competition in our market, more conservative capital structures, higher yields and stronger covenants. |
| • | We believe there is a large pool of uninvested private equity capital likely to seek to combine their capital with sources of debt capital to complete private investments. We expect that private equity firms will continue to be active investors in middle-market companies. These private equity funds generally seek to leverage their investments by combining their capital with senior secured loans and/or mezzanine debt provided by other sources, and we believe that our capital is well-positioned to partner with such equity investors. We expect such activity to be funded by the substantial amounts of private equity capital that have been raised in recent years. |
| • | We believe there is a substantial supply of opportunities. A high volume of financings will come due in the next few years. Additionally, we believe that demand for debt financing from middle-market companies will remain strong because these companies will continue to require credit to refinance existing debt, to support growth initiatives and to finance acquisitions. We believe the combination of strong demand by middle-market companies and the reduced supply of credit described above should increase lending opportunities for us. We believe this supply of opportunities coupled with lack of demand offers attractive risk-adjusted returns to investors. |
Competitive Advantages
We believe that we have the following competitive advantages over other capital providers to middle-market companies:
| a) | Experienced Management Team |
The senior investment professionals of our Investment Adviser have worked together for many years and average over 25 years of experience in mezzanine lending, leveraged finance, distressed debt and private equity businesses. These senior investment professionals have been involved in originating, structuring, negotiating, managing and monitoring investments in each of these businesses across economic and market cycles. We believe this extensive experience and history has resulted in a strong reputation across the capital markets.
Lending to middle-market companies requires in deep diligence, credit expertise, restructuring experience and active portfolio management. For example, lending to middle-market companies in the United States is generally more labor intensive than lending to larger companies due to the smaller size of each investment and the fragmented nature of the information available with respect to such companies. Specialized due diligence and underwriting capabilities, and more extensive ongoing monitoring are required by the lender.
| b) | Disciplined Investment Approach with Strong Value Orientation |
We employ a disciplined approach in selecting investments that meet the long-standing, consistent value-oriented investment criteria employed by our Investment Adviser. Our value-oriented investment philosophy focuses on preserving capital and ensuring that our investments have an appropriate return profile in relation to risk. When market conditions make it difficult for us to invest according to our criteria, we are highly selective in deploying our capital. We believe this approach continues to enable us to build an attractive investment portfolio that meets our return and value criteria over the long-term.
We believe it is critical to conduct extensive due diligence on investment targets. In evaluating new investments we, through our Investment Adviser, conduct a rigorous due diligence process that draws from our Investment Adviser’s experience, industry expertise and network of contacts. Among other things, our due diligence is designed to ensure that each prospective portfolio company will be able to meet its debt service obligations. See “Investment Selection Criteria” for more information.
In addition to engaging in extensive due diligence, our Investment Adviser seeks to reduce risk by focusing on businesses with:
| • | strong competitive positions; |
| • | positive cash flow that is steady and stable; |
| • | experienced management teams with strong track records; |
| • | potential for growth and viable exit strategies; and |
| • | capital structures offering appropriate risk-adjusted terms and covenants. |
| c) | Ability to Source and Evaluate Transactions through our Investment Adviser’s Research Capability and Established Network |
The management team of the Investment Adviser has long-term relationships with financial sponsors, management consultants and management teams that we believe enable us to evaluate investment opportunities effectively in numerous industries, as well as provide us access to substantial information concerning those industries. We identify potential investments both through active origination and through dialogue with numerous financial sponsors, management teams, members of the financial community and corporate partners with whom the professionals of our Investment Adviser have long-term relationships.
| d) | Flexible Transaction Structuring |
We are flexible in structuring investments and tailor investments to meet the needs of a portfolio company while also generating attractive risk-adjusted returns. We can invest in any part of a capital structure and our Investment Adviser has extensive experience in a wide variety of securities for leveraged companies throughout economic and market cycles.
Our Investment Adviser seeks to minimize the risk of capital loss without foregoing potential for capital appreciation. In making investment decisions, we seek to invest in companies that we believe can generate positive risk-adjusted returns.
We believe that the in-depth coverage and experience of our Investment Adviser will enable us to invest throughout various stages of the economic and market cycles and to provide us with ongoing market insights in addition to a significant investment sourcing engine.
Competition
Our primary competitors provide financing to middle-market companies and include other BDCs, commercial and investment banks, commercial finance companies, CLO funds and, to the extent they provide an alternative form of financing, private equity funds. Additionally, alternative investment vehicles, such as hedge funds, frequently invest in middle-market companies. As a result, competition for investment opportunities in middle-market companies can be intense. However, we believe that there has been a reduction in the amount of debt capital available to middle-market companies since the downturn in the credit markets, which began in mid-2007. We believe this has resulted in a less competitive environment for making new investments.
2
Table of Contents
Many of our competitors are substantially larger and have considerably greater financial, technical and marketing resources than we do. For example, we believe some competitors have a lower cost of funds and access to funding sources that are not available to us. In addition, some of our competitors have higher risk tolerances or different risk assessments, which could allow them to consider a wider variety of investments and establish more relationships than us. Furthermore, many of our competitors are not subject to the regulatory restrictions that the 1940 Act imposes on us as a BDC. See “Risk Factors—Risks Relating to our Business and Structure—We operate in a highly competitive market for investment opportunities” for more information.
Leverage
We maintain a multi-currency $430.0 million Credit Facility which matures in February 2016 and is secured by substantially all of our investment portfolio assets (excluding the assets of our SBIC Funds), under which we had $145.5 million (including a $28.0 million temporary draw) and $145.0 million (including a $35.5 million temporary draw) of debt outstanding with a weighted average interest rate of 3.33% and 3.49% as of September 30, 2013 and 2012, respectively. Pricing of borrowings under our current Credit Facility is set at 275 basis points over the London Interbank Offered Rate, or LIBOR. As of September 30, 2013 and 2012, we had $284.5 million and $235.0 million, respectively, available to us under our Credit Facility. We believe that our capital resources will provide us with the flexibility to take advantage of market opportunities when they arise. Our use of leverage, as calculated under the asset coverage requirements of the 1940 Act, may generally range between 60% to 80% of our net assets.
As of September 30, 2013 and 2012, SBIC LP had drawn $150 million in SBA debentures, with a weighted average interest rate of 3.70%, exclusive of 3.43% of upfront fees (4.04% inclusive of the upfront fees), and had no remaining borrowing capacity. SBA debentures offer competitive terms such as being non-recourse to us, a 10-year maturity, semi-annual interest payments, not requiring principal payments prior to maturity and may be prepaid at any time without penalty. The SBA debentures are secured by all the investment portfolio assets of SBIC LP and have a priority claim over such assets relative to all other creditors. See “Regulation” for more information.
In January 2013, we issued $71.3 million in aggregate principal amount of 2025 Notes. Interest on the 2025 Notes accrues at a rate of 6.25% per year. The 2025 Notes mature on February 1, 2025. The 2025 Notes are general, unsecured obligations and rank equal in right of payment with all of our existing and future senior unsecured indebtedness. The 2025 Notes are structurally subordinated to our SBA debentures and the assets pledged or secured under our Credit Facility.
Investment Policy Overview
We seek to create a diversified portfolio that includes senior secured loans, mezzanine debt and equity by targeting an investment size of $10 million to $50 million in securities, on average, of middle-market companies. We expect this investment size to vary proportionately with the size of our capital base. The companies in which we invest are typically highly leveraged, and, in most cases, are not rated by national rating agencies. If such companies were rated, we believe that they would typically receive a rating below investment grade (between BB and CCC under the Standard & Poor’s system) from the national rating agencies. In addition, we expect our debt investments to range in maturity from three to ten years.
Over time, we expect that our portfolio will continue to consist primarily of senior secured loans, mezzanine debt and, to a lesser extent, equity investments in qualifying assets such as private or thinly traded or small market-capitalization, U.S. middle market public companies. In addition, we may invest up to 30% of our portfolio in non-qualifying assets. See “Regulation—Qualifying Assets” for more information. These non-qualifying assets may include investments in public companies whose securities are not thinly traded or do not have a market capitalization of less than $250 million, securities of middle-market companies located outside of the United States and investment companies as defined in the 1940 Act. Moreover, we may acquire investments in the secondary market. See “Investment Selection Criteria” for more information.
Our board of directors has the authority to modify or waive certain of our operating policies and strategies without prior notice and without stockholder approval (except as required by the 1940 Act). However, absent stockholder approval, under the 1940 Act we may not change the nature of our business so as to cease to be, or withdraw our election as, a BDC. We cannot predict the effect any changes to our current operating policies and strategies would have on our business, operating results and value of our stock. Nevertheless, the effects of changes to our operating policies and strategies may adversely affect our business, our ability to make distributions and the value of our stock.
Senior Secured Debt
Structurally, senior secured debt (which we define to include first lien debt) ranks senior in priority of payment to mezzanine debt and equity, and benefits from a senior security interest in the assets of the borrower. As such, other creditors rank junior to our investments in these securities in the event of insolvency. Due to its lower risk profile and often more restrictive covenants as compared to mezzanine debt, senior secured debt generally earns a lower return than mezzanine debt. In some cases senior secured lenders receive opportunities to invest directly in the equity securities of borrowers and from time to time may also receive warrants to purchase equity securities. We evaluate these investment opportunities on a case-by-case basis.
Mezzanine Debt
Structurally, mezzanine debt (which we define to include second lien secured debt and subordinated debt) usually ranks subordinate in priority of payment to senior secured loans. Our second lien secured debt is subordinated debt that benefits from a security interest in the borrower. As such, other creditors may rank senior to us in the event of insolvency. Mezzanine debt ranks senior to common and preferred equity in borrowers’ capital structures. Due to its higher risk profile and often less restrictive covenants as compared to senior secured loans, mezzanine debt generally earns a higher return than senior secured loans. In many cases mezzanine investors receive opportunities to invest directly in the equity securities of borrowers and from time to time may also receive warrants to purchase equity securities. We evaluate these investment opportunities on a case-by-case basis.
Investment Selection Criteria
We are committed to a value-oriented philosophy used by the senior investment professionals who manage our portfolio and seek to minimize the risk of capital loss without foregoing potential for capital appreciation.
We have identified several criteria, discussed below, that we believe are important in identifying and investing in prospective portfolio companies. These criteria provide general guidelines for our investment decisions. However, we caution that not all of these criteria will be met by each prospective portfolio company in which we choose to invest. Generally, we seek to use our experience and access to market information to identify investment candidates and to structure investments efficiently and effectively.
| a) | Leading and defensible competitive market positions |
The Investment Adviser invests in portfolio companies that it believes have developed strong positions within their markets and exhibit the potential to maintain sufficient cash flows and profitability to service their obligations in a range of economic environments. The Investment Adviser also seeks portfolio companies that it believes possess competitive advantages in scale, scope, customer loyalty, product pricing or product quality as compared to their competitors to protect their market position.
| b) | Investing in stable borrowers with positive cash flow |
Our investment philosophy places a premium on fundamental analysis and has a distinct value-orientation. The Investment Adviser invests in portfolio companies it believes to be stable and well established, with strong cash flows and profitability. The Investment Adviser believes these attributes indicate portfolio companies that may be well-positioned to maintain consistent cash flow to service and repay their liabilities and maintain growth in their businesses or their relative market share. The Investment Adviser currently does not expect to invest significantly in start-up companies, companies in turnaround situations or companies with speculative business plans, although we are permitted to do so.
3
Table of Contents
| c) | Proven management teams |
The Investment Adviser focuses on investments in which the portfolio company has an experienced management team with an established track record of success. The Investment Adviser typically requires that portfolio companies have in place proper incentives to align management’s goals with our goals, including having equity interests.
| d) | Financial sponsorship |
The Investment Adviser may seek to cause us to participate in transactions sponsored by what it believes to be high-quality financial sponsors. The Investment Adviser believes that a financial sponsor’s willingness to invest significant equity capital in a portfolio company is an implicit endorsement of the quality of that portfolio company. Further, financial sponsors of portfolio companies with significant investments at risk may have ability, and a strong incentive, to contribute additional capital in difficult economic times should financial or operational issues arise so as to maintain their ownership position.
| e) | Investments in different borrowers and industries |
The Investment Adviser seeks to invest our assets broadly among portfolio companies and across industries. The Investment Adviser believes that this diversified approach may reduce the risk that a downturn in any one portfolio company or industry will have a disproportionate impact on the value of our portfolio.
| f) | Viable exit strategy |
The Investment Adviser seeks to invest in portfolio companies that we believe will provide a steady stream of cash flow to repay our loans while also reinvesting in their respective businesses. We expect that such internally generated cash flow, leading to the payment of interest on, and the repayment of the principal of, our investments in portfolio companies to be a key means by which we will exit from our investments over time. In addition, we also seek to invest in portfolio companies whose business models and expected future cash flows offer attractive exit possibilities. These companies include candidates for strategic acquisition by other industry participants and companies that may repay our investments through an initial public offering of common stock, refinancing or other capital markets transaction.
Due Diligence
We believe it is critical to conduct extensive due diligence on investment targets and in evaluating new investments. Our Investment Adviser conducts a rigorous due diligence process that is applied to prospective portfolio companies and draws from our Investment Adviser’s experience, industry expertise and network of contacts. In conducting due diligence, our Investment Adviser uses information provided by companies, financial sponsors and publicly available information as well as information from relationships with former and current management teams, consultants, competitors and investment bankers.
Our due diligence typically includes:
| • | review of historical and prospective financial information; |
| • | research relating to the company’s management, industry, markets, products and services and competitors; |
| • | interviews with management, employees, customers and vendors of the potential portfolio company; |
| • | on-site visits; |
| • | review of loan documents; and |
| • | background checks. |
Additional due diligence with respect to any investment may be conducted on our behalf by attorneys and independent auditors prior to the closing of the investment, as well as other outside advisers, as appropriate.
Upon the completion of due diligence in a portfolio company, the team leading the investment presents the investment opportunity to our Investment Adviser’s investment committee. This committee determines whether to pursue the potential investment. All new investments are required to be reviewed by the investment committee of our Investment Adviser. The members of the investment committee receive no compensation from us. These members are employees of our Investment Adviser and receive compensation from our Investment Adviser.
The Investment Adviser monitors credit risk of each portfolio company regularly and periodically with a goal toward identifying early, and when able and appropriate, exiting other investments with potential credit problems. This monitoring process may include reviewing: (1) a portfolio company’s financial resources and operating history; (2) comparing a portfolio company’s current operating results with the Investment Adviser’s initial thesis for the investment and its expectations for the performance of the investment; (3) a portfolio company’s sensitivity to economic conditions; (4) the performance of a portfolio company’s management; (5) a portfolio company’s debt maturities and borrowing requirements; (6) a portfolio company’s interest and asset coverage; and (7) the relative value of an investment based on a portfolio company’s anticipated cash flow.
Investment Structure
Once we determine that a prospective portfolio company is suitable for investment, we work with the management of that portfolio company and its other capital providers, including senior, junior and equity capital providers, to structure an investment. We negotiate among these parties to agree on how our investment is structured relative to the other capital in the portfolio company’s capital structure.
We expect our senior secured loans to have terms of three to ten years. We generally obtain security interests in the assets of our portfolio companies that will serve as collateral in support of the repayment of these loans. This collateral may take the form of first or second priority liens on the assets of a portfolio company.
Typically, our mezzanine debt has maturities of three to ten years. Mezzanine debt may have interest-only payments in the early years with cash or payment-in-kind, or PIK, payments with amortization of principal deferred to the later years. In some cases, we may invest in debt securities that, by their terms, convert into equity or additional debt securities or defers payment of interest for the first few years after our investment. Also, in some cases our mezzanine debt may be collateralized by a subordinated lien on some or all of the assets of the borrower.
4
Table of Contents
We seek to tailor the terms of the investment to the facts and circumstances of the transaction and the prospective portfolio company, negotiating a structure that protects our rights and manages our risk while creating incentives for the portfolio company to achieve its business plan and improve its profitability. For example, in addition to seeking a senior position in the capital structure of our portfolio companies, we seek to limit the downside potential of our investments by:
| • | requiring a total return on our investments (including both interest in the form of a floor and potential equity appreciation) that compensates us for credit risk; |
| • | incorporating “put” rights and call protection into the investment structure; and |
| • | negotiating covenants in connection with our investments that afford our portfolio companies as much flexibility in managing their businesses as possible, consistent with our focus of preserving capital. Such restrictions may include affirmative and negative covenants, default penalties, lien protection, change of control provisions and board rights, including either observation or participation rights. |
Our investments may include equity features, such as direct investments in the equity securities of borrowers or warrants or options to buy a minority interest in a portfolio company. Any warrants we may receive with our debt securities generally require only a nominal cost to exercise, so as a portfolio company appreciates in value, we may achieve additional investment return from these equity investments. We may structure the warrants to provide provisions protecting our rights as a minority-interest holder, as well as puts, or rights to sell such securities back to the company, upon the occurrence of specified events. In many cases, we may also obtain registration rights in connection with these equity investments, which may include demand and “piggyback” registration rights.
We expect to hold most of our investments to maturity or repayment, but we may exit certain investments earlier if a liquidity event takes place, such as the sale or refinancing of a portfolio company. We also may turn over investments to better position the portfolio in light of market conditions.
Ongoing Relationships with Portfolio Companies
Monitoring
The Investment Adviser monitors our portfolio companies on an ongoing basis. The Investment Adviser also monitors the financial trends of each portfolio company to determine if it is meeting its respective business plan and to assess the appropriate course of action for each portfolio company.
The Investment Adviser has several methods of evaluating and monitoring the performance and fair value of our investments, which may include the following:
| • | assessment of success in adhering to a portfolio company’s business plan and compliance with covenants; |
| • | periodic or regular contact with portfolio company management and, if appropriate, the financial or strategic sponsor, to discuss financial position, requirements and accomplishments; |
| • | comparisons to other portfolio companies in the industry, if any; |
| • | attendance at and participation in board meetings or presentations by portfolio companies; and |
| • | review of monthly and quarterly financial statements and financial projections for portfolio companies. |
Managerial Assistance
We offer managerial assistance to our portfolio companies. As a BDC, we are required to make available such managerial assistance within the meaning of Section 55 of the 1940 Act. See “Regulation” for more information.
Staffing
We do not currently have any employees. Our Investment Adviser and Administrator have hired and expect to continue to hire professionals with skills applicable to our business plan, including experience in middle-market investing, mezzanine lending, leveraged finance, distressed debt and private equity businesses.
Our Corporate Information
Our administrative and principal executive offices are located at 590 Madison Avenue, 15th Floor, New York, NY 10022. Our common stock is quoted on the NASDAQ Global Select Market under the symbol “PNNT.” Our 2025 Notes are quoted on the New York Stock Exchange, or the NYSE, under the symbol “PNTA.” Our phone number is (212) 905-1000, and our Internet website address is www.pennantpark.com. Information contained on our website is not incorporated by reference into this Report and you should not consider information contained on our website to be part of this Report. We file periodic reports, proxy statements and other information with the SEC and make such reports available on our website free of charge as soon as reasonably practicable. You may read and copy the materials that we file with the SEC at the SEC’s Public Reference Room at 100 F Street, N.E., Washington, D.C. 20549. You may obtain information on the operation of the Public Reference Room by calling the SEC at 1-800-SEC-0330. In addition, the SEC maintains an internet site at www.sec.gov that contains material that we file with the SEC on the EDGAR Database.
5
Table of Contents
Our Consolidated Portfolio
Our principal investment focus is to provide senior secured loans and mezzanine debt to U.S. middle-market companies in a variety of industries. We generally seek to target companies that generate positive cash flows from the broad variety of industries in which our Investment Adviser has direct expertise. The following is an illustrative list of the industries in which the Investment Adviser has invested:
| • Aerospace and Defense |
• Environmental Services | |
| • Auto Sector |
• Financial Services | |
| • Beverage, Food and Tobacco |
• Grocery | |
| • Broadcasting and Entertainment |
• Healthcare, Education and Childcare | |
| • Buildings and Real Estate |
• Home & Office Furnishings, Housewares & Durable Consumer Products | |
| • Business Services |
• Hotels, Motels, Inns and Gaming | |
| • Cable Television |
• Insurance | |
| • Cargo Transportation |
• Leisure, Amusement, Motion Picture, Entertainment | |
| • Chemicals, Plastics and Rubber |
• Logistics | |
| • Communications |
• Manufacturing/Basic Industries | |
| • Consumer Products |
• Media | |
| • Containers Packaging & Glass |
• Mining, Steel, Iron and Non-Precious Metals | |
| • Distribution |
• Oil and Gas | |
| • Diversified/Conglomerate Manufacturing |
• Other Media | |
| • Diversified/Conglomerate Services |
• Personal, Food and Miscellaneous Services | |
| • Diversified Natural Resources, Precious Metals and Minerals |
• Printing and Publishing | |
| • Education |
• Retail Stores | |
| • Electronics |
• Telecommunications | |
| • Energy/Utilities |
Listed below are our top ten portfolio companies and industries represented as a percentage of our consolidated portfolio assets (excluding cash equivalents) as of September 30:
| Portfolio Company |
2013 | Portfolio Company |
2012 | |||||||
| Pre-Paid Legal Services, Inc. |
6 | % | Last Mile Funding, Corp. (3 PD, Inc.) | 5 | % | |||||
| Magnum Hunter Resources Corporation (Eureka Hunter Pipeline, LLC) |
5 | Magnum Hunter Resources Corporation (Eureka Hunter Pipeline, LLC) |
5 | |||||||
| Brand Energy and Infrastructure Services, Inc. |
4 | LTI Flexible Products, Inc. | 4 | |||||||
| Jacobs Entertainment, Inc. |
4 | New Service Champ Holdings, Inc. (Service Champ Inc.) |
4 | |||||||
| LTI Flexible Products, Inc. |
4 | Pre-Paid Legal Services, Inc. | 4 | |||||||
| Vestcom International, Inc. |
4 | American Gilsonite Company | 3 | |||||||
| Instant Web, Inc. |
3 | Brand Energy and Infrastructure Services, Inc. | 3 | |||||||
| Penton Media, Inc. |
3 | Learning Care Group, Inc. | 3 | |||||||
| Trak Acquisition Corp. |
3 | Penton Media, Inc. | 3 | |||||||
| Varel International Energy Mezzanine Funding Corp. |
3 | Prince Mineral Holdings Corp. | 3 | |||||||
| Industry |
2013 | Industry |
2012 | |||||||
| Personal, Food and Miscellaneous Services |
11 | % | Healthcare, Education & Childcare | 8 | % | |||||
| Printing and Publishing |
9 | Electronics | 7 | |||||||
| Business Services |
8 | Energy/Utilities | 7 | |||||||
| Energy / Utilities |
8 | Auto Sector | 6 | |||||||
| Electronics |
7 | Business Services | 6 | |||||||
| Healthcare, Education & Childcare |
7 | Cargo Transport | 6 | |||||||
| Oil and Gas |
7 | Chemicals, Plastics and Rubber | 5 | |||||||
| Chemicals, Plastics and Rubber |
6 | Consumer Products | 5 | |||||||
| Consumer Products |
5 | Distribution | 4 | |||||||
| Hotels, Motels, Inns and Gaming |
5 | Personal, Food and Miscellaneous Services | 4 | |||||||
Our executive officers and directors, as well as the senior investment professionals of the Investment Adviser and Administrator, may serve as officers, directors or principals of entities that operate in the same or a related line of business as we do. Currently, the executive officers and directors, as well as the current senior investment professionals of the Investment Adviser and Administrator, serve as officers and directors of PennantPark Floating Rate Capital Ltd., a publicly traded BDC, and other managed funds as applicable. Accordingly, they may have obligations to investors in those entities, the fulfillment of which obligations might not be in the best interest of us or our stockholders. In addition, we note that any affiliated investment vehicle currently existing, or formed in the future, and managed by the Investment Adviser and or its affiliates may, notwithstanding different stated investment objectives, have overlapping investment objectives with our own and, accordingly, may invest in asset classes similar to those targeted by us. As a result, the Investment Adviser may face conflicts in allocating investment opportunities among us and such other entities. Although the Investment Adviser will endeavor to allocate investment opportunities in a fair and equitable manner, it is possible that, in the future, we may not be given the opportunity to participate in investments made by investment funds managed by the Investment Adviser or its affiliates. In any such case, when the Investment Adviser identifies an investment, it will choose which investment fund should receive the allocation. See “Risk Factors—Risks Relating to our Business and Structure—There are significant potential conflicts of interest which could impact our investment returns” for more information.
We may invest, to the extent permitted by law, in the securities and instruments of other investment companies and companies that would be investment companies but are excluded from the definition of an investment company provided in Section 3(c) of the 1940 Act. We may also co-invest in the future on a concurrent basis with our affiliates, subject to compliance with applicable regulations and our trade allocation procedures. Some types of negotiated co-investments may be made only if we receive an order from the SEC permitting us to do so. We have sought, and there can be no assurance that we will obtain, such an order.
6
Table of Contents
Investment Management Agreement
We have entered into an agreement with the Investment Adviser, or the Investment Management Agreement, under which the Investment Adviser, subject to the overall supervision of our board of directors, manages the day-to-day operations of, and provides investment advisory services to, us. Mr. Penn, our Chairman and Chief Executive Officer, is the managing member and a senior investment professional of, and has a financial and controlling interest in, PennantPark Investment Advisers. PennantPark Investment, through the Investment Adviser, provides similar services to our SBIC Funds under their investment management agreements. Such investment management agreements do not affect the management or incentive fees that we pay to the Investment Adviser on a consolidated basis. Under the terms of our Investment Management Agreement, the Investment Adviser:
| • | determines the composition of our portfolio, the nature and timing of the changes to our portfolio and the manner of implementing such changes; |
| • | identifies, evaluates and negotiates the structure of the investments we make (including performing due diligence on our prospective portfolio companies); |
| • | closes and monitors the investments we make; and |
| • | provides us with such other investment advisory; research and related services as we may need from time to time. |
PennantPark Investment Advisers’ services under our Investment Management Agreement are not exclusive, and it is free to furnish similar services, without the prior approval of our stockholders or our board of directors, to other entities so long as its services to us are not impaired. Our board of directors monitors for any potential conflicts that may arise upon such a development. For providing these services, the Investment Adviser receives a fee from PennantPark Investment, consisting of two components—a base management fee and an incentive fee, or collectively, Management Fees.
Investment Advisory Fees
The base management fee is calculated at an annual rate of 2.00% of our gross assets (net of U.S. Treasury Bills, temporary draws under any credit facility and/or repurchase agreements or other balance sheet transactions undertaken at the end of a fiscal quarter for purposes of preserving investment flexibility for the next quarter, or “average adjusted gross assets,” if any (see example below)) and is payable quarterly in arrears. The base management fee is calculated based on the average value of our average adjusted gross total assets at the end of the two most recently completed calendar quarters, and appropriately adjusted for any share issuances or repurchases during the current calendar quarter. For example, if we sold shares on the 45th day of a quarter and did not use the proceeds from the sale to repay outstanding indebtedness, our gross assets for such quarter would give effect to the net proceeds of the issuance for only 45 days of the quarter during which the additional shares were outstanding. For the fiscal years ended September 30, 2013, 2012 and 2011, the Investment Adviser earned base management fees of $21.3 million, $17.5 million and $14.9 million, respectively, from us.
The following is a hypothetical example of the calculation of average adjusted gross assets:
Gross assets as of December 31, 20XX = $160 million
U.S. Treasury bills and temporary draws on credit facilities as of December 31, 20 XX = $10 million
Adjusted gross assets as of December 31, 20 XX = $150 million
Gross assets as of March 31, 20 XX = $200 million
U.S. Treasury bills and temporary draws on credit facilities as of March 31, 20 XX = $20 million
Adjusted gross assets as of March 31, 20XX = $180 million
Average value of adjusted gross assets as of March 31, 20XX at the end of the two most recently completed calendar quarters, and appropriately adjusted for any share issuances or repurchases during the current calendar quarter = ($150 million + $180 million) / 2 = $165 million
The incentive fee has two parts, as follows:
One part is calculated and payable quarterly in arrears based on our Pre-Incentive Fee Net Investment Income for the immediately preceding calendar quarter. For this purpose, Pre-Incentive Fee Net Investment Income means interest income, dividend income and any other income, including any other fees, other than fees for providing managerial assistance, such as commitment, origination, prepayment penalties, structuring, diligence and consulting fees or other fees received from portfolio companies accrued during the calendar quarter, minus our operating expenses for the quarter (including the base management fee, expenses payable under our Administration Agreement (as defined below), and any interest expense and distributions paid on any issued and outstanding preferred stock, but excluding the incentive fee). Pre-Incentive Fee Net Investment Income includes, in the case of investments with a deferred interest feature (such as original issue discount, or OID, debt instruments with PIK interest and zero coupon securities), accrued income that we have not yet received in cash. Pre-Incentive Fee Net Investment Income does not include any realized capital gains, computed net of realized capital losses or unrealized capital appreciation or depreciation. Pre-Incentive Fee Net Investment Income, expressed as a percentage of the value of our net assets at the end of the immediately preceding calendar quarter, is compared to a hurdle of 1.75% per quarter (7.00% annualized). We pay our Investment Adviser an incentive fee with respect to our Pre-Incentive Fee Net Investment Income in each calendar quarter as follows: (1) no incentive fee in any calendar quarter in which PennantPark Investment’s Pre-Incentive Fee Net Income does not exceed the hurdle rate of 1.75%, (2) 100% of our Pre-Incentive Fee Net Investment Income with respect to that portion of such Pre-Incentive Fee Net Investment Income, if any, that exceeds the hurdle but is less than 2.1875% in any calendar quarter (8.75% annualized) (we refer to this portion of our Pre-Incentive Fee Net Investment Income (which exceeds the hurdle but is less than 2.1875%) as the “catch-up,” which is meant to provide our Investment Adviser with 20% of our Pre-Incentive Fee Net Investment Income, as if a hurdle did not apply, if this net investment income exceeds 2.1875% in any calendar quarter), and (3) 20% of the amount of our Pre-Incentive Fee Net Investment Income, if any, that exceeds 2.1875% in any calendar quarter (8.75% annualized), once the hurdle is reached and the catch-up is achieved, 20% of all Pre-Incentive Fee Investment Income thereafter is allocated to our Investment Adviser. These calculations are prorated for any share issuances or repurchases, if applicable. For the fiscal years ended September 30, 2013, 2012 and 2011, the Investment Adviser earned $16.8 million, $14.2 million and $13.2 million, respectively, in incentive fees on net investment income from us.
The following is a graphical representation of the calculation of quarterly incentive fee based on Pre-Incentive Fee Net Investment Income:
Pre-Incentive Fee Net Investment Income
(expressed as a percentage of the value of net assets)

Percentage of Pre-Incentive Fee Net Investment Income
allocated to income-related portion of incentive fee
7
Table of Contents
The second part of the incentive fee is determined and payable in arrears as of the end of each calendar year (or upon termination of the Investment Management Agreement, as of the termination date) and equals 20.0% of our realized capital gains, if any, on a cumulative basis from inception through the end of each calendar year, computed net of all realized capital losses and unrealized capital depreciation on a cumulative basis, less the aggregate amount of any previously paid capital gain incentive fees. For the fiscal years ended September 30, 2013, 2012 and 2011 the Investment Adviser did not earn an incentive fee on capital gains as calculated under the Investment Management Agreement (as described above).
Under U.S. generally accepted accounting principles, or GAAP, we are required to accrue a capital gains incentive fee based upon net realized capital gains and net unrealized capital appreciation and depreciation on investments held at the end of each period. In calculating the capital gains incentive fee accrual, we considered the cumulative aggregate unrealized capital appreciation in the calculation, as a capital gains incentive fee would be payable if such unrealized capital appreciation were realized, even though such unrealized capital appreciation is not permitted to be considered in calculating the fee actually payable under the Investment Management Agreement. This accrual is calculated using the aggregate cumulative realized capital gains and losses and aggregate cumulative unrealized capital appreciation or depreciation. If such amount is positive at the end of a period, then we record a capital gains incentive fee equal to 20% of such amount, less the aggregate amount of actual capital gains related incentive fees paid in all prior years. If such amount is negative, then there is no accrual for such year. There can be no assurance that such unrealized capital appreciation will be realized in the future. For the years ended September 30, 2013, 2012 and 2011, our unrealized and realized capital gains did not exceed our cumulative realized and unrealized losses and therefore resulted in no accrual for capital gains incentive fees under GAAP.
Examples of Quarterly Incentive Fee Calculation
Example 1: Income Related Portion of Incentive Fee (*):
Alternative 1:
Assumptions
Investment income (including interest, distributions, fees, etc.) = 1.25%
Hurdle(1) = 1.75%
Base management fee(2) = 0.50%
Other expenses (legal, accounting, custodian, transfer agent, etc.) = 0.20%
Pre-Incentive Fee Net Investment Income
(investment income—(base management fee + other expenses)) = 0.55%
Pre-Incentive Fee Net Investment Income does not exceed the hurdle; therefore there is no incentive fee.
Alternative 2:
Assumptions
Investment income (including interest, distributions, fees, etc.) = 2.70%
Hurdle(1) = 1.75%
Base management fee(2) = 0.50%
Other expenses (legal, accounting, custodian, transfer agent, etc.) = 0.20%
Pre-Incentive Fee Net Investment Income
(investment income—(base management fee + other expenses)) = 2.00%
| Incentive fee | = 20% x Pre-Incentive Fee Net Investment Income, subject to “catch-up” |
| = 2.00% - 1.75% |
| = 0.25% |
| = 100% x 0.25% |
| = 0.25% |
Alternative 3:
Assumptions
Investment income (including interest, distributions, fees, etc.) = 3.00%
Hurdle(1) = 1.75%
Base management fee(2) = 0.50%
Other expenses (legal, accounting, custodian, transfer agent, etc.) = 0.20%
Pre-Incentive Fee Net Investment Income
(investment income—(base management fee + other expenses)) = 2.30%
| Incentive fee | = 20% x Pre-Incentive Fee Net Investment Income, subject to “catch-up” |
| Incentive fee | = 100% x “catch-up” + (20% x (Pre-Incentive Fee Net Investment Income - 2.1875%)) |
| Catch-up | = 2.1875%—1.75% |
| = 0.4375% |
| = (100% x 0.4375%) + (20% x (2.30% -2.1875%)) |
| = 0.4375% + (20% x 0.1125%) |
| = 0.4375% + 0.0225% |
| = 0.46% |
Example 2: Capital Gains Portion of Incentive Fee:
Assumptions
Year 1 = no net realized capital gains or losses
Year 2 = 6% realized capital gains and 1% realized capital losses and unrealized capital depreciation, capital gain incentive fee = 20% x (realized capital gains for year computed net of all realized capital losses and unrealized capital depreciation at year end)
| Year 1 incentive fee | = 20% x (0) |
| = 0 |
| = no incentive fee |
| Year 2 incentive fee | = 20% x (6% - 1%) |
| = 20% x 5% |
| = 1% |
| * | The hypothetical amount of Pre-Incentive Fee Net Investment Income shown is based on a percentage of net assets. |
| (1) | Represents 7.0% annualized hurdle. |
| (2) | Represents 2.0% annualized base management fee. |
8
Table of Contents
Duration and Termination of Investment Management Agreement
The Investment Management Agreement was re-approved by our board of directors, including a majority of our directors who are not interested persons of us or the Investment Adviser, in February 2013. Unless terminated earlier as described below, the Investment Management Agreement will continue in effect for a period of one year through February 2014. It will remain in effect if approved annually by our board of directors, or by the affirmative vote of the holders of a majority of our outstanding voting securities, including, in either case, approval by a majority of our directors who are not interested persons of us or the Investment Adviser. In determining to re-approve the Investment Management Agreement, our board of directors requested information from the Investment Adviser that enabled it to evaluate a number of factors relevant to its determination. These factors included the nature, quality and extent of services performed by the Investment Adviser, our ability to manage conflicts of interest effectively, our short and long-term performance, our costs, including as compared to comparable externally and internally managed publicly traded BDCs that engage in similar investing activities, our profitability and any economies of scale. Based on the information reviewed and the considerations detailed above, our board of directors, including all of our directors who are not interested persons of us or the Investment Adviser, concluded that the investment advisory fee rates and terms are fair and reasonable in relation to the services provided and re-approved the Investment Management Agreement as being in the best interests of our stockholders.
The Investment Management Agreement will automatically terminate in the event of its assignment. The Investment Management Agreement may be terminated by either party without penalty upon not more than 60 days’ written notice to the other. See “Risk Factors—Risks Relating to our Business and Structure—We are dependent upon our Investment Adviser’s key personnel for our future success, and if our Investment Adviser is unable to hire and retain qualified personnel or if our Investment Adviser loses any member of its management team, our ability to achieve our investment objectives could be significantly harmed” for more information.
Organization of the Investment Adviser
PennantPark Investment Advisers is a registered investment adviser under the Investment Advisers Act of 1940, as amended, or the Advisers Act. The principal executive office of PennantPark Investment Advisers is located at 590 Madison Avenue, 15th Floor, New York, NY 10022.
Administration Agreement
We have entered into an agreement, or the Administration Agreement, with the Administrator, under which the Administrator furnishes us with office facilities, equipment and bookkeeping and clerical services. Under our Administration Agreement, the Administrator performs, or oversees the performance of, our required administrative services, which include amongst other things being responsible for the financial records we are required to maintain and preparing reports to our stockholders. PennantPark Investment, through the Administrator, provides similar services to our SBIC Funds under their administration agreements with us. For providing these services, facilities and personnel, PennantPark Investment reimburses the Administrator for PennantPark Investment’s allocable portion of overhead and other expenses incurred by the Administrator in performing its obligations under the Administration Agreement, including rent, technology systems, insurance and PennantPark Investment’s allocable portion of the cost of the compensation and related expenses for our Chief Compliance Officer, Chief Financial Officer and their respective staffs. The Administrator also offers on PennantPark Investment’s behalf managerial assistance to portfolio companies to which PennantPark Investment is required to offer such assistance. To the extent that our Administrator outsources any of its functions, we will pay the fees associated with such functions on a direct basis without profit to the Administrator. Reimbursement for certain of these costs is included in administrative services expenses in the Consolidated Statement of Operations. For the fiscal years ended September 30, 2013, 2012 and 2011, the Investment Adviser and Administrator, collectively, were reimbursed $2.9 million, $3.6 million and $2.6 million, respectively, from us, including expenses it incurred on behalf of the Administrator for the services described above.
PennantPark Investment entered into an administration agreement with its controlled affiliate, SuttonPark Holdings, Inc. and its subsidiaries, or SPH. Under the administration agreement with SPH, or the SPH Administration Agreement, PennantPark Investment, through the Administrator, furnishes SPH with office facilities, equipment and clerical, bookkeeping and record keeping services at such facilities. Additionally, the Administrator performs or oversees the performance of SPH’s required administrative services, which include, among other duties, maintaining financial records, preparing financial reports and filing of tax returns. Payments under the SPH Administration Agreement are equal to an amount based upon SPH’s allocable portion of the Administrator’s overhead in performing its obligations under the SPH Administration Agreement, including rent and allocable portion of the cost of compensation and related expenses of our Chief Financial Officer and his respective staff. For the fiscal years ended September 30, 2013, 2012 and 2011, PennantPark Investment was reimbursed $0.4 million, $0.7 million and $0.5 million, respectively, from SPH, including expenses it incurred on behalf of the Administrator for the services described above.
Duration and Termination of Administration Agreement
The Administration Agreement was re-approved by our board of directors, including a majority of our directors who are not interested persons of PennantPark Investment, in February 2013. Unless terminated earlier as described below, our Administration Agreement will continue in effect for a period of one year through February 2014. It will remain in effect if approved annually by our board of directors, or by the affirmative vote of the holders of a majority of our outstanding voting securities, including, in either case, approval by a majority of our directors who are not interested persons of us. The Administration Agreement may not be assigned by either party without the consent of the other party. The Administration Agreement may be terminated by either party upon not more than 60 days’ written notice to the other.
Indemnification
Our Investment Management Agreement and Administration Agreement provide that, absent willful misfeasance, bad faith or gross negligence in the performance of their duties or by reason of the reckless disregard of their duties and obligations, PennantPark Investment Advisers and PennantPark Investment Administration and their officers, manager, partners, agents, employees, controlling persons, members and any other person or entity affiliated with them are entitled to indemnification from PennantPark Investment for any damages, liabilities, costs and expenses (including reasonable attorneys’ fees and amounts reasonably paid in settlement) arising from the rendering of PennantPark Investment Advisers’ and PennantPark Investment Administration’s services under our Investment Management Agreement or Administration Agreement or otherwise as Investment Adviser or Administrator for us.
License Agreement
We have entered into a license agreement, or the License Agreement, with PennantPark Investment Advisers pursuant to which PennantPark Investment Advisers has granted us a royalty-free, non-exclusive license to use the name “PennantPark.” Under this agreement, we have a right to use the PennantPark name, for so long as PennantPark Investment Advisers or one of its affiliates remains our Investment Adviser. Other than with respect to this limited license, we have no legal right to the “PennantPark” name.
REGULATION
Regulated Investment Company and Business Development Company Regulations
We are a BDC under the 1940 Act, which has qualified and intends to continue to qualify to maintain an election to be treated as a RIC under Subchapter M of the Code. The 1940 Act contains prohibitions and restrictions relating to transactions between a BDC and its affiliates (including any investment advisers or sub-advisers), principal underwriters and affiliates of those affiliates or underwriters and requires that a majority of the directors be persons other than “interested persons,” as that term is defined in the 1940 Act. In addition, the 1940 Act provides that we may not change the nature of our business so as to cease to be, or to withdraw our election as, a BDC unless approved by holders of a majority of our outstanding voting securities.
9
Table of Contents
We may invest up to 100% of our assets in securities acquired directly from issuers in privately negotiated transactions. With respect to such securities, we may, for the purpose of public resale, be deemed an “underwriter” as that term is defined in the Securities Act of 1933, as amended, or the Securities Act. We may purchase or otherwise receive warrants to purchase the common stock of our portfolio companies in connection with acquisition financing or other investments. Similarly, in connection with an acquisition, we may acquire rights to require the issuers of acquired securities or their affiliates to repurchase them under certain circumstances. We do not intend to acquire securities issued by any investment company that exceed the limits imposed by the 1940 Act. Under these limits, we generally cannot acquire more than 3% of the voting stock of any investment company, invest more than 5% of the value of our total assets in the securities of one investment company or invest more than 10% of the value of our total assets in the securities of more than one investment company. With regard to that portion of our portfolio invested in securities issued by investment companies, it should be noted that such investments might subject our stockholders to additional expenses. We may enter into hedging transactions to manage the risks associated with interest rate fluctuations. None of these policies are fundamental and they may be changed without stockholder approval.
Qualifying Assets
Under the 1940 Act, a BDC may not acquire any asset other than assets of the type listed in Section 55(a) of the 1940 Act, which are referred to as qualifying assets, unless, at the time the acquisition is made, qualifying assets represent at least 70% of the BDC’s total assets. The principal categories of qualifying assets relevant to our business are the following:
| (1) | Securities purchased in transactions not involving any public offering from the issuer of such securities, which issuer (subject to certain limited exceptions) is an eligible portfolio company, or from any person who is, or has been during the preceding 13 months, an affiliated person of an eligible portfolio company, or from any other person, subject to such rules as may be prescribed by the SEC. An eligible portfolio company is defined under the 1940 Act to include any issuer which: |
| (a) | is organized under the laws of, and has its principal place of business in, the United States |
| (b) | is not an investment company (other than a small business investment company wholly-owned by the BDC) or a company that would be an investment company but is excluded from the definition of an investment company by Section 3(c) of the 1940 Act; and |
| (c) | satisfies any of the following: |
| (i) | does not have any class of securities listed on a national securities exchange; |
| (ii) | has any class of securities listed on a national securities exchange subject to a maximum market capitalization of $250.0 million; or |
| (iii) | is controlled by a BDC, either alone or as part of a group acting together, and such BDC in fact exercises a controlling influence over the management or policies of such eligible portfolio company and, as a result of such control, has an affiliated person who is a director of such eligible portfolio company. |
| (2) | Securities of any eligible portfolio company which we control. |
| (3) | Securities purchased in a private transaction from a U.S. operating company or from an affiliated person of the issuer, or in transactions incidental thereto, if such issuer is in bankruptcy and subject to reorganization or if the issuer, immediately prior to the purchase of its securities was unable to meet its obligations as they came due without material assistance other than conventional lending or financing arrangements |
| (4) | Securities of an eligible portfolio company purchased from any person in a private transaction if there is no ready market for such securities and we already own 60% of the outstanding equity of the eligible portfolio company. |
| (5) | Securities received in exchange for or distributed on or with respect to securities described in (1) through (4) above, or pursuant to the exercise of warrants or rights relating to such securities. |
| (6) | Cash, cash equivalents, U.S. Government securities or high-quality debt securities maturing in one year or less from the time of investment. |
In addition, a BDC must have been organized and have its principal place of business in the United States and must be operated for the purpose of making investments in the types of securities described in (1), (2) or (3) above.
Managerial Assistance to Portfolio Companies
As a BDC, we are required to make available managerial assistance to our portfolio companies that constitute a qualifying asset within the meaning of Section 55 of the 1940 Act. However, if a BDC purchases securities in conjunction with one or more other persons acting together, one of the other persons in the group may make available such managerial assistance. Making available managerial assistance means any arrangement whereby the BDC, through its directors, officers or employees, offers to provide, and, if accepted, does provide, significant guidance and counsel concerning the management, operations or business objectives and policies of a portfolio company. Our Administrator may provide such assistance on our behalf to portfolio companies that request such assistance. Officers of our Investment Adviser and Administrator provide assistance to our controlled affiliates.
Temporary Investments
Pending investments in other types of qualifying assets, as described above, may consist of cash, cash equivalents, U.S. Government securities or high-quality debt securities maturing in one year or less from the time of investment, which we refer to, collectively, as temporary investments, so that 70% of our assets are qualifying assets. We may invest in U.S. Treasury bills or in repurchase agreements, provided that such agreements are fully collateralized by cash or securities issued by the U.S. Government or its agencies. A repurchase agreement involves the purchase by an investor, such as us, of a specified security and the simultaneous agreement by the seller to repurchase it at an agreed-upon future date and at a price which is greater than the purchase price by an amount that reflects an agreed-upon interest rate. There is no percentage restriction on the proportion of our assets that may be invested in such repurchase agreements. However, if more than 25% of our total assets constitute repurchase agreements from a single counterparty, we would not meet the Diversification Tests, as defined below under “Regulation—Election to be Taxed as a RIC,” in order to qualify as a RIC for federal income tax purposes. Thus, we do not intend to enter into repurchase agreements with a single counterparty in excess of this limit. Our Investment Adviser will monitor the creditworthiness of the counterparties with which we enter into repurchase agreement transactions.
10
Table of Contents
Senior Securities
We are permitted, under specified conditions, to issue multiple classes of indebtedness and one class of stock senior to our common stock if our asset coverage, as defined in the 1940 Act, is compliant with the 1940 Act, immediately after each such issuance. In addition, while any senior securities remain outstanding, we must make provisions to prohibit any distribution to our stockholders or the repurchase of such securities or shares unless we meet the applicable asset coverage requirement at the time of the distribution or repurchase. We may also borrow amounts up to 5% of the value of our total assets for temporary or emergency purposes without regard to our asset coverage ratio. We received exemptive relief from the SEC allowing us to modify the asset coverage requirement to exclude the SBA debentures from the calculation. For a discussion of the risks associated with leverage, see “Risk Factors—Risks Relating to our Business and Structure—Regulations governing our operation as a business development company will affect our ability to, and the way in which we, raise additional capital” for more information.
Joint Code of Ethics and Code of Conduct
We and PennantPark Investment Advisers have adopted a joint code of ethics pursuant to Rule 17j-1 under the 1940 Act and a code of conduct that establish procedures for personal investments and restricts certain personal securities transactions. Personnel subject to each code may invest in securities for their personal investment accounts, including securities that may be purchased or held by us, so long as such investments are made in accordance with the codes’ requirements. Our joint code of ethics and code of conduct are available, free of charge, on our website at www.pennantpark.com. You may read and copy the code of ethics at the SEC’s Public Reference Room in Washington, D.C. You may obtain information on the operation of the Public Reference Room by calling the SEC at (202) 551-8090. In addition, the joint code of ethics is attached as an exhibit to this Report and is available on the EDGAR Database on the SEC’s Internet site at www.sec.gov. You may also obtain a copy of our joint code of ethics, after paying a duplicating fee, by electronic request at the following email address: publicinfo@sec.gov , or by writing the SEC’s Public Reference Section, 100 F Street, N.E., Washington, D.C. 20549.
Proxy Voting Policies and Procedures
We have delegated our proxy voting responsibility to our Investment Adviser. The Proxy Voting Policies and Procedures of our Investment Adviser are set forth below. The guidelines are reviewed periodically by our Investment Adviser and our non-interested directors, and, accordingly, are subject to change. For purposes of these Proxy Voting Policies and Procedures described below, “we,” “our” and “us” refers to our Investment Adviser.
Introduction
As an investment adviser registered under the Advisers Act, we have a fiduciary duty to act solely in the best interests of our clients. As part of this duty, we recognize that we must vote client securities in a timely manner free of conflicts of interest and in the best interests of our clients.
These policies and procedures for voting proxies for our investment advisory clients are intended to comply with Section 206 of, and Rule 206(4)-6 under, the Advisers Act.
Proxy Policies
We vote proxies relating to PennantPark Investment’s portfolio securities in what we perceive to be the best interests of PennantPark Investment’s stockholders. We review on a case-by-case basis each proposal submitted to a stockholder vote to determine its impact on the portfolio securities held by our clients. Although we will generally vote against proposals that may have a negative impact on our clients’ portfolio securities, we may vote for such a proposal if there exists compelling long-term reasons to do so.
Our proxy voting decisions are made by the senior officers who are responsible for monitoring each of our clients’ investments. To ensure that our vote is not the product of a conflict of interest, we require that: (1) anyone involved in the decision making process disclose to our Chief Compliance Officer any potential conflict that he or she is aware of and any contact that he or she has had with any interested party regarding a proxy vote; and (2) employees involved in the decision making process or vote administration are prohibited from revealing how we intend to vote on a proposal in order to reduce any attempted influence from interested parties.
Proxy Voting Records
You may obtain information about how we voted proxies, free of charge, by calling us collect at (212) 905-1000 or by making a written request for proxy voting information to: Aviv Efrat, Chief Financial Officer and Treasurer, 590 Madison Avenue, 15th Floor, New York, New York 10022.
Privacy Protection Principles
We are committed to maintaining the privacy of our stockholders and to safeguarding their non-public personal information. The following information is provided to help you understand what personal information we collect, how we protect that information and why, in certain cases, we may share information with select other parties.
Generally, we do not receive any non-public personal information relating to our stockholders, although certain non-public personal information of our stockholders may become available to us. We do not disclose any non-public personal information about our stockholders or former stockholders to anyone, except as permitted by law or as is necessary in order to service stockholder accounts (for example, to a transfer agent or third party administrator).
We restrict access to non-public personal information about our stockholders to employees of our Investment Adviser and its affiliates with a legitimate business need for the information. We maintain physical, electronic and procedural safeguards designed to protect the non-public personal information of our stockholders.
Our privacy protection policies are available, free of charge, on our website at www.pennantpark.com. In addition, the privacy policy is available on the EDGAR Database on the SEC’s Internet site at www.sec.gov, filed as an exhibit to our annual report on Form 10-K (File No. 814-00736, filed on November 16, 2011). You may also obtain copies of our privacy policy, after paying a duplicating fee, by electronic request at the following email address: publicinfo@sec.gov, or by writing the SEC’s Public Reference Section, 100 F Street, N.E., Washington, D.C. 20549.
Other
We may also be prohibited under the 1940 Act from knowingly participating in certain transactions with our affiliates without the prior approval of our board of directors, including a majority of our directors who are not interested persons of us, and, in some cases, prior approval by the SEC.
We will be periodically examined by the SEC and SBA for compliance with the 1940 Act and 1958 Act, respectively.
We are required by law to provide and maintain a bond issued by a reputable fidelity insurance company to protect us against larceny and embezzlement. Furthermore, as a BDC, we are prohibited from protecting any director or officer against any liability to PennantPark Investment or our stockholders arising from willful misfeasance, bad faith, gross negligence or reckless disregard of the duties involved in the conduct of such person’s office.
11
Table of Contents
We and PennantPark Investment Advisers have each adopted and implemented written policies and procedures reasonably designed to prevent violation of the federal securities laws. We review these policies and procedures annually for their adequacy and the effectiveness of their implementation, and we designate a Chief Compliance Officer to be responsible for administering the policies and procedures.
Sarbanes-Oxley Act of 2002
The Sarbanes-Oxley Act of 2002, or the Sarbanes-Oxley Act, imposes several regulatory requirements on publicly held companies and their insiders. Many of these requirements affect us.
For example:
| • | pursuant to Rule 13a-14 of the Securities Exchange Act of 1934, as amended, or the Exchange Act, our Chief Executive Officer and Chief Financial Officer must certify the accuracy of the financial statements contained in our periodic reports; |
| • | pursuant to Item 307 of Regulation S-K, our periodic reports must disclose our conclusions about the effectiveness of our disclosure controls and procedures; |
| • | pursuant to Rule 13a-15 of the Exchange Act, our management must prepare an annual report regarding its assessment of our internal controls over financial reporting; and |
| • | pursuant to Item 308 of Regulation S-K and Rule 13a-15 of the Exchange Act, our periodic reports must disclose whether there were significant changes in our internal controls over financial reporting or in other factors that could significantly affect these controls subsequent to the date of their evaluation, including any corrective actions with regard to significant deficiencies and material weaknesses. |
The Sarbanes-Oxley Act requires us to review our current policies and procedures to determine whether we comply with the Sarbanes-Oxley Act and the regulations promulgated there-under. We continue to monitor our compliance with all regulations that are adopted under the Sarbanes-Oxley Act and continue to take actions necessary to ensure that we are in compliance with that act.
Election to be Taxed as a RIC
We have elected to be taxed, and intend to qualify annually to maintain our election to be taxed, as a RIC under Subchapter M of the Code. To maintain our RIC tax election, we must, among other requirements, meet certain source-of-income and quarterly asset diversification requirements (as described below). We also must annually distribute at least 90% of the sum of our ordinary income and realized net short-term capital gains in excess of realized net long-term capital losses, if any, out of the assets legally available for distribution, or the Annual Distribution Requirement. Although not required for us to maintain our RIC tax status, in order to preclude the imposition of a 4% nondeductible federal excise tax imposed on RICs, we must distribute during each calendar year an amount at least equal to the sum of (1) 98% of our net ordinary income for the calendar year, (2) 98.2% of the sum of our realized net capital gains for the one-year period ending on October 31 of the calendar year and (3) the sum of any net ordinary income plus net capital gains and net ordinary gains for preceding years that were not distributed during such years, or the Excise Tax Avoidance Requirement. In addition, although we may distribute realized net capital gains (i.e., net long-term capital gains in excess of short-term capital losses), if any, at least annually, out of the assets legally available for such distributions in the manner described above, we have retained and may continue to retain such net capital gains or ordinary income to provide us with additional liquidity.
In order to qualify as a RIC for federal income tax purposes, we must:
| • | maintain an election to be treated as a BDC under the 1940 Act at all times during each taxable year |
| • | derive in each taxable year at least 90% of our gross income from dividends, interest, payments with respect to certain securities loans, gains from the sale of stock or other securities, net income from certain qualified publicly traded partnerships or other income derived with respect to our business of investing in such stock or securities, or the 90% Income Test; and |
| • | diversify our holdings, or the Diversification Tests, so that at the end of each quarter of the taxable year: |
| 1) | at least 50% of the value of our assets consists of cash, cash equivalents, U.S. Government securities, securities of other RICs, and other securities if such other securities of any one issuer neither represents more than 5% of the value of our assets nor more than 10% of the outstanding voting securities of the issuer; and |
| 2) | no more than 25% of the value of our assets is invested in the securities, other than U.S. Government securities or securities of other RICs, of one issuer or of two or more issuers that are controlled, as determined under applicable tax rules, by us and that are engaged in the same or similar or related trades or businesses or in certain qualified publicly traded partnerships. |
Taxation as a RIC
If we qualify as a RIC, and satisfy the Annual Distribution Requirement, then we will not be subject to federal income tax on the portion of our investment company taxable income and net capital gain (i.e., realized net long-term capital gains in excess of realized net short-term capital losses) we distribute to stockholders. We will be subject to U.S. federal income tax at the regular corporate rates on any income or capital gain not distributed (or deemed distributed) to our stockholders.
We may be required to recognize taxable income in circumstances in which we do not receive cash. For example, if we hold debt obligations that are treated under applicable tax rules as having OID (such as debt instruments with PIK interest or, in certain cases, increasing interest rates or issued with warrants), we must include in income each year a portion of the OID that accrues over the life of the obligation, regardless of whether cash representing such income is received by us in the same taxable year. Because any OID accrued will be included in our investment company taxable income in the year of accrual, we may be required to make a distribution to our stockholders in order to satisfy the Annual Distribution Requirement, even though we will not have received any corresponding cash amount.
Gain or loss realized by us from warrants acquired by us as well as any loss attributable to the lapse of such warrants generally will be treated as capital gain or loss. Such gain or loss generally will be long-term or short-term, depending on how long we held a particular warrant.
Although we do not presently expect to do so, we are authorized to borrow funds and to sell assets in order to satisfy distribution requirements. However, under the 1940 Act, we are not permitted to make distributions to our stockholders while our debt obligations and other senior securities are outstanding unless certain asset coverage requirements are met. Moreover, our ability to dispose of assets to meet our distribution requirements may be limited by (1) the illiquid nature of our portfolio and/or (2) other requirements relating to our status as a RIC, including the Diversification Tests. If we dispose of assets in order to meet the Annual Distribution Requirement or the Excise Tax Avoidance Requirement, we may make such dispositions at times that, from an investment standpoint, are not advantageous.
12
Table of Contents
We may distribute our common stock as a dividend of our taxable income and a stockholder could receive a portion of the distributions declared and distributed by us in shares of our common stock with the remaining amount in cash. A stockholder will be considered to have recognized dividend income equal to the fair market value of the stock paid by us plus cash received with respect to such dividend. The total dividend declared would be taxable income to a stockholder even though he or she may only receive a relatively small portion of the dividend in cash to pay any taxes due on the dividend. We have not elected to distribute stock as a dividend but reserve the right to do so.
Failure to Qualify as a RIC
If we fail to satisfy the Annual Distribution Requirement or fail to qualify as a RIC in any taxable year, unless certain cure provisions apply, we will be subject to tax in that year on all of our taxable income, regardless of whether we make any distributions to our stockholders. In that case, all of our income will be subject to corporate-level federal income tax, reducing the amount available to be distributed to our stockholders. In contrast, assuming we qualify as a RIC, our corporate-level federal income tax should be substantially reduced or eliminated. See “Election to be Taxed as a RIC” above for more information.
If we are unable to maintain our status as a RIC, we would be subject to tax on all of our taxable income at regular corporate rates. We would not be able to deduct distributions to stockholders, nor would distributions be required to be made. Distributions would generally be taxable to our stockholders as ordinary distribution income eligible for a preferential maximum rate to the extent of our current and accumulated earnings and profits. Subject to certain limitations under the Code, distributions paid by us to corporate stockholders would be eligible for the dividends received deduction. Distributions in excess of our current and accumulated earnings and profits would be treated first as a return of capital to the extent of the stockholder’s tax basis in our common stock, and any remaining distributions would be treated as a capital gain.
SBA Regulations
Both SBIC LP and SBIC II are licensed under the SBA as SBICs, under Section 301(c) of the 1958 Act. SBIC LP and SBIC II received their licenses in July 2010 and January 2013, respectively.
SBICs are designed to stimulate the flow of capital to businesses that meet specified eligibility requirements discussed below. Under SBA regulations, our SBIC Funds are subject to regulatory requirements including making investments in SBA eligible businesses, investing at least 25% of regulatory capital in eligible smaller businesses, placing certain limitations on the financing terms of investments, prohibiting investing in certain industries, and required capitalization thresholds among other regulations. Furthermore, our SBIC Funds are subject to periodic audits and examinations of their financial statements that are prepared on a basis of accounting other than GAAP pursuant to SBA accounting standards and financial reporting requirements for SBICs. For example, SBIC LP does not use fair value accounting on its assets or liabilities under SBA valuation guidelines. If either of our SBIC Funds fails to comply with applicable SBA regulations, the SBA could, depending on the severity of the violation, limit or prohibit use of debentures, declare outstanding debentures immediately due and payable, and/or limit our SBIC Funds from making new investments. In addition, the SBA can revoke or suspend a license for willful or repeated violation of, or willful or repeated failure to observe, any provision of the 1958 Act or any rule or regulation promulgated thereunder. These actions by the SBA would, in turn, negatively affect us because our SBIC Funds are our wholly owned subsidiaries.
Eligible Small and Smaller Businesses
Under present SBA regulations, eligible small business include businesses that (together with their affiliates) have tangible net worth not exceeding $18.0 million and have average annual net income of $6.0 million for the two most recent fiscal years. In addition, each of our SBIC Funds must invest at least 25% of investments in “smaller” concerns. A smaller concern is a business that has tangible net worth not exceeding $6.0 million and has average annual net income not exceeding $2.0 million for the two most recent fiscal years or, as an alternative to the aforementioned requirement, meet the size requirements based on either the number of employees or gross revenue, which is based on the industry in which the smaller concern operates. Once an SBIC has invested in a company, it may continue to make follow-on investments in the company, regardless of the size of the business, up and until the time a business offers its securities in a public market.
Financing Limitations, Terms and Changes in Control
The SBA prohibits an SBIC from financing small businesses in certain industries such as relending, gambling, oil and gas exploration and other passive businesses. Additional SBA prohibitions include investing outside the United States, investing more than 20% of regulatory capital in one company and lending money to any officer, director or employee or to invest in any affiliate thereof. The SBA places certain limits on the financing terms of investments by our SBIC Funds in portfolio companies such as limiting the interest rate on debt securities and loans provided to portfolio companies. The SBA also limits fees, prepayment terms and other economic arrangements that are typically charged in lending arrangements.
The SBA also prohibits, without prior written approval, a “change in control” of our SBIC Funds or transfers that would result in any person or group owning 10% or more of a class of capital stock (or its equivalent in the case of a partnership) of a licensed SBIC. A “change of control” is any event which would result in the transfer of power, direct or indirect, to direct management and policies of an SBIC, whether through ownership, contractual arrangements or otherwise.
Idle Funds Limitation
The SBA limits an SBIC from investing idle funds to the following types of securities:
| • | direct obligations of, or obligations guaranteed as to principal and interest by, the United States government, which mature within 15 months from the date of the investment; |
| • | repurchase agreements with federally insured institutions with a maturity of seven days or less (and the securities underlying the repurchase obligations must be direct obligations of or guaranteed by the federal government); |
| • | certificates of deposit with a maturity of one year or less, issued by a federally insured institution; or |
| • | a deposit account in a federally insured institution that is subject to withdrawal restriction of one year or less; |
SBA Leverage or Debentures
SBA-guaranteed debentures are non-recourse to us, have a 10-year maturity, and may be prepaid at any time without penalty. The interest rate of SBA-guaranteed debentures is fixed at the time of issuance at a market-driven spread over 10-year U.S. Treasury Notes. Leverage through SBA-guaranteed debentures is subject to required capitalization thresholds. SBA current regulations limit the amount that an SBIC may borrow to a maximum of $150 million, which is up to twice its regulatory capital, and a maximum of $225 million as part of a group of SBICs under common control.
13
Table of Contents
| Item 1A. | Risk Factors |
Before you invest in our securities, you should be aware of various risks, including those described below. You should carefully consider these risk factors, together with all of the other information included in this Report, before you decide whether to make an investment in our securities. The risks set out below are not the only risks we face. Additional risks and uncertainties not currently known to us or that we currently deem to be immaterial also may have a material adverse effect on our business, financial condition and/or operating results. If any of the following events occur, our business, financial condition and results of operations could be materially adversely affected. In such case, our NAV, the trading price of our common stock and 2025 Notes, or any securities we may issue, may decline, and you may lose all or part of your investment.
RISKS RELATING TO OUR BUSINESS AND STRUCTURE
Global capital markets could enter a period of severe disruption and instability. These market conditions have historically and could again have a materially adverse effect on debt and equity capital markets in the United States, which could have a materially negative impact on our business, financial condition and results of operations.
The U.S. capital markets have experienced periods of disruption characterized by the freezing of available credit, a lack of liquidity in the debt capital markets, significant losses in the principal value of investments, the re-pricing of credit risk in the broadly syndicated credit market and the failure of major financial institutions. During these periods of disruption, general economic conditions deteriorated with material and adverse consequences for the broader financial and credit markets, and the availability of debt and equity capital for the market as a whole, and financial services firms in particular, was reduced significantly. These conditions may reoccur for a prolonged period of time or materially worsen in the future. We may in the future have difficulty accessing debt and equity capital, and a severe disruption in the global financial markets, deterioration in credit and financing conditions or uncertainty regarding U.S. government spending and deficit levels could have a material adverse effect on our business, financial condition and results of operations.
Volatility or a prolonged disruption in the credit markets could materially damage our business.
We are required to record our assets at fair value, as determined in good faith by our board of directors in accordance with our valuation policy. As a result, volatility in the capital markets may have a material adverse effect on our valuations and our NAV, even if we hold investments to maturity. Volatility or dislocation in the capital markets may depress our stock price below our NAV per share and create a challenging environment in which to raise debt and equity capital. As a BDC, we are generally not able to issue additional shares of our common stock at a price less than NAV without first obtaining approval for such issuance from our stockholders and our independent directors. Additionally, our ability to incur indebtedness is limited by the asset coverage requirements for a BDC, as defined in the 1940 Act, which we refer to as the asset coverage ratio, exclusive of the SBA debentures pursuant to our SEC exemptive relief. Declining portfolio values negatively impact our ability to borrow additional funds under our Credit Facility because our NAV is reduced for purposes of the asset coverage requirement. If the fair value of our assets declines substantially, we may fail to maintain the asset coverage ratio stipulated by the 1940 Act, which could, in turn, cause us to lose our status as a BDC and materially impair our business operations. A protracted disruption in the credit markets could also materially decrease demand for our investments.
The significant disruption in the capital markets experienced in the past had, and may in the future have, a negative effect on the valuations of our investments and on the potential for liquidity events involving our investments. The debt capital that may be available to us in the future may be at a higher cost and have less favorable terms and conditions than those currently in effect. If our financing costs increase and we have no increase in interest income, then our net investment income will decrease. A prolonged inability to raise capital may require us to reduce the volume of loans we originate and could have a material adverse impact on our business, financial condition or results of operations. This may also increase the probability that other structural risks negatively impact us. These situations may arise due to circumstances that we may be unable to control, such as a protracted disruption in the credit markets, a severe decline in the value of the U.S. dollar, a sharp economic downturn or an operational problem that affects third parties or us, and could materially damage our business, financial condition and results of operations.
Market developments may adversely affect our business and results of operations by reducing availability and/or triggering mandatory prepayment under our Credit Facility, the 2025 Notes and SBA debentures.
In addition to the applicable asset coverage ratio that restricts our ability to borrow under our Credit Facility, the Credit Facility and the indenture governing the 2025 Notes contain various covenants which, if not complied with, could accelerate repayment under the Credit Facility and 2025 Notes, thereby having a material adverse effect on our business, financial condition and results of operations. Our borrowings under our Credit Facility are collateralized by the assets in our investment portfolio, excluding those portfolio investments held by our SBIC Funds. The agreements governing the Credit Facility require us to comply with certain financial and operational covenants. These covenants include:
| • | A requirement to retain our status as a RIC; |
| • | A requirement to maintain a minimum amount of stockholder’s equity; and |
| • | A requirement that our outstanding borrowings under the Credit Facility not exceed a certain percentage of the values of our portfolio companies. |
In addition to the Credit Facility, we have issued the 2025 Notes and SBIC LP has issued SBA debentures that require us and SBIC LP to generate sufficient cash flow to make required interest payments. Further, SBIC LP must maintain a minimum capitalization that, if impaired, could materially and adversely affect our liquidity, financial condition and results of operations by accelerating repayment under the SBA debentures. Our borrowings under the SBA debentures are secured by the assets of SBIC LP.
Our continued compliance with these covenants depends on many factors, some of which are beyond our control. A material decrease in our NAV in connection with additional borrowings could result in an inability to comply with our obligation to restrict the level of indebtedness that we are able to incur in relation to the value of our assets or to maintain a minimum level of stockholders’ equity as applicable. This could have a material adverse effect on our operations, as it would reduce availability under the Credit Facility and could trigger mandatory prepayment obligations under the terms of the Credit Facility and the 2025 Notes.
Any unrealized losses we experience on our investment portfolio may be an indication of future realized losses, which could reduce our income available for distribution.
As a BDC, we are required to carry our investments at fair value, which is derived from a market value or, if no market value is ascertainable or if market value does not reflect the fair value of such investment in the bona fide determination of our board of directors, then we would carry our investments at fair value, as determined in good faith by or under the direction of our board of directors. Decreases in the market values or fair values of our investments are recorded as unrealized depreciation or loss. Unrealized losses of any given portfolio company could be an indication of such company’s inability in the future to meet its repayment obligations to us.
If the fair value of our portfolio companies reflects future realized losses, this would ultimately result in reductions of our income available for distribution in future periods and could materially harm our results of operations and cause a material decline in the value of our publicly traded common stock and 2025 Notes.
14
Table of Contents
Following periods of volatility in the market price of a company’s securities, securities class action litigation has often been brought against that company.
If the trading price of our stock or 2025 Notes fluctuates significantly, we may be the target of securities litigation in the future. Securities litigation could result in substantial costs and divert management’s attention and resources from our business and cause a material adverse effect on our business, financial condition and results of operations.
Our borrowers may default on their payments, which may have a materially negative effect on our financial performance.
Our primary business exposes us to credit risk, and the quality of our portfolio has a significant impact on our earnings. Credit risk is a component of our fair valuation of our portfolio companies. Negative credit events will lead to a decrease in the fair value of our portfolio companies.
In addition, current market conditions have affected consumer confidence levels, which may harm the business of our portfolio companies and result in adverse changes in payment patterns. Increased delinquencies and default rates would negatively impact our results of operations. Deterioration in the quality of our credit portfolio could have a material adverse effect on our capital, financial condition and results of operations. If interest rates rise, some of our portfolio companies may not be able to pay the escalating interest on our loans and may default.
We make long-term loans and debt investments, which may involve a high degree of repayment risk. We invest in companies that may have limited financial resources, may be highly leveraged and may be unable to obtain financing from traditional sources. Accordingly, a general economic downturn or severe tightening in the credit markets could materially impact the ability of our borrowers to repay their loans, which could significantly damage our business. Numerous other factors may affect a borrower’s ability to repay its loan, including the failure to meet its business plan or a downturn in its industry. A portfolio company’s failure to satisfy financial or operating covenants imposed by us or other lenders could lead to defaults and, potentially, termination of its loans or foreclosure on the secured assets. This could trigger cross-defaults under other agreements and jeopardize our portfolio company’s ability to meet its obligations under the loans or debt securities that we hold. In addition, our portfolio companies may have, or may be permitted to incur, other debt that ranks senior to or equally with our securities. This means that payments on such senior-ranking securities may have to be made before we receive any payments on our subordinated loans or debt securities. Deterioration in a borrower’s financial condition and prospects may be accompanied by deterioration in any related collateral and may have a material adverse effect on our financial condition and results of operations.
We may in the future determine to fund a portion of our investments with preferred stock, which is another form of leverage and would magnify the potential for loss and the risks of investing in us.
Preferred stock, which is another form of leverage, has the same risks to our common stockholders as borrowings because the distributions on any preferred stock we issue must be cumulative. If we issue preferred securities they would rank “senior” to common stock in our capital structure. Payment of distributions on, and repayment of the liquidation preference of, such preferred stock would typically take preference over any distributions or other payments to our common stockholders. Also, preferred stockholders are not, typically, subject to any of our expenses or losses and are not entitled to participate in any income or appreciation in excess of their stated preference. Furthermore, preferred stockholders would have separate voting rights and may have rights, preferences or privileges more favorable than those of our common stockholders. Also, the issuance of preferred securities could have the adverse effect of delaying, deferring or preventing a transaction or a change of control that might involve a premium price for our common stockholders or otherwise be in your best interest.
We are dependent upon our Investment Adviser’s key personnel for our future success, and if our Investment Adviser is unable to hire and retain qualified personnel or if our Investment Adviser loses any member of its management team, our ability to achieve our investment objectives could be significantly harmed.
We depend on the diligence, skill and network of business contacts of the senior investment professionals of our Investment Adviser. We also depend, to a significant extent, on PennantPark Investment Advisers’ access to the investment information and deal flow generated by these investment professionals and any others that may be hired by PennantPark Investment Advisers. Subject to the overall supervision of our board of directors, the managers of our Investment Adviser evaluate, negotiate, structure, close and monitor our investments. Our future success depends on the continued service of management personnel of our Investment Adviser. The departure of managers of PennantPark Investment Advisers could have a material adverse effect on our ability to achieve our investment objectives. In addition, we can offer no assurance that PennantPark Investment Advisers will remain our Investment Adviser. The Investment Adviser has the right, under the Investment Management Agreement, to resign at any time upon 60 days’ written notice, whether we have found a replacement or not.
If our Investment Management Agreement or Administration Agreement discussed above is terminated, our costs under new agreements that we enter into may increase. In addition, we will likely incur significant time and expense in locating alternative parties to provide the services we expect to receive under our Investment Management Agreement and Administration Agreement. Any new investment management agreement would also be subject to approval by our stockholders.
We are highly dependent on information systems and systems failures could have a material adverse effect on our business, financial condition and results of operations.
Our business depends on the communications and information systems of the Investment Adviser and the Administrator. Any failure or interruption of such systems could cause delays or other problems in our activities. This, in turn, could have a material adverse effect on our business, financial condition and results of operations.
Our financial condition and results of operation depend on our ability to manage future growth effectively.
Our ability to achieve our investment objectives depends on our ability to grow, which depends, in turn, on our Investment Adviser’s ability to identify, invest in and monitor companies that meet our investment criteria. Accomplishing this result on a cost-effective basis is largely a function of our Investment Adviser’s structuring of the investment process, its ability to provide competent, attentive and efficient services to us and our access to financing on acceptable terms. The management team of PennantPark Investment Advisers has substantial responsibilities under our Investment Management Agreement. In order to grow, our Investment Adviser will need to hire, train, supervise and manage new employees. However, we can offer no assurance that any such employees will contribute effectively to the work of the Investment Adviser. We caution you that the principals of our Investment Adviser or Administrator may also be called upon to provide and currently do provide managerial assistance to portfolio companies and other investment vehicles, including other BDCs, which are managed by the Investment Adviser. Such demands on their time may distract them or slow our rate of investment. Any failure to manage our future growth effectively could have a material adverse effect on our business, financial condition and results of operations.
We operate in a highly competitive market for investment opportunities.
A number of entities compete with us to make the types of investments that we make in middle-market companies. We compete with public and private funds, including other BDCs, commercial and investment banks, commercial financing companies, CLO funds and, to the extent they provide an alternative form of financing, private equity funds. Additionally, alternative investment vehicles, such as hedge funds, also invest in middle-market companies. As a result, competition for investment opportunities at middle-market companies can be intense. Many of our potential competitors are substantially larger and have considerably greater financial, technical and marketing resources than we do. For example, we believe some competitors have a lower cost of funds and access to funding sources that are not available to us. In addition, some of our competitors have higher risk tolerances or different risk assessments, which could allow them to consider a wider variety of investments and establish more relationships than us. Furthermore, many of our competitors are not subject to the regulatory restrictions that the 1940 Act imposes on us as a BDC. We cannot assure you that the competitive pressures we face will not have a material adverse effect on our business, financial condition and results of operations. Also, as a result of this competition, we may not be able to take advantage of attractive investment opportunities from time to time, and we can offer no assurance that we will be able to identify and make investments that are consistent with our investment objectives.
15
Table of Contents
Participants in our industry compete on several factors, including price, flexibility in transaction structuring, customer service, reputation, market knowledge and speed in decision-making. We do not seek to compete primarily based on the interest rates we offer, and we believe that some of our competitors may make loans with interest rates that are lower than the rates we offer. We may lose investment opportunities if we do not match our competitors’ pricing, terms and structure. However, if we match our competitors’ pricing, terms and structure, we may experience decreased net interest income and increased risk of credit loss.
We may not replicate the historical performance of other investment companies with which our investment professionals have been affiliated.
The 1940 Act imposes numerous constraints on the investment activities of BDCs. For example, BDCs are required to invest at least 70% of their total assets primarily in securities of U.S. private companies or thinly traded public companies (public companies with a market capitalization of less than $250 million), cash, cash equivalents, U.S. government securities and high-quality debt investments that mature in one year or less. These constraints may hinder the Investment Adviser’s ability to take advantage of attractive investment opportunities and to achieve our investment objectives. In addition, the investment philosophy and techniques used by the Investment Adviser may differ from those used by other investment companies advised by the Investment Adviser. Accordingly, we can offer no assurance that we will replicate the historical performance of other investment companies with which our investment professionals have been affiliated, and we caution that our investment returns could be substantially lower than the returns achieved by such other companies.
Any failure on our part to maintain our status as a business development company would reduce our operating flexibility.
If we do not remain a BDC, we might be regulated as a closed-end investment company under the 1940 Act, which would subject us to substantially more regulatory restrictions under the 1940 Act and correspondingly decrease our operating flexibility, which could have a material adverse effect on our business, financial condition and results of operations.
Loss of RIC tax status would substantially reduce net assets and income available for debt service and distributions.
We have operated and continue to operate so as to maintain our election to be taxed as a RIC under Subchapter M of the Code. If we meet source of income, quarterly asset diversification, and distribution requirements, we generally will not be subject to corporate-level income taxation on income we timely distribute, or deem to distribute, to our stockholders as distributions. We would cease to qualify for such tax treatment if we were unable to comply with these requirements. In addition, we may have difficulty meeting the requirement to make distributions to our stockholders because in certain cases we may recognize income before or without receiving cash representing such income. If we fail to qualify as a RIC, we will have to pay corporate-level taxes on all of our income whether or not we distribute it, which would substantially reduce the amount of income available for debt service as well as reduce and/or affect the character and amount of our distributions to our stockholders. Even if we qualify as a RIC, we generally will be subject to an excise tax if we do not distribute an amount at least equal to the sum of (1) 98% of our net ordinary income (for the calendar year), plus (2) 98.2% of the sum of our net realized capital gains (during each 12-month period ending on October 31). We generally will be required to pay an excise tax on amounts carried over and distributed to stockholders in the next year equal to 4% of the undistributed amount.
We may have difficulty paying our required distributions if we recognize income before or without receiving cash representing such income.
For federal income tax purposes, we include in income certain amounts that we have not yet received in cash, such as OID and PIK interest, which represents interest added to the loan balance and due at the end of the loan term. OID, which could be significant relative to our overall investment assets, and increases in loan balances as a result of PIK interest will be included in income before we receive any corresponding cash payments. We also may be required to include in income certain other amounts that we will not receive in cash.
The part of the incentive fee payable by us that relates to our net investment income is computed and paid on income that may include interest that has been accrued but not yet received in cash. If a portfolio company defaults on a loan that is structured to provide accrued interest, it is possible that accrued interest previously used in the calculation of the incentive fee will become uncollectible.
In some cases we may recognize income before or without receiving cash representing such income. As a result, we may have difficulty meeting the tax requirement to distribute at least 90% of the sum of our ordinary income and realized net short-term capital gains, if any, to obtain RIC tax benefits. Accordingly, we may have to sell some of our investments at times we would not consider advantageous, raise additional debt or equity capital or reduce new investment originations to meet these distribution requirements, which could have a material adverse effect on our business, financial condition and results of operations. If we are not able to obtain cash from other sources, we may fail to qualify for RIC tax benefits and thus be subject to corporate-level income tax.
Because we intend to distribute substantially all of our income to our stockholders to maintain our status as a RIC, we will need to raise additional capital to finance our growth. If funds are not available to us, we may need to curtail new investments, and our common stock value could decline.
In order to satisfy the requirements applicable to a RIC, we intend to distribute to our stockholders substantially all of our net ordinary income and net capital gains except for certain net long-term capital gains, some or all of which we may retain, pay applicable income taxes with respect thereto and elect to treat as deemed distributions to our stockholders. As a BDC, we generally are required to meet the asset coverage ratio of total assets to total senior securities, which includes all of our borrowings, exclusive of the SBA debentures pursuant to SEC exemptive relief, and any preferred stock we may issue in the future. This requirement limits the amount we may borrow. If the value of our assets declines, we may be unable to satisfy this test. If that happens, we may be required to sell a portion of our investments or sell additional common stock and, depending on the nature of our leverage, to repay a portion of our indebtedness at a time when such sales and repayments may be disadvantageous. In addition, the issuance of additional securities could dilute the percentage ownership of our current stockholders in us.
We will be partially dependent on our SBIC Funds for cash distributions to enable us to meet the RIC distribution requirements. Our SBIC Funds may be limited by the SBA regulations governing SBICs from making certain distributions to us that may be necessary to maintain our status as a RIC. We may have to request a waiver of the SBA’s restrictions for our SBIC Funds to make certain distributions to maintain our RIC status. We cannot assure you that the SBA will grant such waiver, and if our SBIC Funds are unable to obtain a waiver, compliance with the SBA regulations may result in a corporate-level income tax on us.
16
Table of Contents
Regulations governing our operation as a business development company will affect our ability to, and the way in which we, raise additional capital.
Our business requires a substantial amount of capital. We may acquire additional capital from the issuance of additional senior securities or other indebtedness, the issuance of additional shares of our common stock, the issuance of warrants or subscription rights to purchase certain of our securities, or from securitization transactions or through SBA debentures. However, we may not be able to raise additional capital in the future on favorable terms or at all. We may issue additional debt securities or preferred securities, which we refer to collectively as “senior securities,” and we may borrow money from banks, through the SBA debenture program or other financial institutions, up to the maximum amount permitted by the 1940 Act. The 1940 Act permits us to issue senior securities or incur indebtedness only in amounts permissible under the asset coverage definition in the 1940 Act, exclusive of the SBA debentures pursuant to our SEC exemptive relief. Our ability to pay distributions or issue additional senior securities would be restricted if our asset coverage requirements were not met. If the value of our assets decline, we may be unable to satisfy this test. If that happens, we may be required to liquidate a portion of our investments and repay a portion of our indebtedness at a time when such sales may be disadvantageous, which could materially damage our business.
| • | Senior Securities. As a result of issuing senior securities, we are exposed to typical risks associated with leverage, including an increased risk of loss. If we issue preferred securities, they would rank “senior” to common stock in our capital structure. Preferred stockholders would have separate voting rights and may have rights, preferences or privileges more favorable than those of holders of our common stock. Furthermore, the issuance of preferred securities could have the adverse effect of delaying, deferring or preventing a transaction or a change of control that might involve a premium price for our common stockholders or otherwise be in your best interest. Our senior securities may include conversion features that cause them to bear risks more closely associated with an investment in our common stock. |
| • | Additional Common Stock. Our board of directors may decide to issue common stock to finance our operations rather than issuing debt or other senior securities. As a BDC, we are generally not able to issue our common stock at a price below NAV per share without first obtaining certain approvals from our stockholders and our board of directors. Also, subject to the requirements of the 1940 Act, we may issue rights to acquire our common stock at a price below the current NAV per share of the common stock if our board of directors determines that such sale is in our best interests and the best interests of our common stockholders. In any such case, the price at which our securities are to be issued and sold may not be less than a price, that in the determination of our board of directors, closely approximates the market value of such securities. We will not offer transferable subscription rights to our stockholders at a price equivalent to less than the then current NAV per share of common stock, excluding underwriting commissions, unless we first file a post-effective amendment that is declared effective by the SEC with respect to such issuance and the common stock to be purchased in connection with such rights represents no more than one-third of our outstanding common stock at the time such rights are issued. In addition, we note that for us to file a post-effective amendment to a registration statement on Form N-2, we must then be qualified to register our securities under the requirements of Form S-3. We may actually issue shares above or below a future NAV. If we raise additional funds by issuing more common stock or warrants or senior securities convertible into, or exchangeable for, our common stock, the percentage ownership of our common stockholders at that time would decrease, and our common stockholders would experience voting dilution. |
| • | Securitization. In addition to issuing securities to raise capital as described above, we anticipate that in the future, as market conditions permit, we may securitize our loans to generate cash for funding new investments. To securitize loans, we may create a wholly-owned subsidiary, contribute a pool of loans to the subsidiary and have the subsidiary issue primarily investment grade debt securities to purchasers who we would expect to be willing to accept a substantially lower interest rate than the loans earn. Even though we expect the pool of loans that we contribute to any such securitization vehicle to be rated below investment grade, because the securitization vehicle’s portfolio of loans would secure all of the debt issued by such vehicle, a portion of such debt may be rated investment grade, subject in each case to market conditions that may require such portion of the debt to be over collateralized and various other restrictions. If applicable accounting pronouncements or SEC staff guidance require us to consolidate the securitization vehicle’s financial statements with our financial statements, any debt issued by it would be generally treated as if it were issued by us for purposes of the asset coverage ratio applicable to us. In such case, we would expect to retain all or a portion of the equity and/or subordinated notes in the securitization vehicle. Our retained equity would be exposed to any losses on the portfolio of loans before any of the debt securities would be exposed to such losses. Accordingly, if the pool of loans experienced a low level of losses due to defaults, we would earn an incremental amount of income on our retained equity but we would be exposed, up to the amount of equity we retained, to that proportion of any losses we would have experienced if we had continued to hold the loans in our portfolio. We may hold subordinated debentures in any such securitization vehicle and, if so, we would not consider such securities to be senior securities. An inability to successfully securitize our loan portfolio could limit our ability to grow our business and fully execute our business strategy and adversely affect our earnings, if any. Moreover, the successful securitization of a portion of our loan portfolio might expose us to losses as the residual loans in which we do not sell interests will tend to be those that are riskier and less liquid. |
| • | SBA Debentures. In addition to issuing securities and using securitizations to raise capital as described above, we have issued and may in the future issue, as permitted under SBA regulations and through our wholly owned subsidiaries, SBIC LP, SBIC II and any future SBIC subsidiary, SBA debentures to generate cash for funding new investments. To issue SBA debentures, we may request commitments for debt capital from the SBA. SBIC LP is and in the future SBIC II or any future SBIC subsidiary would be exposed to any losses on its portfolio of loans, however, such debentures are non-recourse to us. |
Our SBIC Funds may be unable to make distributions to us that will enable us to meet or maintain RIC status.
In order for us to continue to qualify for RIC tax treatment and to minimize corporate-level income taxes, we will be required to distribute substantially all of our consolidated net ordinary income and net capital gains, including income from our SBIC Funds. We will be partially dependent on our SBIC Funds for cash distributions to enable us to meet the RIC distribution requirements. Our SBIC Funds may be limited by SBA regulations governing SBICs from making certain distributions to us that may be necessary to maintain our status as a RIC. We may have to request a waiver of the SBA’s restrictions for our SBIC Funds to make certain distributions to maintain our RIC status. We cannot assure you that the SBA will grant such waiver and if our SBIC Funds are unable to obtain a waiver, compliance with the SBA regulations may result in corporate level income tax on us.
Our SBIC Funds are licensed by the SBA and are subject to SBA regulations.
Our wholly owned subsidiaries, SBIC LP and SBIC II, received licenses to operate as SBICs under the 1958 Act and are regulated by the SBA. The SBA places certain limitations on the financing terms of investments by SBICs in portfolio companies and regulates the types of financings and prohibits investing in certain industries. Compliance with SBIC requirements may cause our SBIC Funds to invest at less competitive rates in order to qualify investments under the SBA regulations.
Further, SBA regulations require that a licensed SBIC be periodically examined and audited by the SBA to determine its compliance with the relevant regulations. If our SBIC Funds fail to comply with applicable regulations, the SBA could, depending on the severity of the violation, limit or prohibit their use of debentures, declare outstanding debentures immediately due and payable, and/or limit them from making new investments. In addition, the SBA could revoke or suspend our SBIC Funds’ licenses for willful or repeated violation of, or willful or repeated failure to observe, any provision of the 1958 Act or any rule or regulation promulgated thereunder. These actions by the SBA would, in turn, negatively affect us because our SBIC Funds are our wholly owned subsidiaries.
SBA-guaranteed debentures are non-recourse to us, have a 10-year maturity, and may be prepaid at any time without penalty. The interest rate of SBA-guaranteed debentures is fixed at the time of issuance at a market-driven spread over 10-year U.S. Treasury Notes. Leverage through SBA-guaranteed debentures is subject to required capitalization thresholds. SBA current regulations limit the amount that our SBIC Funds may borrow to a maximum of $150 million for any one SBIC, which is up to twice its regulatory capital, and a maximum of $225 million as part of a group of SBICs under common control.
17
Table of Contents
We currently use borrowed funds to make investments and are exposed to the typical risks associated with leverage.
Because we borrow funds to make investments we are exposed to increased risk of loss due to our use of debt to make investments. A decrease in the value of our investments will have a greater negative impact on the NAV attributable to our common stock than it would if we did not use debt. Our ability to pay distributions is restricted when our asset coverage ratio is not met, exclusive of the SBA debentures pursuant to SEC exemptive relief, and any amounts that we use to service our indebtedness are not available for distribution to our common stockholders.
Our current debt is governed by the terms of our 2025 Notes, Credit Facility or the SBA debentures and may in the future be governed by an indenture or other instrument containing covenants restricting our operating flexibility. We, and indirectly our stockholders, bear the cost of issuing and servicing debt. Any convertible or exchangeable securities that we issue in the future may have rights, preferences and privileges more favorable than those of our common stock.
Additionally, our subsidiary, SBIC LP, has received borrowed funds and SBIC II may in the future receive funds from the SBA through its debenture program. In connection with the filing of its initial SBA license application, PennantPark Investment received exemptive relief, in June 2011, from the SEC to permit us to exclude the debt of our SBIC Funds from our consolidated asset coverage ratio. Our ratio of total assets on a consolidated basis to outstanding indebtedness may be less than the applicable asset coverage ratio, which while providing increased investment flexibility, would also increase our exposure to risks associated with leverage.
If we incur additional debt, it could increase the risk of investing in our shares.
We have indebtedness outstanding pursuant to our 2025 Notes, Credit Facility and SBA debentures and expect in the future to borrow additional amounts under our Credit Facility or other debt securities, subject to market availability, and, may increase the size of our Credit Facility. We cannot assure you that our leverage will remain in this range. The amount of leverage that we employ will depend upon our assessment of the market and other factors at the time of any proposed borrowing. Lenders have fixed dollar claims on our assets that are superior to the claims of our common stockholders or preferred stockholders, if any, and we have granted a security interest in our assets, excluding those of our SBIC Funds, in connection with our Credit Facility borrowings. In the case of a liquidation event, those lenders would receive proceeds before our stockholders. Additionally, the SBA, as a lender and an administrative agent, has a superior claim over the assets of our SBIC Funds in relation to our other creditors. Any future debt issuance will increase our leverage and may be subordinate to our Credit Facility and SBA debentures. In addition, borrowings or debt issuances and SBA debentures, also known as leverage, magnify the potential for gain or loss on amounts invested and, therefore, increase the risks associated with investing in our securities. Leverage is generally considered a speculative investment technique. If the value of our assets decreases, then leveraging would cause the NAV attributable to our common stock to decline more than it otherwise would have had we not utilized leverage. Similarly, any decrease in our revenue would cause our net income to decline more than it would have had we not borrowed funds and could negatively affect our ability to make distributions on our common or preferred stock. Our ability to service any debt that we incur depends largely on our financial performance and is subject to prevailing economic conditions and competitive pressures.
As of September 30, 2013, we had outstanding borrowings of $145.5 million under our Credit Facility, $71.3 million outstanding under our 2025 Notes and $150.0 million outstanding under the SBA debentures. Our consolidated debt outstanding was $366.8 million and had a weighted average annual interest rate at the time of 4.05% exclusive of the fee on undrawn commitment on our Credit Facility of 0.50% and 3.43% of upfront fees on the SBA debentures. Accordingly, to cover the annual interest on our borrowings outstanding at September 30, 2013, at the then current rate, we would have to receive an annual yield of at least 1.39%. This example is for illustrative purposes only, and actual interest rates on our Credit Facility or any future borrowings are likely to fluctuate. The costs associated with our borrowings, including any increase in the management fee or incentive fee payable to our Investment Adviser, are and will be borne by our common stockholders.
The following table is designed to illustrate the effect on return to a holder of our common stock of the leverage created by our use of borrowing at September 30, 2013 of 32% of total assets (including such borrowed funds), at a weighted average rate at the time of 4.05%, and assumes hypothetical annual returns on our portfolio of minus 10 to plus 10 percent. The table also assumes that we will maintain a constant level and weighted average rate of leverage. The amount of leverage and cost of borrowings that we use will vary from time to time. As can be seen, leverage generally increases the return to stockholders when the portfolio return is positive and decreases return when the portfolio return is negative. Actual returns may be greater or less than those appearing in the table.
| Assumed return on portfolio (net of expenses)(1) |
(10.0 | )% | (5.0 | )% | — | 5.0 | % | 10.0 | % | |||||||||||
| Corresponding return to common stockholders(2) |
(18.7 | )% | (10.4 | )% | (2.1 | )% | 6.2 | % | 14.4 | % |
| (1) | The assumed portfolio return is required by regulation of the SEC and is not a prediction of, and does not represent, our projected or actual performance. |
| (2) | In order to compute the “corresponding return to common stockholders,” the “assumed return on portfolio” is multiplied by the total value of our assets at the beginning of the period to obtain an assumed return to us. From this amount, all interest expense expected to be accrued during the period is subtracted to determine the return available to stockholders. The return available to stockholders is then divided by the total value of our net assets as of the beginning of the period to determine the “corresponding return to common stockholders.” |
We are exposed to risks associated with changes in interest rates that may affect our cost of capital and net investment income.
Since we borrow money to make investments, our net investment income depends, in part, upon the difference between the rate at which we borrow funds and the rate at which we invest those funds. As a result, we can offer no assurance that a significant change in market interest rates will not have a material adverse effect on our net investment income. In the period from June 2007, when we executed our original Credit Facility, through September 2013, the applicable LIBOR rate decreased from 5.3% to 0.2%. In periods of rising interest rates, our cost of funds will increase, which could reduce our net investment income. We may use interest rate risk management techniques, such as total return swaps and interest rate swaps, in an effort to limit our exposure to interest rate fluctuations. These techniques may include various interest rate hedging activities to the extent permitted by the 1940 Act and applicable commodities laws. These activities may limit our ability to participate in the benefits of lower interest rates with respect to the hedged portfolio. Adverse developments resulting from changes in interest rates or hedging transactions could have a material adverse effect on our business, financial condition and results of operations. Also, we have limited experience in entering into hedging transactions, and we will initially have to purchase or develop such expertise. See “Management’s Discussion and Analysis of Financial Condition and Results of Operations—Quantitative and Qualitative Disclosures about Market Risk” for more information.
A rise in the general level of interest rates can be expected to lead to higher interest rates applicable to our debt investments. Accordingly, an increase in interest rates would make it easier for us to meet or exceed the incentive fee hurdle and may result in a substantial increase of the amount of incentive fees payable to our Investment Adviser with respect to Pre-Incentive Fee Net Investment Income.
General interest rate fluctuations may have a substantial negative impact on our investments, the value of our common stock and our rate of return on invested capital. A reduction in the interest rates on new investments relative to interest rates on current investments could also have an adverse impact on our net interest income. An increase in interest rates could decrease the value of any investments we hold which earn fixed interest rates and also could increase our interest expense, thereby decreasing our net income. Also, an increase in interest rates available to investors could make investment in our common stock less attractive if we are not able to increase our dividend rate, which could reduce the value of our common stock.
18
Table of Contents
We have and may in the future determine to fund a portion of our investments with debt securities, which would magnify the potential for loss and the risks of investing in us.
As a result of the issuance of the 2025 Notes and SBA debentures, we are exposed to typical risks associated with leverage, including an increased risk of loss and an increase in expenses, which are ultimately borne by our common stockholders. Payment of interest on such debt securities must take preference over any other distributions or other payments to our common stockholders. If we issue additional debt securities in the future, it is likely that such securities will be governed by an indenture or other instrument containing covenants restricting our operating flexibility. In addition, such securities may be rated by rating agencies, and in obtaining a rating for such securities, we may be required to abide by operating and investment guidelines that could further restrict our operating flexibility. Furthermore, any amounts that we use to service our indebtedness are not available for the payment of distributions to our common stockholders.
Our credit ratings may not reflect all risks of an investment in our debt securities.
Our credit ratings, if any, are an assessment of our ability to pay our obligations. Consequently, real or anticipated changes in our credit ratings will generally affect the market value of our publicly issued debt securities. Our credit ratings, however, may not reflect the potential impact of risks related to market conditions generally or other factors discussed above on the market value of, or trading market for, any publicly issued debt securities.
Market conditions may make it difficult to extend the maturity of or refinance our existing indebtedness and any failure to do so could have a material adverse effect on our business.
Our Credit Facility expires in February 2016. We utilize the Credit Facility to make investments in our portfolio companies. The life of our investments typically exceeds the duration of our indebtedness under our Credit Facility. This means that we will have to extend the maturity of our Credit Facility or refinance our indebtedness under our Credit Facility in order to avoid selling investments at a time when such sales may be at prices that are disadvantageous to us, which could materially damage our business. In addition, future market conditions may affect our ability to renew or refinance our Credit Facility on terms as favorable as those in our existing Credit Facility. If we fail to extend or refinance the indebtedness outstanding under our Credit Facility by the time it becomes due and payable, the administrative agent of the Credit Facility may elect to exercise various remedies, including the sale of all or a portion of the collateral securing the Credit Facility, subject to certain restrictions, any of which could have a material adverse effect on our business, financial condition and results of operations. The illiquidity of our investments may make it difficult for us to sell such investments. If we are required to sell our investments on short-term notice, we may not receive the value that we have recorded for such investments, and this could materially affect our results of operations.
If we issue preferred stock, debt securities, convertible debt securities or units, the NAV and market value of our common stock may become more volatile.
We cannot assure you that the issuance of preferred stock and/or debt securities would result in a higher yield or return to the holders of our common stock. The issuance of preferred stock, debt securities, convertible debt or units would likely cause the NAV and market value of our common stock to become more volatile. If the dividend rate on the preferred stock, or the interest rate on the debt securities, were to approach the net rate of return on our investment portfolio, the benefit of leverage to the holders of our common stock would be reduced. If the dividend rate on the preferred stock, or the interest rate on the debt securities, were to exceed the net rate of return on our portfolio, the use of leverage would result in a lower rate of return to the holders of common stock than if we had not issued the preferred stock or debt securities. Any decline in the NAV of our investment would be borne entirely by the holders of our common stock. Therefore, if the market value of our portfolio were to decline, the leverage would result in a greater decrease in NAV to the holders of our common stock than if we were not leveraged through the issuance of preferred stock, debt securities or convertible debt. This decline in NAV would also tend to cause a greater decline in the market price for our common stock.
There is also a risk that, in the event of a sharp decline in the value of our net assets, we would be in danger of failing to maintain required asset coverage ratios which may be required by the preferred stock, debt securities, convertible debt or units or of a downgrade in the ratings of the preferred stock, debt securities, convertible debt or units or our current investment income might not be sufficient to meet the dividend requirements on the preferred stock or the interest payments on the debt securities. In order to counteract such an event, we might need to liquidate investments in order to fund redemption of some or all of the preferred stock, debt securities, convertible debt or units. In addition, we would pay (and the holders of our common stock would bear) all costs and expenses relating to the issuance and ongoing maintenance of the preferred stock, debt securities, convertible debt or any combination of these securities. Holders of preferred stock, debt securities, convertible debt or units may have different interests than holders of common stock and may at times have disproportionate influence over our affairs.
Holders of any preferred stock that we may issue will have the right to elect members of the board of directors and have class voting rights on certain matters.
The 1940 Act requires that holders of shares of preferred stock must be entitled as a class to elect two directors at all times and to elect a majority of the directors if distributions on such preferred stock are in arrears by two years or more, until such arrearage is eliminated. In addition, certain matters under the 1940 Act require the separate vote of the holders of any issued and outstanding preferred stock, including changes in fundamental investment restrictions and conversion to open-end status and, accordingly, preferred stockholders could veto any such changes. Restrictions imposed on the declarations and payment of distributions to the holders of our common stock and preferred stock, both by the 1940 Act and by requirements imposed by rating agencies, might impair our ability to maintain our qualification as a RIC for U.S. federal income tax purposes, which could have a material adverse effect on our business, financial condition and results of operations.
We may in the future issue securities for which there is no public market and for which we expect no public market to develop.
In order to raise additional capital, we may issue debt or other securities for which no public market exists, and for which no public market is expected to develop. If we issue shares of our common stock as a component of a unit security, we would expect the common stock to separate from the other securities in such unit after a period of time or upon occurrence of an event and to trade publicly on the NASDAQ Global Select Market, which may cause volatility in our publicly traded common stock. To the extent we issue securities for which no public market exists and for which no public market develops, a purchaser of such securities may not be able to liquidate the investment without considerable delay, if at all. If a market should develop for our debt and other securities, the price may be highly volatile, and our debt and other securities may lose value.
There are significant potential conflicts of interest which could impact our investment returns.
The professionals of our Investment Adviser and Administrator may serve as officers, directors or principals of entities that operate in the same or a related line of business as we do or of investment funds managed by affiliates of PennantPark Investment that currently exist or may be formed in the future. The Investment Adviser and Administrator may be engaged by such funds at any time and without the prior approval of our stockholders or our board of directors. Our board of directors monitors any potential conflict that may arise upon such a development. Accordingly, if this occurs, they may have obligations to investors in those entities, the fulfillment of which might not be in the best interests of us or our stockholders. Currently, the executive officers and directors, as well as the current senior investment professionals of the Investment Adviser, may serve as officers and directors of our controlled affiliates and affiliated funds. In addition, we note that any affiliated investment vehicle currently formed or formed in the future and managed by the Investment Adviser or its affiliates may have overlapping investment objectives with our own and, accordingly, may invest in asset classes similar to those targeted by us. As a result, the Investment Adviser may face conflicts in allocating investment opportunities between us and such other entities. Although the Investment Adviser will endeavor to allocate investment opportunities in a fair and equitable manner, it is possible that, in the future, we may not be given the opportunity to participate in investments made by investment funds managed by the Investment Adviser or an investment manager affiliated with the Investment Adviser. In any such case, when the Investment Adviser identifies an investment, it will be forced to choose which investment fund should make the investment. We may co-invest on a concurrent basis with any other affiliates that the Investment Adviser has or forms in the future, subject to compliance with applicable regulations and regulatory guidance and our allocation procedures. In certain circumstances, negotiated co-investments may be made only if we receive an order from the SEC permitting us to do so. We, the Investment Adviser and our affiliated funds have submitted an Exemptive application to the SEC for such an order, but there can be no assurance that such order will be obtained.
19
Table of Contents
In the course of our investing activities, we will pay investment advisory and incentive fees to our Investment Adviser, and will reimburse our Investment Adviser for certain expenses it incurs. As a result, investors in our common stock will invest on a “gross” basis and receive distributions on a “net” basis after expenses, resulting in a lower rate of return than an investor might achieve through direct investments. Accordingly, there may be times when the management team of the Investment Adviser has interests that differ from those of our stockholders, giving rise to a conflict.
We have entered into the License Agreement with PennantPark Investment Advisers, pursuant to which our Investment Adviser has granted us a royalty-free non-exclusive license to use the name “PennantPark.” The License Agreement will expire (i) upon expiration or termination of the Investment Management Agreement, (ii) if the Investment Adviser ceases to serve as our investment adviser, (iii) by either party upon 60 days’ written notice or (iv) by the Investment Adviser at any time in the event we assign or attempt to assign or sublicense the License Agreement or any of our rights or duties thereunder without the prior written consent of the Investment Adviser. Other than with respect to this limited license, we have no legal right to the “PennantPark” name.
In addition, we pay PennantPark Investment Administration, an affiliate of the Investment Adviser, our allocable portion of overhead and other expenses incurred by PennantPark Investment Administration in performing its obligations under our Administration Agreement, including rent and our allocable portion of the cost of our Chief Financial Officer and Chief Compliance Officer and their respective staffs. These arrangements may create conflicts of interest that our board of directors must monitor.
The trading market or market value of any publicly issued debt or convertible debt securities may be volatile.
If we publicly issue debt or convertible debt securities, they may or may not have an established trading market. We cannot assure investors that a trading market for our publicly issued debt or convertible debt securities would develop or be maintained if developed. In addition to our creditworthiness, many factors may have a material adverse effect on the trading market for, and market value of, our publicly issued debt or convertible debt securities.
These factors include the following:
| • | The time remaining to the maturity of these debt securities; |
| • | the outstanding principal amount of debt securities with terms identical to these debt securities; |
| • | the supply of debt securities trading in the secondary market, if any; |
| • | the redemption, repayment or convertible features, if any, of these debt securities; |
| • | the level, direction and volatility of market interest rates; and |
| • | market rates of interest higher or lower than rates borne by the debt securities. |
There also may be a limited number of buyers for our debt securities. This too may have a material adverse effect on the market value of the debt securities or the trading market for the debt securities. Our debt securities may include convertible features that cause them to more closely bear risks associated with an investment in our common stock.
Terms relating to redemption may have a material adverse effect on the return on any debt securities.
If we issue debt securities that are redeemable at our option, we may choose to redeem the debt securities at times when prevailing interest rates are lower than the interest rate paid on the debt securities. In addition, if the debt securities are subject to mandatory redemption, we may be required to redeem the debt securities at times when prevailing interest rates are lower than the interest rate paid on the debt securities. In this circumstance, a holder of our debt securities may not be able to reinvest the redemption proceeds in a comparable security at an effective interest rate as high as the debt securities being redeemed.
If we issue subscription rights or warrants for our common stock, your interest in us may be diluted as a result of such rights or warrants offering.
Stockholders who do not fully exercise rights or warrants issued to them in an offering of subscription rights or warrants to purchase our common stock should expect that they will, at the completion of an offering, own a smaller proportional interest in us than would otherwise be the case if they fully exercised their rights or warrants. We cannot state precisely the amount of any such dilution in share ownership because we do not know what proportion of the common stock would be purchased as a result of any such offering.
In addition, if the subscription price or warrant price is less than our NAV per share of common stock at the time of such offering, then our stockholders would experience an immediate dilution of the aggregate NAV of their shares as a result of the offering. The amount of any such decrease in NAV is not predictable because it is not known at this time what the subscription price, warrant price or NAV per share will be on the expiration date of such rights offering or what proportion of our common stock will be purchased as a result of any such offering.
We may experience fluctuations in our quarterly results.
We could experience fluctuations in our quarterly operating results due to a number of factors, including the interest rate payable on the debt securities we acquire, the default rate on such securities, the level of our expenses, variations in, and the timing of the recognition of, realized and unrealized gains or losses, the degree to which we encounter competition in our markets and general economic conditions. However, as a result of our irrevocable election to apply the fair value option to our Credit Facility and the 2025 Notes, future decreases of fair value of our debt will have a corresponding increase to our NAV. Further increases of fair value of our debt will have the opposite effect. Any future indebtedness that we elect the fair value option for may have similar effects on our NAV, as our Credit Facility and 2025 Notes. This will tend to mitigate volatility in our earnings and NAV. As a result of these factors, results for any period should not be relied upon as being indicative of performance in future periods.
The impact of recent financial reform legislation on us is uncertain.
In light of current conditions in the U.S. and global financial markets and the U.S. and global economy, legislators, the presidential administration and regulators have increased their focus on the regulation of the financial services industry. The Dodd-Frank Wall Street Reform and Consumer Protection Act, or the Dodd-Frank Act, became effective in July 2010. Although many provisions of the Dodd-Frank Act have delayed effectiveness or will not become effective until the relevant federal agencies issue new rules to implement the Dodd-Frank Act, the Dodd-Frank Act may nevertheless have a material adverse impact on the financial services industry as a whole and on our business, financial condition and results of operations. Accordingly, we cannot predict the effect the Dodd-Frank Act or implementing its regulations will have on our business, financial condition and results of operations.
Changes in laws or regulations governing our operations may adversely affect our business.
We and our portfolio companies are subject to regulation by laws at the local, state and federal levels. These laws and regulations, as well as their interpretation, may be changed from time to time. Accordingly, any change in these laws or regulations could have a material adverse effect on our business. See “Business—Regulation” for more information.
20
Table of Contents
Our board of directors may change our investment objectives, operating policies and strategies without prior notice or stockholder approval.
Our board of directors has the authority to modify or waive certain of our operating policies and strategies without prior notice and without stockholder approval (except as required by the 1940 Act). However, absent stockholder approval, under the 1940 Act we may not change the nature of our business so as to cease to be, or withdraw our election as, a BDC. We cannot predict the effect any changes to our current operating policies and strategies would have on our business, operating results and value of our stock. Nevertheless, the effects may adversely affect our business and impact our ability to make distributions.
RISKS RELATING TO THE ILLIQUID NATURE OF OUR PORTFOLIO ASSETS
We invest in illiquid assets, and our valuation procedures with respect to such assets may result in recording values that are materially different than the values we ultimately receive upon disposition of such assets.
All of our investments are recorded using broker or dealer quotes, or at fair value as determined in good faith by our board of directors. We expect that primarily most, if not all, of our investments (other than cash and cash equivalents) and the fair value of our Credit Facility will be classified as Level 3 under the Financial Accounting Standards Board, or FASB, Accounting Standards Codification, or ASC, 820, Fair Value Measurement. This means that our portfolio valuations will be based on unobservable inputs and our own assumptions about how market participants would price the asset or liability. We expect that inputs into the determination of fair value of our portfolio investments and Credit Facility borrowings will require significant management judgment or estimation. Even if observable market data are available, such information may be the result of consensus pricing information or broker quotes which include a disclaimer that the broker would not be held to such a price in an actual transaction. The non-binding nature of consensus pricing and/or quotes accompanied by disclaimer materially reduces the reliability of such information.
Determining fair value requires that judgment be applied to the specific facts and circumstances of each portfolio investment while employing a consistently applied valuation process for the types of investments we make. In determining fair value in good faith, we generally obtain financial and other information from portfolio companies, which may represent unaudited, projected or proforma financial information. Unlike banks, we are not permitted to provide a general reserve for anticipated loan losses; we are instead required by the 1940 Act to specifically fair value each individual investment on a quarterly basis. We record unrealized appreciation if we believe that the underlying portfolio company has appreciated in value. Likewise, we record unrealized depreciation if we believe that the underlying portfolio company has depreciated in value. As a result, there will be uncertainty as to the value of our portfolio investments.
We adjust quarterly the valuation of our portfolio to reflect our board of directors’ determination of the fair value of each investment in our portfolio. Any changes in fair value are recorded in the Consolidated Statement of Operations as net change in unrealized appreciation or depreciation.
At September 30, 2013, all our portfolio assets were recorded at fair value as approved in good faith by our board of directors. Our board of directors uses the services of one or more nationally recognized independent valuation firms to aid it in determining the fair value of these securities. The factors that may be considered in fair value pricing of our investments include the nature and realizable value of any collateral, the portfolio company’s ability to make payments and its earnings and cash flows, the markets in which the portfolio company does business, comparison to publicly traded companies and other relevant factors. Because valuations may fluctuate over short periods of time and may be based on estimates, our determinations of fair value may differ materially from the value received in an actual transaction. Additionally, valuations of private securities and private companies are inherently uncertain. Our NAV could be adversely affected if our determinations regarding the fair value of our investments were materially higher than the values that we ultimately realize upon the disposal of such securities.
The lack of liquidity in our investments may adversely affect our business.
We may acquire our investments directly from the issuer in privately negotiated transactions. Substantially all of these securities are subject to legal and other restrictions on resale or are otherwise less liquid than publicly traded securities. We typically exit our investments when the portfolio company has a liquidity event such as a sale, refinancing, or initial public offering of the company, but we are not required to do so.
The illiquidity of our investments may make it difficult or impossible for us to sell such investments if the need arises, particularly at times when the market for illiquid securities is substantially diminished. In addition, if we are required to liquidate all or a portion of our portfolio quickly, we may realize significantly less than the value at which we have previously recorded our investments, which could have a material adverse effect on our business, financial condition and results of operations. In addition, we may face other restrictions on our ability to liquidate an investment in a portfolio company to the extent that we have material non-public information regarding such portfolio company.
Securities purchased by us that are liquid at the time of purchase may subsequently become illiquid due to events relating to the issuer of the securities, market events, economic conditions or investor perceptions. Domestic and foreign markets are complex and interrelated, so that events in one sector of the world markets or economy, or in one geographical region, can reverberate and have materially negative consequences for other market, economic or regional sectors in a manner that may not be foreseen and which may materially harm our business.
A general disruption in the credit markets could materially damage our business.
We are susceptible to the risk of significant loss if we are forced to discount the value of our investments in order to provide liquidity to meet our liability maturities. Our borrowings under our Credit Facility are collateralized by the assets in our investment portfolio (excluding assets held by our SBIC Funds). A general disruption in the credit markets could result in a diminished appetite for our securities. In addition, with respect to over-the-counter traded securities, the continued viability of any over-the-counter secondary market depends on the continued willingness of dealers and other participants to purchase the securities.
If the fair value of our assets declines substantially, we may fail to maintain the asset coverage ratios stipulated by the 1940 Act, which could, in turn, cause us to lose our status as a BDC and materially impair our business operations. Our liquidity could be impaired further by an inability to access the capital markets or to draw down our Credit Facility. These situations may arise due to circumstances that we may be unable to control, such as a general disruption in the credit markets, a severe decline in the value of the U.S. dollar, a sharp economic downturn or an operational problem that affects third parties or us, and could materially damage our business.
We rely in part on our over-the-counter securities, which faced liquidity constraints under recent market conditions, to provide us with additional liquidity.
The market for other over-the-counter traded securities has weakened in the recent past as the viability of any over-the-counter secondary market depends on the continued willingness of dealers and other participants to purchase the securities.
21
Table of Contents
RISKS RELATED TO OUR INVESTMENTS
Our investments in prospective portfolio companies may be risky, and you could lose all or part of your investment.
We intend to invest primarily in senior secured loans, mezzanine debt and selected equity investments issued by U.S. middle-market companies.
| 1. | Senior Secured Loans: When we extend senior secured loans, which we define to include first lien debt, we will generally take a security interest in the available assets of these portfolio companies, including the equity interests of their subsidiaries, although this will not always be the case. We expect this security interest, if any, to help mitigate the risk that we will not be repaid. However, there is a risk that the collateral securing our loans may decrease in value over time, may be difficult to sell in a timely manner, may be difficult to appraise and may fluctuate in value based upon the success of the business and market conditions, including as a result of the inability of the portfolio company to raise additional capital. Also, in some circumstances, our lien could be subordinated to claims of other creditors. In addition, deterioration in a portfolio company’s financial condition and prospects, including its inability to raise additional capital, may be accompanied by deterioration in the value of the collateral for the loan. Consequently, the fact that a loan is secured does not guarantee that we will receive principal and interest payments according to the loan’s terms, or at all, or that we will be able to collect on the loan should we be forced to enforce our remedies. |
| 2. | Mezzanine Debt: Our mezzanine debt investments, which we define to include second lien secured and subordinated debt, will generally be subordinated to senior secured loans and will generally be unsecured. Our second lien debt is subordinated debt that benefits from a collateral interest in the borrower. As such, other creditors may rank senior to us in the event of insolvency. This may result in an above average amount of risk and volatility or a loss of principal. These investments may involve additional risks that could adversely affect our investment returns. To the extent interest payments associated with such debt are deferred, such debt may be subject to greater fluctuations in valuations, and such debt could subject us and our stockholders to non-cash income. Since we may not receive cash interest or principal prior to the maturity of some of our mezzanine debt investments, such investments may be of greater risk than cash paying loans. |
| 3. | Equity Investments: We have made and expect to continue to make select equity investments. In addition, when we invest in senior secured loans or mezzanine debt, we may acquire warrants to purchase equity investments from time to time. Our goal is ultimately to dispose of these equity investments and realize gains upon our disposition of such interests. However, the equity investments we receive may not appreciate in value and, in fact, may decline in value. Accordingly, we may not be able to realize gains from our equity investments, and any gains that we do realize on the disposition of any equity investments may not be sufficient to offset any other losses we experience. |
In addition, investing in middle-market companies involves a number of significant risks, including:
| • | companies may have limited financial resources and may be unable to meet their obligations under their debt securities that we hold, which may be accompanied by a deterioration in the value of any collateral and a reduction in the likelihood of us realizing any guarantees we may have obtained in connection with our investment; |
| • | they typically have shorter operating histories, narrower product lines and smaller market shares than larger businesses, which tend to render them more vulnerable to competitors’ actions and changing market conditions, as well as general economic downturns; |
| • | they are more likely to depend on the management talents and efforts of a small group of persons; therefore, the death, disability, resignation or termination of one or more of these persons could have a material adverse impact on our portfolio company and, in turn, on us; |
| • | they generally have less predictable operating results, may from time to time be parties to litigation, may be engaged in rapidly changing businesses with products subject to a substantial risk of obsolescence, and may require substantial additional capital to support their operations, finance expansion or maintain their competitive position. In addition, our executive officers, directors and our Investment Adviser may, in the ordinary course of business, be named as defendants in litigation arising from our investments in the portfolio companies; and |
| • | they may have difficulty accessing the capital markets to meet future capital needs, which may limit their ability to grow or to repay their outstanding indebtedness upon maturity. |
Under the 1940 Act we may invest up to 30% of our assets in investments that are not qualifying assets for business development companies under the 1940 Act. If we do not invest a sufficient portion of our assets in qualifying assets, we could be precluded from investing in assets that we deem to be attractive.
As a BDC, we may not acquire any asset other than qualifying assets, as defined under the 1940 Act, unless at the time the acquisition is made such qualifying assets represent at least 70% of the value of our total assets. Qualifying assets include investments in U.S. operating companies whose securities are not listed on a national securities exchange and companies listed on a national securities exchange subject to a maximum market capitalization of $250 million. Qualifying assets also include cash, cash equivalents, government securities and high quality debt securities maturing in one year or less from the time of investment.
We believe that most of our debt and equity investments do and will constitute qualifying assets. However, we may be precluded from investing in what we believe are attractive investments if such investments are not qualifying assets for purposes of the 1940 Act. If we do not invest a sufficient portion of our assets in qualifying assets, we will be prohibited from making any additional investment that is not a qualifying asset and could be forced to forgo attractive investment opportunities. Similarly, these rules could prevent us from making follow-on investments in existing portfolio companies (which could result in the dilution of our position) or could require us to dispose of investments at inappropriate times in order to comply with the 1940 Act. If we need to dispose of such investments quickly, it would be difficult to dispose of such investments on favorable terms. For example, we may have difficulty in finding a buyer and, even if we do find a buyer, we may have to sell the investments at a substantial loss.
We are a non-diversified investment company within the meaning of the 1940 Act, and therefore we generally are not limited with respect to the proportion of our assets that may be invested in securities of a single issuer.
We are classified as a non-diversified investment company within the meaning of the 1940 Act, which means that we are not limited by the 1940 Act with respect to the proportion of our assets that we may invest in securities of a single issuer, excluding limitations on investments in other investment companies. To the extent that we assume large positions in the securities of a small number of issuers, our NAV may fluctuate to a greater extent than that of a diversified investment company as a result of changes in the financial condition or the market’s assessment of the issuer. We may also be more susceptible to any single economic or regulatory occurrence than a diversified investment company. Beyond our income tax diversification requirements, we do not have fixed guidelines for diversification, and our investments could be concentrated in relatively few portfolio companies.
Economic recessions or downturns could impair our portfolio companies and harm our operating results.
Many of our portfolio companies are susceptible to economic slowdowns or recessions and may be unable to repay loans from us during these periods. Therefore, our non-performing assets are likely to increase, and the value of our portfolio is likely to decrease during these periods. Adverse economic conditions also may decrease the value of collateral securing some of our loans and the value of our equity investments. Economic slowdowns or recessions could lead to financial losses in our portfolio and a material decrease in revenues, net income and assets. Unfavorable economic conditions also could increase our funding costs, limit our access to the capital markets or result in a decision by lenders not to extend credit to us. These events could prevent us from increasing investments and materially harm our operating results.
22
Table of Contents
A portfolio company’s failure to satisfy financial or operating covenants imposed by us or other lenders could lead to defaults and potential termination of its loans and foreclosure on its secured assets, which could trigger cross-defaults under other agreements and jeopardize our portfolio company’s ability to meet its obligations under the debt securities that we hold. We may incur expenses to the extent necessary to seek recovery upon default or to negotiate new terms with a defaulting portfolio company. Depending on the facts and circumstances of our investments and the extent of our involvement in the management of a portfolio company, upon the bankruptcy of a portfolio company, a bankruptcy court may recharacterize our debt investments as equity investments and subordinate all or a portion of our claim to that of other creditors. This could occur regardless of how we may have structured our investment.
If we fail to make follow-on investments in our portfolio companies, this could materially impair the value of our portfolio.
Following an initial investment in a portfolio company, we may make additional investments in that portfolio company as “follow-on” investments, in order to:
| • | increase or maintain in whole or in part our equity ownership percentage; |
| • | exercise warrants, options or convertible securities that were acquired in the original or subsequent financing; or |
| • | attempt to preserve or enhance the value of our investment. |
We have the discretion to make any follow-on investments, subject to the availability of capital resources and regulatory considerations. We may elect not to make follow-on investments or otherwise lack sufficient funds to make those investments. Any failure to make follow-on investments may, in some circumstances, jeopardize the continued viability of a portfolio company and our initial investment, or may result in a missed opportunity for us to increase our participation in a successful operation. Even if we have sufficient capital to make a desired follow-on investment, we may elect not to make a follow-on investment because we may not want to increase our concentration of risk, because we prefer other opportunities, or because we are inhibited by compliance with BDC requirements or the desire to maintain our tax status.
Because we do not generally hold controlling equity interests in our portfolio companies, we are not in a position to exercise control over our portfolio companies or to prevent decisions by management of our portfolio companies that could decrease the value of our investments.
Because we do not generally have controlling equity positions in our portfolio companies, we are subject to the risk that a portfolio company may make business decisions with which we disagree, and the stockholders and management of a portfolio company may take risks or otherwise act in ways that are adverse to our interests. Due to the lack of liquidity for the debt and equity investments that we typically hold in our portfolio companies, we may not be able to dispose of our investments in the event we disagree with the actions of a portfolio company, and may therefore suffer a decrease in the value of our investments.
An investment strategy focused primarily on privately held companies, including controlled equity interests, presents certain challenges, including the lack of available or comparable information about these companies, a dependence on the talents and efforts of only a few key portfolio company personnel and a greater vulnerability to economic downturns.
We have invested and intend to continue to invest primarily in privately held companies. Generally, little public information exists about these companies, and we will rely on the ability of our Investment Adviser’s investment professionals to obtain adequate information to evaluate the potential returns from investing in these companies. If they are unable to uncover all material information about these companies, we may not make a fully informed investment decision, and we may lose value on our investments. Also, privately held companies frequently have less diverse product lines and smaller market presence than larger competitors. These factors could have a material adverse impact on our investment returns as compared to companies investing primarily in the securities of public companies.
Our portfolio companies may incur debt that ranks equally with, or senior to, our investments in such companies.
We invest primarily in senior secured loans, mezzanine debt and equity investments issued by our portfolio companies. The portfolio companies usually will have, or may be permitted to incur, other debt that ranks equally with, or senior to our investments. By their terms, such debt instruments may provide that the holders are entitled to receive payment of interest or principal on or before the dates on which we are entitled to receive payments in respect of the debt securities in which we invest. Also, in the event of insolvency, liquidation, dissolution, reorganization or bankruptcy of a portfolio company, holders of debt instruments ranking senior to our investment in that portfolio company would typically be entitled to receive payment in full before we receive any distribution in respect of our investment. After repaying such senior creditors, the portfolio company may not have any remaining assets to use for repaying its obligation to us. In the case of debt ranking equally with debt securities in which we invest, we would have to share on an equal basis any distributions with other creditors holding such debt in the event of an insolvency, liquidation, dissolution, reorganization or bankruptcy of the relevant portfolio company.
Our incentive fee may induce the Investment Adviser to make speculative investments.
The incentive fee payable by us to PennantPark Investment Advisers may create an incentive for PennantPark Investment Advisers to make investments on our behalf that are risky or more speculative than would be the case in the absence of such compensation arrangement. The incentive fee payable to our Investment Adviser is calculated based on a percentage of our return on invested capital. This may encourage our Investment Adviser to use leverage to increase the return on our investments. Under certain circumstances, the use of leverage may increase the likelihood of default, which would disfavor the holders of our common stock. In addition, our Investment Adviser will receive the incentive fee based, in part, upon net capital gains realized on our investments. Unlike that portion of the incentive fee based on income, there is no hurdle applicable to the portion of the incentive fee based on net capital gains. As a result, the Investment Adviser may have a tendency to invest more capital in investments that are likely to result in capital gains as compared to income producing securities. Such a practice could result in our investing in more speculative securities than would otherwise be the case, which could result in higher investment losses, particularly during economic downturns.
The part of our incentive fee payable by us to PennantPark Investment Advisers that relates to net investment income is computed and paid on income that has been accrued but that has not been received in cash. PennantPark Investment Advisers is not obligated to reimburse us for any such incentive fees even if we subsequently incur losses or never receive in cash the deferred income that was previously accrued. As a result, there is a risk that we will pay incentive fees with respect to income that we never receive in cash.
We may make investments that cause our stockholders to bear investment advisory fees and other expenses on such investments in addition to our management fees and expenses.
We may invest, to the extent permitted by law, in the securities and instruments of other investment companies and companies that would be investment companies but are excluded from the definition of an investment company provided in Section 3(c) of the 1940 Act. To the extent we so invest, we will bear our ratable share of any such investment company’s expenses, including management and performance fees. We will also remain obligated to pay investment advisory fees, consisting of a base management fee and incentive fees, to PennantPark Investment Advisers with respect to investments in the securities and instruments of other investment companies under our Investment Management Agreement. With respect to any such investments, each of our stockholders will bear his or her share of the investment advisory fees of PennantPark Investment Advisers as well as indirectly bearing the investment advisory fees and other expenses of any investment companies in which we invest.
23
Table of Contents
We may be obligated to pay our Investment Adviser incentive compensation even if we incur a loss.
Our Investment Adviser is entitled to incentive compensation for each fiscal quarter in an amount equal to a percentage of the excess of our investment income for that quarter (before deducting incentive compensation, net operating losses and certain other items) above a threshold return for that quarter. Our Pre-Incentive Fee Net Investment Income for incentive compensation purposes excludes realized and unrealized capital losses that we may incur in the fiscal quarter, even if such capital losses result in a net loss on our Consolidated Statement of Operations for that quarter. Thus, we may be required to pay our Investment Adviser incentive compensation for a fiscal quarter even if there is a decline in the value of our portfolio or we incur a net loss for that quarter.
The effect of global climate change may impact the operations of our portfolio companies.
There may be evidence of global climate change. Climate change creates physical and financial risk and some of our portfolio companies may be adversely affected by climate change. For example, the needs of customers of energy companies vary with weather conditions, primarily temperature and humidity. To the extent weather conditions are affected by climate change, energy use could increase or decrease depending on the duration and magnitude of any changes. Increases in the cost of energy could adversely affect the cost of operations of our portfolio companies if the use of energy products or services is material to their business. A decrease in energy use due to weather changes may affect some of our portfolio companies’ financial condition, through decreased revenues. Extreme weather conditions in general require more system backup, adding to costs, and can contribute to increased system stresses, including service interruptions.
Our investments in foreign securities may involve significant risks in addition to the risks inherent in U.S. investments.
Our investment strategy contemplates potential investments in securities of companies located outside of the United States. Investments in securities located outside of the United States would not be qualifying assets under Section 55(a) of the 1940 Act. Investing in companies located outside of the United States may expose us to additional risks not typically associated with investing in U.S. companies. These risks include changes in exchange control regulations, political and social instability, expropriation, imposition of foreign taxes, less liquid markets and less available information than is generally the case in the United States, higher transaction costs, less government supervision of exchanges, brokers and issuers, less developed bankruptcy laws, difficulty in enforcing contractual obligations, lack of uniform accounting and auditing standards and greater price volatility.
Although most of our investments will be U.S. dollar-denominated, any investments denominated in a foreign currency will be subject to the risk that the value of a particular currency will change in relation to one or more other currencies. Among the factors that may affect currency values are trade balances, the level of short-term interest rates, differences in relative values of similar assets in different currencies, long-term opportunities for investment and capital appreciation, and political developments. We may employ hedging techniques to minimize these risks, but we can offer no assurance that we will, in fact, hedge currency risk or, that if we do, such strategies will be effective.
We may expose ourselves to risks if we engage in hedging transactions.
If we engage in hedging transactions, we may expose ourselves to risks associated with such transactions. We may borrow under a credit facility in currencies selected to minimize our foreign currency exposure or, to the extent permitted by the 1940 Act and applicable commodities laws, use instruments such as forward contracts, currency options and interest rate swaps, caps, collars and floors to seek to hedge against fluctuations in the relative values of our portfolio positions from changes in currency exchange rates and market interest rates. Hedging against a decline in the values of our portfolio positions does not eliminate the possibility of fluctuations in the values of such positions or prevent losses if the values of such positions decline. However, such hedging can establish other positions designed to gain from those same developments, thereby offsetting the decline in the value of such portfolio positions. Such hedging transactions may also limit the opportunity for gain if the values of the underlying portfolio positions should increase. Moreover, it may not be possible to hedge against an exchange rate or interest rate fluctuation that is so generally anticipated that we are not able to enter into a hedging transaction at an acceptable price.
While we may enter into such transactions to seek to reduce currency exchange rate and interest rate risks, unanticipated changes in currency exchange rates or interest rates may result in poorer overall investment performance than if we had not engaged in any such hedging transactions. In addition, the degree of correlation between price movements of the instruments used in a hedging strategy and price movements in the portfolio positions being hedged may vary. Moreover, for a variety of reasons, we may not seek to establish a perfect correlation between such hedging instruments and the portfolio holdings being hedged. Any such imperfect correlation may prevent us from achieving the intended hedge and expose us to risk of loss. In addition, it may not be possible to hedge fully or perfectly against currency fluctuations affecting the value of securities denominated in non-U.S. currencies because the value of those securities is likely to fluctuate as a result of factors not related to currency fluctuations. Our ability to engage in hedging transactions may also be adversely affected by recent rules adopted by the Commodity Futures Trading Commission.
Any investments in distressed debt may not produce income and may require us to bear large expenses in order to protect and recover our investment.
Distressed debt investments may not produce income and may require us to bear certain additional expenses in order to protect and recover our investment. Therefore, to the extent we invest in distressed debt, our ability to achieve current income for our stockholders may be diminished. We also will be subject to significant uncertainty as to when and in what manner and for what value the distressed debt we invest will eventually be satisfied (e.g., through liquidation of the obligor’s assets, an exchange offer or plan of reorganization involving the distressed debt securities or a payment of some amount in satisfaction of the obligation). In addition, even if an exchange offer is made or plan of reorganization is adopted with respect to distressed debt we hold, there can be no assurance that the securities or other assets received by us in connection with such exchange offer or plan of reorganization will not have a lower value or income potential than may have been anticipated when the investment was made. Moreover, any securities received by us upon completion of an exchange offer or plan of reorganization may be restricted as to resale. If we participate in negotiations with respect to any exchange offer or plan of reorganization with respect to an issuer of distressed debt, we may be restricted from disposing of such securities.
RISKS RELATING TO AN INVESTMENT IN OUR COMMON STOCK
We may again obtain the approval of our stockholders to issue shares of our common stock at prices below the then current NAV per share of our common stock. If we receive such approval from stockholders in the future, we may again issue shares of our common stock at a price below the then current NAV per share of common stock. Any such issuance could materially dilute your interest in our common stock and reduce our NAV per share.
We may again obtain the approval of our stockholders to issue shares of our common stock at prices below the then current NAV per share of our common stock in one or more offerings for a twelve-month period. Such approval has allowed, and may again allow, us to access the capital markets in a way that we typically are unable to do as a result of restrictions that, absent stockholder approval, apply to BDCs under the 1940 Act.
Any sale or other issuance of shares of our common stock at a price below NAV per share has resulted and will continue to result in an immediate dilution to your interest in our common stock and a reduction of our NAV value per share. This dilution would occur as a result of a proportionately greater decrease in a stockholder’s interest in our earnings and assets and voting interest in us than the increase in our assets resulting from such issuance. Because the number of future shares of common stock that may be issued below our NAV per share and the price and timing of such issuances are not currently known, we cannot predict the actual dilutive effect of any such issuance. We also cannot determine the resulting reduction in our NAV per share of any such issuance at this time. We caution you that such effects may be material, and we undertake to describe all the material risks and dilutive effects of any offering that we make at a price below our then current NAV in the future in a prospectus supplement issued in connection with any such offering.
24
Table of Contents
There is a risk that our stockholders may not receive distributions or that our distributions may not grow over time.
We intend to make distributions on a quarterly basis to our stockholders out of assets legally available for distribution. We cannot assure you that we will achieve investment results that will allow us to make a specified level of cash distributions or year-to-year increases in cash distributions. In addition, due to the asset coverage ratio applicable to us as a BDC, we may be limited in our ability to make distributions. Further, if more stockholders opt to receive cash distributions rather than participate in our dividend reinvestment plan, we may be forced to liquidate some of our investments and raise cash in order to make distribution payments, which could materially harm our business. Finally, to the extent we make distributions to stockholders which include a return of capital, that portion of the distribution essentially constitutes a return of the stockholders’ investment. Although such return of capital may not be taxable, such distributions may increase an investor’s tax liability for capital gains upon the future sale of our common stock.
Investing in our shares may involve an above average degree of risk.
The investments we make in accordance with our investment objectives may result in a higher amount of risk and volatility than alternative investment options or loss of principal. Our investments in portfolio companies may be highly speculative and aggressive and therefore, an investment in our shares may not be suitable for someone with lower risk tolerance.
We may allocate the net proceeds from an offering of securities in ways with which you may not agree.
We have significant flexibility in investing the net proceeds of any offering of our securities and may use the net proceeds from an offering in ways with which you may not agree or for purposes other than those contemplated at the time of the offering.
Our shares may trade at discounts from NAV or at premiums that are unsustainable over the long term.
Shares of BDCs may trade at a market price that is less than the NAV that is attributable to those shares. Our shares have traded above and below our NAV. Our shares closed on the NASDAQ Global Select Market at $11.28 and $10.61 as of September 30, 2013 and 2012, respectively. Our NAV per share was $10.49 and $10.22 as of September 30, 2013 and 2012, respectively. The possibility that our shares of common stock will trade at a discount from NAV or at a premium that is unsustainable over the long term is separate and distinct from the risk that our NAV will decrease. It is not possible to predict whether our shares will trade at, above or below NAV in the future.
The market price of our common stock may fluctuate significantly.
The market price and liquidity of the market for shares of our common stock may be significantly affected by numerous factors, some of which are beyond our control and may not be directly related to our operating performance. These factors include:
| • | significant volatility in the market price and trading volume of securities of BDCs or other companies in our sector, which are not necessarily related to the operating performance of these companies; |
| • | changes in regulatory policies or tax guidelines, particularly with respect to RICs, BDCs or SBICs; |
| • | any loss of our BDC or RIC status or any loss of our subsidiaries’ SBIC licenses; |
| • | changes in earnings or variations in operating results; |
| • | changes in the value of our portfolio of investments; |
| • | any shortfall in revenue or net income or any increase in losses from levels expected by investors or securities analysts; |
| • | the inability of our Investment Adviser to employ additional experienced investment professionals or the departure of any of the Investment Adviser’s key personnel; |
| • | operating performance of companies comparable to us; |
| • | general economic trends and other external factors; |
| • | conversion features of subscription rights, warrants or convertible debt; and |
| • | loss of a major funding source. |
Since our initial listing on the NASDAQ Global Select Market, our shares of common stock have traded at a wide range of prices. We can offer no assurance that our shares of common stock will not display similar volatility in future periods.
We may be unable to invest the net proceeds raised from offerings on acceptable terms, which would harm our financial condition and operating results.
Until we identify new investment opportunities, we intend to either invest the net proceeds of future offerings in cash equivalents, U.S. government securities and other high-quality debt investments that mature in one year or less or use the net proceeds from such offerings to reduce then-outstanding obligations under our Credit Facility. We cannot assure you that we will be able to find enough appropriate investments that meet our investment criteria or that any investment we complete using the proceeds from an offering will produce a sufficient return.
The SBA also limits an SBIC’s choices to invest idle funds to the following types of securities:
| • | direct obligations of, or obligations guaranteed as to principal and interest by, the U.S. government, which mature within 15 months from the date of the investment; |
| • | repurchase agreements with federally insured institutions with a maturity of seven days or less (and the securities underlying the repurchase obligations must be direct obligations of or guaranteed by the federal government); |
| • | certificates of deposit with a maturity of one year or less, issued by a federally insured institution; or |
| • | a deposit account in a federally insured institution that is subject to a withdrawal restriction of one year or less. |
Sales of substantial amounts of our securities may have an adverse effect on the market price of our securities.
Sales of substantial amounts of our securities, or the availability of such securities for sale, could adversely affect the prevailing market prices for our securities. If this occurs and continues it could impair our ability to raise additional capital through the sale of securities should we desire to do so.
25
Table of Contents
You may have current tax liabilities on distributions you reinvest in our common stock.
Under the dividend reinvestment plan, if you own shares of our common stock registered in your own name, you will have all cash distributions automatically reinvested in additional shares of our common stock unless you opt out of the dividend reinvestment plan by delivering a written notice to the plan administrator prior to the record date of the next dividend or distribution. If you have not “opted out” of the dividend reinvestment plan, you will be deemed to have received, and for federal income tax purposes will be taxed on, the amount reinvested in our common stock to the extent the amount reinvested was not a tax-free return of capital. As a result, you may have to use funds from other sources to pay your federal income tax liability on the value of the common stock received. See “Management’s Discussion and Analysis of Financial Condition and Results of Operations—Liquidity and Capital Resources—Distributions” for more information.
There is a risk that our common stockholders may receive our stock as distributions in which case they may be required to pay taxes in excess of the cash they receive.
We may distribute our common stock as a dividend of our taxable income and a stockholder could receive a portion of the distributions declared and distributed by us in shares of our common stock with the remaining amount in cash. A stockholder will be considered to have recognized dividend income equal to the fair market value of the stock paid by us plus cash received with respect to such dividend. The total dividend declared would be taxable income to a stockholder even though he or she may only receive a relatively small portion of the dividend in cash to pay any taxes due on the dividend. We have not elected to distribute stock as a dividend but reserve the right to do so.
We incur significant costs as a result of being a publicly traded company.
As a publicly traded company, we incur legal, accounting and other expenses, including costs associated with the periodic reporting requirements applicable to a company whose securities are registered under the Exchange Act, as well as additional corporate governance requirements, including requirements under the Sarbanes Oxley Act, and other rules implemented by the SEC and the listing standards of the NASDAQ Stock Market LLC and NYSE.
Provisions of the Maryland General Corporation Law and of our charter and bylaws could deter takeover attempts and have an adverse impact on the price of our common stock.
The Maryland General Corporation Law, our charter and our bylaws contain provisions that may discourage, delay or make more difficult a change in control of us or the removal of our directors. We are subject to the Maryland Business Combination Act, the application of which is subject to any applicable requirements of the 1940 Act. Our board of directors has adopted a resolution exempting from the Business Combination Act any business combination between us and any other person, subject to prior approval of such business combination by our board, including approval by a majority of our disinterested directors. If the resolution exempting business combinations is repealed or our board does not approve a business combination, the Business Combination Act may discourage third parties from trying to acquire control of us and increase the difficulty of consummating such an offer.
In addition, our bylaws exempt from the Maryland Control Share Acquisition Act acquisitions of our common stock by any person. If we amend our bylaws to repeal the exemption from such act, it may make it more difficult for a third party to obtain control of us and increase the difficulty of consummating such an offer. Our bylaws require us to consult with the SEC staff before we repeal such exemption. Also, our charter provides for classifying our board of directors in three classes serving staggered three-year terms, and provisions of our charter authorize our board of directors to classify or reclassify shares of our stock in one or more classes or series, to cause the issuance of additional shares of our stock, and to amend our charter, without stockholder approval, to increase or decrease the number of shares of stock that we have authority to issue.
These anti-takeover provisions may inhibit a change of control in circumstances that could give our stockholders the opportunity to realize a premium over the market price for our common stock.
RISKS RELATING TO AN INVESTMENT IN OUR DEBT SECURITIES
The 2025 Notes are unsecured and therefore are effectively subordinated to any secured indebtedness we have currently incurred or may incur in the future.
The 2025 Notes are not secured by any of our assets or any of the assets of our subsidiaries. As a result, the 2025 Notes are effectively subordinated to any secured indebtedness we or our subsidiaries have currently incurred and may incur in the future (or any indebtedness that is initially unsecured to which we subsequently grant security) to the extent of the value of the assets securing such indebtedness. In any liquidation, dissolution, bankruptcy or other similar proceeding, the holders of any of our existing or future secured indebtedness and the secured indebtedness of our subsidiaries may assert rights against the assets pledged to secure that indebtedness in order to receive full payment of their indebtedness before the assets may be used to pay other creditors, including the holders of the 2025 Notes. As of September 30, 2013, we had $145.5 million outstanding under the Credit Facility. The Credit Facility is secured by substantially all of the assets in our portfolio (other than assets held by our SBIC Funds), and the indebtedness under the Credit Facility is therefore effectively senior in right of payment to the 2025 Notes to the extent of the value of such assets.
The 2025 Notes are structurally subordinated to the indebtedness and other liabilities of our subsidiaries.
The 2025 Notes are obligations exclusively of PennantPark Investment Corporation and not of any of our subsidiaries. None of our subsidiaries are or act as guarantors of the 2025 Notes and the 2025 Notes are not required to be guaranteed by any subsidiaries we may acquire or create in the future. Our secured indebtedness with respect to the SBA debentures is held through our SBIC Funds. The assets of any such subsidiaries are not directly available to satisfy the claims of our creditors, including holders of the 2025 Notes.
Except to the extent we are a creditor with recognized claims against our subsidiaries, all claims of creditors (including holders of preferred stock, if any, of our subsidiaries) will have priority over our equity interests in such subsidiaries (and therefore the claims of our creditors, including holders of the 2025 Notes) with respect to the assets of such subsidiaries. Even if we are recognized as a creditor of one or more of our subsidiaries, our claims would still be effectively subordinated to any security interests in the assets of any such subsidiary and to any indebtedness or other liabilities of any such subsidiary senior to our claims. Consequently, the 2025 Notes are structurally subordinated to all indebtedness and other liabilities (including trade payables) of our subsidiaries and any subsidiaries that we may in the future acquire or establish as financing vehicles or otherwise. As of September 30, 2013, SBIC LP had $150.0 million of SBA debentures outstanding. All of such indebtedness is structurally senior to the 2025 Notes. In addition, our subsidiaries may incur substantial additional indebtedness in the future, all of which would be structurally senior to the 2025 Notes.
The indenture under which the 2025 Notes were issued contains limited protection for holders of the 2025 Notes.
The indenture under which the 2025 Notes were issued offers limited protection to holders of the 2025 Notes. The terms of the indenture and the 2025 Notes do not restrict our or any of our subsidiaries’ ability to engage in, or otherwise be a party to, a variety of corporate transactions, circumstances or events that could have an adverse impact on investment in the 2025 Notes. In particular, the terms of the indenture and the 2025 Notes do not place any restrictions on our or our subsidiaries’ ability to:
| • | issue securities or otherwise incur additional indebtedness or other obligations, including (1) any indebtedness or other obligations that would be equal in right of payment to the 2025 Notes, (2) any indebtedness or other obligations that would be secured and therefore rank effectively senior in right of payment to the 2025 Notes to the extent of the values of the assets securing such debt, (3) indebtedness of ours that is guaranteed by one or more of our subsidiaries and which therefore would rank structurally senior to the 2025 Notes and (4) securities, indebtedness or other obligations issued or incurred by our subsidiaries that would be senior in right of payment to our equity interests in our subsidiaries and therefore would rank structurally senior in right of payment to the 2025 Notes with respect to the assets of our subsidiaries, in each case other than an incurrence of indebtedness or other obligation that would cause a violation of Section 18(a)(1)(A) as modified by Section 61(a)(1) of the 1940 Act or any successor provisions; |
26
Table of Contents
| • | pay distributions on, or purchase or redeem or make any payments in respect of, capital stock or other securities ranking junior in right of payment to the 2025 Notes; |
| • | sell assets (other than certain limited restrictions on our ability to consolidate, merge or sell all or substantially all of our assets); |
| • | enter into transactions with affiliates; |
| • | create liens (including liens on the shares of our subsidiaries) or enter into sale and leaseback transactions; |
| • | make investments; or |
| • | create restrictions on the payment of distributions or other amounts to us from our subsidiaries. |
In addition, the indenture does not require us to offer to purchase the 2025 Notes in connection with a change of control or any other event.
Furthermore, the terms of the indenture and the 2025 Notes do not protect holders of the 2025 Notes in the event that we experience changes (including significant adverse changes) in our financial condition, results of operations or credit ratings, as they do not require that we or our subsidiaries adhere to any financial tests or ratios or specified levels of net worth, revenues, income, cash flow or liquidity, except as required under the 1940 Act.
Our ability to recapitalize, incur additional debt and take a number of other actions that are not limited by the terms of the 2025 Notes may have important consequences for a holder of the 2025 Notes, including making it more difficult for us to satisfy our obligations with respect to the 2025 Notes or negatively affecting the trading value of the 2025 Notes.
Certain of our current debt instruments include more protections for their holders than the indenture and the 2025 Notes. In addition, other debt we issue or incur in the future could contain more protections for its holders than the indenture and the 2025 Notes, including additional covenants and events of default. The issuance or incurrence of any such debt with incremental protections could affect the market for and trading levels and prices of the 2025 Notes.
An active trading market for the 2025 Notes may not develop, which could limit the market price of the 2025 Notes or the ability of holders of the 2025 Notes to sell them. If a rating agency assigns the 2025 Notes a non-investment grade rating, the 2025 Notes may be subject to greater price volatility than similar securities without such a rating.
We have listed the 2025 Notes on the NYSE. However, we cannot provide any assurances that an active trading market will develop for the 2025 Notes or that holders of the 2025 Notes will be able to sell their 2025 Notes. The 2025 Notes may trade at a discount from their initial offering price depending on prevailing interest rates, the market for similar securities, our credit ratings, general economic conditions, our financial condition, performance and prospects and other factors. If a rating agency assigns the 2025 Notes a non-investment grade rating, the 2025 Notes may be subject to greater price volatility than securities of similar maturity without such a non-investment grade rating. The underwriters may discontinue any market-making in the 2025 Notes at any time at their sole discretion. Accordingly, we cannot assure holders of the 2025 Notes that a liquid trading market will develop for the 2025 Notes, that they will be able to sell their 2025 Notes at a particular time or that the price holders receive upon such sale will be favorable. To the extent an active trading market does not develop, the liquidity and trading price for the 2025 Notes may be harmed. Accordingly, holders of the 2025 Notes may be required to bear the financial risk of an investment in the 2025 Notes for an indefinite period of time.
FATCA withholding may apply to payments to certain foreign entities.
Payments made under the 2025 Notes to a foreign financial institution or non-financial foreign entity (including such an institution or entity acting as an intermediary) may be subject to a U.S. withholding tax of 30% under a law (commonly known as “FATCA”) that was enacted in 2010. This tax may apply to certain payments of interest as well as payments made upon maturity, redemption, or sale of the 2025 Notes, unless the foreign financial institution or non-financial foreign entity complies with certain information reporting, withholding, identification, certification and related requirements imposed by FATCA. Holders of the 2025 Notes should consult their own tax advisors regarding FATCA and how it may affect their investment in the 2025 Notes.
27
Table of Contents
| Item 1B. | Unresolved Staff Comments |
None.
| Item 2. | Properties |
As of September 30, 2013, we did not own any real estate or other physical properties materially important to our operation. We believe that the office facilities of the Investment Adviser and Administrator are suitable and adequate for our business as it is contemplated to be conducted.
| Item 3. | Legal Proceedings |
None of us, our Investment Adviser or our Administrator, is currently subject to any material legal proceedings, nor, to our knowledge, is any material legal proceeding threatened against us, or against our Investment Adviser or Administrator. From time to time, we, our Investment Adviser or Administrator may be a party to certain legal proceedings in the ordinary course of business, including proceedings relating to the enforcement of our rights under contracts with our portfolio companies. While the outcome of these legal proceedings cannot be predicted with certainty, we do not expect that these proceedings will have a material effect upon our financial condition or results of operations.
| Item 4. | Mine Safety Disclosures |
Not applicable.
28
Table of Contents
| Item 5. | Market for Registrant’s Common Equity, Related Stockholder Matters and Issuer Purchases of Equity Securities |
PRICE RANGE OF COMMON STOCK
Our common stock is traded on the NASDAQ Global Select Market under the symbol “PNNT.” The following table lists the high and low closing sale price for our common stock, the closing sale price as a premium or (discount) to our NAV per share and quarterly distributions per share since October 1, 2011.
| Closing Sales Price | ||||||||||||||||||||||||
| Period |
NAV(1) | High | Low | Premium / (Discount) of High Sales Price to NAV(2) |
Premium/(Discount) of Low Sales Price to NAV(2) |
Distributions Declared |
||||||||||||||||||
| Fiscal Year Ended September 30, 2013 |
||||||||||||||||||||||||
| Fourth quarter |
$ | 10.49 | $ | 11.83 | $ | 10.97 | 13% | 5% | $ | 0.28 | ||||||||||||||
| Third quarter |
10.43 | 11.83 | 10.45 | 13 | 0 | 0.28 | ||||||||||||||||||
| Second quarter |
10.50 | 12.18 | 11.01 | 16 | 5 | 0.28 | ||||||||||||||||||
| First quarter |
10.38 | 11.10 | 10.07 | 7 | (3) | 0.28 | ||||||||||||||||||
| Fiscal Year Ended September 30, 2012 |
||||||||||||||||||||||||
| Fourth quarter |
10.22 | 11.44 | 10.36 | 12 | 1 | 0.28 | ||||||||||||||||||
| Third quarter |
10.16 | 10.70 | 9.27 | 5 | (9) | 0.28 | ||||||||||||||||||
| Second quarter |
10.38 | 11.23 | 10.31 | 8 | (1) | 0.28 | ||||||||||||||||||
| First quarter |
10.19 | 11.02 | 8.57 | 8 | (16) | 0.28 | ||||||||||||||||||
| (1) | NAV per share is determined as of the last day in the relevant quarter and therefore may not reflect the NAV per share on the date of the high and low sales prices. The NAVs shown are based on outstanding shares at the end of each period. |
| (2) | Calculated as of the respective high or low closing sales price less NAV per share, divided by the quarter-end NAV per share. |
Shares of BDCs may trade at a market price both above and below the NAV that is attributable to those shares. Our shares have traded above and below our NAV. Our shares closed on the NASDAQ Global Select Market at $11.28 and $10.61 as of September 30, 2013 and 2012, respectively. Our NAV per share was $10.49 and $10.22 as of September 30, 2013 and 2012, respectively. The possibility that our shares of common stock will trade at a discount from NAV or at a premium that is unsustainable over the long term is separate and distinct from the risk that our NAV will decrease. It is not possible to predict whether our shares will trade at, above or below our NAV in the future. As of November 13, 2013, we had 12 stockholders of record.
29
Table of Contents
DISTRIBUTIONS
We intend to continue making quarterly distributions to our stockholders. The timing and amount of our quarterly distributions, if any, is determined by our board of directors. Any distributions to our stockholders are declared out of assets legally available for distribution. We monitor available net investment income to determine if a tax return of capital may occur for the fiscal year. To the extent our taxable earnings fall below the total amount of our distributions for any given fiscal year, a portion of those distributions may be deemed to be a tax return of capital to our common stockholders. The following table reflects the cash distributions, including distributions and returns of capital per share that we have declared on our common stock in the last two fiscal years (See Note 8 to our Consolidated Financial Statements):
| Record Dates |
Payment Dates |
Distributions Declared |
||||
| Fiscal year ended September 30, 2013 |
||||||
| September 20, 2013 |
October 1, 2013 | $ | 0.28 | |||
| June 21, 2013 |
July 1, 2013 | 0.28 | ||||
| March 22, 2013 |
April 1, 2013 | 0.28 | ||||
| December 21, 2012 |
January 2, 2013 | 0.28 | ||||
|
|
|
|||||
| Total |
$ | 1.12 | ||||
|
|
|
|||||
| Fiscal year ended September 30, 2012 |
||||||
| September 20, 2012 |
October 1, 2012 | $ | 0.28 | |||
| June 21, 2012 |
July 2, 2012 | 0.28 | ||||
| March 22, 2012 |
April 2, 2012 | 0.28 | ||||
| December 23, 2011 |
January 3, 2012 | 0.28 | ||||
|
|
|
|||||
| Total |
$ | 1.12 | ||||
|
|
|
|||||
In January 2014, a Form 1099-DIV will be sent to stockholders that will state the amount and composition of distributions and provide information with respect to appropriate tax treatment of our distributions.
We maintain an “opt out” dividend reinvestment plan for our common stockholders. As a result, if we declare a dividend or other distribution, then stockholders’ cash distributions will be automatically reinvested in additional shares of our common stock, unless they specifically “opt out” of the dividend reinvestment plan so as to receive cash distributions.
We may not be able to achieve operating results that will allow us to make distributions at a specific level or to increase the amount of these distributions from time to time. In addition, we may be limited in our ability to make distributions due to the asset coverage ratio for borrowings when applicable to us as a BDC under the 1940 Act and due to provisions in future credit facilities. If we do not distribute a certain percentage of our income annually, we will suffer adverse tax consequences, including possible loss of our RIC status. We cannot assure stockholders that they will receive any distributions or distributions at a particular level.
Sale of Unregistered Securities
We did not engage in any sales of unregistered securities during the fiscal year ended September 30, 2013.
30
Table of Contents
Stock Performance Graph
This graph compares the return on our common stock with that of the Standard & Poor’s 500 Stock Index and the Russell 2000 Financial Services Index, for the last five fiscal years. The graph assumes that, on September 30, 2008, a person invested $100 in each of our common stock, the S&P 500 Index, and the Russell 2000 Financial Services Index. The graph measures total stockholder return, which takes into account both changes in stock price and distributions. It assumes that distributions paid are invested in like securities.
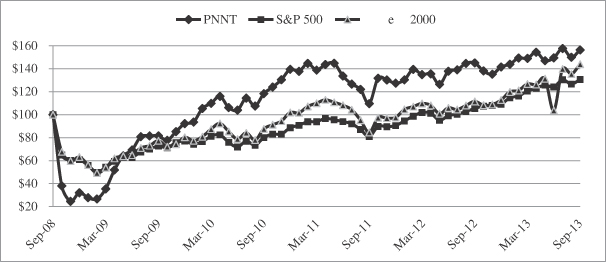
The graph and other information furnished under this Part II Item 5 of this Report shall not be deemed to be “soliciting material” or to be “filed” with the SEC or subject to Regulation 14A or 14C, or to the liabilities of Section 18 of the Exchange Act. The stock price performance included in the above graph is not necessarily indicative of future stock price performance.
31
Table of Contents
| Item 6. | Selected Financial Data |
We have derived the financial information below from our audited and unaudited financial data and, in the opinion of management, such information reflects all adjustments (consisting of normal recurring adjustments) that are necessary to present fairly the results of such years. The Consolidated Statement of Operations data, Per share data and Consolidated Statement of Assets and Liabilities data for the prior five fiscal years are derived from our Consolidated Financial Statements which have been audited by KPMG LLP, an independent registered public accounting firm. These selected financial data should be read in conjunction with our Consolidated Financial Statements and related notes thereto and “Management’s Discussion and Analysis of Financial Condition and Results of Operations.”
| For the years ended September 30, | ||||||||||||||||||||
| 2013 | 2012 | 2011 | 2010 | 2009 | ||||||||||||||||
| (Dollar amounts in thousands, except per share data) | ||||||||||||||||||||
| Consolidated Statement of Operations data: |
||||||||||||||||||||
| Total investment income |
$ | 129,187 | $ | 113,392 | $ | 91,738 | $ | 60,140 | $ | 45,119 | ||||||||||
| Total expenses |
62,189 | 56,323 | 39,093 | 28,065 | 22,400 | |||||||||||||||
| Net investment income |
66,998 | 57,069 | 52,645 | 32,075 | 22,719 | |||||||||||||||
| Net realized and unrealized gain (loss) |
24,780 | 6,284 | (42,382 | ) | (15,539 | ) | 13,083 | |||||||||||||
| Net increase in net assets resulting from operations |
91,778 | 63,353 | 10,263 | 16,535 | 35,802 | |||||||||||||||
| Per share data: |
||||||||||||||||||||
| Net asset value (at year end) |
10.49 | 10.22 | 10.13 | 10.69 | 11.85 | |||||||||||||||
| Net investment income(1) |
1.01 | 1.08 | 1.25 | 1.09 | 1.08 | |||||||||||||||
| Net realized and unrealized gain (loss)(1) |
0.38 | 0.12 | (1.01 | ) | (0.53 | ) | 0.62 | |||||||||||||
| Net increase in net assets resulting from operations(1) |
1.39 | 1.20 | 0.24 | 0.56 | 1.70 | |||||||||||||||
| Distributions declared(1),(2) |
1.12 | 1.13 | 1.10 | 1.09 | 0.96 | |||||||||||||||
| Consolidated Statement of Assets and Liabilities data: |
||||||||||||||||||||
| Total assets |
1,153,327 | 1,018,968 | 928,738 | 711,494 | 512,381 | |||||||||||||||
| Total investment portfolio |
1,078,176 | 990,480 | 827,549 | 664,724 | 469,760 | |||||||||||||||
| Borrowings outstanding(3) |
363,900 | 294,452 | 388,792 | 233,641 | 175,475 | |||||||||||||||
| Total net asset value |
697,506 | 669,717 | 462,657 | 386,575 | 300,580 | |||||||||||||||
| Other data: |
||||||||||||||||||||
| Total return(4) |
17.37 | % | 28.71 | % | (7.37 | )% | 44.79 | % | 30.39 | % | ||||||||||
| Number of portfolio companies (at year end)(5) |
61 | 54 | 48 | 43 | 42 | |||||||||||||||
| Yield on debt portfolio (at year end)(5) |
13.0 | % | 13.2 | % | 13.3 | % | 12.7 | % | 11.4 | % | ||||||||||
| (1) | Based on the weighted average shares outstanding for the respective years. |
| (2) | Based on taxable income calculated in accordance with income tax regulations, which may differ from amounts determined under GAAP. |
| (3) | At fair value. |
| (4) | Based on the change in market price per share during the periods and takes into account distributions, if any, reinvested in accordance with our dividend reinvestment plan. |
| (5) | Unaudited. |
32
Table of Contents
| Item 7. | MANAGEMENT’S DISCUSSION AND ANALYSIS OF FINANCIAL CONDITION AND RESULTS OF OPERATIONS |
FORWARD-LOOKING STATEMENTS
This Report, including Management’s Discussion and Analysis of Financial Condition and Results of Operations, contains statements that constitute forward-looking statements, which relate to us and our consolidated subsidiaries regarding future events or our future performance or future financial condition. These forward-looking statements are not historical facts, but rather are based on current expectations, estimates and projections about our Company, our industry, our beliefs and our assumptions. The forward-looking statements contained in this Report involve risks and uncertainties, including statements as to:
| • | our future operating results; |
| • | our business prospects and the prospects of our prospective portfolio companies; |
| • | the dependence of our future success on the general economy and its impact on the industries in which we invest; |
| • | the impact of a protracted decline in the liquidity of credit markets on our business; |
| • | the impact of investments that we expect to make; |
| • | the impact of fluctuations in interest rates on our business and our portfolio companies; |
| • | our contractual arrangements and relationships with third parties; |
| • | the valuation of our investments in portfolio companies, particularly those having no liquid trading market; |
| • | the ability of our prospective portfolio companies to achieve their objectives; |
| • | our expected financings and investments; |
| • | the adequacy of our cash resources and working capital; |
| • | the timing of cash flows, if any, from the operations of our prospective portfolio companies; |
| • | the ability of our Investment Adviser to locate suitable investments for us and to monitor and administer our investments; and |
| • | the impact of future legislation and regulation on our business and our portfolio companies. |
We use words such as “anticipates,” “believes,” “expects,” “intends,” “seeks,” “plans,” “estimates” and similar expressions to identify forward-looking statements. You should not place undue influence on the forward looking statements as our actual results could differ materially from those projected in the forward-looking statements for any reason, including the factors in “Risk Factors” and elsewhere in this Report.
Although we believe that the assumptions on which these forward-looking statements are based are reasonable, any of those assumptions could prove to be inaccurate, and, as a result, the forward-looking statements based on those assumptions also could be inaccurate. Important assumptions include our ability to originate new loans and investments, certain margins and levels of profitability and the availability of additional capital. In light of these and other uncertainties, the inclusion of a projection or forward-looking statement in this Report should not be regarded as a representation by us that our plans and objectives will be achieved.
We have based the forward-looking statements included in this Report on information available to us on the date of this Report, and we assume no obligation to update any such forward-looking statements. Although we undertake no obligation to revise or update any forward-looking statements in this Report, whether as a result of new information, future events or otherwise, you are advised to consult any additional disclosures that we may make directly to you or through reports that we in the future may file with the SEC, including reports on Form 10-Q/K and current reports on Form 8-K.
You should understand that under Section 27A(b)(2)(B) of the Securities Act and Section 21E(b)(2)(B) of the Exchange Act, the “safe harbor” provisions of the Private Securities Litigation Reform Act of 1995 do not apply to forward-looking statements made in periodic reports we file under the Exchange Act.
The following analysis of our financial condition and results of operations should be read in conjunction with our Consolidated Financial Statements and the related notes thereto contained elsewhere in this Report.
Overview
PennantPark Investment Corporation is a BDC whose objectives are to generate both current income and capital appreciation through debt and equity investments primarily in U.S. middle-market companies in the form of senior secured loans, mezzanine debt and equity investments.
We believe middle-market companies offer attractive risk-reward to investors due to the limited amount of capital available for such companies. We seek to create a diversified portfolio that includes senior secured loans, mezzanine debt and equity investments by investing approximately $10 million to $50 million of capital, on average, in the securities of middle-market companies. We expect this investment size to vary proportionately with the size of our capital base. We use the term “middle-market” to refer to companies with annual revenues between $50 million and $1 billion. The companies in which we invest are typically highly leveraged, and, in most cases, are not rated by national rating agencies. If such companies were rated, we believe that they would typically receive a rating below investment grade (between BB and CCC under the Standard & Poor’s system) from the national rating agencies. Our debt investments may generally range in maturity from three to ten years and are made to U.S. and, to a limited extent, non-U.S. corporations, partnerships and other business entities which operate in various industries and geographical regions.
Our investment activity depends on many factors, including the amount of debt and equity capital available to middle-market companies, the level of merger and acquisition activity for such companies, the general economic environment and the competitive environment for the types of investments we make. We have used, and expect to continue to use our Credit Facility, SBA debentures, proceeds from the rotation of our portfolio and proceeds from public and private offerings of securities to finance our investment objectives.
Organization and Structure of PennantPark Investment Corporation
PennantPark Investment Corporation, a Maryland corporation organized in January 2007, is a closed-end, externally managed, non-diversified investment company that has elected to be treated as a BDC under the 1940 Act. In addition, for federal income tax purposes we have elected to be treated, and intend to qualify annually, as a RIC under the Code.
33
Table of Contents
Our wholly owned subsidiaries, SBIC LP and SBIC II, were organized as Delaware limited partnerships in May 2010 and July 2012, respectively. SBIC LP and SBIC II received licenses from the SBA to operate as SBICs, under Section 301(c) of the Small Business Investment Act of 1958, as amended, or the 1958 Act, in July 2010 and January 2013, respectively. Our SBIC Funds’ objectives are to generate both current income and capital appreciation through debt and equity investments generally by investing with us in SBA eligible businesses that meet the investment criteria used by PennantPark Investment.
Our investment activities are managed by the Investment Adviser. Under our Investment Management Agreement, we have agreed to pay our Investment Adviser an annual base management fee based on our average adjusted gross assets as well as an incentive fee based on our investment performance. PennantPark Investment, through the Investment Adviser, provides similar services to our SBIC Funds under their investment management agreements. Our SBIC Funds investment management agreements do not affect the management and incentive fees on a consolidated basis. We have also entered into an Administration Agreement with the Administrator. Under our Administration Agreement, we have agreed to reimburse the Administrator for our allocable portion of overhead and other expenses incurred by the Administrator in performing its obligations under our Administration Agreement, including rent and our allocable portion of the costs of compensation and related expenses of our Chief Compliance Officer, Chief Financial Officer and their respective staffs. PennantPark Investment, through the Administrator, provides similar services to our SBIC Funds under their administration agreements with us. Our board of directors, a majority of whom are independent of us, supervises our activities, and the Investment Adviser manages our day-to-day activities.
Revenues
We generate revenue in the form of interest income on the debt securities we hold and capital gains and distributions, if any, on investment securities that we may acquire in portfolio companies. Our debt investments, whether in the form of senior secured loans or mezzanine debt, typically have terms of three to ten years and bear interest at a fixed or a floating rate. Interest on debt securities is generally payable quarterly or semiannually. In some cases, some of our investments provide for deferred interest payments and PIK interest. The principal amount of the debt securities and any accrued but unpaid interest generally becomes due at the maturity date. In addition, we may generate revenue in the form of amendment, commitment, origination, structuring or diligence fees, fees for providing managerial assistance and possibly consulting fees. Loan origination fees, OID, and market discount or premium are capitalized, and we accrete or amortize such amounts as income. We record prepayment penalties on loans and debt securities as income. Dividend income, if any, is recognized on an accrual basis on the ex-dividend date to the extent that we expect to collect such amounts.
Expenses
Our primary operating expenses include the payment of Management Fees to our Investment Adviser, our allocable portion of overhead under our Administration Agreement and other operating costs as detailed below. Our management fee compensates our Investment Adviser for its work in identifying, evaluating, negotiating, consummating and monitoring our investments. Additionally, we pay interest expense on the outstanding debt and unused commitment fees under our various debt facilities. We bear all other direct or indirect costs and expenses of our operations and transactions, including:
| • | the cost of calculating our NAV, including the cost of any third-party valuation services; |
| • | the cost of effecting sales and repurchases of shares of our common stock and other securities; |
| • | fees payable to third parties relating to, or associated with, making investments, including fees and expenses associated with performing due diligence and reviews of prospective investments or complimentary businesses; |
| • | expenses incurred by the Investment Adviser in performing due diligence and reviews of investments; |
| • | transfer agent and custodial fees; |
| • | fees and expenses associated with marketing efforts; |
| • | federal and state registration fees and any exchange listing fees; |
| • | federal, state and local taxes; |
| • | independent directors’ fees and expenses; |
| • | brokerage commissions; |
| • | fidelity bond, directors and officers, errors and omissions liability insurance and other insurance premiums; |
| • | direct costs such as printing, mailing, long distance telephone and staff; |
| • | fees and expenses associated with independent audits and outside legal costs; |
| • | costs associated with our reporting and compliance obligations under the 1940 Act, the 1958 Act and applicable federal and state securities laws; and |
| • | all other expenses incurred by either the Administrator or us in connection with administering our business, including payments under our Administration Agreement that will be based upon our allocable portion of overhead, and other expenses incurred by the Administrator in performing its obligations under our Administration Agreement, including rent and our allocable portion of the costs of compensation and related expenses of our Chief Compliance Officer, Chief Financial Officer and their respective staffs. |
During periods of asset growth, we expect our general and administrative expenses to be relatively stable or to decline as a percentage of total assets and increase during periods of asset declines. Incentive fees, interest expense and costs relating to future offerings of securities would be additive to the expenses described above.
PORTFOLIO AND INVESTMENT ACTIVITY
As of September 30, 2013, our portfolio totaled $1,078.2 million and consisted of $299.5 million of senior secured loans, $357.5 million of second lien secured debt, $302.5 million of subordinated debt and $118.7 million of preferred and common equity investments. Our debt portfolio consisted of 52% fixed-rate and 48% variable-rate investments (including 44% with a LIBOR or prime floor). Our overall portfolio consisted of 61 companies with an average investment size of $17.7 million, had a weighted average yield on debt investments of 13.0% and was invested 28% in senior secured loans, 33% in second lien secured debt, 28% in subordinated debt and 11% in preferred and common equity investments.
34
Table of Contents
As of September 30, 2012, our portfolio totaled $990.5 million and consisted of $291.7 million of senior secured loans, $191.3 million of second lien secured debt, $400.7 million of subordinated debt and $106.8 million of preferred and common equity investments. Our debt portfolio consisted of 69% fixed-rate and 31% variable-rate investments (including 26% with a LIBOR or prime floor). As of September 30, 2012, we had one non-accrual debt investment, representing 3.2% and 1.1% of our overall portfolio on a cost and fair value basis, respectively. Our overall portfolio consisted of 54 companies with an average investment size of $18.3 million, had a weighted average yield on debt investments of 13.2% and was invested 30% in senior secured loans, 19% in second lien secured debt, 40% in subordinated debt and 11% in preferred and common equity investments.
For the fiscal year ended September 30, 2013, we purchased $504.4 million of investments in 14 new and 26 existing portfolio companies with a weighted average yield of 12.7% on debt investments. This compares to purchasing $328.3 million in 13 new and 17 existing portfolio companies with an overall weighted average yield of 13.3% on debt investments, and purchasing $479.7 million in 17 new and 11 existing portfolio companies with an overall weighted average yield of 13.7% on debt investments for the fiscal years ended September 30, 2012 and 2011, respectively.
For the fiscal year ended September 30, 2013, sales and repayments generated proceeds of $437.1 million. For the fiscal years ended September 30, 2012 and 2011, sales and repayments generated proceeds of $201.7 million and $304.0 million, respectively.
CRITICAL ACCOUNTING POLICIES
The discussion of our financial condition and results of operations are based upon our Consolidated Financial Statements, which have been prepared in accordance with GAAP. The preparation of these Consolidated Financial Statements requires management to make estimates and assumptions that affect the reported amounts of assets, liabilities, revenues and expenses during the reporting period. Actual results could differ from these estimates. We may reclassify certain prior period amounts to conform to the current period presentation. We have eliminated all intercompany balances and transactions. References to ASC serve as a single source of literature. Subsequent events are evaluated and disclosed as appropriate for events occurring through the date the Consolidated Financial Statements are issued. Changes in the economic and regulatory environment, financial markets and any other parameters used in determining such estimates could cause actual results to differ. In addition to the discussion below, we describe our critical accounting policies in the notes to our Consolidated Financial Statements.
Valuation of Portfolio Investments
Our investments generally consist of illiquid securities, including debt and equity investments. Our board of directors generally uses market quotations to assess the value of our investments for which market quotations are readily available. We obtain these market values from independent pricing services or at the bid prices obtained from at least two brokers or dealers, if available, or otherwise by a principal market maker or a primary market dealer. The Investment Adviser assesses the source and reliability of bids from brokers or dealers. If our board of directors has a bona fide reason to believe any such market quote does not reflect the fair value of an investment, it may independently value such investments by using the valuation procedure that it uses with respect to assets for which market quotations are not readily available. Investments of sufficient credit quality purchased within 60 days of maturity are valued at cost plus accreted discount, or minus amortized premium, which approximates fair value.
We expect that there may not be readily available market values for many of our investments which are or will be in our portfolio, and we value such investments at fair value as determined in good faith by or under the direction of our board of directors using a documented valuation policy described in this Report and a consistently applied valuation process. With respect to investments for which there is no readily available market value, the factors that the board of directors may take into account in pricing our investments at fair value include, as relevant, the nature and realizable value of any collateral, the portfolio company’s ability to make payments and its earnings and discounted cash flow, the markets in which the portfolio company does business, comparison to publicly traded securities and other relevant factors. When an external event such as a purchase transaction, public offering or subsequent equity sale occurs, we consider the pricing indicated by the external event to corroborate or revise our valuation. Due to the inherent uncertainty of determining the fair value of investments that do not have a readily available market value, the price used in an actual transaction may differ from our valuation and the difference could be material.
With respect to investments for which market quotations are not readily available, or for which market quotations are deemed not reflective of the fair value, our board of directors undertakes a multi-step valuation process each quarter, as described below:
| (1) | Our quarterly valuation process begins with each portfolio company or investment being initially valued by the investment professionals of our Investment Adviser responsible for the portfolio investment; |
| (2) | Preliminary valuation conclusions are then documented and discussed with the management of our Investment Adviser; |
| (3) | Our board of directors also engages independent valuation firms to conduct independent appraisals of our investments for which market quotations are not readily available or are readily available but deemed not reflective of the fair value of an investment. The independent valuation firms review management’s preliminary valuations in light of its own independent assessment and also in light of any market quotations obtained from an independent pricing service, broker, dealer or market maker; |
| (4) | The audit committee of our board of directors reviews the preliminary valuations of the Investment Adviser and those of the independent valuation firms on a quarterly basis, periodically assesses the valuation methodologies of the independent valuation firms, and responds to and supplements the valuation recommendations of the independent valuation firms to reflect any comments; and |
| (5) | Our board of directors discusses the valuations and determines the fair value of each investment in our portfolio in good faith, based on the input of our Investment Adviser, the independent valuation firms and the audit committee. |
Fair value, as defined under ASC 820, is the price that we would receive upon selling an investment or pay to transfer a liability in an orderly transaction to a market participant in the principal or most advantageous market for the investment or liability. ASC 820 emphasizes that valuation techniques maximize the use of observable market inputs and minimize the use of unobservable inputs. Inputs refer broadly to the assumptions that market participants would use in pricing an asset or liability, including assumptions about risk. Inputs may be observable or unobservable. Observable inputs reflect the assumptions market participants would use in pricing an asset or liability based on market data obtained from sources independent of us. Unobservable inputs reflect the assumptions market participants would use in pricing an asset or liability based on the best information available to us on the reporting period date.
ASC 820 classifies the inputs used to measure these fair values into the following hierarchies:
| Level 1: | Inputs that are quoted prices (unadjusted) in active markets for identical assets or liabilities, accessible by us at the measurement date. | |
| Level 2: | Inputs that are quoted prices for similar assets or liabilities in active markets, or that are quoted prices for identical or similar assets or liabilities in markets that are not active and inputs that are observable for the asset or liability, either directly or indirectly, for substantially the full term, if applicable, of the financial instrument. | |
| Level 3: | Inputs that are unobservable for an asset or liability because they are based on our own assumptions about how market participants would price the asset or liability. | |
35
Table of Contents
A financial instrument’s categorization within the valuation hierarchy is based upon the lowest level of input that is significant to the fair value measurement. Generally, most of our investments and our Credit Facility are classified as Level 3. Due to the inherent uncertainty of determining the fair value of investments that do not have a readily available market value, the price used in an actual transaction may be different than our valuation and those differences may be material.
In addition to using the above inputs in cash equivalents, investments, the 2025 Notes and our Credit Facility valuations, we employ the valuation policy approved by our board of directors that is consistent with ASC 820. Consistent with our valuation policy, we evaluate the source of inputs, including any markets in which our investments are trading, in determining fair value.
We adopted ASC 825-10, which provides companies with an option to report selected financial assets and liabilities at fair value, and made an irrevocable election to apply ASC 825-10 to our Credit Facility and our 2025 Notes. We elected to use the fair value option for the Credit Facility and the 2025 Notes to align the measurement attributes of both our assets and liabilities while mitigating volatility in earnings from using different measurement attributes. Due to that election and in accordance with GAAP, we incurred $2.8 million, $5.4 million and zero debt issuance costs during the year ended September 30, 2013, 2012 and 2011, respectively. ASC 825-10 establishes presentation and disclosure requirements designed to facilitate comparisons between companies that choose different measurement attributes for similar types of assets and liabilities and to more easily understand the effect on earnings of a company’s choice to use fair value. ASC 825-10 also requires entities to display the fair value of the selected assets and liabilities on the face of the Consolidated Statement of Assets and Liabilities and changes in fair value of the Credit Facility and 2025 Notes are reported in our Consolidated Statement of Operations. We elected not to apply ASC 825-10 to any other financial assets or liabilities, including the SBA debentures. For the fiscal years ended September 30, 2013 and 2012, our Credit Facility and 2025 Notes had a net change in unrealized depreciation (appreciation) of $2.3 million and $(1.6) million, respectively. As of September 30, 2013 and 2012, net unrealized depreciation on our Credit Facility and 2025 Notes totaled $2.8 million and $0.5 million, respectively. We use a nationally recognized independent valuation service to fair value our Credit Facility in a manner consistent with the valuation process that the board of directors approves to value investments. Our 2025 Notes trade on the NYSE and we use the closing price on the exchange to determine their fair value.
Revenue Recognition
We record interest income on an accrual basis to the extent that we expect to collect such amounts. For loans and debt investments with contractual PIK interest which represents contractual interest accrued and added to the loan balance that generally becomes due at maturity, we will generally not accrue PIK interest if the portfolio company valuation indicates that such PIK interest is not collectible. We do not accrue as a receivable interest on loans and debt investments if we determine that it is probable that we will not be able to collect such interest. Loan origination fees, OID, market discount or premium and deferred financing costs are capitalized and we then accrete or amortize such amounts as interest income or expense, as applicable, using the effective interest method. We record contractual prepayment penalties on loans and debt investments as income. Dividend income, if any, is recognized on an accrual basis on the ex-dividend date to the extent that we expect to collect such amounts.
Net Realized Gains or Losses and Net Change in Unrealized Appreciation or Depreciation
We measure realized gains or losses by the difference between the net proceeds from the repayment or sale and the amortized cost basis of the investment, using the specific identification method, without regard to unrealized appreciation or depreciation previously recognized, but considering unamortized upfront fees and prepayment penalties. Net change in unrealized appreciation or depreciation reflects the change in portfolio investment values during the reporting period, including any reversal of previously recorded unrealized appreciation or depreciation, when gains or losses are realized.
Payment-in-Kind Interest or PIK
We have investments in our portfolio which contain a PIK interest provision. PIK interest is added to the principal balance of the investment and is recorded as income. For us to maintain our status as a RIC, substantially all of this income must be paid out to stockholders in the form of distributions, even though we have not collected any cash with respect to PIK securities.
Federal Income Taxes
We have elected to be taxed, and intend to qualify annually to maintain our election to be taxed, as a RIC under Subchapter M of the Code. To maintain our RIC tax election, we must, among other requirements, meet certain source-of-income and quarterly asset diversification requirements. We also must annually distribute at least 90% of the sum of our net ordinary income and realized net short-term capital gains in excess of realized net long-term capital losses, if any, out of the assets legally available for distribution. Although not required for us to maintain our RIC tax status, in order to preclude the imposition of a 4% nondeductible federal excise tax imposed on RICs, we must distribute during each calendar year an amount at least equal to the sum of (1) 98% of our net ordinary income for the calendar year, (2) 98.2% of the sum of our net capital gains income (i.e. the excess, if any, of our capital gains over capital losses) for the one-year period ending on October 31 of the calendar year and (3) the sum of any net ordinary income plus net capital gain income for preceding years that were not distributed during such years. In addition, although we may distribute realized net capital gains (i.e., net long-term capital gains in excess of short-term capital losses), if any, at least annually, out of the assets legally available for such distributions in the manner described above, we have retained and may continue to retain such net capital gains or net ordinary income to provide us with additional liquidity.
Because federal income tax regulations differ from GAAP, distributions in accordance with tax regulations may differ from net investment income and realized gains recognized for financial reporting purposes. Differences may be permanent or temporary. Permanent differences are reclassified among capital accounts in the Consolidated Financial Statements to reflect their tax character. Temporary differences arise when certain items of income, expense, gain or loss are recognized at some time in the future.
RESULTS OF OPERATIONS
Set forth below are our results of operations for the fiscal years ended September 30, 2013, 2012 and 2011.
Investment Income
Investment income for the fiscal year ended September 30, 2013 was $129.2 million and was attributable to $38.9 million from senior secured loan investments, $31.9 million from second lien secured debt investments, $55.1 million from subordinated debt investments and $3.3 million from preferred and common equity. The increase in investment income over the prior year was due to the growth of our portfolio which was driven by reinvesting proceeds from the rotation in our portfolio and the investment of the proceeds from our equity and debt offerings.
Investment income for the fiscal year ended September 30, 2012 was $113.4 million and was primarily attributable to $42.8 million from senior secured loan investments, $21.2 million from second lien secured debt investments, and $49.4 million from subordinated debt investments. The increase in investment income over the prior year was due to the growth of our portfolio which was also driven by the investment of the proceeds from our equity offerings.
Investment income for the fiscal year ended September 30, 2011 was $91.7 million and was primarily attributable to $37.1 million from senior secured loan investments, $15.2 million from second lien secured debt investments, and $38.8 million from subordinated debt investments. The increase in investment income over the prior year was due to the growth of our portfolio which was also driven by investment of the proceeds from our equity offering and rotation out of lower yielding assets.
36
Table of Contents
Expenses
Expenses for the fiscal year ended September 30, 2013 totaled $62.2 million. Base management fees for the same period totaled $21.3 million, incentive fees totaled $16.8 million, debt related interest and expenses totaled $18.1 million (including $2.8 million associated with the 2025 Notes and expanding our Credit Facility) and general and administrative expenses totaled $6.0 million. The increase in expenses over the prior year was primarily due to increased borrowing costs and the growth of our portfolio.
Expenses for the fiscal year ended September 30, 2012 totaled $56.3 million. Base management fees for the same period totaled $17.5 million, incentive fees totaled $14.2 million, Credit Facility and SBA debentures related expenses totaled $17.1 million (including $5.4 million of upfront fees associated with amending and extending our Credit Facility), general and administrative expenses totaled $7.2 million and an excise tax of $0.3 million was incurred. The increase in expenses over the prior year was primarily due to the upfront costs of amending our Credit Facility, increased borrowing costs and the growth of our portfolio.
Expenses for the fiscal year ended September 30, 2011 totaled $39.1 million. Base management fees for the same period totaled $14.9 million, incentive fees totaled $13.2 million, Credit Facility and SBA debentures related expenses totaled $5.3 million, general and administrative expenses totaled $5.5 million and an excise tax of $0.2 million was incurred. The increase in expenses over the prior year was the result of the growth of our portfolio as well as increased borrowing costs.
Net Investment Income
Net investment income totaled $67.0 million or $1.01 per share, $57.1 million or $1.08 per share and $52.6 million or $1.25 per share for the fiscal years ended September 30, 2013, 2012 and 2011, respectively. The increase in net investment income was the result of the growth of our portfolio, while the per share net investment income decrease was the result of share issuances.
Net Realized Gains or Losses
Sales and repayments of investments for the fiscal years ended September 30, 2013, 2012 and 2011 totaled $437.1 million, $201.7 million and $304.0 million, respectively, and net realized gains (losses) totaled $17.7 million, $(12.8) million and $16.3 million, respectively. Net realized gains increased over the prior year primarily due to sales, restructurings and repayments of our investments.
Net Change in Unrealized Appreciation or Depreciation on Investments, Credit Facility and 2025 Notes
Net change in unrealized (depreciation) appreciation on investments totaled $4.8 million, $20.6 million and $(46.8) million for the fiscal years ended September 30, 2013, 2012 and 2011, respectively. Net change in unrealized (appreciation) depreciation on our Credit Facility and 2025 Notes totaled $2.3 million, $(1.6) million and $(11.9) million for the same periods, respectively. The decrease in net unrealized change in appreciation on investments from the fiscal year ended September 30, 2011 to the fiscal year ended September 30, 2013 was due to the overall variations in the leveraged finance markets. The increase in net unrealized change in depreciation (appreciation) on our Credit Facility and 2025 Notes was the result of the fluctuating interest rate environment.
Net Increase in Net Assets Resulting From Operations
Net increase in net assets resulting from operations totaled $91.8 million or $1.39 per share, $63.4 million or $1.20 per share, and $10.3 million or $0.24 per share for the fiscal years ended September 30, 2013, 2012 and 2011, respectively. The net increase in net assets from operations was higher than in prior years primarily due to realized gains and continued growth in net investment income.
LIQUIDITY AND CAPITAL RESOURCES
Our liquidity and capital resources are derived primarily from proceeds of securities offerings, debt capital and cash flows from operations, including investment sales and repayments, and income earned. Our primary use of funds from operations includes investments in portfolio companies and payments of fees and other operating expenses we incur. We have used, and expect to continue to use, our debt capital and proceeds from the rotation of our portfolio and proceeds from public and private offerings of securities to finance our investment objectives.
We have a $430 million multi-currency Credit Facility with certain lenders and SunTrust Bank, acting as administrative agent, and JPMorgan Chase Bank, N.A., acting as syndication agent for the lenders. As of September 30, 2013 and 2012, there was $145.5 million (including a temporary draw of $28.0 million) and $145.0 million (including a temporary draw of $35.5 million), respectively, in outstanding borrowings under the Credit Facility, with a weighted average interest rate at the time of 3.33% and 3.49%, exclusive of the fee on undrawn commitments of 0.50%. The Credit Facility is a four-year revolving facility with a stated maturity date of February 2016, and a one-year term-out period following its third year. Borrowings under the Credit Facility bear interest at 275 basis points over LIBOR. As of September 30, 2013 and 2012, we had $284.5 million and $235.0 million of unused borrowing capacity, respectively, subject to the regulatory restrictions that the 1940 Act imposes on us as a BDC. The Credit Facility is secured by substantially all of our assets excluding assets held by our SBIC Funds.
The Credit Facility contains customary affirmative and restrictive covenants, including maintenance of a minimum stockholders’ equity of the sum of (a) $220.0 million plus (b) 25% of the net proceeds from the sale of equity interests in us and our subsidiaries after the closing date of the Credit Facility and maintenance of a ratio of total assets (less total liabilities other than indebtedness) to total indebtedness of not less than 2.0:1.0 (before any exemptive relief granted by the SEC with respect to the indebtedness of our SBIC subsidiaries). In addition to the asset coverage ratio described in the preceding sentence, borrowings under our Credit Facility (and the incurrence of certain other permitted debt) are subject to compliance with a borrowing base that applies different advance rates to different types of assets in the Company’s portfolio. For a complete list of covenants contained in the Credit Facility, see our Form 8-K filed on February 22, 2012 and the Credit Facility agreement filed as an exhibit to our Form 10-Q filed on May 2, 2012. As of September 30, 2013, we were in compliance with the terms of our Credit Facility.
In January 2013, we issued $71.3 million in aggregate principal amount of 2025 Notes, after exercise of the over-allotment option, for net proceeds of $68.8 million after underwriting discounts and offering costs. Interest on the 2025 Notes is paid quarterly on February 1, May 1, August 1 and November 1, at a rate of 6.25% per year. The 2025 Notes mature on February 1, 2025. We may redeem the 2025 Notes in whole or in part at any time or from time to time on or after February 1, 2016. The 2025 Notes are general, unsecured obligations and rank equal in right of payment with all of our existing and future senior unsecured indebtedness. The 2025 Notes are structurally subordinated to our SBA debentures and the assets pledged or secured under our Credit Facility. Our 2025 Notes trade on the NYSE under the symbol “PNTA.”
We may raise additional equity or debt capital through both registered offerings off our shelf registration statement and private offerings of securities, by securitizing a portion of our investments or borrowing from the SBA, among other sources. Any future additional debt capital we incur, to the extent it is available, may be issued at a higher cost and on less favorable terms and conditions than our current Credit Facility or 2025 Notes. Furthermore, our Credit Facility availability depends on various covenants and restrictions. The primary use of existing funds and any funds raised in the future is expected to be for repayment of indebtedness, investments in portfolio companies, cash distributions to our stockholders or for other general corporate or strategic purposes.
37
Table of Contents
For the fiscal year ended September 30, 2013 we sold 0.7 million shares of common stock pursuant to the underwriters’ exercise of the overallotment option, resulting in net proceeds of $7.3 million. This compares to selling 19.4 million shares of our common stock resulting in net proceeds of $198.9 million for the fiscal year ended September 30, 2012. Any decision to sell shares below the then current NAV per share of our common stock is subject to stockholder approval and a determination by our board of directors that such issuance and sale is in our and our stockholders’ best interests. Any sale or other issuance of shares of our common stock at a price below NAV per share results in immediate dilution to our stockholders’ interests in our common stock and a reduction in our NAV per share.
In accordance with the 1940 Act, with certain limited exceptions, PennantPark Investment is only allowed to borrow amounts such that our asset coverage ratio is met after such borrowing. As of September 30, 2013, we excluded the principal amounts of our SBA debentures from our asset coverage ratio pursuant to SEC exemptive relief. In June 2011, we received exemptive relief from the SEC allowing us to modify the asset coverage ratio requirement to exclude the SBA debentures from the calculation. Accordingly, our ratio of total assets on a consolidated basis to outstanding indebtedness may be less than 200%, which while providing increased investment flexibility, also increases our exposure to risks associated with leverage.
SBIC LP is able to borrow funds from the SBA against regulatory capital (which approximates equity capital) that is paid-in and is subject to customary regulatory requirements including but not limited to an examination by the SBA. We have funded SBIC LP with $75.0 million of equity capital and had SBA debentures outstanding of $150.0 million as of September 30, 2013. Effective January 2013, our wholly-owned subsidiary, SBIC II, received a license from the SBA to operate as an SBIC under the 1958 Act. Our SBIC Funds are subject to a variety of regulations and oversight by the SBA concerning, among other things, the size and nature of the companies in which it may invest as well as the structure of those investments. SBA debentures are non-recourse to us, have a 10-year maturity, and may be prepaid at any time without penalty. The interest rate of SBA debentures is fixed at the time of issuance, often referred to as pooling, at a market-driven spread over 10-year U.S. Treasury Notes. SBA regulations limit the amount that SBIC LP may borrow to a maximum of $150.0 million, which is up to twice its potential regulatory capital, and may borrow to a maximum of $225 million as part of a group of SBICs under common control. SBIC LP has accessed the maximum borrowing with its $75.0 million in regulatory capital.
As of September 30, 2013 and 2012, our $150.0 million in debt commitments were fully drawn with a weighted average interest rate of 3.70% exclusive of the 3.43% in upfront fees (4.04% after upfront fees). The SBA debentures upfront fees of 3.43% consist of a commitment fee of 1.00% and an issuance at a 2.43% discount to face. Both fees will be amortized over the lives of the loans. Our fixed rate SBA debentures as of September 30, 2013 and 2012 are as follows:
| Issuance Dates | Maturity | All-in Coupon Rate(1) |
Principal Balance | |||||||||
| September 22, 2010 |
September 1, 2020 | 3.50% | $ | 500,000 | ||||||||
| March 29, 2011 |
March 1, 2021 | 4.46 | 44,500,000 | |||||||||
| September 21, 2011 |
September 1, 2021 | 3.38 | 105,000,000 | |||||||||
|
|
|
|
|
|||||||||
| Weighted average rate / Total |
3.70% | $ | 150,000,000 | |||||||||
|
|
|
|
|
|||||||||
| (1) | Excludes 3.43% of upfront fees. |
The SBIC program is designed to stimulate the flow of capital into eligible businesses. Under SBA regulations, our SBIC Funds are subject to regulatory requirements, including making investments in SBA eligible businesses, investing at least 25% of regulatory capital in eligible smaller businesses, as defined under the 1958 Act, placing certain limitations on the financing terms of investments, prohibiting investment in certain industries and requiring capitalization thresholds that limit distributions to us, and are subject to periodic audits and examinations of their financial statements that are prepared on a basis of accounting other than GAAP (for example, fair value, as defined under ASC 820, is not required to be used for assets or liabilities for such compliance reporting). As of September 30, 2013, our SBIC Funds were in compliance with their regulatory requirements.
On September 30, 2013 and September 30, 2012, we had cash equivalents of $58.4 million and $7.6 million, respectively, available for investing and general corporate purposes. This was primarily the result of repayments in SBIC LP. We believe our liquidity and capital resources are sufficient to take advantage of market opportunities.
Our operating activities provided cash of $40.3 million for the fiscal year ended September 30, 2013, and our financing activities provided cash proceeds of $10.6 million for the same period. Our operating activities used cash primarily for investing that was offset by proceeds from sales and repayments on our investments and issuance of the 2025 Notes.
Our operating activities used cash of $115.3 million for the fiscal year ended September 30, 2012, and our financing activities provided cash proceeds of $51.3 million for the same period. Our operating activities used cash primarily for investing that was provided primarily from proceeds from our follow-on public offerings of common stock.
Our operating activities used cash of $137.8 million for the fiscal year ended September 30, 2011, and our financing activities provided cash proceeds of $207.6 million for the same period. Our operating activities used cash primarily for investing that was provided primarily from proceeds from our follow-on public offering of common stock and draws under our Credit Facility and SBA debentures.
Contractual Obligations
A summary of our significant contractual payment obligations as of September 30, 2013, including borrowings under our multi-currency Credit Facility and other contractual obligations, are as follows:
| Payments due by period (millions) | ||||||||||||||||||||
| Total |
Less than 1 year |
1-3 years |
3-5 years |
More than 5 years |
||||||||||||||||
| Credit Facility |
$ | 145.5 | $ | — | $ | 145.5 | $ | — | $ | — | ||||||||||
| SBA debentures |
150.0 | — | — | — | 150.0 | |||||||||||||||
| 2025 Notes |
71.3 | — | — | — | 71.3 | |||||||||||||||
|
|
|
|
|
|
|
|
|
|
|
|||||||||||
| Total debt outstanding(1) |
366.8 | — | 145.5 | — | 221.3 | |||||||||||||||
| Unfunded investments(2) |
7.2 | 4.8 | 1.9 | — | 0.5 | |||||||||||||||
|
|
|
|
|
|
|
|
|
|
|
|||||||||||
| Total contractual obligations(2) |
374.0 | 4.8 | 147.4 | — | 221.8 | |||||||||||||||
|
|
|
|
|
|
|
|
|
|
|
|||||||||||
| (1) | The weighted average interest rate on the total debt outstanding as of September 30, 2013 was 4.05%, exclusive of the fee on the undrawn commitment of 0.50% on the Credit Facility and 3.43% of upfront fees on SBIC LP’s SBA debentures. |
| (2) | Unfunded investments described in the Consolidated Statement of Assets and Liabilities represent unfunded delayed draws on investments. |
38
Table of Contents
We have entered into certain contracts under which we have material future commitments. Under our Investment Management Agreement, which was most recently reapproved by our board of directors, including a majority of our directors who are not interested persons of us or the Investment Adviser, in February 2013, PennantPark Investment Advisers serves as our Investment Adviser in accordance with the terms of that Investment Management Agreement. PennantPark Investment, through the Investment Adviser, provides similar services to our SBIC Funds under their investment management agreements with us. Our SBIC Funds’ investment management agreements do not affect the management or incentive fees that we pay to the Investment Adviser on a consolidated basis. Payments under our Investment Management Agreement in each reporting period are equal to (1) a management fee equal to a percentage of the value of our average adjusted gross assets and (2) an incentive fee based on our performance.
Under our Administration Agreement, which was most recently reapproved by our board of directors, including a majority of our directors who are not interested persons of us, in February 2013, PennantPark Investment Administration furnishes us with office facilities and administrative services necessary to conduct our day-to-day operations. PennantPark Investment, through the Administrator, provides similar services to our SBIC Funds under their administration agreements, which are intended to have no effect on the consolidated administration fee. If requested to provide managerial assistance to our portfolio companies, PennantPark Investment Advisers or PennantPark Investment Administration will be paid an additional amount based on the services provided, which amount will not in any case exceed the amount we receive from the portfolio companies for such services. Payment under our Administration Agreement is based upon our allocable portion of the Administrator’s overhead in performing its obligations under our Administration Agreement, including rent, technology systems, insurance and our allocable portion of the costs of our Chief Compliance Officer, Chief Financial Officer and their respective staffs.
If any of our contractual obligations discussed above is terminated, our costs under new agreements that we enter into may increase. In addition, we will likely incur significant time and expense in locating alternative parties to provide the services we expect to receive under our Investment Management Agreement and our Administration Agreement. Any new investment management agreement would also be subject to approval by our stockholders.
We, in the ordinary course of business, have guaranteed certain obligations of SPH. The guaranties are only triggered if there were administrative errors in acquiring assets which SPH subsequently sold or securitized. As of September 30, 2013 our maximum guaranty is $13.0 million. Based on SPH’s and industry historical loss rates we believe the risk of loss is remote, thus, we have not recorded a liability associated with the guaranties. The current guaranties will decline over time.
Off-Balance Sheet Arrangements
We currently engage in no off-balance sheet arrangements, including any risk management of commodity pricing or other hedging practices.
Distributions
In order to qualify as a RIC and to not be subject to corporate-level tax on income, we are required, under Subchapter M of the Code, to distribute annually at least 90% of the sum of our net ordinary income and realized net short-term capital gains in excess of realized net long-term capital losses, if any, out of the assets legally available for distribution. Although not required for us to maintain our RIC tax status, in order to preclude the imposition of a 4% nondeductible federal excise tax imposed on RICs, we may distribute during each calendar year an amount at least equal to the sum of (1) 98% of our net ordinary income for the calendar year, (2) 98.2% of our realized net capital gains for the one-year period ending on October 31 of the calendar year and (3) any net ordinary income and net capital gains for preceding years that were not distributed during such years. In addition, although we may distribute realized net capital gains (i.e., net long-term capital gains in excess of short-term capital losses), if any, at least annually, out of the assets legally available for such distributions, we may retain such net capital gains or ordinary income to provide us with additional liquidity. For the fiscal years ended September 30, 2013, 2012, and 2011, we elected to retain a portion of our calendar year income and incurred an excise tax of approximately $(0.1) million, $0.3 million and $0.2 million, respectively.
During the fiscal year ended September 30, 2013, 2012 and 2011, we declared distributions of $1.12, $1.12 and $1.07 per share, respectively, for total distributions of $74.4 million, $60.1 million and $46.3 million, respectively. We monitor available net investment income to determine if a return of capital for taxation purposes may occur for the fiscal year. To the extent our taxable earnings fall below the total amount of our distributions for any given fiscal year, a portion of those distributions may be deemed to be a return of capital to our common stockholders. Tax characteristics of all distributions will be reported to stockholders on Form 1099-DIV after the end of the calendar year and in our periodic reports filed with the SEC.
We intend to continue to make quarterly distributions to our stockholders. Our quarterly distributions, if any, are determined by our board of directors.
We maintain an “opt out” dividend reinvestment plan for our common stockholders. As a result, if we declare a distribution, then stockholders’ cash distributions will be automatically reinvested in additional shares of our common stock, unless they specifically “opt out” of the dividend reinvestment plan so as to receive cash distributions.
We may not be able to achieve operating results that will allow us to make distributions at a specific level or to increase the amount of these distributions from time to time. In addition, we may be limited in our ability to make distributions due to the asset coverage ratio for borrowings applicable to us as a BDC under the 1940 Act and/or due to provisions in future credit facilities. If we do not distribute a certain percentage of our income annually, we will suffer adverse tax consequences, including possible loss of RIC status. We cannot assure stockholders that they will receive any distributions at a particular level.
39
Table of Contents
| Item 7A. | Quantitative And Qualitative Disclosures About Market Risk |
We are subject to financial market risks, including changes in interest rates. As of September 30, 2013, our debt portfolio consisted of 52% fixed-rate investments and 48% variable-rate investments (including 44% with a LIBOR or prime floor). The variable-rate loans are usually based on a LIBOR rate and typically have durations of three months after which they reset to current market interest rates. Variable-rate investments subject to a floor generally reset by reference to the current market index after one to nine months only if the index exceeds the floor. In regards to variable-rate instruments with a floor, we do not benefit from increases in interest rates until such rates exceed the floor and thereafter benefit from market rates above any such floor. In contrast, our cost of funds, to the extent it is not fixed, will fluctuate with changes in interest rates.
Assuming that the most recent statement of assets and liabilities was to remain constant, and no actions were taken to alter the existing interest rate sensitivity, the following table shows the annualized impact of hypothetical base rate changes in interest rates.
| Change In Interest Rates |
Change In Interest Income, Net Of Interest Expense |
Per Share | ||||||
| Up 1% |
(1,128 | ) | $ | (0.02 | ) | |||
| Up 2% |
120 | $ | 0.00 | |||||
| Up 3% |
3,249 | $ | 0.05 | |||||
| Up 4% |
6,378 | $ | 0.10 | |||||
Although management believes that this measure is indicative of our sensitivity to interest rate changes, it does not adjust for potential changes in the credit market, credit quality, size and composition of the assets on the Consolidated Statement of Assets and Liabilities and other business developments that could affect net increase in net assets resulting from operations, or net investment income. Accordingly, no assurances can be given that actual results would not differ materially from those shown above.
Because we borrow money to make investments, our net investment income is dependent upon the difference between the rate at which we borrow funds and the rate at which we invest these funds as well as our level of leverage. As a result, there can be no assurance that a significant change in market interest rates will not have a material adverse effect on our net investment income or net assets.
We may hedge against interest rate fluctuations by using standard hedging instruments such as futures, options and forward contracts subject to the requirements of the 1940 Act and applicable commodities laws. While hedging activities may insulate us against adverse changes in interest rates, they may also limit our ability to participate in benefits of lower interest rates with respect to our portfolio of investments with fixed interest rates. During the periods covered by this Report, we did not engage in interest rate hedging activities.
40
Table of Contents
| Item 8. | Consolidated Financial Statements and Supplementary Data |
41
Table of Contents
Management’s Report on Internal Control over Financial Reporting
The management of PennantPark Investment Corporation (except where the context suggests otherwise, the terms “we,” “us,” “our” and “PennantPark Investment” refer to PennantPark Investment Corporation and its Subsidiaries) is responsible for establishing and maintaining adequate internal control over financial reporting. Our internal control system is a process designed to provide reasonable assurance to our management and board of directors regarding the preparation and fair presentation of published financial statements.
PennantPark Investment’s internal control over financial reporting includes policies and procedures that pertain to the maintenance of records that, in reasonable detail, accurately and fairly reflect transactions recorded necessary to permit the preparation of financial statements in accordance with U.S. generally accepted accounting principles. Our policies and procedures also provide reasonable assurance that receipts and expenditures are being made only in accordance with authorizations of management and the directors of PennantPark Investment, and provide reasonable assurance regarding prevention or timely detection of unauthorized acquisition, use or disposition of our assets that could have a material effect on our financial statements.
All internal control systems, no matter how well designed, have inherent limitations. Therefore, even those systems determined to be effective can provide only reasonable assurance with respect to financial statement preparation and presentation. Also, projections of any evaluation of effectiveness to future periods are subject to the risk that controls may become inadequate because of changes in conditions, or that the degree of compliance with the policies or procedures may deteriorate.
Management assessed the effectiveness of PennantPark Investment’s internal control over financial reporting as of September 30, 2013. In making this assessment, we used the criteria set forth by the Committee of Sponsoring Organizations of the Treadway Commission in Internal Control—Integrated Framework . Based on the assessment management believes that, as of September 30, 2013, our internal control over financial reporting is effective based on those criteria.
PennantPark Investment’s independent registered public accounting firm that audited the financial statements has issued an audit report on the effectiveness of our internal control over financial reporting as of September 30, 2013. This report appears on page 44.
42
Table of Contents
Report of Independent Registered Public Accounting Firm
The Board of Directors and Stockholders
PennantPark Investment Corporation and its Subsidiaries:
We have audited the accompanying consolidated statements of assets and liabilities of PennantPark Investment Corporation and its Subsidiaries (the “Company”), including the consolidated schedules of investments as of September 30, 2013 and 2012, and the related consolidated statements of operations, changes in net assets, and cash flows for the years ended September 30, 2013, 2012 and 2011. These consolidated financial statements are the responsibility of the Company’s management. Our responsibility is to express an opinion on these consolidated financial statements based on our audits.
We conducted our audits in accordance with the standards of the Public Company Accounting Oversight Board (United States). Those standards require that we plan and perform the audit to obtain reasonable assurance about whether the financial statements are free of material misstatement. An audit includes examining, on a test basis, evidence supporting the amounts and disclosures in the financial statements. Our procedures included confirmation of investments owned as of September 30, 2013 by correspondence with the custodians and portfolio companies or by other appropriate auditing procedures. An audit also includes assessing the accounting principles used and significant estimates made by management, as well as evaluating the overall financial statement presentation. We believe that our audits provide a reasonable basis for our opinion.
In our opinion, the consolidated financial statements referred to above present fairly, in all material respects, the financial position of PennantPark Investment Corporation and its Subsidiaries as of September 30, 2013 and 2012, and the results of operations and cash flows for the years ended September 30, 2013, 2012 and 2011, in conformity with U.S. generally accepted accounting principles.
We also have audited, in accordance with the standards of the Public Company Accounting Oversight Board (United States), PennantPark Investment Corporation’s internal control over financial reporting as of September 30, 2013, based on criteria established in Internal Control—Integrated Framework , issued by the Committee of Sponsoring Organizations of the Treadway Commission (COSO), and our report dated November 13, 2013 expressed an unqualified opinion on the effectiveness of the Company’s internal control over financial reporting.
/s/ KPMG LLP
New York, New York
November 13, 2013
43
Table of Contents
Report of Independent Registered Public Accounting Firm
On Internal Control Over Financial Reporting
The Board of Directors and Stockholders
PennantPark Investment Corporation and its Subsidiaries:
We have audited PennantPark Investment Corporation and its Subsidiaries’ (the “Company”) internal control over financial reporting as of September 30, 2013, based on criteria established in Internal Control—Integrated Framework , issued by the Committee of Sponsoring Organizations of the Treadway Commission (COSO). Management of the Company is responsible for maintaining effective internal control over financial reporting and for its assessment of the effectiveness of internal control over financial reporting, included on page 42 of the Annual Report on Form 10-K, and Item 9A., Controls and Procedures—Management’s Report on Internal Control Over Financial Reporting. Our responsibility is to express an opinion on the Company’s internal control over financial reporting based on our audit.
We conducted our audit in accordance with the standards of the Public Company Accounting Oversight Board (United States). Those standards require that we plan and perform the audit to obtain reasonable assurance about whether effective internal control over financial reporting was maintained in all material respects. Our audit included obtaining an understanding of internal control over financial reporting, assessing the risk that a material weakness exists and testing and evaluating the design and operating effectiveness of internal control based on the assessed risk. Our audit also included performing such other procedures as we considered necessary in the circumstances. We believe that our audit provides a reasonable basis for our opinion.
A company’s internal control over financial reporting is a process designed to provide reasonable assurance regarding the reliability of financial reporting and the preparation of financial statements for external purposes in accordance with generally accepted accounting principles. A company’s internal control over financial reporting includes those policies and procedures that (1) pertain to the maintenance of records that, in reasonable detail, accurately and fairly reflect the transactions and dispositions of the assets of the company; (2) provide reasonable assurance that transactions are recorded as necessary to permit preparation of financial statements in accordance with generally accepted accounting principles, and that receipts and expenditures of the company are being made only in accordance with authorizations of management and directors of the company; and (3) provide reasonable assurance regarding prevention or timely detection of unauthorized acquisition, use, or disposition of the company’s assets that could have a material effect on the financial statements.
Because of its inherent limitations, internal control over financial reporting may not prevent or detect misstatements. Also, projections of any evaluation of effectiveness to future periods are subject to the risk that controls may become inadequate because of changes in conditions, or that the degree of compliance with the policies or procedures may deteriorate.
In our opinion, PennantPark Investment Corporation and its Subsidiaries maintained, in all material respects, effective internal control over financial reporting as of September 30, 2013, based on criteria established in Internal Control—Integrated Framework, issued by COSO.
We also have audited, in accordance with the standards of the Public Company Accounting Oversight Board (United States), the statements of assets and liabilities of PennantPark Investment Corporation and its Subsidiaries, including the schedules of investments as of September 30, 2013 and 2012, and the related statements of operations, changes in net assets, and cash flows for the years ended September 30, 2013, 2012 and 2011, and our report dated November 13, 2013 expressed an unqualified opinion on those financial statements.
/s/ KPMG LLP
New York, New York
November 13, 2013
44
Table of Contents
PENNANTPARK INVESTMENT CORPORATION AND SUBSIDIARIES
CONSOLIDATED STATEMENTS OF ASSETS AND LIABILITIES
| September 30, 2013 | September 30, 2012 | |||||||
| Assets |
||||||||
| Investments at fair value |
||||||||
| Non-controlled, non-affiliated investments, at fair value (cost—$928,078,589 and $871,867,953, respectively) |
$ | 968,471,042 | $ | 871,892,745 | ||||
| Non-controlled, affiliated investments, at fair value (cost—$99,021,141 and $72,576,858, respectively) |
76,735,800 | 80,955,257 | ||||||
| Controlled, affiliated investments, at fair value (cost—$64,418,155 and $64,167,051, respectively) |
32,968,711 | 37,631,708 | ||||||
|
|
|
|
|
|||||
| Total of investments, at fair value (cost—$1,091,517,885 and $1,008,611,862, respectively) |
1,078,175,553 | 990,479,710 | ||||||
| Cash and cash equivalents (See Note 9) |
58,440,829 | 7,559,453 | ||||||
| Interest receivable |
10,894,893 | 14,928,862 | ||||||
| Prepaid expenses and other assets |
5,815,817 | 5,999,506 | ||||||
|
|
|
|
|
|||||
| Total assets |
1,153,327,092 | 1,018,967,531 | ||||||
|
|
|
|
|
|||||
| Liabilities |
||||||||
| Distributions payable |
18,619,812 | 15,824,061 | ||||||
| Payable for investments purchased |
52,544,704 | — | ||||||
| Unfunded investments |
7,241,667 | 26,935,270 | ||||||
| Credit Facility payable (cost—$145,500,000 and $145,000,000, respectively) (See Notes 5 and 11) |
145,500,000 | 144,452,500 | ||||||
| SBA debentures payable (cost—$150,000,000) (See Notes 5 and 11) |
150,000,000 | 150,000,000 | ||||||
| 2025 Notes payable (cost—$71,250,000) (See Notes 5 and 11) |
68,400,000 | — | ||||||
| Management fee payable (See Note 3) |
5,419,557 | 4,791,913 | ||||||
| Performance-based incentive fee payable (See Note 3) |
4,274,881 | 4,206,989 | ||||||
| Interest payable on debt |
1,810,466 | 854,725 | ||||||
| Accrued other expenses |
2,009,806 | 2,185,026 | ||||||
|
|
|
|
|
|||||
| Total liabilities |
455,820,893 | 349,250,484 | ||||||
|
|
|
|
|
|||||
| Net assets |
||||||||
| Common stock, 66,499,327 and 65,514,503 shares issued and outstanding, respectively. Par value $0.001 |
66,499 | 65,514 | ||||||
| Paid-in capital in excess of par value |
756,017,096 | 744,704,825 | ||||||
| (Distributions in excess of) Undistributed net investment income |
(4,675,217 | ) | 2,804,397 | |||||
| Accumulated net realized loss on investments |
(43,409,847 | ) | (60,273,037 | ) | ||||
| Net unrealized depreciation on investments |
(13,342,332 | ) | (18,132,152 | ) | ||||
| Net unrealized depreciation on debt |
2,850,000 | 547,500 | ||||||
|
|
|
|
|
|||||
| Total net assets |
$ | 697,506,199 | $ | 669,717,047 | ||||
|
|
|
|
|
|||||
| Total liabilities and net assets |
$ | 1,153,327,092 | $ | 1,018,967,531 | ||||
|
|
|
|
|
|||||
| Net asset value per share |
$ | 10.49 | $ | 10.22 | ||||
|
|
|
|
|
|||||
SEE NOTES TO CONSOLIDATED FINANCIAL STATEMENTS
45
Table of Contents
PENNANTPARK INVESTMENT CORPORATION AND SUBSIDIARIES
CONSOLIDATED STATEMENTS OF OPERATIONS
| Years Ended September 30, | ||||||||||||
| 2013 | 2012 | 2011 | ||||||||||
| Investment income: |
||||||||||||
| From non-controlled, non-affiliated investments: |
||||||||||||
| Interest |
$ | 107,058,958 | $ | 99,663,198 | $ | 83,632,455 | ||||||
| Other income |
10,883,261 | 8,486,387 | 4,726,387 | |||||||||
| From non-controlled, affiliated investments: |
||||||||||||
| Interest |
5,841,127 | 3,542,583 | 2,217,320 | |||||||||
| Other Income |
597,400 | — | — | |||||||||
| From controlled, affiliated investments: |
||||||||||||
| Interest |
4,806,329 | 1,700,222 | 1,162,333 | |||||||||
|
|
|
|
|
|
|
|||||||
| Total investment income |
129,187,075 | 113,392,390 | 91,738,495 | |||||||||
|
|
|
|
|
|
|
|||||||
| Expenses: |
||||||||||||
| Base management fee (See Note 3) |
21,288,728 | 17,507,262 | 14,899,983 | |||||||||
| Performance-based incentive fee (See Note 3) |
16,793,089 | 14,223,777 | 13,161,597 | |||||||||
| Interest and expenses on debt (See Note 11) |
15,384,208 | 11,680,634 | 5,322,231 | |||||||||
| Administrative services expenses (See Note 3) |
3,161,158 | 3,745,741 | 2,596,756 | |||||||||
| Other general and administrative expenses |
2,857,739 | 3,496,326 | 2,884,029 | |||||||||
|
|
|
|
|
|
|
|||||||
| Expenses before taxes and debt issuance costs |
59,484,922 | 50,653,740 | 38,864,596 | |||||||||
| Tax expense |
(53,468 | ) | 307,990 | 228,824 | ||||||||
| Debt issuance costs (See Note 5) |
2,757,500 | 5,361,319 | — | |||||||||
|
|
|
|
|
|
|
|||||||
| Total expenses |
62,188,954 | 56,323,049 | 39,093,420 | |||||||||
|
|
|
|
|
|
|
|||||||
| Net investment income |
66,998,121 | 57,069,341 | 52,645,075 | |||||||||
|
|
|
|
|
|
|
|||||||
| Realized and unrealized gain (loss) on investments and debt: |
||||||||||||
| Net realized gain (loss) on investments |
17,687,211 | (12,798,035 | ) | 16,259,622 | ||||||||
| Net change in unrealized appreciation (depreciation) on: |
||||||||||||
| Non-controlled, non-affiliated investments |
17,932,839 | 42,727,722 | (45,350,345 | ) | ||||||||
| Non-controlled and controlled, affiliated investments |
(13,143,019 | ) | (22,085,553 | ) | (1,439,878 | ) | ||||||
| Debt depreciation (appreciation) (See Notes 5 and 11) |
2,302,500 | (1,560,375 | ) | (11,851,000 | ) | |||||||
|
|
|
|
|
|
|
|||||||
| Net change in unrealized appreciation (depreciation) |
7,092,320 | 19,081,794 | (58,641,223 | ) | ||||||||
|
|
|
|
|
|
|
|||||||
| Net realized and unrealized gain (loss) from investments and debt |
24,779,531 | 6,283,759 | (42,381,601 | ) | ||||||||
|
|
|
|
|
|
|
|||||||
| Net increase in net assets resulting from operations |
$ | 91,777,652 | $ | 63,353,100 | $ | 10,263,474 | ||||||
|
|
|
|
|
|
|
|||||||
| Net increase in net assets resulting from operations per common share basic and diluted (See Note 7) |
$ | 1.39 | $ | 1.20 | $ | 0.24 | ||||||
|
|
|
|
|
|
|
|||||||
| Net investment income per common share |
$ | 1.01 | $ | 1.08 | $ | 1.25 | ||||||
|
|
|
|
|
|
|
|||||||
SEE NOTES TO CONSOLIDATED FINANCIAL STATEMENTS
46
Table of Contents
PENNANTPARK INVESTMENT CORPORATION AND SUBSIDIARIES
CONSOLIDATED STATEMENTS OF CHANGES IN NET ASSETS
| Years Ended September 30, | ||||||||||||
| 2013 | 2012 | 2011 | ||||||||||
| Net increase in net assets from operations: |
||||||||||||
| Net investment income |
$ | 66,998,121 | $ | 57,069,341 | $ | 52,645,075 | ||||||
| Net realized gain (loss) on investments |
17,687,211 | (12,798,035 | ) | 16,259,622 | ||||||||
| Net change in unrealized appreciation (depreciation) on investments |
4,789,820 | 20,642,169 | (46,790,223 | ) | ||||||||
| Net change in debt depreciation (appreciation) |
2,302,500 | (1,560,375 | ) | (11,851,000 | ) | |||||||
|
|
|
|
|
|
|
|||||||
| Net increase in net assets resulting from operations |
91,777,652 | 63,353,100 | 10,263,474 | |||||||||
|
|
|
|
|
|
|
|||||||
| Distributions to stockholders: |
||||||||||||
| Distributions |
(74,398,129 | ) | (60,137,978 | ) | (46,347,691 | ) | ||||||
|
|
|
|
|
|
|
|||||||
| Capital transactions: |
||||||||||||
| Public offerings |
7,574,000 | 206,572,500 | 114,080,000 | |||||||||
| Offerings costs |
(265,090 | ) | (7,717,300 | ) | (5,743,800 | ) | ||||||
| Reinvestment of distributions |
3,100,719 | 4,989,529 | 3,829,990 | |||||||||
|
|
|
|
|
|
|
|||||||
| Net increase in net assets resulting from capital transactions |
10,409,629 | 203,844,729 | 112,166,190 | |||||||||
|
|
|
|
|
|
|
|||||||
| Net increase in net assets |
27,789,152 | 207,059,851 | 76,081,973 | |||||||||
| Net assets: |
||||||||||||
| Beginning of year |
669,717,047 | 462,657,196 | 386,575,223 | |||||||||
|
|
|
|
|
|
|
|||||||
| End of year |
$ | 697,506,199 | $ | 669,717,047 | $ | 462,657,196 | ||||||
|
|
|
|
|
|
|
|||||||
| (Distributions in excess of) Undistributed net investment income, at year end |
$ | (4,675,217 | ) | $ | 2,804,397 | $ | 8,326,854 | |||||
|
|
|
|
|
|
|
|||||||
| Capital share activity: |
||||||||||||
| Shares issued from public offerings |
700,000 | 19,350,000 | 9,200,000 | |||||||||
|
|
|
|
|
|
|
|||||||
| Shares issued from reinvestment of distributions |
284,824 | 474,722 | 331,011 | |||||||||
|
|
|
|
|
|
|
|||||||
SEE NOTES TO CONSOLIDATED FINANCIAL STATEMENTS
47
Table of Contents
PENNANTPARK INVESTMENT CORPORATION AND SUBSIDIARIES
CONSOLIDATED STATEMENTS OF CASH FLOWS
| Years Ended September 30, | ||||||||||||
| 2013 | 2012 | 2011 | ||||||||||
| Cash flows from operating activities: |
||||||||||||
| Net increase in net assets resulting from operations |
$ | 91,777,652 | $ | 63,353,100 | $ | 10,263,474 | ||||||
| Adjustments to reconcile net increase in net assets resulting from operations to net cash provided by (used for) operating activities: |
||||||||||||
| Net change in net unrealized appreciation (depreciation) on investments |
(4,789,820 | ) | (20,642,169 | ) | 46,790,223 | |||||||
| Net change in debt depreciation (appreciation) |
(2,302,500 | ) | 1,560,375 | 11,851,000 | ||||||||
| Net realized loss on investments |
(17,687,211 | ) | 12,798,035 | (16,259,622 | ) | |||||||
| Net accretion of discount and amortization of premium |
(5,856,654 | ) | (10,357,608 | ) | (6,745,834 | ) | ||||||
| Purchase of investments |
(504,373,719 | ) | (328,275,329 | ) | (479,733,669 | ) | ||||||
| Payment-in-kind interest |
(11,814,084 | ) | (9,065,502 | ) | (10,883,750 | ) | ||||||
| Proceeds from disposition of investments |
437,147,602 | 201,656,926 | 304,008,543 | |||||||||
| Decrease (Increase) in interest receivable |
4,033,969 | (4,050,626 | ) | 1,935,860 | ||||||||
| Decrease in receivables for investments sold |
— | 12,240,763 | 17,135,807 | |||||||||
| Increase (Decrease) in payables for investments purchased |
52,544,704 | (18,572,499 | ) | (34,212,501 | ) | |||||||
| (Decrease) Increase in unfunded investments |
— | (19,242,446 | ) | 14,928,717 | ||||||||
| Increase in interest payable on debt |
955,741 | 167,363 | 472,227 | |||||||||
| Decrease (Increase) in prepaid expenses and other assets |
168,130 | 466,675 | 749,017 | |||||||||
| Increase in management fees payable |
627,644 | 783,859 | 721,238 | |||||||||
| Increase in performance-based incentive fees payable |
67,892 | 433,160 | 1,534,818 | |||||||||
| (Decrease) Increase in accrued other expenses |
(175,220 | ) | 1,406,285 | (368,064 | ) | |||||||
|
|
|
|
|
|
|
|||||||
| Net cash provided by (used for) operating activities |
40,324,126 | (115,339,638 | ) | (137,812,516 | ) | |||||||
|
|
|
|
|
|
|
|||||||
| Cash flows from financing activities: |
||||||||||||
| Public offerings |
7,574,000 | 206,572,500 | 114,080,000 | |||||||||
| Offerings costs |
(265,090 | ) | (7,717,300 | ) | (5,743,800 | ) | ||||||
| Distributions paid |
(68,501,660 | ) | (51,660,628 | ) | (39,582,741 | ) | ||||||
| Borrowings under SBA debentures (See Note 11) |
— | — | 135,500,000 | |||||||||
| Borrowings under 2025 Notes |
71,250,000 | — | — | |||||||||
| Capitalized borrowing costs |
— | — | (4,450,875 | ) | ||||||||
| Borrowings under Credit Facility (See Note 11) |
1,099,800,000 | 927,900,000 | 701,900,000 | |||||||||
| Repayments under Credit Facility (See Note 11) |
(1,099,300,000 | ) | (1,023,800,000 | ) | (694,100,000 | ) | ||||||
|
|
|
|
|
|
|
|||||||
| Net cash provided by financing activities |
10,557,250 | 51,294,572 | 207,602,584 | |||||||||
|
|
|
|
|
|
|
|||||||
| Net increase (decrease) in cash and cash equivalents |
50,881,376 | (64,045,066 | ) | 69,790,068 | ||||||||
| Cash and cash equivalents, beginning of year |
7,559,453 | 71,604,519 | 1,814,451 | |||||||||
|
|
|
|
|
|
|
|||||||
| Cash and cash equivalents, end of year |
$ | 58,440,829 | $ | 7,559,453 | $ | 71,604,519 | ||||||
|
|
|
|
|
|
|
|||||||
| Supplemental disclosure of cash flow information and non-cash activity (See Note 5): |
||||||||||||
| Interest paid |
$ | 12,765,891 | $ | 10,643,840 | $ | 4,149,149 | ||||||
|
|
|
|
|
|
|
|||||||
| Taxes paid |
$ | 94,210 | $ | 258,550 | $ | 123,824 | ||||||
|
|
|
|
|
|
|
|||||||
| Dividend reinvested |
$ | 3,100,719 | $ | 4,989,529 | $ | 3,829,990 | ||||||
|
|
|
|
|
|
|
|||||||
| Conversions and non-cash exchanges |
$ | 58,478,391 | $ | 43,596,371 | $ | 12,537,081 | ||||||
|
|
|
|
|
|
|
|||||||
SEE NOTES TO CONSOLIDATED FINANCIAL STATEMENTS
48
Table of Contents
PENNANTPARK INVESTMENT CORPORATION AND SUBSIDIARIES
CONSOLIDATED SCHEDULE OF INVESTMENTS
SEPTEMBER 30, 2013
| Issuer Name |
Maturity | Industry | Current Coupon |
Basis Point Spread Above Index (4) |
Par / Shares |
Cost | Fair Value (3) | |||||||||||||||||
| Investments in Non-Controlled, Non-Affiliated Portfolio Companies—138.9% (1),(2) First Lien Secured Debt—41.3% |
||||||||||||||||||||||||
| Aircell Business Aviation Services LLC |
06/21/2017 | Communications | 11.25 | % | L+975 | (8) | 23,912,894 | $ | 23,012,057 | $ | 25,347,668 | |||||||||||||
| AKA Diversified Holdings, Inc. |
12/21/2016 | Retail |
|
12.50 (PIK 1.50 |
% %) |
L+1,225 | 14,550,084 | 14,310,552 | 14,694,828 | |||||||||||||||
| CEVA Group PLC (5),(10) |
10/01/2016 | Cargo Transport | 11.63 | % | — | 7,500,000 | 7,385,251 | 7,725,000 | ||||||||||||||||
| Columbus International, Inc. (5), (10) |
11/20/2014 | Communications | 11.50 | % | — | 10,000,000 | 10,000,000 | 10,750,000 | ||||||||||||||||
| Cydcor LLC |
06/12/2017 | Business Services | 9.75 | % | L+725 | (8) | 7,342,967 | 7,342,967 | 7,342,967 | |||||||||||||||
| Good Sam Enterprises, LLC (5) |
12/01/2016 | Consumer Products | 11.50 | % | — | 12,000,000 | 11,835,907 | 12,900,000 | ||||||||||||||||
| IDQ Holdings, Inc. (5) |
03/30/2017 | Auto Sector | 11.50 | % | — | 11,500,000 | 11,326,110 | 12,391,250 | ||||||||||||||||
| InfuSystem Holdings, Inc. |
11/30/2016 | Healthcare, Education and Childcare |
11.95 | % | P+625 | (8) | 11,600,000 | 11,600,000 | 11,708,430 | |||||||||||||||
| Instant Web, Inc. |
08/07/2014 | Printing and Publishing | 14.50 | % | L+950 | (8) | 23,934,268 | 23,788,980 | 22,976,897 | |||||||||||||||
| Instant Web, Inc. |
08/07/2014 | Printing and Publishing | 3.55 | % | L+338 | 18,199,679 | 13,917,288 | 14,559,743 | ||||||||||||||||
| Interactive Health Solutions, Inc. |
10/04/2016 | Healthcare, Education and Childcare |
11.50 | % | L+950 | (8) | 18,050,000 | 17,770,705 | 18,050,000 | |||||||||||||||
| Jackson Hewitt Tax Service Inc. |
10/16/2017 | Personal, Food and Miscellaneous Services |
10.00 | % | L+850 | (8) | 8,355,469 | 8,349,704 | 8,230,137 | |||||||||||||||
| K2 Pure Solutions NoCal, L.P. |
08/19/2019 | Chemicals, Plastics and Rubber |
10.00 | % | L+900 | (8) | 22,342,352 | 21,899,258 | 22,007,217 | |||||||||||||||
| Penton Media, Inc. |
08/01/2014 | Other Media |
|
6.00 (PIK 2.00 |
% %) |
L+500 | (8) | 37,950,152 | 36,110,124 | 37,523,212 | ||||||||||||||
| Prince Mineral Holding Corp. (5) |
12/16/2019 | Mining, Steel, Iron and Non-Precious Metals |
11.50 | % | — | 14,250,000 | 14,096,169 | 15,176,250 | ||||||||||||||||
| TRAK Acquisition Corp. |
04/30/2018 | Business Services | 12.00 | % | L+1,050 | (8) | 34,270,800 | 33,766,321 | 34,270,800 | |||||||||||||||
| Worley Claims Services LLC |
07/06/2017 | Insurance | 12.50 | % | L+1,100 | (8) | 12,451,096 | 12,451,096 | 12,388,840 | |||||||||||||||
|
|
|
|
|
|||||||||||||||||||||
| Total First Lien Secured Debt |
|
278,962,489 | 288,043,239 | |||||||||||||||||||||
|
|
|
|
|
|||||||||||||||||||||
| Second Lien Secured Debt—48.9% |
||||||||||||||||||||||||
| American Gilsonite Company (5) |
09/01/2017 | Diversified Natural Resources, Precious Metals and Minerals |
11.50 | % | — | 25,400,000 | 25,400,000 | 25,971,500 | ||||||||||||||||
| Arsloane Acquisition, LLC |
10/01/2020 | Business Services | 11.75 | % | L+1,050 | (8) | 18,750,000 | 18,375,000 | 18,687,563 | |||||||||||||||
| Brand Energy and Infrastructure Services, Inc. |
10/23/2019 | Energy / Utilities | 11.00 | % | L+975 | (8) | 42,278,570 | 41,471,524 | 43,159,233 | |||||||||||||||
| Carolina Beverage Group, LLC |
08/01/2018 | Beverage, Food and Tobacco |
10.63 | % | — | 13,125,000 | 13,125,000 | 13,420,313 | ||||||||||||||||
| Envision Acquisition Company, LLC |
11/04/2021 | Healthcare, Education and Childcare |
9.75 | % | L+875 | (8) | 19,000,000 | 18,620,000 | 18,905,000 | |||||||||||||||
| Eureka Hunter Pipeline, LLC |
08/16/2018 | Energy / Utilities | 12.50 | % | — | 45,000,000 | 44,599,796 | 46,575,000 | ||||||||||||||||
| ILC Industries, LLC |
06/14/2019 | Electronics | 11.50 | % | L+1,000 | (8) | 7,500,000 | 7,200,000 | 6,900,000 | |||||||||||||||
| Intermediate Transportation 100, L.L.C. |
03/01/2017 | Cargo Transport |
|
11.00 (PIK 11.00 |
% %) |
L+700 | (8) | 3,544,833 | 3,544,836 | 3,544,833 | ||||||||||||||
| Jacobs Entertainment, Inc. |
10/29/2019 | Hotels, Motels, Inns and Gaming |
13.00 | % | L+1,175 | (8) | 38,950,000 | 38,287,499 | 39,096,063 | |||||||||||||||
| Language Line, LLC |
12/20/2016 | Personal, Food and Miscellaneous Services |
10.50 | % | L+875 | (8) | 33,750,000 | 33,265,829 | 33,187,388 | |||||||||||||||
| Linc USA GP and Linc Energy Finance (USA), Inc. (5) |
10/31/2017 | Oil and Gas | 12.50 | % | — | 11,875,000 | 11,511,878 | 13,062,500 | ||||||||||||||||
| Pre-Paid Legal Services, Inc. |
07/01/2020 | Personal, Food and Miscellaneous Services |
9.75 | % | L+850 | (8) | 56,750,000 | 55,923,621 | 56,040,625 | |||||||||||||||
| Questex Media Group LLC, Term Loan A |
12/15/2014 | Other Media | 9.50 | % | L+550 | (8) | 2,395,378 | 2,395,378 | 2,371,424 | |||||||||||||||
| Questex Media Group LLC, Term Loan B |
12/15/2015 | Other Media |
|
11.50 (PIK 11.50 |
% %) |
P+750 | (8) | 2,502,333 | 2,502,333 | 2,452,286 | ||||||||||||||
| ROC Finance LLC and ROC Finance 1 Corp. |
08/31/2018 | Hotels, Motels, Ins and Gaming |
12.13 | % | — | 16,000,000 | 15,785,252 | 17,720,000 | ||||||||||||||||
|
|
|
|
|
|||||||||||||||||||||
| Total Second Lien Secured Debt |
|
332,007,946 | 341,093,728 | |||||||||||||||||||||
|
|
|
|
|
|||||||||||||||||||||
SEE NOTES TO CONSOLIDATED FINANCIAL STATEMENTS
49
Table of Contents
PENNANTPARK INVESTMENT CORPORATION AND SUBSIDIARIES
CONSOLIDATED SCHEDULE OF INVESTMENTS (CONTINUED)
SEPTEMBER 30, 2013
| Issuer Name |
Maturity | Industry | Current Coupon |
Basis Point Spread Above Index (4) |
Par / Shares |
Cost | Fair Value (3) | |||||||||||||||||||
| Subordinated Debt/Corporate Notes—37.4% |
| |||||||||||||||||||||||||
| Acentia, LLC |
10/02/2017 | Electronics | 13.75 | % | — | 19,000,000 | $ | 18,629,082 | $ | 18,879,139 | ||||||||||||||||
| Affinion Group Holdings, Inc. |
11/15/2015 | Consumer Products | 11.63 | % | — | 35,552,000 | 34,570,664 | 20,442,400 | ||||||||||||||||||
| Alegeus Technologies, LLC |
02/15/2019 | Financial Services | 12.00 | % | — | 8,930,000 | 8,773,751 | 8,888,617 | ||||||||||||||||||
| Convergint Technologies LLC |
03/26/2018 | Electronics |
|
12.00 (PIK 1.00 |
% %) |
— | 23,514,494 | 23,114,286 | 23,867,211 | |||||||||||||||||
| Credit Infonet, Inc. |
10/26/2018 | Personal, Food and Miscellaneous Services |
12.25 | % | — | 10,600,000 | 10,399,101 | 10,653,423 | ||||||||||||||||||
| Escort, Inc. |
06/01/2016 | Electronics |
|
14.75 (PIK 2.75 |
% %) |
— | 25,965,563 | 25,579,621 | 26,484,875 | |||||||||||||||||
| JF Acquisition, LLC |
06/30/2017 | Distribution |
|
14.00 (PIK 2.00 |
% %) |
— | 17,517,386 | 17,160,955 | 17,517,386 | |||||||||||||||||
| Learning Care Group (US) Inc. |
05/08/2020 | Education |
|
15.00 (PIK 15.00 |
% %) |
— | 7,215,989 | 6,754,246 | 7,215,989 | |||||||||||||||||
| LTI Flexible Products, Inc. |
01/19/2019 | Chemicals, Plastics and Rubber | 12.50 | % | — | 30,000,000 | 30,000,000 | 30,525,000 | ||||||||||||||||||
| LTI Flexible Products, Inc. (9) |
01/11/2014 | Chemicals, Plastics and Rubber | — | — | 5,000,000 | 4,825,000 | 5,087,500 | |||||||||||||||||||
| MSPark, Inc. |
06/15/2017 | Printing and Publishing | 14.50 | %(7) | — | 15,000,000 | 14,691,342 | 14,700,000 | ||||||||||||||||||
| Varel International Energy Mezzanine Funding Corp. |
01/15/2018 | Oil and Gas |
|
14.00 (PIK 4.00 |
% %) |
— | 37,070,637 | 36,441,726 | 36,720,586 | |||||||||||||||||
| Vestcom International, Inc. |
06/27/2019 | Printing and Publishing | 12.00 | % | — | 39,892,933 | 39,147,926 | 39,827,248 | ||||||||||||||||||
|
|
|
|
|
|||||||||||||||||||||||
| Total Subordinated Debt/Corporate Notes |
|
270,087,700 | 260,809,374 | |||||||||||||||||||||||
|
|
|
|
|
|||||||||||||||||||||||
| Preferred Equity/Partnership Interests —1.2% (6) |
||||||||||||||||||||||||||
| AH Holdings, Inc. |
— | Healthcare, Education and Childcare | 6.00 | % | — | 211 | 500,000 | 815,133 | ||||||||||||||||||
| AHC Mezzanine, LLC |
— | Other Media | — | — | 7,505 | 318,896 | — | |||||||||||||||||||
| Alegeus Technologies Holdings Corp., Series A (Alegeus Technologies, LLC) |
— | Financial Services | — | — | 949 | 949,050 | 805,697 | |||||||||||||||||||
| CI (IHS) Investment Holdings, LLC (Interactive Health Solutions, Inc.) |
— | Healthcare, Education and Childcare | 8.00 | % | — | 76,357 | 765,307 | 1,187,410 | ||||||||||||||||||
| CI (IHS) Investment Holdings, LLC (9) (Interactive Health Solutions, Inc.) |
— | Healthcare, Education and Childcare | — | — | 38,179 | 382,654 | 593,705 | |||||||||||||||||||
| Convergint Technologies Holdings, LLC (Convergint Technologies LLC) |
— | Electronics | 8.00 | % | — | 2,375 | 2,375,000 | 2,584,106 | ||||||||||||||||||
| CT Technologies Holdings, LLC |
— | Business Services | 9.00 | % | — | 326,215 | 326,215 | 326,215 | ||||||||||||||||||
| HW Topco, Inc. |
Other Media | 8.00 | % | — | 3,591 | 24,177 | 35,091 | |||||||||||||||||||
| TZ Holdings, L.P., Series A |
Insurance | — | — | 686 | 685,820 | 685,820 | ||||||||||||||||||||
| TZ Holdings, L.P., Series B |
Insurance | 6.50 | % | — | 1,312 | 1,312,006 | 862,664 | |||||||||||||||||||
| VRide Holdings, Inc. |
Personal Transportation | 8.00 | % | — | 1,824,167 | 1,824,167 | 156,029 | |||||||||||||||||||
|
|
|
|
|
|||||||||||||||||||||||
| Total Preferred Equity/Partnership Interests |
|
9,463,292 | 8,051,870 | |||||||||||||||||||||||
|
|
|
|
|
|||||||||||||||||||||||
SEE NOTES TO CONSOLIDATED FINANCIAL STATEMENTS
50
Table of Contents
PENNANTPARK INVESTMENT CORPORATION AND SUBSIDIARIES
CONSOLIDATED SCHEDULE OF INVESTMENTS (CONTINUED)
SEPTEMBER 30, 2013
| Issuer Name |
Maturity | Industry | Current Coupon |
Basis Point Spread Above Index (4) |
Par / Shares |
Cost | Fair Value (3) | |||||||||||||||||
| Common Equity/Warrants/Partnership Interests—10.1%(6) |
| |||||||||||||||||||||||
| Acentia, LLC, Class A Units (12) |
— | Electronics | — | — | 1,998 | $ | 2,000,000 | $ | 1,572,603 | |||||||||||||||
| AH Holdings, Inc. (Warrants) |
03/23/2021 | Healthcare, Education and Childcare |
— | — | 753 | — | 2,499,319 | |||||||||||||||||
| Alegeus Technologies Holding Corp., Class A (Alegeus Technologies, LLC) |
— | Financial Services | — | — | 1 | 950 | 807 | |||||||||||||||||
| Autumn Games, LLC |
— | Broadcasting and Entertainment |
— | — | 1,333,330 | 3,000,000 | — | |||||||||||||||||
| CI (Galls) Prime Investment Holdings, LLC (11) |
— | Distribution | — | — | 1,505,000 | 1,505,000 | 2,308,777 | |||||||||||||||||
| CI (IHS) Investment Holdings, LLC (Interactive Health Solutions, Inc.) |
— | Healthcare, Education and Childcare |
— | — | 23,416 | 234,693 | 364,156 | |||||||||||||||||
| CI (IHS) Investment Holdings, LLC (9) (Interactive Health Solutions, Inc.) |
— | Healthcare, Education and Childcare |
— | — | 11,708 | 117,346 | 182,078 | |||||||||||||||||
| Convergint Technologies Holdings, LLC (Convergint Technologies LLC) |
— | Electronics | — | — | 2,375 | — | 212,881 | |||||||||||||||||
| CT Technologies Holdings, LLC |
— | Business Services | — | — | 5,556 | 1,918,346 | 7,285,399 | |||||||||||||||||
| HW Topco, Inc. |
— | Other Media | — | — | 386,770 | 2,697,835 | 3,400,855 | |||||||||||||||||
| Kadmon Holdings, LLC, Class A |
— | Healthcare, Education and Childcare |
— | — | 1,079,920 | 1,236,832 | 11,085,403 | |||||||||||||||||
| Kadmon Holdings, LLC, Class D |
— | Healthcare, Education and Childcare |
— | — | 1,079,920 | 1,028,807 | 1,028,807 | |||||||||||||||||
| Learning Care Group (US) Inc. (Warrants) |
04/27/2020 | Education | — | — | 6,649 | 779,920 | 4,300,696 | |||||||||||||||||
| Magnum Hunter Resources Corporation (Eureka Hunter Pipeline, LLC) |
— | Oil and Gas | — | — | 1,221,932 | 3,057,500 | 7,539,320 | |||||||||||||||||
| Magnum Hunter Resources Corporation (Warrants) |
10/14/2013 | Oil and Gas | — | — | 122,193 | 105,697 | — | |||||||||||||||||
| Magnum Hunter Resources Corporation (Warrants) |
04/16/2016 | Oil and Gas | — | — | 122,193 | 182,499 | 205,667 | |||||||||||||||||
| MidOcean JF Holdings Corp. (JF Acquisition, LLC) |
— | Distribution | — | — | 1,850 | 1,850,294 | 1,845,784 | |||||||||||||||||
| MidOcean PPL Holdings, Corp. (Pre-Paid Legal Services, Inc.) |
— | Personal, Food and Miscellaneous Services |
— | — | 3,000 | 3,000,000 | 5,441,976 | |||||||||||||||||
| Paradigm Acquisition Corp. |
— | Healthcare, Education and Childcare |
— | — | 20,000 | 2,000,000 | 3,720,481 | |||||||||||||||||
| QMG HoldCo, LLC, Class A (Questex Media Group, LLC) |
— | Other Media | — | — | 4,325 | 1,306,167 | 2,073,419 | |||||||||||||||||
| QMG HoldCo, LLC, Class B (Questex Media Group, LLC) |
— | Other Media | — | — | 531 | — | 254,563 | |||||||||||||||||
| SPG Boyd Holdings Corp. (LTI Flexible Products, Inc.) |
— | Chemical, Plastic and Rubber |
— | — | 300,000 | 3,000,000 | 5,571,120 | |||||||||||||||||
| TRAK Acquisition Corp. (Warrants) |
12/29/2019 | Business Services | — | — | 3,500 | 29,400 | 606,681 | |||||||||||||||||
| Transportation 100 Holdco, L.L.C. (13) (Intermediate Transportation 100, L.L.C.) |
— | Cargo Transport | — | — | 137,923 | 2,111,588 | 379,453 | |||||||||||||||||
| TZ Holdings, L.P. |
— | Insurance | — | — | 2 | 9,567 | — | |||||||||||||||||
| Vestcom Parent Holdings, Inc. (Vestcom International, Inc.) |
— | Printing and Publishing |
— | — | 211,797 | 2,325,555 | 2,626,512 | |||||||||||||||||
| VRide Holdings Inc. |
— | Personal Transportation |
— | — | 9,166 | 9,166 | — | |||||||||||||||||
| VText Holdings, Inc. |
— | Business Services | — | — | 35,526 | 4,050,000 | 5,966,074 | |||||||||||||||||
|
|
|
|
|
|||||||||||||||||||||
| Total Common Equity/Warrants/Partnership Interests |
|
37,557,162 | 70,472,831 | |||||||||||||||||||||
|
|
|
|
|
|||||||||||||||||||||
| Total Investments in Non-Controlled, Non-Affiliated Portfolio Companies |
|
928,078,589 | 968,471,042 | |||||||||||||||||||||
|
|
|
|
|
|||||||||||||||||||||
SEE NOTES TO CONSOLIDATED FINANCIAL STATEMENTS
51
Table of Contents
PENNANTPARK INVESTMENT CORPORATION AND SUBSIDIARIES
CONSOLIDATED SCHEDULE OF INVESTMENTS (CONTINUED)
SEPTEMBER 30, 2013
| Issuer Name |
Maturity | Industry | Current Coupon |
Basis Point Spread Above Index (4) |
Par / Shares |
Cost | Fair Value (3) | |||||||||||||||||
| Investments in Non-Controlled, Affiliated Portfolio Companies—11.0%(1),(2) |
||||||||||||||||||||||||
| Subordinated Debt/Corporate Notes—5.7% |
||||||||||||||||||||||||
| DirectBuy Holdings, Inc. |
11/05/2019 | Consumer Products |
|
12.00 (PIK 12.00 |
% %) |
— | 11,428,224 | $ | 11,428,224 | $ | 11,428,224 | |||||||||||||
| Service Champ, Inc. |
10/02/2017 | Auto Sector | 12.50 | % | — | 28,000,000 | 27,474,713 | 28,248,043 | ||||||||||||||||
|
|
|
|
|
|||||||||||||||||||||
| Total Subordinated Debt/Corporate Notes |
|
38,902,937 | 39,676,267 | |||||||||||||||||||||
|
|
|
|
|
|||||||||||||||||||||
| Preferred Equity – 0.2%(6) |
||||||||||||||||||||||||
| PAS International Holdings, Inc. |
— | Aerospace and Defense |
— | — | 53,071 | 20,059,340 | 1,694,296 | |||||||||||||||||
|
|
|
|
|
|||||||||||||||||||||
| Common Equity/Partnership Interest—5.1%(6) |
||||||||||||||||||||||||
| DirectBuy Holdings, Inc. |
— | Consumer Products | — | — | 104,719 | 21,492,822 | 5,556,207 | |||||||||||||||||
| DirectBuy Holdings, Inc. (Warrants) |
11/05/2022 | Consumer Products | — | — | 15,486 | — | 821,505 | |||||||||||||||||
| EnviroSolutions Holdings, Inc. |
— | Environmental Services | — | — | 142,684 | 11,891,822 | 21,265,345 | |||||||||||||||||
| NCP-Performance |
— | Leisure, Amusement, Motion Pictures |
— | — | 375,000 | 3,750,000 | 2,500,165 | |||||||||||||||||
| New Service Champ Holdings, Inc. |
— | Auto Sector | — | — | 16,800 | 2,721,600 | 5,222,015 | |||||||||||||||||
| PAS International Holdings, Inc. |
— | Aerospace and Defense | — | — | 53,071 | 202,620 | — | |||||||||||||||||
|
|
|
|
|
|||||||||||||||||||||
| Total Common Equity/Partnership Interest |
|
40,058,864 | 35,365,237 | |||||||||||||||||||||
|
|
|
|
|
|||||||||||||||||||||
| Total Investments in Non-Controlled, Affiliated Portfolio Companies |
|
99,021,141 | 76,735,800 | |||||||||||||||||||||
|
|
|
|
|
|||||||||||||||||||||
| Investments in Controlled, Affiliated Portfolio Companies—4.7%(1),(2) |
||||||||||||||||||||||||
| First Lien Secured Debt—1.6% |
||||||||||||||||||||||||
| SuttonPark Holdings, Inc. |
06/30/2020 | Business Services | 14.00 | %(7) | — | 9,250,000 | 9,250,000 | 9,556,385 | ||||||||||||||||
| Universal Pegasus International, LLC (9) |
12/31/2015 | Oil and Gas | — | — | 1,916,667 | 1,787,941 | 1,916,667 | |||||||||||||||||
|
|
|
|
|
|||||||||||||||||||||
| Total First Lien Secured Debt |
|
11,037,941 | 11,473,052 | |||||||||||||||||||||
|
|
|
|
|
|||||||||||||||||||||
| Second Lien Secured Debt—2.4% |
||||||||||||||||||||||||
| Universal Pegasus International, LLC |
12/31/2015 | Oil and Gas |
|
15.00 (PIK 15.00 |
% %) |
— | 16,615,645 | 14,709,502 | 16,449,489 | |||||||||||||||
|
|
|
|
|
|||||||||||||||||||||
| Subordinated Debt/Corporate Notes—0.3% |
||||||||||||||||||||||||
| SuttonPark Holdings, Inc. |
6/30/2020 | Business Services | 14.00 | %(7) | 2,250,000 | 2,250,000 | 1,961,667 | |||||||||||||||||
|
|
|
|
|
|||||||||||||||||||||
| Preferred Equity—0.4%(6) |
||||||||||||||||||||||||
| SuttonPark Holdings, Inc. |
— | Business Services | 14.00 | % | — | 2,000 | 2,000,000 | 1,981,948 | ||||||||||||||||
| Universal Pegasus International Holdings, Inc. |
— | Oil and Gas | 8.00 | % | — | 376,988 | 34,420,612 | 1,102,555 | ||||||||||||||||
|
|
|
|
|
|||||||||||||||||||||
| Total Preferred Equity |
|
36,420,612 | 3,084,503 | |||||||||||||||||||||
|
|
|
|
|
|||||||||||||||||||||
| Common Equity—0.0%(6) |
|
|||||||||||||||||||||||
| SuttonPark Holdings, Inc. |
— | Business Services | — | — | 100 | 100 | — | |||||||||||||||||
|
|
|
|
|
|||||||||||||||||||||
| Total Investments in Controlled, Affiliated Portfolio Companies |
|
64,418,155 | 32,968,711 | |||||||||||||||||||||
|
|
|
|
|
|||||||||||||||||||||
| Total Investments—154.6% |
|
1,091,517,885 | 1,078,175,553 | |||||||||||||||||||||
|
|
|
|
|
|||||||||||||||||||||
| Cash and Cash Equivalents—8.4% |
|
|||||||||||||||||||||||
| Cash |
|
2,667,511 | 2,667,511 | |||||||||||||||||||||
| BlackRock Liquidity Funds, Temp Cash, Institutional Shares |
|
2,446,232 | 2,446,232 | |||||||||||||||||||||
| BNY Mellon Cash Reserve |
|
53,327,086 | 53,327,086 | |||||||||||||||||||||
|
|
|
|
|
|||||||||||||||||||||
| Total Cash and Cash Equivalents |
|
58,440,829 | 58,440,829 | |||||||||||||||||||||
|
|
|
|
|
|||||||||||||||||||||
| Total Investments, Cash and Cash Equivalents—163.0% |
|
$ | 1,149,958,714 | $ | 1,136,616,382 | |||||||||||||||||||
|
|
|
|
|
|||||||||||||||||||||
| Liabilities in Excess of Other Assets—(63.0%) |
|
(439,110,183 | ) | |||||||||||||||||||||
| Net Assets—100.0% |
|
$ | 697,506,199 | |||||||||||||||||||||
|
|
|
|||||||||||||||||||||||
| (1) | The provisions of the 1940 Act classify investments based on the level of control that we maintain in a particular portfolio company. As defined in the 1940 Act, a company is deemed as “non-controlled” when we own less than 25% of a portfolio company’s voting securities and “controlled” when we own 25% or more of a portfolio company’s voting securities. |
| (2) | The provisions of the 1940 Act classify investments further based on the level of ownership that we maintain in a particular portfolio company. As defined in the 1940 Act, a company is deemed as “non-affiliated” when we own less than 5% of a portfolio company’s voting securities and “affiliated” when we own 5% or more of a portfolio company’s voting securities (see Note 6). |
| (3) | Valued based on our accounting policy (see Note 2). |
| (4) | Represents floating rate instruments that accrue interest at a predetermined spread relative to an index, typically the applicable LIBOR, or “L” or Prime, or “P” rate. |
| (5) | Security is exempt from registration under Rule 144A promulgated under the Securities Act. The security may be resold in transactions that are exempt from registration, normally to qualified institutional buyers. |
| (6) | Non-income producing securities. |
| (7) | Coupon is payable in cash and/or PIK. |
| (8) | Coupon is subject to a LIBOR or Prime rate floor. |
| (9) | Represents the purchase of a security with delayed settlement (unfunded investments). This security does not have a basis point spread above an index. |
| (10) | Non-U.S. company or principal place of business outside the U.S. |
| (11) | Investment is held through PNNT CI (Galls) Prime Investment Holdings, LLC, a consolidated subsidiary. |
| (12) | Investment is held through PNNT Acentia LLC, a consolidated subsidiary. |
| (13) | Investment is held through PNNT Transportation 100 Holdco, L.L.C., a consolidated subsidiary. |
SEE NOTES TO CONSOLIDATED FINANCIAL STATEMENTS
52
Table of Contents
PENNANTPARK INVESTMENT CORPORATION AND SUBSIDIARIES
CONSOLIDATED SCHEDULE OF INVESTMENTS
SEPTEMBER 30, 2012
| Issuer Name |
Maturity | Industry | Current Coupon |
Basis Point Spread Above Index (4) |
Par / Shares |
Cost | Fair Value (3) | |||||||||||||||||||
| Investments in Non-Controlled, Non-Affiliated Portfolio Companies—130.3% (1),(2) |
| |||||||||||||||||||||||||
| First Lien Secured Debt—41.7% |
||||||||||||||||||||||||||
| Aircell Business Aviation Services LLC |
06/21/2017 | Communications | 11.25 | % | L+975 | (8) | 14,906,250 | $ | 14,332,682 | $ | 14,906,250 | |||||||||||||||
| American Surgical Holdings, Inc. |
03/23/2015 | Healthcare, Education and Childcare |
14.00 | % | L+1,000 | (8) | 17,811,828 | 17,441,366 | 17,811,828 | |||||||||||||||||
| Brand Energy and Infrastructure Services, Inc. |
02/07/2014 | Energy/Utilities | 3.68 | % | L+325 | 2,000,000 | 1,757,029 | 1,973,334 | ||||||||||||||||||
| CEVA Group PLC(5),(10) |
10/01/2016 | Cargo Transport | 11.63 | % | — | 7,500,000 | 7,355,237 | 7,687,500 | ||||||||||||||||||
| CEVA Group PLC(5),(10) |
04/01/2018 | Cargo Transport | 11.50 | % | — | 1,000,000 | 990,089 | 880,000 | ||||||||||||||||||
| Columbus International, Inc.(5), (10) |
11/20/2014 | Communications | 11.50 | % | — | 10,000,000 | 10,000,000 | 11,100,000 | ||||||||||||||||||
| Good Sam Enterprises, LLC(5) |
12/01/2016 | Consumer Products | 11.50 | % | — | 12,000,000 | 11,795,443 | 12,720,000 | ||||||||||||||||||
| Hanley-Wood, L.L.C. |
01/13/2017 | Other Media | 8.00 | % | L+650 | (8) | 1,752,896 | 1,752,896 | 1,752,896 | |||||||||||||||||
| IDQ Holdings, Inc. (5) |
04/01/2017 | Auto Sector | 11.50 | % | — | 11,500,000 | 11,288,165 | 12,218,750 | ||||||||||||||||||
| Instant Web, Inc. |
08/07/2014 | Printing and Publishing | 14.50 | % | L+950 | (8) | 24,115,645 | 23,829,738 | 23,802,142 | |||||||||||||||||
| Interactive Health Solutions, Inc. |
10/04/2016 | Healthcare, Education and Childcare |
11.50 | % | L+950 | (8) | 18,525,000 | 18,165,492 | 18,571,313 | |||||||||||||||||
| Jacuzzi Brands Corp. |
02/07/2014 | Home and Office Furnishings, Housewares and Durable Consumer Products |
2.28 | % | L+225 | 9,598,649 | 9,598,649 | 6,371,103 | ||||||||||||||||||
| K2 Pure Solutions NoCal, L.P. |
09/10/2015 | Chemicals, Plastics and Rubber |
10.00 | % | L+775 | (8) | 18,952,500 | 18,216,865 | 19,236,788 | |||||||||||||||||
| Kadmon Pharmaceuticals, LLC |
10/31/2012 | Healthcare, Education and Childcare |
15.00 | % | L+1,300 | (8) | 4,931,494 | 4,992,740 | 5,110,409 | |||||||||||||||||
| Learning Care Group, Inc. |
04/27/2016 | Education | 12.00 | % | — | 26,052,632 | 25,640,832 | 25,857,237 | ||||||||||||||||||
| Penton Media, Inc. |
08/01/2014 | Other Media |
|
5.00 (PIK 1.00 |
% %) |
L+400 | (8) | 37,775,294 | 33,971,917 | 30,503,550 | ||||||||||||||||
| Pre-Paid Legal Services, Inc., Tranche A |
12/30/2016 | Personal, Food and Miscellaneous Services |
7.50 | % | L+600 | (8) | 1,552,846 | 1,533,687 | 1,556,728 | |||||||||||||||||
| Pre-Paid Legal Services, Inc., Tranche B |
12/30/2016 | Personal, Food and Miscellaneous Services |
11.00 | % | L+950 | (8) | 35,000,000 | 34,118,800 | 35,350,000 | |||||||||||||||||
| Questex Media Group LLC(9) |
12/16/2012 | Other Media | 1.36 | % | — | 133,603 | 133,603 | 133,603 | ||||||||||||||||||
| Tekelec Global Inc. (First Out) |
01/29/2018 | Telecommunications | 9.00 | % | L+750 | (8) | 850,000 | 838,369 | 850,000 | |||||||||||||||||
| Tekelec Global Inc. (Second Out) |
01/29/2018 | Telecommunications | 13.50 | % | L+1,200 | (8) | 10,625,000 | 10,338,450 | 10,848,126 | |||||||||||||||||
| Worley Claims Services, LLC |
07/06/2017 | Insurance | 12.50 | % | L+1,100 | (8) | 14,934,000 | 14,934,000 | 14,859,330 | |||||||||||||||||
| Yonkers Racing Corp.(5) |
07/15/2016 | Hotels, Motels, Inns and Gaming |
11.38 | % | — | 4,500,000 | 4,401,515 | 4,860,000 | ||||||||||||||||||
|
|
|
|
|
|||||||||||||||||||||||
| Total First Lien Secured Debt |
|
277,427,564 | 278,960,887 | |||||||||||||||||||||||
|
|
|
|
|
|||||||||||||||||||||||
| Second Lien Secured Debt—25.3% |
|
|||||||||||||||||||||||||
| American Gilsonite Company(5) |
09/01/2017 | Diversified Natural Resources, Precious Metals and Minerals |
11.50 | % | — | 25,400,000 | 25,400,000 | 26,098,500 | ||||||||||||||||||
| Brand Energy and Infrastructure Services, Inc. |
02/07/2015 | Energy/Utilities | 6.33 | % | L+600 | 13,600,000 | 13,378,432 | 12,729,600 | ||||||||||||||||||
| Brand Energy and Infrastructure Services, Inc. |
02/07/2015 | Energy/Utilities | 7.36 | % | L+700 | 12,000,000 | 11,866,485 | 11,232,000 | ||||||||||||||||||
| DirectBuy Holdings, Inc.(5), (6) |
02/01/2017 | Consumer Products | 12.00 | % | — | 34,000,000 | 31,964,822 | 10,880,000 | ||||||||||||||||||
| Eureka Hunter Pipeline, LLC |
08/16/2018 | Energy/Utilities | 12.50 | % | — | 45,000,000 | 44,543,688 | 45,000,000 | ||||||||||||||||||
| Greatwide Logistics Services, L.L.C. |
03/01/2014 | Cargo Transport |
|
11.00 (PIK 11.00 |
% %) |
L+700 | (8) | 3,184,219 | 3,184,222 | 2,292,640 | ||||||||||||||||
| Paradigm Management Services, LLC |
07/31/2017 | Healthcare, Education and Childcare |
12.50 | % | L+1,100 | (8) | 20,512,821 | 20,059,979 | 20,512,821 | |||||||||||||||||
| Questex Media Group LLC, Term Loan A |
12/15/2014 | Other Media | 9.50 | % | L+650 | (8) | 2,752,666 | 2,752,666 | 2,584,753 | |||||||||||||||||
| Questex Media Group LLC, Term Loan B |
12/15/2015 | Other Media |
|
11.50 (PIK 11.50 |
% %) |
L+850 | (8) | 2,230,508 | 2,230,508 | 2,002,996 | ||||||||||||||||
| Realogy Corp. |
10/15/2017 | Buildings and Real Estate |
13.50 | % | — | 10,000,000 | 10,000,000 | 10,062,500 | ||||||||||||||||||
| ROC Finance LLC and ROC Finance 1 Corp. |
09/01/2018 | Hotels, Motels, Inns and Gaming |
12.13 | % | — | 16,000,000 | 15,752,822 | 18,560,000 | ||||||||||||||||||
| TransFirst Holdings, Inc. |
06/15/2015 | Financial Services | 6.22 | % | L+600 | 7,811,488 | 7,511,344 | 7,411,149 | ||||||||||||||||||
|
|
|
|
|
|||||||||||||||||||||||
| Total Second Lien Secured Debt |
|
188,644,968 | 169,366,959 | |||||||||||||||||||||||
|
|
|
|
|
|||||||||||||||||||||||
SEE NOTES TO CONSOLIDATED FINANCIAL STATEMENTS
53
Table of Contents
PENNANTPARK INVESTMENT CORPORATION AND SUBSIDIARIES
CONSOLIDATED SCHEDULE OF INVESTMENTS (CONTINUED)
SEPTEMBER 30, 2012
| Issuer Name |
Maturity | Industry | Current Coupon |
Basis Point Spread Above Index (4) |
Par / Shares |
Cost | Fair Value (3) | |||||||||||||||||
| Subordinated Debt/Corporate Notes—52.4% |
| |||||||||||||||||||||||
| Acentia, LLC |
10/02/2017 | Electronics | 13.75 | % | — | 19,000,000 | $ | 18,563,943 | $ | 19,000,000 | ||||||||||||||
| Affinion Group Holdings, Inc. |
11/15/2015 | Consumer Products | 11.63 | % | — | 35,552,000 | 34,172,451 | 24,175,360 | ||||||||||||||||
| Alegeus Technologies, LLC |
02/15/2019 | Financial Services | 12.00 | % | — | 8,930,000 | 8,754,461 | 8,930,000 | ||||||||||||||||
| Convergint Technologies LLC |
03/26/2018 | Electronics |
|
12.00 (PIK 1.00 |
% %) |
— | 23,277,586 | 22,812,086 | 22,812,034 | |||||||||||||||
| Diversitech Corporation |
01/29/2017 | Manufacturing/ Basic Industry |
13.50 | %(7) | — | 11,000,000 | 10,836,901 | 11,275,000 | ||||||||||||||||
| Escort, Inc. |
06/01/2016 | Electronics |
|
14.75 (PIK 2.75 |
% %) |
— | 25,254,035 | 24,751,548 | 25,254,035 | |||||||||||||||
| Galls, LLC; Quartermaster Inc. |
03/31/2017 | Distribution |
|
13.00 (PIK 2.00 |
% %) |
— | 21,797,263 | 21,399,764 | 21,906,249 | |||||||||||||||
| JF Acquisition, LLC |
06/30/2017 | Distribution |
|
14.00 (PIK 2.00 |
% %) |
— | 17,171,374 | 16,748,220 | 17,377,430 | |||||||||||||||
| Last Mile Funding Corp. |
06/30/2016 | Cargo Transport |
|
14.50 (PIK 2.50 |
% %) |
— | 45,597,139 | 44,677,474 | 45,095,570 | |||||||||||||||
| Learning Care Group (US) Inc. |
06/30/2016 | Education |
|
15.00 (PIK 15.00 |
% %) |
— | 5,277,718 | 4,696,436 | 4,815,918 | |||||||||||||||
| LTI Flexible Products, Inc. |
01/19/2019 | Chemical, Plastic and Rubber |
12.50 | % | — | 30,000,000 | 30,000,000 | 30,000,000 | ||||||||||||||||
| LTI Flexible Products, Inc.(9) |
01/11/2014 | Chemical, Plastic and Rubber |
— | — | 5,000,000 | 4,825,000 | 5,000,000 | |||||||||||||||||
| Mailsouth, Inc. |
06/15/2017 | Printing and Publishing |
|
14.50 (PIK 2.00 |
% %) |
— | 15,000,000 | 14,632,413 | 15,210,000 | |||||||||||||||
| PAS Technologies, Inc. |
05/12/2017 | Aerospace and Defense |
|
15.02 (PIK 3.02 |
% %) |
— | 17,123,218 | 16,783,033 | 17,123,218 | |||||||||||||||
| Prince Mineral Holdings Corp. |
12/03/2016 | Mining, Steel, Iron and Non-Precious Metals |
|
13.50 (PIK 2.00 |
% %) |
— | 26,696,517 | 26,263,685 | 26,696,517 | |||||||||||||||
| Realogy Corp. |
04/15/2018 | Buildings and Real Estate | 11.00 | % | — | 10,000,000 | 9,247,298 | 9,400,000 | ||||||||||||||||
| TRAK Acquisition Corp. |
12/29/2015 | Business Services | 15.00 | %(7) | — | 12,020,950 | 11,708,199 | 12,020,950 | ||||||||||||||||
| TrustHouse Services Group, Inc. |
06/03/2019 | Beverage, Food, and Tobacco |
|
14.25 (PIK 2.25 |
% %) |
— | 14,778,578 | 14,527,411 | 14,778,578 | |||||||||||||||
| TrustHouse Services Group, Inc.(9) |
06/02/2014 | Beverage, Food, and Tobacco |
— | — | 4,000,000 | 3,920,000 | 4,000,000 | |||||||||||||||||
| Veritext Corp. |
12/31/2015 | Business Services | 13.00 | % | — | 16,200,000 | 15,916,579 | 16,200,000 | ||||||||||||||||
|
|
|
|
|
|||||||||||||||||||||
| Total Subordinated Debt/Corporate Notes |
|
355,236,902 | 351,070,859 | |||||||||||||||||||||
|
|
|
|
|
|||||||||||||||||||||
| Preferred Equity/Partnership Interests—1.7% (6) |
||||||||||||||||||||||||
| AH Holdings, Inc. (American Surgical Holdings, Inc.) |
— | Healthcare, Education and Childcare |
6.00 | % | — | 211 | 500,000 | 624,081 | ||||||||||||||||
| AHC Mezzanine, LLC |
— | Other Media | — | — | 7,505 | 318,896 | — | |||||||||||||||||
| Alegeus Technologies Holding Corp., Series A (Alegeus Technologies, LLC) |
— | Financial Services | — | — | 949 | 949,050 | 1,031,820 | |||||||||||||||||
| CI (IHS) Investment Holdings, LLC (Interactive Health Solutions, Inc.) |
— | Healthcare, Education and Childcare |
8.00 | % | — | 76,357 | 765,307 | 881,885 | ||||||||||||||||
| CI (IHS) Investment Holdings, LLC (9) (Interactive Health Solutions, Inc.) |
— | Healthcare, Education and Childcare |
— | — | 38,179 | 382,654 | — | |||||||||||||||||
| Convergint Technologies Holdings, LLC |
— | Electronics | — | — | 2,375 | 2,375,000 | 2,375,000 | |||||||||||||||||
| HW Topco, Inc. (Hanley-Wood, LLC) |
— | Other Media | 8.00 | % | — | 3,591 | 24,177 | 27,916 | ||||||||||||||||
| PAS Tech Holdings, Inc., Series A-1 (PAS Technologies, Inc.) |
— | Aerospace and Defense | 8.00 | % | — | 20,000 | 1,980,000 | 823,710 | ||||||||||||||||
| TrustHouse Services Holdings, LLC |
— | Beverage, Food, and Tobacco |
12.00 | % | — | 1,099 | 984,344 | 1,111,742 | ||||||||||||||||
| TZ Holdings, L.P., Series A (Trizetto Group, Inc.) |
— | Insurance | — | — | 686 | 685,820 | 685,820 | |||||||||||||||||
| TZ Holdings, L.P., Series B (Trizetto Group, Inc.) |
— | Insurance | 6.50 | % | — | 1,312 | 1,312,006 | 1,666,679 | ||||||||||||||||
| Verde Parent Holdings, Inc. |
— | Personal Transportation | 8.00 | % | — | 1,824,167 | 1,824,167 | 1,949,629 | ||||||||||||||||
|
|
|
|
|
|||||||||||||||||||||
| Total Preferred Equity/Partnership Interests |
|
12,101,421 | 11,178,282 | |||||||||||||||||||||
|
|
|
|
|
|||||||||||||||||||||
SEE NOTES TO CONSOLIDATED FINANCIAL STATEMENTS
54
Table of Contents
PENNANTPARK INVESTMENT CORPORATION AND SUBSIDIARIES
CONSOLIDATED SCHEDULE OF INVESTMENTS (CONTINUED)
SEPTEMBER 30, 2012
| Issuer Name |
Maturity | Industry | Current Coupon |
Basis Point Spread Above Index (4) |
Par / Shares |
Cost | Fair Value (3) | |||||||||||||||||
|
Common Equity/Warrants/Partnership Interests—9.2%(6) |
| |||||||||||||||||||||||
| Acentia, LLC, Class A Units (12) |
— | Electronics | — | — | 1,998 | $ | 2,000,000 | $ | 1,737,396 | |||||||||||||||
| AH Holdings, Inc. (Warrants) (American Surgical Holdings, Inc.) |
03/23/2021 | Healthcare, Education and Childcare |
753 | — | 2,063,780 | |||||||||||||||||||
| Alegeus Technologies Holding Corp., Class A (Alegeus Technologies, LLC) |
— | Financial Services | — | — | 1 | 950 | 1,033 | |||||||||||||||||
| Autumn Games, LLC |
— | Broadcasting and Entertainment |
— | — | 1,333,330 | 3,000,000 | — | |||||||||||||||||
| CI (Galls) Prime Investment Holdings, LLC (11) (Galls, LLC; Quartermaster Inc.) |
— | Distribution | — | — | 1,505,000 | 1,505,000 | 1,680,720 | |||||||||||||||||
| CI (IHS) Investment Holdings, LLC (Interactive Health Solutions, Inc.) |
— | Healthcare, Education and Childcare |
— | — | 23,416 | 234,693 | 270,457 | |||||||||||||||||
| CI (IHS) Investment Holdings, LLC(9) (Interactive Health Solutions, Inc.) |
— | Healthcare, Education and Childcare |
— | — | 11,708 | 117,346 | — | |||||||||||||||||
| Convergint Technologies Holdings, LLC (Convergint Technologies) LLC |
— | Electronics | — | — | 2,375 | — | — | |||||||||||||||||
| CT Technologies Holdings, LLC |
— | Business Services | — | — | 5,556 | 1,904,033 | 6,665,183 | |||||||||||||||||
| DirectBuy Investors, L.P. |
— | Consumer Products | — | — | 30,000 | 1,350,000 | — | |||||||||||||||||
| HW Topco, Inc. (Hanley-Wood, LLC) |
— | Other Media | — | — | 348,912 | 2,443,050 | 2,642,438 | |||||||||||||||||
| Kadmon Holdings, LLC, Class A (Kadmon Pharmaceuticals, LLC) |
— | Healthcare, Education and Childcare |
— | — | 1,079,920 | 1,236,832 | 12,013,688 | |||||||||||||||||
| Kadmon Holdings, LLC, Class D (Kadmon Pharmaceuticals, LLC) |
— | Healthcare, Education and Childcare |
— | — | 1,079,920 | 1,028,807 | 1,028,807 | |||||||||||||||||
| Learning Care Group (US) Inc. (Warrants) |
04/27/2020 | Education | — | — | 1,267 | 779,920 | — | |||||||||||||||||
| Magnum Hunter Resources Corporation (Eureka Hunter Pipeline, LLC) |
— | Oil and Gas | — | — | 1,221,932 | 3,239,999 | 5,425,378 | |||||||||||||||||
| Magnum Hunter Resources Corporation (Warrants) (Eureka Hunter Pipeline, LLC) |
10/14/2013 | Oil and Gas | — | — | 122,193 | 105,697 | 31,778 | |||||||||||||||||
| MidOcean JF Holdings Corp. (JF Acquisition, LLC) |
— | Distribution | — | — | 1,700 | 1,700,000 | 1,641,575 | |||||||||||||||||
| MidOcean PPL Holdings, Inc. (Pre-Paid Legal Services, Inc.) |
— | Personal, Food and Miscellaneous Services |
— | — | 3,000 | 3,000,000 | 4,377,360 | |||||||||||||||||
| Paradigm Acquisition Corp. (Paradigm Management Services, LLC) |
— | Healthcare, Education and Childcare |
— | — | 20,000 | 2,000,000 | 2,124,491 | |||||||||||||||||
| PAS Tech Holdings, Inc. (PAS Technologies, Inc.) |
— | Aerospace and Defense | — | — | 20,000 | 20,000 | — | |||||||||||||||||
| QMG HoldCo, LLC, Class A (Questex Media Group, Inc.) |
— | Other Media | — | — | 4,325 | 1,306,166 | 1,404,661 | |||||||||||||||||
| QMG HoldCo, LLC, Class B (Questex Media Group, Inc.) |
— | Other Media | — | — | 531 | — | 172,457 | |||||||||||||||||
| SPG Boyd Holdings Corp. (LTI Flexible Products, Inc.) |
— | Chemical, Plastic and Rubber |
— | — | 300,000 | 3,000,000 | 3,000,000 | |||||||||||||||||
| Titan Private Holdings I, LLC – Class A (Tekelec Global, Inc.) |
— | Telecommunications | — | — | 2,276,847 | 2,274,883 | 6,182,426 | |||||||||||||||||
| TRAK Acquisition Corp. (Warrants) |
12/29/2019 | Business Services | — | — | 3,500 | 29,400 | 1,197,412 | |||||||||||||||||
| Transportation 100 Holdco, L.L.C. (13) (Greatwide Logistics Services, L.L.C.) |
— | Cargo Transport | — | — | 137,923 | 2,111,588 | — | |||||||||||||||||
| TZ Holdings, L.P. (Trizetto Group, Inc.) |
— | Insurance | — | — | 2 | 9,567 | 713,718 | |||||||||||||||||
| Verde Parent Holdings, Inc. |
— | Personal Transportation |
— | — | 9,166 | 9,167 | — | |||||||||||||||||
| VText Holdings, Inc. (Veritext Corp.) |
— | Business Services | — | — | 35,526 | 4,050,000 | 6,941,000 | |||||||||||||||||
|
|
|
|
|
|||||||||||||||||||||
| Total Common Equity/Warrants/ Partnership Interests |
|
38,457,098 | 61,315,758 | |||||||||||||||||||||
|
|
|
|
|
|||||||||||||||||||||
| Total Investments in Non-Controlled, Non-Affiliated Portfolio Companies |
|
871,867,953 | 871,892,745 | |||||||||||||||||||||
|
|
|
|
|
|||||||||||||||||||||
SEE NOTES TO CONSOLIDATED FINANCIAL STATEMENTS
55
Table of Contents
PENNANTPARK INVESTMENT CORPORATION AND SUBSIDIARIES
CONSOLIDATED SCHEDULE OF INVESTMENTS (CONTINUED)
SEPTEMBER 30, 2012
| Issuer Name |
Maturity | Industry | Current Coupon |
Basis Point Spread Above Index (4) |
Par / Shares |
Cost | Fair Value (3) | |||||||||||||||||
| Investments in Non-Controlled, Affiliated Portfolio Companies—12.0% (1),(2) |
| |||||||||||||||||||||||
| Second Lien Secured Debt—1.1% |
||||||||||||||||||||||||
| Performance, Inc. |
01/16/2015 | Leisure, Amusement Motion Pictures and Entertainment |
7.25 | % | L+625 | (8) | 8,000,000 | $ | 8,000,000 | $ | 7,672,000 | |||||||||||||
|
|
|
|
|
|||||||||||||||||||||
| Subordinated Debt/Corporate Notes—7.1% |
||||||||||||||||||||||||
| Performance Holdings, Inc. |
07/16/2015 | Leisure, Amusement, Motion Pictures and |
15.00 | %(7) | — | 7,567,234 | 7,435,314 | 7,453,725 | ||||||||||||||||
| Service Champ, Inc. |
10/02/2017 | Auto Sector | 12.50 | % | — | 24,000,000 | 23,495,700 | 24,000,000 | ||||||||||||||||
| Service Champ, Inc. (9) |
10/02/2013 | Auto Sector | — | — | 16,000,000 | 15,640,000 | 16,000,000 | |||||||||||||||||
|
|
|
|
|
|||||||||||||||||||||
| Total Subordinated Debt/Corporate Notes |
|
46,571,014 | 47,453,725 | |||||||||||||||||||||
|
|
|
|
|
|||||||||||||||||||||
| Common Equity/Partnership Interest—3.8% (6) |
||||||||||||||||||||||||
| EnviroSolutions, Inc. |
— | Environmental Services | — | — | 125,106 | 10,055,844 | 18,425,519 | |||||||||||||||||
| NCP-Performance (Performance Holdings, Inc.) |
— | Leisure, Amusement, Motion Pictures and |
— | — | 375,000 | 3,750,000 | 2,902,355 | |||||||||||||||||
| New Service Champ Holdings, Inc. (Service Champ, Inc.) |
— | Auto Sector | — | — | 16,800 | 4,200,000 | 4,501,658 | |||||||||||||||||
|
|
|
|
|
|||||||||||||||||||||
| Total Common Equity/Partnership Interest |
|
18,005,844 | 25,829,532 | |||||||||||||||||||||
|
|
|
|
|
|||||||||||||||||||||
| Total Investments in Non-Controlled, Affiliated Portfolio Companies |
|
72,576,858 | 80,955,257 | |||||||||||||||||||||
|
|
|
|
|
|||||||||||||||||||||
| Investments in Controlled, Affiliated Portfolio Companies—5.6% (1),(2) |
||||||||||||||||||||||||
| First Lien Secured Debt—1.9% |
||||||||||||||||||||||||
| SuttonPark Holdings, Inc. |
06/30/2020 | Business Services | 14.00 | %(7) | — | 10,800,000 | 10,800,000 | 10,800,000 | ||||||||||||||||
| UP Support Services, Inc. (9) |
12/31/2015 | Oil and Gas | — | — | 743,187 | 668,632 | 743,187 | |||||||||||||||||
| UP Support Services, Inc. (9) |
12/31/2015 | Oil and Gas | — | — | 1,173,479 | 1,068,059 | 1,173,479 | |||||||||||||||||
|
|
|
|
|
|||||||||||||||||||||
| Total First Lien Secured Debt |
|
12,536,691 | 12,716,666 | |||||||||||||||||||||
|
|
|
|
|
|||||||||||||||||||||
| Second Lien Secured Debt—2.1% |
||||||||||||||||||||||||
| UP Support Services, Inc. |
12/31/2015 | Oil and Gas |
|
15.00 (PIK 15.00 |
% )% |
— | 14,300,282 | 11,809,647 | 14,300,282 | |||||||||||||||
|
|
|
|
|
|||||||||||||||||||||
| Subordinated Debt/Corporate Notes—0.3% |
||||||||||||||||||||||||
| SuttonPark Holdings, Inc. |
06/30/2020 | Business Services | 14.00 | %(7) | — | 2,700,000 | 2,700,000 | 2,158,053 | ||||||||||||||||
|
|
|
|
|
|||||||||||||||||||||
| Preferred Equity—1.3%(6) |
||||||||||||||||||||||||
| SuttonPark Holdings, Inc. |
— | Business Services | 14.00 | % | — | 2,000 | 2,000,000 | 216,947 | ||||||||||||||||
| Universal Pegasus International Holdings, Inc. |
— | Oil and Gas | 8.00 | % | — | 411,988 | 35,120,613 | 8,239,760 | ||||||||||||||||
|
|
|
|
|
|||||||||||||||||||||
| Total Preferred Equity |
|
37,120,613 | 8,456,707 | |||||||||||||||||||||
|
|
|
|
|
|||||||||||||||||||||
| Common Equity—0.0% (6) |
||||||||||||||||||||||||
| SuttonPark Holdings, Inc. |
— | Business Services | — | — | 100 | 100 | — | |||||||||||||||||
|
|
|
|
|
|||||||||||||||||||||
| Total Investments in Controlled, Affiliated Portfolio Companies |
|
64,167,051 | 37,631,708 | |||||||||||||||||||||
|
|
|
|
|
|||||||||||||||||||||
| Total Investments—147.9% |
|
1,008,611,862 | 990,479,710 | |||||||||||||||||||||
|
|
|
|
|
|||||||||||||||||||||
| Cash Equivalents—1.1% |
|
7,559,453 | 7,559,453 | |||||||||||||||||||||
|
|
|
|
|
|||||||||||||||||||||
| Total Investments and Cash Equivalents—149.0% |
|
$ | 1,016,171,315 | $ | 998,039,163 | |||||||||||||||||||
|
|
|
|||||||||||||||||||||||
| Liabilities in Excess of Other Assets—(49.0%) |
|
(328,322,116 | ) | |||||||||||||||||||||
|
|
|
|||||||||||||||||||||||
| Net Assets—100.0% |
|
$ | 669,717,047 | |||||||||||||||||||||
|
|
|
|||||||||||||||||||||||
| (1) | The provisions of the 1940 Act classify investments based on the level of control that we maintain in a particular portfolio company. As defined in the 1940 Act, a company is deemed as “non-controlled” when we own less than 25% of a portfolio company’s voting securities and “controlled” when we own 25% or more of a portfolio company’s voting securities. |
| (2) | The provisions of the 1940 Act classify investments further based on the level of ownership that we maintain in a particular portfolio company. As defined in the 1940 Act, a company is deemed as “non-affiliated” when we own less than 5% of a portfolio company’s voting securities and “affiliated” when we own 5% or more of a portfolio company’s voting securities. |
| (3) | Valued based on our accounting policy (see Note 2). |
| (4) | Represents floating rate instruments that accrue interest at a predetermined spread relative to an index, typically the applicable LIBOR or “L”, or Prime or “P”, rate. |
| (5) | Security is exempt from registration under Rule 144A promulgated under the Securities Act. The security may be resold in transactions that are exempt from registration, normally to qualified institutional buyers. |
| (6) | Non-income producing securities. |
| (7) | Coupon is payable in cash and/or PIK. |
| (8) | Coupon is subject to a LIBOR or Prime rate floor. |
| (9) | Represents the purchase of a security with delayed settlement (unfunded investments). This security does not have a basis point spread above an index. |
| (10) | Non-U.S. company or principal place of business outside the U.S. |
| (11) | Investment is held through PNNT CI (Galls) Prime Investment Holdings, LLC, a consolidated subsidiary. |
| (12) | Investment is held through PNNT Acentia LLC, a consolidated subsidiary. |
| (13) | Investment is held through PNNT Transportation 100 Holdco, LLC, a consolidated subsidiary. |
SEE NOTES TO CONSOLIDATED FINANCIAL STATEMENTS
56
Table of Contents
PENNANTPARK INVESTMENT CORPORATION AND SUBSIDIARIES
NOTES TO CONSOLIDATED FINANCIAL STATEMENTS
SEPTEMBER 30, 2013
Except where the context suggests otherwise, “we,” “our” or “us” refer to PennantPark Investment Corporation and its consolidated subsidiaries. “PennantPark Investment” refers to only PennantPark Investment Corporation; “our SBIC Funds” refers collectively to our consolidated subsidiaries, PennantPark SBIC LP, or SBIC LP, and its general partner, PennantPark SBIC GP, LLC, and PennantPark SBIC II LP, or SBIC II, and its general partner, PennantPark SBIC GP II, LLC; “SBA” refers to the Small Business Administration; “Credit Facility” refers to our multi-currency, senior secured revolving credit facility; “2025 Notes” refers to our 6.25% senior notes due 2025; “BDC” refers to a business development company under the Investment Company Act of 1940, as amended, or the 1940 Act; “Code” refers to the Internal Revenue Code of 1986, as amended; “RIC” refers to a regulated investment company under the Code.
1. ORGANIZATION
PennantPark Investment Corporation was organized as a Maryland corporation in January 2007. PennantPark Investment is a closed-end, externally managed, non-diversified investment company that has elected to be treated as a BDC. PennantPark Investment’s objective is to generate both current income and capital appreciation through debt and equity investments. We invest primarily in U.S. middle-market companies in the form of senior secured loans, mezzanine debt and, to a lesser extent, equity investments. On April 24, 2007, we closed our initial public offering and our common stock trades on the NASDAQ Global Select Market under the symbol “PNNT.” Our 2025 Notes trade on the NYSE under the symbol “PNTA.”
We have entered into an investment management agreement, or the Investment Management Agreement, with the Investment Adviser, an external adviser that manages our day-to-day operations. We have also entered into an administration agreement, or the Administration Agreement, with the Administrator, which provides the administrative services necessary for us to operate. PennantPark Investment, through the Investment Adviser, manages day-to-day operations of and provides investment advisory services to each of our SBIC Funds under separate investment management agreements. PennantPark Investment, through the Administrator, also provides similar services to each of our SBIC Funds and our controlled affiliate SuttonPark Holdings, Inc. and its subsidiaries, or SPH, under separate administration agreements. See Note 3.
Our wholly owned subsidiaries, SBIC LP and SBIC II, were organized as Delaware limited partnerships in May 2010 and July 2012, respectively. SBIC LP and SBIC II received licenses from the SBA to operate as small business investment companies, or SBICs, under Section 301(c) of the Small Business Investment Act of 1958, as amended, or the 1958 Act, in July 2010 and January 2013, respectively. Our SBIC Funds’ objectives are to generate both current income and capital appreciation through debt and equity investments generally by investing with us in SBA eligible businesses that meet the investment criteria used by PennantPark Investment.
We have formed and expect to continue to form certain taxable subsidiaries, or the Taxable Subsidiaries, which are taxed as corporations for federal income tax purposes. These Taxable Subsidiaries allow us to hold equity securities of portfolio companies organized as pass-through entities while continuing to satisfy the requirements of a RIC under the Code.
2. SIGNIFICANT ACCOUNTING POLICIES
The preparation of our Consolidated Financial Statements in conformity with U.S. generally accepted accounting principles, or GAAP, requires management to make estimates and assumptions that affect the reported amount of our assets and liabilities at the date of the Consolidated Financial Statements and the reported amounts of income and expenses during the reported periods. Actual results could differ from these estimates. We may reclassify certain prior period amounts to conform to the current period presentation. We have eliminated all intercompany balances and transactions. References to the Accounting Standards Codification, or ASC, serve as a single source of accounting literature. Subsequent events are evaluated and disclosed as appropriate for events occurring through the date the Consolidated Financial Statements are issued. Changes in the economic and regulatory environment, financial markets and any other parameters used in determining such estimates could cause actual results to differ.
Our Consolidated Financial Statements are prepared in accordance with GAAP and pursuant to the requirements for reporting on Form 10-K/Q and Article 6 or 10 of Regulation S-X, as appropriate. In accordance with Article 6-09 of Regulation S-X, we have provided a Consolidated Statement of Changes in Net Assets in lieu of a Consolidated Statement of Changes in Stockholders’ Equity.
Our significant accounting policies consistently applied are as follows:
(a) Investment Valuations
Our board of directors generally uses market quotations to assess the value of our investments for which market quotations are readily available. We obtain these market values from independent pricing services or at the bid prices obtained from at least two broker/dealers if available, otherwise by a principal market maker or a primary market dealer. The Investment Adviser assesses the source and reliability of bids from brokers or dealers. If the board of directors has a bona fide reason to believe any such market quote does not reflect the fair value of an investment, it may independently value such investments by using the valuation procedure that it uses with respect to assets for which market quotations are not readily available. Investments of sufficient credit quality purchased within 60 days of maturity are valued at cost plus accreted discount, or minus amortized premium, which approximates fair value.
We expect that there will not be readily available market values for many of our investments which are or will be in our portfolio, and we value such investments at fair value as determined in good faith by or under the direction of our board of directors using a documented valuation policy, described in this Report, and a consistently applied valuation process. With respect to investments for which there is no readily available market value, the factors that the board of directors may take into account in pricing our investments at fair value include, as relevant, the nature and realizable value of any collateral, the portfolio company’s ability to make payments and its earnings and discounted cash flow, the markets in which the portfolio company does business, comparison to publicly traded securities and other relevant factors. When an external event such as a purchase transaction, public offering or subsequent equity sale occurs, we consider the pricing indicated by the external event to corroborate or revise our valuation. Due to the inherent uncertainty of determining the fair value of investments that do not have a readily available market value, the price used in an actual transaction may be different than our valuation and the difference may be material. See Note 5.
With respect to investments for which market quotations are not readily available, or for which market quotations are deemed not reflective of the fair value, our board of directors undertakes a multi-step valuation process each quarter, as described below:
| (1) | Our quarterly valuation process begins with each portfolio company or investment being initially valued by the investment professionals of our Investment Adviser responsible for the portfolio investment; |
| (2) | Preliminary valuation conclusions are then documented and discussed with the management of our Investment Adviser; |
| (3) | Our board of directors also engages independent valuation firms to conduct independent appraisals of our investments for which market quotations are not readily available or are readily available but deemed not reflective of the fair value of the investment. The independent valuation firms review management’s preliminary valuations in light of their own independent assessment and also in light of any market quotations obtained from an independent pricing service, broker, dealer or market maker; |
57
Table of Contents
PENNANTPARK INVESTMENT CORPORATION AND SUBSIDIARIES
NOTES TO CONSOLIDATED FINANCIAL STATEMENTS
SEPTEMBER 30, 2013
| (4) | The audit committee of our board of directors reviews the preliminary valuations of the Investment Adviser and those of the independent valuation firms on a quarterly basis, periodically assesses the valuation methodologies of the independent valuation firms, and responds to and supplements the valuation recommendations of the independent valuation firms to reflect any comments; and |
| (5) | Our board of directors discusses these valuations and determines the fair value of each investment in our portfolio in good faith based on the input of our Investment Adviser, the respective independent valuation firms and the audit committee. |
(b) Security Transactions, Revenue Recognition, and Realized / Unrealized Gains or Losses
Security transactions are recorded on a trade-date basis. We measure realized gains or losses by the difference between the net proceeds from the repayment or sale and the amortized cost basis of the investment, using the specific identification method, without regard to unrealized appreciation or depreciation previously recognized, but considering unamortized upfront fees and prepayment penalties. Net change in unrealized appreciation or depreciation reflects the change in the fair values of our portfolio investments and our Credit Facility during the reporting period, including any reversal of previously recorded unrealized appreciation or depreciation, when gains or losses are realized.
We record interest income on an accrual basis to the extent that we expect to collect such amounts. For loans and debt investments with contractual PIK interest, which represents interest accrued and added to the loan balance that generally becomes due at maturity, we will generally not accrue PIK interest when the portfolio company valuation indicates that such PIK interest is not collectable. We do not accrue as a receivable interest on loans and debt investments if we have reason to doubt our ability to collect such interest. Loan origination fees, original issue discount, or OID, market discount or premium and deferred financing costs are capitalized and we then accrete or amortize such amounts using the effective interest method as interest income or interest expense as it relates to our deferred financing costs. We record prepayment penalties on loans and debt investments as income. Dividend income, if any, is recognized on an accrual basis on the ex-dividend date to the extent that we expect to collect such amounts.
Loans are placed on non-accrual status when principal or interest payments are past due 30 days or more and/or there is reasonable doubt that principal or interest will be collected. Accrued interest is generally reversed when a loan is placed on non-accrual status. Interest payments received on non-accrual loans may be recognized as income or applied to principal depending upon management’s judgment. Non-accrual loans are restored to accrual status when past due principal and interest are paid and, in management’s judgment, are likely to remain current.
(c) Income Taxes
We have complied with the requirements of Subchapter M of the Code and expect to be subject to tax as a RIC. As a result, we account for income taxes using the asset liability method prescribed by ASC 740, Income Taxes. Under this method, income taxes are provided for amounts currently payable and for amounts deferred as tax assets and liabilities based on differences between the financial statement carrying amounts and the tax basis of existing assets and liabilities. Based upon PennantPark Investment’s qualification and election to be subject to tax as a RIC, we do not anticipate paying any material level of federal income taxes in the future. Although we are not subject to tax as a RIC, we have elected to retain a portion of our calendar year income and accrued estimated excise taxes of $(0.1) million, $0.3 million and $0.2 million for the fiscal years ended September 30, 2013, 2012 and 2011, respectively.
PennantPark Investment recognizes in its Consolidated Financial Statements the effect of a tax position when it is more likely than not, based on the technical merits, that the position will be sustained upon examination. We did not have any uncertain tax positions that met the recognition or measurement criteria of ASC 740-10-25 nor did we have any unrecognized tax benefits as of the periods presented herein. Although we file federal and state tax returns, our major tax jurisdiction is federal. Our tax returns for each of our federal tax years since 2009 remain subject to examination by the Internal Revenue Service and the state department of revenue.
Because federal income tax regulations differ from GAAP, distributions in accordance with tax regulations may differ from net investment income and realized gains recognized for financial reporting purposes. Differences may be permanent or temporary. Permanent differences are reclassified among capital accounts in the Consolidated Financial Statements to reflect their tax character. Temporary differences arise when certain items of income, expense, gain or loss are recognized at some time in the future. We do not consolidate the Taxable Subsidiaries for income tax purposes, but we do consolidate the results of these Taxable Subsidiaries for financial reporting purposes.
(d) Distributions and Capital Transactions
Distributions to common stockholders are recorded on the ex-dividend date. The amount to be paid, if any, as a distribution is determined by the board of directors each quarter and is generally based upon the earnings estimated by management. Net realized capital gains, if any, are distributed at least annually. The tax attributes for distributions will generally include ordinary income and capital gains but may also include qualified dividends and/or return of capital.
Capital transactions, in connection with our dividend reinvestment plan or through offerings of our common stock, are recorded when issued and offering costs are charged as a reduction of capital upon issuance of our common stock.
(e) Consolidation
As permitted under Regulation S-X and as explained by ASC 946-810-45, PennantPark Investment will generally not consolidate its investment in a company other than an investment company subsidiary or a controlled operating company whose business consists of providing services to us. Accordingly, we have consolidated the results of SBIC LP, SBIC GP and our Taxable Subsidiaries in our Consolidated Financial Statements.
3. AGREEMENTS
The Investment Management Agreement with the Investment Adviser was re-approved by our board of directors, including a majority of our directors who are not interested persons of us or the Investment Adviser, in February 2013. Under the Investment Management Agreement the Investment Adviser, subject to the overall supervision of our board of directors, manages the day-to-day operations of and provides investment advisory services to, PennantPark Investment. Our SBIC Funds’ investment management agreements do not affect the management or incentive fees that we pay to the Investment Adviser on a consolidated basis. For providing these services, the Investment Adviser receives a fee from us, consisting of two components—a base management fee and an incentive fee.
The base management fee is calculated at an annual rate of 2.00% of our “average adjusted gross assets” (net of U.S. Treasury Bills and/or temporary draws under any credit facility, repurchase agreements or other balance sheet transactions undertaken at the end of a fiscal quarter for purposes of preserving investment flexibility for the next quarter, if any) and is payable quarterly in arrears. The base management fee is calculated based on the average adjusted gross assets at the end of the two most recently completed calendar quarters, and appropriately adjusted for any share issuances or repurchases during the current calendar quarter. For example, if we sold shares on the 45th day of a quarter and did not use the proceeds from the sale to repay outstanding indebtedness, our gross assets for such quarter would give effect to the net proceeds of the issuance for only 45 days of the quarter during which the additional shares were outstanding. For the fiscal years ended September 30, 2013, 2012 and 2011, the Investment Adviser earned base management fees of $21.3 million, $17.5 million and $14.9 million, respectively, from us.
58
Table of Contents
PENNANTPARK INVESTMENT CORPORATION AND SUBSIDIARIES
NOTES TO CONSOLIDATED FINANCIAL STATEMENTS
SEPTEMBER 30, 2013
The incentive fee has two parts, as follows:
One part is calculated and payable quarterly in arrears based on our Pre-Incentive Fee Net Investment Income for the immediately preceding calendar quarter. For this purpose, Pre-Incentive Fee Net Investment Income means interest income, distribution income and any other income, including any other fees other than fees for providing managerial assistance, such as commitment, origination, structuring, diligence and consulting fees or other fees received from portfolio companies accrued during the calendar quarter, minus our operating expenses for the quarter (including the base management fee, any expenses payable under the Administration Agreement, and any interest expense and distribution paid on any issued and outstanding preferred stock, but excluding the incentive fee). Pre-Incentive Fee Net Investment Income includes, in the case of investments with deferred interest feature (such as OID, debt instruments with PIK interest and zero coupon securities), accrued income not yet received in cash. Pre-Incentive Fee Net Investment Income does not include any realized capital gains, realized capital losses or unrealized capital appreciation or depreciation. Pre-Incentive Fee Net Investment Income, expressed as a rate of return on the value of our net assets at the end of the immediately preceding calendar quarter, is compared to the hurdle rate of 1.75% per quarter (7.00% annualized). We pay the Investment Adviser an incentive fee with respect to our Pre-Incentive Fee Net Investment Income in each calendar quarter as follows: (1) no incentive fee in any calendar quarter in which our Pre-Incentive Fee Net Investment Income does not exceed the hurdle rate of 1.75%, (2) 100% of our Pre-Incentive Fee Net Investment Income with respect to that portion of such Pre-Incentive Fee Net Investment Income, if any, that exceeds the hurdle rate but is less than 2.1875% in any calendar quarter (8.75% annualized), and (3) 20% of the amount of our Pre-Incentive Fee Net Investment Income, if any, that exceeds 2.1875% in any calendar quarter. These calculations are adjusted for any share issuances or repurchases during the relevant quarter. For the fiscal years ended September 30, 2013, 2012 and 2011, the Investment Adviser received an incentive fee of $16.8 million, $14.2 million and $13.2 million, respectively, from us.
The second part of the incentive fee is determined and payable in arrears as of the end of each calendar year (or upon termination of the Investment Management Agreement, as of the termination date) and equals 20.0% of our realized capital gains, if any, on a cumulative basis from inception through the end of each calendar year, computed net of all realized capital losses and unrealized capital depreciation on a cumulative basis, less the aggregate amount of any previously paid capital gain incentive fees. For the fiscal years ended September 30, 2013, 2012 and 2011 the Investment Adviser did not earn an incentive fee on capital gains as calculated under the Investment Management Agreement (as described above).
Under GAAP, we are required to accrue a capital gains incentive fee based upon net realized capital gains and net unrealized capital appreciation and depreciation on investments held at the end of each period. In calculating the capital gains incentive fee accrual we considered the cumulative aggregate unrealized capital appreciation in the calculation, as a capital gains incentive fee would be payable if such unrealized capital appreciation were realized, even though such unrealized capital appreciation is not permitted to be considered in calculating the fee actually payable under the Investment Management Agreement. This accrual is calculated using the aggregate cumulative realized capital gains and losses and aggregate cumulative unrealized capital appreciation or depreciation. If such amount is positive at the end of a period, then we record a capital gains incentive fee equal to 20% of such amount, less the aggregate amount of actual capital gains related incentive fees paid in all prior years. If such amount is negative, then there is no accrual for such year. There can be no assurance that such unrealized capital appreciation will be realized in the future. For the years ended September 30, 2013, 2012 and 2011, our unrealized and realized capital gains did not exceed our cumulative realized and unrealized losses and resulted in no accrual under GAAP.
The Administration Agreement with the Administrator was reapproved by our board of directors, including a majority of our directors who are not interested persons of us, in February 2013. Under the Administration Agreement, the Administrator provides administrative services and office facilities to us. The Administrator provides similar services to our SBIC Funds under each of their administration agreements with PennantPark Investment. For providing these services, facilities and personnel, PennantPark Investment has agreed to reimburse the Administrator for our allocable portion of overhead and other expenses incurred by the Administrator in performing its obligations under our Administration Agreement, including rent, technology systems, insurance and PennantPark Investment’s allocable portion of the costs of compensation and related expenses for its Chief Compliance Officer, Chief Financial Officer and their respective staffs. The Administrator also offers, on PennantPark Investment’s behalf, managerial assistance to portfolio companies to which PennantPark Investment is required to offer such assistance. Reimbursement for certain of these costs is included in administrative services expenses in the Consolidated Statement of Operations. For the fiscal years ended September 30, 2013, 2012 and 2011, the Investment Adviser and Administrator, collectively, were reimbursed $2.9 million, $3.6 million and $2.6 million, respectively, from us, including expenses incurred on behalf of the Administrator, for the services described above.
PennantPark Investment has entered into an administration agreement with its controlled affiliate SPH. Under the administration agreement with SPH, or the SPH Administration Agreement, PennantPark Investment through the Administrator furnishes SPH with office facilities, equipment and clerical, bookkeeping and record keeping services at such facilities. Additionally, the Administrator performs or oversees the performance of SPH’s required administrative services, which include, among other things, maintaining financial records, preparing financial reports and filing tax returns. Payments under the SPH Administration Agreement are equal to an amount based upon SPH’s allocable portion of the Administrator’s overhead in performing its obligations under the SPH Administration Agreement, including rent and allocable portion of the cost of compensation and related expenses of our Chief Financial Officer and his staff. For the fiscal years ended September 30, 2013, 2012 and 2011, PennantPark Investment was reimbursed $0.4 million, $0.7 million and $0.5 million, respectively, for the services described above.
59
Table of Contents
PENNANTPARK INVESTMENT CORPORATION AND SUBSIDIARIES
NOTES TO CONSOLIDATED FINANCIAL STATEMENTS
SEPTEMBER 30, 2013
4. INVESTMENTS
Purchases of long-term investments, including PIK, for the fiscal years ended September 30, 2013, 2012 and 2011 totaled $516.2 million, $337.3 million and $490.6 million, respectively. Sales and repayments of long-term investments for the fiscal years ended September 30, 2013, 2012 and 2011 totaled $437.1 million, $201.7 million and $304.0 million, respectively.
Investments and cash equivalents consisted of the following:
| September 30, 2013 | September 30, 2012 | |||||||||||||||
| Investment Classification |
Cost | Fair Value | Cost | Fair Value | ||||||||||||
| First lien |
$ | 290,000,430 | $ | 299,516,291 | $ | 289,964,255 | $ | 291,677,553 | ||||||||
| Second lien |
346,717,448 | 357,543,217 | 208,454,615 | 191,339,241 | ||||||||||||
| Subordinated debt / corporate notes |
311,240,637 | 302,447,308 | 404,507,916 | 400,682,637 | ||||||||||||
| Preferred equity and partnership interests |
65,943,244 | 12,830,669 | 49,222,034 | 19,634,989 | ||||||||||||
| Common equity and partnership interests |
77,616,126 | 105,838,068 | 56,463,042 | 87,145,290 | ||||||||||||
|
|
|
|
|
|
|
|
|
|||||||||
| Total investments |
1,091,517,885 | 1,078,175,553 | 1,008,611,862 | 990,479,710 | ||||||||||||
| Cash and cash equivalents |
58,440,829 | 58,440,829 | 7,559,453 | 7,559,453 | ||||||||||||
|
|
|
|
|
|
|
|
|
|||||||||
| Total investments, cash and cash equivalents |
$ | 1,149,958,714 | $ | 1,136,616,382 | $ | 1,016,171,315 | $ | 998,039,163 | ||||||||
|
|
|
|
|
|
|
|
|
|||||||||
The table below describes investments by industry classification and enumerates the percentage, by fair value, of the total portfolio assets (excluding cash equivalents) in such industries:
| As of September 30, | ||||||
| Industry Classification |
2013 | 2012 | ||||
| Personal, Food and Miscellaneous Services |
11% | 4% | ||||
| Printing and Publishing |
9 | 4 | ||||
| Business Services |
8 | 6 | ||||
| Electronics |
8 | 7 | ||||
| Energy/Utilities |
8 | 7 | ||||
| Healthcare, Education and Childcare |
7 | 8 | ||||
| Oil and Gas |
7 | 3 | ||||
| Chemicals, Plastics and Rubber |
6 | 5 | ||||
| Consumer Products |
5 | 5 | ||||
| Hotels, Motels, Inns and Gaming |
5 | 2 | ||||
| Other Media |
5 | 4 | ||||
| Auto Sector |
4 | 6 | ||||
| Communication |
3 | 3 | ||||
| Distribution |
2 | 4 | ||||
| Diversified Natural Resources, Precious Metals and Minerals |
2 | 3 | ||||
| Environmental Services |
2 | 2 | ||||
| Cargo Transport |
1 | 6 | ||||
| Education |
1 | 3 | ||||
| Mining, Steel, Iron and Non-Precious Metals |
1 | 3 | ||||
| Insurance |
1 | 2 | ||||
| Aerospace and Defense |
— | 2 | ||||
| Buildings and Real Estate |
— | 2 | ||||
| Leisure, Amusement, Motion Pictures, Entertainment |
— | 2 | ||||
| Telecommunications |
— | 2 | ||||
| Other |
4 | 5 | ||||
|
|
| |||||
| Total |
100% | 100% | ||||
|
|
| |||||
5. FAIR VALUE OF FINANCIAL INSTRUMENTS
Fair value, as defined under ASC 820, is the price that we would receive upon selling an investment or pay to transfer a liability in an orderly transaction to a market participant in the principal or most advantageous market for the investment or liability. ASC 820 emphasizes that valuation techniques maximize the use of observable market inputs and minimize the use of unobservable inputs. Inputs refer broadly to the assumptions that market participants would use in pricing an asset or liability, including assumptions about risk. Inputs may be observable or unobservable. Observable inputs reflect the assumptions market participants would use in pricing an asset or liability based on market data obtained from sources independent of us. Unobservable inputs reflect the assumptions market participants would use in pricing an asset or liability based on the best information available to us on the reporting period date.
ASC 820 classifies the inputs used to measure these fair values into the following hierarchies:
| Level 1: |
Inputs that are quoted prices (unadjusted) in active markets for identical assets or liabilities, accessible by us at the measurement date. | |
| Level 2: |
Inputs that are quoted prices for similar assets or liabilities in active markets, or that are quoted prices for identical or similar assets or liabilities in markets that are not active and inputs that are observable for the asset or liability, either directly or indirectly, for substantially the full term, if applicable, of the financial instrument. | |
| Level 3: |
Inputs that are unobservable for an asset or liability because they are based on our own assumptions about how market participants would price the asset or liability. | |
60
Table of Contents
PENNANTPARK INVESTMENT CORPORATION AND SUBSIDIARIES
NOTES TO CONSOLIDATED FINANCIAL STATEMENTS
SEPTEMBER 30, 2013
A financial instrument’s categorization within the valuation hierarchy is based upon the lowest level of input that is significant to the fair value measurement. Generally, most of our investments and Credit Facility are classified as Level 3. Due to the inherent uncertainty of determining the fair value of investments that do not have a readily available market value, the price used in an actual transaction may be different than our valuation and those differences may be material.
The inputs into the determination of fair value may require significant management judgment or estimation. Even if observable market data are available, such information may be the result of consensus pricing information or broker quotes which include a disclaimer that the broker would not be held to such a price in an actual transaction. The non-binding nature of consensus pricing and/or quotes accompanied by disclaimer would result in classification as Level 3 information, assuming no additional corroborating evidence was available. Corroborating evidence that would result in classifying these non-binding broker/dealer bids as a Level 2 asset includes observable market-based transactions for the same or similar assets or other relevant observable market based inputs that may be used in pricing an asset.
Our investments are generally structured as debt and equity investments in the form of senior secured loans, mezzanine debt and equity co-investments. The transaction price, excluding transaction costs, is typically the best estimate of fair value at inception. When evidence supports a subsequent change to the carrying value from the original transaction price, adjustments are made to reflect the expected exit values. Ongoing reviews by our Investment Adviser and independent valuation firms are based on an assessment of each underlying investment, incorporating valuations that consider the evaluation of financing and sale transactions with third parties, expected cash flows and market-based information including comparable transactions, performance multiples and yields, among other factors. Within our fair value hierarchy table, our investments are generally categorized as first lien, second lien, subordinated debt and preferred and common equity investments. The companies in which we invest are typically highly leveraged, and, in most cases, are not rated by national rating agencies. If such companies were rated, we believe that they would typically receive a rating below investment grade (between BB and CCC under the Standard & Poor’s system) from the national rating agencies.
A review of fair value hierarchy classifications is conducted on a quarterly basis. Changes in our ability to observe valuation inputs may result in a reclassification for certain financial assets or liabilities. Reclassifications impacting Level 3 of the fair value hierarchy are reported as transfers in or out of the Level 3 category as of the end of the quarter in which the reclassifications occur. During the fiscal year ended September 30, 2013, our ability to observe valuation inputs has resulted in a reclassification of an investment from Level 3 to 2 with no other reclassifications of assets between levels. During the fiscal year ended September 30, 2012, our ability to observe valuation inputs resulted in no reclassification of assets between levels.
In addition to using the above inputs in cash equivalents, investments, the 2025 Notes and our Credit Facility valuations, we employ the valuation policy approved by our board of directors that is consistent with ASC 820. Consistent with our valuation policy, we evaluate the source of inputs, including any markets in which our investments are trading, in determining fair value. See Note 2.
As outlined in the table below, some of our Level 3 investments using a market approach valuation technique are valued using the average of the bids from brokers or dealers. The bids include a disclaimer, may not have corroborating evidence and may be the result of consensus pricing. The Investment Adviser assesses the source and reliability of bids from brokers or dealers. If the board of directors has a bona fide reason to believe any such bids do not reflect the fair value on an investment it may independently value such investment by using the valuation procedure that it uses with respect to assets for which market quotations are not readily available.
The remainder of our portfolio, including our long-term Credit Facility, classified as Level 3 was valued using a market comparable or an enterprise market value technique. With respect to investments for which there is no readily available market value, the factors that the board of directors may take into account in pricing our investments at fair value include, as relevant, the nature and realizable value of any collateral, the portfolio company’s ability to make payments, its earnings and discounted cash flow, the markets in which the portfolio company does business, comparison to publicly traded securities and other relevant factors. When an external event such as a purchase transaction, public offering or subsequent equity sale occurs, the pricing indicated by the external event is used to corroborate the valuation. When using earnings multiples to value a portfolio company, the multiple used requires the use of judgment and estimates in determining how a market participant would price such an asset. Generally, the sensitivity of unobservable inputs or combination of inputs such as industry comparable companies, market outlook, consistency, discount rates and reliability of earnings and prospects for growth, or lack thereof, affects the multiple used in pricing an investment. As a result, any change in any one of those factors may have a significant impact on the valuation of an investment.
| Asset Category |
Fair Value at September 30, 2013 |
Valuation Technique | Unobservable Input | Range of Input (Weighted Average) | ||||||
| First lien, second lien, subordinated debt/corporate notes |
$ | 448,842,465 | Market Comparable | Broker/Dealer bid quotes | N/A | |||||
| First lien, second lien, subordinated debt/corporate notes |
466,571,947 | Market Comparable | Market Yield | 9.5% - 21.5% (13.5%) | ||||||
| Preferred and common equity |
110,923,754 | Enterprise Market Value | EBITDA multiple | 6.0 – 15.0 (9.0) | ||||||
|
|
|
|||||||||
| Total Level 3 investments |
$ | 1,026,338,166 | ||||||||
|
|
|
|||||||||
| Long-Term Credit Facility |
$ | 117,500,000 | Market Comparable | Discount rate | 3.6% | |||||
|
|
|
|||||||||
| Asset Category |
Fair Value at September 30, 2012 |
Valuation Technique | Unobservable Input | Range of Input (Weighted Average) | ||||||
| First lien, second lien, subordinated debt/corporate notes |
$ | 258,617,082 | Market Comparable | Broker/Dealer bid quotes | N/A | |||||
| First lien, second lien, subordinated debt/corporate notes |
$ | 589,806,989 | Market Comparable | Market Yield | 8.4% - 19.0% (14.1%) | |||||
| Preferred and common equity |
$ | 101,323,123 | Enterprise Market Value | EBITDA multiple | 4.3x - 15.5x (8.5x) | |||||
|
|
|
|||||||||
| Total Level 3 investments |
949,747,194 | |||||||||
|
|
|
|||||||||
| Long-Term Credit Facility |
$ | 144,452,500 | Market Comparable | Discount rate | 3.5% | |||||
|
|
|
|||||||||
61
Table of Contents
PENNANTPARK INVESTMENT CORPORATION AND SUBSIDIARIES
NOTES TO CONSOLIDATED FINANCIAL STATEMENTS
SEPTEMBER 30, 2013
Our cash equivalents, 2025 Notes and investments and our Credit Facility were categorized as follows in the fair value hierarchy for ASC 820 purposes:
| Fair Value | Fair Value at September 30, 2013 | |||||||||||||||
| Description |
Level 1 | Level 2 | Level 3 | |||||||||||||
| Loan and debt investments |
$ | 959,506,815 | $ | — | $ | 44,092,400 | $ | 915,414,415 | ||||||||
| Equity investments |
118,668,738 | 7,539,320 | 205,667 | 110,923,751 | ||||||||||||
|
|
|
|
|
|
|
|
|
|||||||||
| Total investments |
1,078,175,553 | 7,539,320 | 44,298,067 | 1,026,338,166 | ||||||||||||
| Cash and cash equivalents |
58,440,829 | 58,440,829 | — | — | ||||||||||||
|
|
|
|
|
|
|
|
|
|||||||||
| Total investments, cash and cash equivalents |
$ | 1,136,616,382 | $ | 65,980,149 | $ | 44,298,067 | $ | 1,026,338,166 | ||||||||
|
|
|
|
|
|
|
|
|
|||||||||
| Long-Term Credit Facility (excluding temporary draw of $28.0 million) |
$ | 117,500,000 | $ | — | $ | — | $ | 117,500,000 | ||||||||
| 2025 Notes |
68,400,000 | 68,400,000 | — | — | ||||||||||||
|
|
|
|
|
|
|
|
|
|||||||||
| Total debt |
$ | 185,900,000 | $ | 68,400,000 | $ | — | $ | 117,500,000 | ||||||||
|
|
|
|
|
|
|
|
|
|||||||||
| Fair Value | Fair Value at September 30, 2012 | |||||||||||||||
| Description |
Level 1 | Level 2 | Level 3 | |||||||||||||
| Loan and debt investments |
$ | 883,699,431 | $ | — | $ | 35,275,360 | $ | 848,424,071 | ||||||||
| Equity investments |
106,780,279 | 5,425,378 | 31,778 | 101,323,123 | ||||||||||||
|
|
|
|
|
|
|
|
|
|||||||||
| Total investments |
990,479,710 | 5,425,378 | 35,307,138 | 949,747,194 | ||||||||||||
| Cash and cash equivalents |
7,559,453 | 7,559,453 | — | — | ||||||||||||
|
|
|
|
|
|
|
|
|
|||||||||
| Total investments, cash and cash equivalents |
$ | 998,039,163 | $ | 12,984,831 | $ | 35,307,138 | $ | 949,747,194 | ||||||||
|
|
|
|
|
|
|
|
|
|||||||||
| Long-Term Credit Facility (excluding temporary draw of $35.5 million) |
$ | 108,952,500 | $ | — | $ | — | $ | 108,952,500 | ||||||||
|
|
|
|
|
|
|
|
|
|||||||||
The following tables show a reconciliation of the beginning and ending balances for fair valued investments measured using significant unobservable inputs (Level 3):
| Year Ended September 30, 2013 | ||||||||||||
| Description |
Loan and debt investments |
Equity investments | Totals | |||||||||
| Beginning Balance, September 30, 2012 |
$ | 848,424,071 | $ | 101,323,123 | $ | 949,747,194 | ||||||
| Realized gains (losses) |
6,721,638 | 3,311,652 | 10,033,290 | |||||||||
| Unrealized appreciation |
35,227,586 | (28,273,765 | ) | 6,953,821 | ||||||||
| Purchases, PIK, net discount accretion and non-cash exchanges |
512,045,145 | 46,647,608 | 558,692,753 | |||||||||
| Sales / repayments |
(474,164,025 | ) | (12,084,867 | ) | (486,248,892 | ) | ||||||
| Transfers in or out of Level 3 |
(12,840,000 | ) | — | (12,840,000 | ) | |||||||
|
|
|
|
|
|
|
|||||||
| Ending Balance, September 30, 2013 |
$ | 915,414,415 | $ | 110,923,751 | $ | 1,026,338,166 | ||||||
|
|
|
|
|
|
|
|||||||
| Net change in unrealized appreciation (depreciation) for the fiscal year reported within the net change in unrealized appreciation (depreciation) on investments in our Consolidated Statement of Operations attributable to our Level 3 assets still held at the reporting date |
$ | 33,158,082 | $ | (30,958,706 | ) | $ | 2,199,376 | |||||
|
|
|
|
|
|
|
|||||||
| Year Ended September 30, 2012 | ||||||||||||
| Description |
Loan and debt investments |
Equity investments |
Totals | |||||||||
| Beginning Balance, September 30, 2011 |
$ | 732,694,451 | $ | 52,353,328 | $ | 785,047,779 | ||||||
| Realized gains (losses) |
(1,893,297 | ) | (865,772 | ) | (2,759,069 | ) | ||||||
| Unrealized appreciation |
23,034,558 | (11,283,219 | ) | 11,751,339 | ||||||||
| Purchases, PIK, net discount accretion and non-cash exchanges |
288,868,017 | 66,892,499 | 355,760,516 | |||||||||
| Sales / repayments |
(194,279,658 | ) | (5,773,713 | ) | (200,053,371 | ) | ||||||
| Transfers in or out of Level 3 |
— | — | — | |||||||||
|
|
|
|
|
|
|
|||||||
| Ending Balance, September 30, 2012 |
$ | 848,424,071 | $ | 101,323,123 | $ | 949,747,194 | ||||||
|
|
|
|
|
|
|
|||||||
| Net change in unrealized appreciation (depreciation) for the fiscal year reported within the net change in unrealized appreciation (depreciation) on investments in our Consolidated Statement of Operations attributable to our Level 3 assets still held at the reporting date |
$ | 25,864,375 | $ | (9,858,219 | ) | $ | 16,006,156 | |||||
|
|
|
|
|
|
|
|||||||
62
Table of Contents
PENNANTPARK INVESTMENT CORPORATION AND SUBSIDIARIES
NOTES TO CONSOLIDATED FINANCIAL STATEMENTS
SEPTEMBER 30, 2013
The following table shows a reconciliation of the beginning and ending balances for fair valued liabilities measured using significant unobservable inputs (Level 3):
| Carrying / Fair Value | ||||||||
| Credit Facility |
Year Ended September 30, 2013 |
Year Ended September 30, 2012 |
||||||
| Beginning Balance (Cost – $109,500,000 and $240,900,000, respectively) |
$ | 108,952,500 | $ | 238,792,125 | ||||
| Total unrealized depreciation (appreciation) included in earnings |
547,500 | 1,560,375 | ||||||
| Borrowings(1) |
660,800,000 | 556,800,000 | ||||||
| Repayments(1) |
(652,800,000 | ) | (688,200,000 | ) | ||||
| Transfers in and/or out of Level 3 |
— | — | ||||||
|
|
|
|
|
|||||
| Ending Balance (Cost – $117,500,000 and $109,500,000, respectively) |
$ | 117,500,000 | $ | 108,952,500 | ||||
| Temporary draw outstanding, at cost |
28,000,000 | 35,500,000 | ||||||
|
|
|
|
|
|||||
| Ending Balance (Cost – $145,500,000 and 145,000,000, respectively) |
$ | 145,500,000 | $ | 144,452,500 | ||||
|
|
|
|
|
|||||
| (1) | Excludes temporary draws. |
We adopted ASC 825-10, which provides companies with an option to report selected financial assets and liabilities at fair value, and made an irrevocable election to apply ASC 825-10 to our Credit Facility and our 2025 Notes. We elected to use the fair value option for the Credit Facility and the 2025 Notes to align the measurement attributes of both our assets and liabilities while mitigating volatility in earnings from using different measurement attributes. Due to that election and in accordance with GAAP, we incurred $2.8 million, $5.4 million and zero debt issuance costs during the year ended September 30, 2013, 2012 and 2011, respectively. ASC 825-10 establishes presentation and disclosure requirements designed to facilitate comparisons between companies that choose different measurement attributes for similar types of assets and liabilities and to more easily understand the effect on earnings of a company’s choice to use fair value. ASC 825-10 also requires entities to display the fair value of the selected assets and liabilities on the face of the Consolidated Statement of Assets and Liabilities and changes in fair value of the Credit Facility and 2025 Notes are reported in our Consolidated Statement of Operations. We elected not to apply ASC 825-10 to any other financial assets or liabilities, including the SBA debentures. For the fiscal years ended September 30, 2013 and 2012, our Credit Facility and 2025 Notes had a net change in unrealized depreciation (appreciation) of $2.3 million and $(1.6) million, respectively. As of September 30, 2013 and 2012, net unrealized depreciation on our Credit Facility and 2025 Notes totaled $2.8 million and $0.5 million, respectively. We use a nationally recognized independent valuation service to fair value our Credit Facility in a manner consistent with the valuation process that the board of directors approves to value investments. Our 2025 Notes trade on the NYSE and we use the closing price on the exchange to determine their fair value.
6. TRANSACTIONS WITH AND INCOME ACCRUED FROM AFFILIATED COMPANIES
An affiliated company is a company in which we have ownership of 5% or more of its voting securities. A controlled affiliate is a company in which we own 25% or more of its voting securities. Transactions and accrued income related to our investments with both controlled and non-controlled affiliates for the year ended September 30, 2013 were as follows:
| Name of Investment |
Fair Value at September 30, 2012 |
Purchases of / Advances to Affiliates |
Sale of / Distributions from Affiliates |
Income Accrued |
Fair Value at September 30, 2013 |
Capital Gains / (Losses) |
||||||||||||||||||
| Controlled Affiliates |
||||||||||||||||||||||||
| SuttonPark Holdings, Inc. |
$ | 13,175,000 | $ | 5,500,000 | $ | (7,500,000 | ) | $ | 1,798,319 | $ | 13,500,000 | $ | — | |||||||||||
| Universal Pegasus International, LLC |
24,456,708 | 1,341,667 | (2,041,667 | ) | 3,008,010 | 19,468,711 | — | |||||||||||||||||
| Non-Controlled Affiliates |
||||||||||||||||||||||||
| Direct Buy Holdings, Inc. ** |
10,880,000 | 956,224 | — | 1,412,589 | 17,805,936 | (1,350,000 | ) | |||||||||||||||||
| Envirosolutions, Inc. |
18,425,519 | 1,835,978 | — | — | 21,265,345 | — | ||||||||||||||||||
| PAS International Holdings, Inc. * |
17,946,928 | 3,000,000 | — | 77,584 | 1,694,296 | (1,999,960 | ) | |||||||||||||||||
| Performance Holdings, Inc. |
18,028,080 | — | (15,851,005 | ) | 1,408,352 | 2,500,165 | 107,804 | |||||||||||||||||
| Service Champ, Inc. |
44,501,658 | 3,910,000 | (1,478,400 | ) | 3,540,001 | 33,470,058 | — | |||||||||||||||||
|
|
|
|
|
|
|
|
|
|
|
|
|
|||||||||||||
| Total Controlled and Non-Controlled Affiliates |
$ | 147,413,893 | $ | 16,543,869 | $ | (26,871,072 | ) | $ | 11,244,855 | $ | 109,704,511 | $ | (3,242,156 | ) | ||||||||||
|
|
|
|
|
|
|
|
|
|
|
|
|
|||||||||||||
| * | Became a non-controlled affiliate during the three months ended March 31, 2013. |
| ** | Became a non-controlled affiliate during the three months ended December 31, 2012. |
7. CHANGE IN NET ASSETS FROM OPERATIONS PER COMMON SHARE
The following information sets forth the computation of basic and diluted per share net increase in net assets resulting from operations:
| Years ended September 30, | ||||||||||||
| Class and Year |
2013 | 2012 | 2011 | |||||||||
| Numerator for net increase in net assets resulting from operations |
$ | 91,777,652 | $ | 63,353,100 | $ | 10,263,474 | ||||||
| Denominator for basic/diluted and weighted average shares |
66,380,829 | 52,969,278 | * | 42,196,076 | ||||||||
| Basic/diluted net increase in net assets per share resulting from operations |
$ | 1.39 | $ | 1.20 | $ | 0.24 | ||||||
| * | The denominator for diluted weighted average shares was 52,975,015 shares. |
63
Table of Contents
PENNANTPARK INVESTMENT CORPORATION AND SUBSIDIARIES
NOTES TO CONSOLIDATED FINANCIAL STATEMENTS
SEPTEMBER 30, 2013
8. TAXES AND DISTRIBUTIONS
Dividends from net investment income and net realized capital gains are determined in accordance with U.S. federal tax regulations, which may differ materially from amounts determined in accordance with GAAP. These book-to-tax differences are either temporary or permanent in nature. To the extent these differences are permanent they are reclassified to undistributed net investment income, accumulated net realized loss or paid-in-capital, as appropriate in the period that the difference arises. The following differences were reclassified for tax purposes for the years ended September 30, 2013, 2012 and 2011:
| 2013 | 2012 | 2011 | ||||||||||
| Increase (Decrease) in paid-in capital |
$ | 903,627 | $ | 276,902 | $ | (228,824 | ) | |||||
| Increase (Decrease) in accumulated net realized loss |
(824,021 | ) | 2,176,918 | — | ||||||||
| (Decrease) Increase in undistributed net investment income |
$ | (79,606 | ) | $ | (2,453,820 | ) | $ | 228,824 | ||||
As of September 30, 2013 and 2012, the cost of investments for federal income tax purposes was $1,089.8 million and $1,006.8 million, respectively, resulting in a gross unrealized appreciation of $76.8 million and $59.9 million, respectively, and gross unrealized depreciation of $88.4 million and $76.3 million, respectively.
The following reconciles net increase in net assets resulting from operations to taxable income:
| Years Ended September 30, | ||||||||||||
| 2013 | 2012 | 2011 | ||||||||||
| Net increase in net assets resulting from operations |
$ | 91,777,652 | $ | 63,353,100 | $ | 10,263,474 | ||||||
| Net realized (gain) loss on investments not taxable |
(17,687,211 | ) | 12,798,035 | (16,259,622 | ) | |||||||
| Net unrealized (appreciation) depreciation on investments, Credit Facility and 2025 Notes |
(7,092,320 | ) | (19,081,794 | ) | 58,641,223 | |||||||
| Other temporary book-to-tax differences |
(3,035,861 | ) | 2,444,817 | (3,178,194 | ) | |||||||
| Other non-deductible expenses |
2,715,980 | 307,990 | 228,824 | |||||||||
|
|
|
|
|
|
|
|||||||
| Taxable income before deductions for distributions |
$ | 66,678,240 | $ | 59,822,148 | $ | 49,695,705 | ||||||
|
|
|
|
|
|
|
|||||||
The components of accumulated surplus on tax basis and reconciliation to accumulated deficit on a book basis are as follows:
| As of September 30, | ||||||||||||
| 2013 | 2012 | 2011 | ||||||||||
| Undistributed ordinary income – tax basis |
$ | 15,325,379 | $ | 18,634,553 | $ | 17,639,482 | ||||||
| Undistributed long-term net capital gains |
— | — | — | |||||||||
|
|
|
|
|
|
|
|||||||
| Total undistributed taxable income |
15,325,379 | 18,634,553 | 17,639,482 | |||||||||
| Capital loss carry forwards(1) (2) |
(39,216,288 | ) | (56,786,282 | ) | (47,030,821 | ) | ||||||
| Dividends payable and other temporary differences |
(26,021,069 | ) | (21,086,425 | ) | (12,477,778 | ) | ||||||
| Net unrealized appreciation (depreciation) of investments, Credit Facility and 2025 Notes |
(8,727,689 | ) | (15,815,138 | ) | (36,122,397 | ) | ||||||
|
|
|
|
|
|
|
|||||||
| Total accumulated deficit – book basis |
$ | (58,639,667 | ) | $ | (75,053,292 | ) | $ | (77,991,514 | ) | |||
|
|
|
|
|
|
|
|||||||
| (1) | As of September 30, 2013, the capital loss carry forward of $39.2 million expires, if not utilized against future capital gains, as follows: $39.2 million in 2018. |
| (2) | Under the recently enacted Regulated Investment Company Modernization Act of 2010, capital losses incurred by us after September 30, 2011 will not be subject to expiration. In addition, those losses must be utilized prior to the losses incurred in pre-enactment taxable years. |
The tax characteristics of dividends declared during the fiscal years ended September 30, 2013, 2012 and 2011 were solely from ordinary income and totaled $74.4 million, or $1.12 per share, $60.1 million, or $1.13 per share and $46.3 million, or $1.10 per share, respectively.
9. CASH EQUIVALENTS
Cash equivalents represent cash in money market funds pending investment in longer-term portfolio holdings. Our portfolio may consist of temporary investments in U.S. Treasury Bills (of varying maturities), repurchase agreements, money market funds or repurchase agreement-like treasury securities. These temporary investments with original maturities of 90 days or less are deemed cash equivalents and are included in the Consolidated Schedule of Investments. At the end of each fiscal quarter, we may take proactive steps to preserve investment flexibility for the next quarter by investing in cash equivalents, which is dependent upon the composition of our total assets at quarter end. We may accomplish this in several ways, including purchasing U.S. Treasury Bills and closing out our positions on a net cash basis after quarter-end, temporarily drawing down on the Credit Facility, or utilizing repurchase agreements or other balance sheet transactions as are deemed appropriate for this purpose. These amounts are excluded from average adjusted gross assets for purposes of computing the Investment Adviser’s management fee. U.S. Treasury Bills with maturities greater than 60 days from the time of purchase are valued consistent with our valuation policy. As of September 30, 2013 and 2012, cash and cash equivalents consisted of $58.4 million and $7.6 million, respectively.
64
Table of Contents
PENNANTPARK INVESTMENT CORPORATION AND SUBSIDIARIES
NOTES TO CONSOLIDATED FINANCIAL STATEMENTS
SEPTEMBER 30, 2013
10. FINANCIAL HIGHLIGHTS
Below are the financial highlights for the years ended September 30:
| 2013 | 2012 | 2011 | 2010 | 2009 | ||||||||||||||||
| Per Share Data: |
||||||||||||||||||||
| Net asset value, beginning of year |
$ | 10.22 | $ | 10.13 | $ | 10.69 | $ | 11.85 | $ | 10.00 | ||||||||||
| Cumulative effect of adoption of fair value option(1) |
— | — | — | — | 1.99 | |||||||||||||||
|
|
|
|
|
|
|
|
|
|
|
|||||||||||
| Adjusted net asset value, beginning of year |
10.22 | 10.13 | 10.69 | 11.85 | 11.99 | |||||||||||||||
| Net investment income(2) |
1.01 | 1.08 | 1.25 | 1.09 | 1.08 | |||||||||||||||
| Net realized and unrealized gain (loss)(2) |
0.38 | 0.12 | (1.01 | ) | (0.53 | ) | 0.62 | |||||||||||||
|
|
|
|
|
|
|
|
|
|
|
|||||||||||
| Net increase (decrease) in net assets resulting from operations(2) |
1.39 | 1.20 | 0.24 | 0.56 | 1.70 | |||||||||||||||
| Distributions to stockholders(2),(3) |
(1.12 | ) | (1.13 | ) | (1.10 | ) | (1.09 | ) | (0.96 | ) | ||||||||||
| Offering costs(2) |
— | (0.15 | ) | (0.14 | ) | (0.20 | ) | (0.09 | ) | |||||||||||
| Accretive (Dilutive) effect of common stock issuance(2) |
— | 0.17 | 0.44 | (0.43 | ) | (0.79 | ) | |||||||||||||
|
|
|
|
|
|
|
|
|
|
|
|||||||||||
| Net asset value, end of year |
$ | 10.49 | $ | 10.22 | $ | 10.13 | $ | 10.69 | $ | 11.85 | ||||||||||
|
|
|
|
|
|
|
|
|
|
|
|||||||||||
| Per share market value, end of year |
$ | 11.28 | $ | 10.61 | $ | 8.92 | $ | 10.61 | $ | 8.11 | ||||||||||
| Total return(4) |
17.37 | % | 28.71 | % | (7.37 | )% | 44.79 | % | 30.39 | % | ||||||||||
| Shares outstanding at end of year |
66,499,327 | 65,514,503 | 45,689,781 | 36,158,772 | 25,368,772 | |||||||||||||||
| Ratio / Supplemental Data: |
||||||||||||||||||||
| Ratio of operating expenses to average net assets(5),(6) |
6.31 | % | 7.11 | % | 7.28 | % | 7.16 | % | 7.42 | % | ||||||||||
| Ratio of Credit Facility related expenses to average net assets(8) |
2.60 | % | 3.08 | % | 1.15 | % | 1.08 | % | 1.93 | % | ||||||||||
|
|
|
|
|
|
|
|
|
|
|
|||||||||||
| Ratio of total expenses to average net assets(7),(8) |
8.91 | % | 10.19 | % | 8.43 | % | 8.24 | % | 9.35 | % | ||||||||||
| Ratio of net investment income to average net assets |
9.60 | % | 10.32 | % | 11.35 | % | 9.45 | % | 9.49 | % | ||||||||||
| Net assets at end of year(8) |
$ | 697,506,199 | $ | 669,717,047 | $ | 462,657,196 | $ | 386,575,223 | $ | 300,580,268 | ||||||||||
| Weighted average debt outstanding(8) |
$ | 363,246,849 | $ | 340,868,033 | $ | 278,294,433 | $ | 246,216,548 | $ | 182,490,685 | ||||||||||
| Weighted average debt per share(8) |
$ | 5.47 | $ | 6.44 | $ | 6.60 | $ | 8.33 | $ | 8.65 | ||||||||||
| Asset coverage per unit(9) |
$ | 4,261 | $ | 5,636 | $ | 2,937 | $ | 2,655 | $ | 2,713 | ||||||||||
| Average market value per unit(10) |
$ | 24.79 | N/A | N/A | N/A | N/A | ||||||||||||||
| Portfolio turnover ratio |
40.91 | % | 22.81 | % | 40.89 | % | 25.97 | % | 7.47 | % | ||||||||||
| (1) | On October 1, 2008, PennantPark Investment adopted ASC 825 and made an irrevocable election to apply the fair value option to our long-term Credit Facility. Upon adoption, net asset value increased $41.8 million, or $1.99 per share, due to the fair value adjustment related to our Credit Facility. |
| (2) | Calculated based on the weighted average shares outstanding for the respective periods. |
| (3) | Based on taxable income calculated in accordance with income tax regulations and may differ from amounts determined under GAAP. |
| (4) | Based on the change in market price per share during the periods and takes into account distributions, if any, reinvested in accordance with our dividend reinvestment plan. |
| (5) | Excludes Credit Facility interest and amendment costs. |
| (6) | Before adoption of ASC 825 for the fiscal years ended September 30, 2013, 2012, 2011, 2010 and 2009, the ratios were 6.32%, 7.11%, 7.38%, 7.95% and 9.32%, respectively. |
| (7) | Before adoption of ASC 825 for the fiscal years ended September 30, 2013, 2012, 2011, 2010 and 2009, the ratios were 8.92%, 10.20%, 8.55%, 9.15% and (1.75%), respectively. |
| (8) | Includes SBA debentures outstanding. |
| (9) | The asset coverage ratio for a class of senior securities representing indebtedness is calculated as our consolidated total assets, less all liabilities and indebtedness not represented by senior securities, divided by the senior securities representing indebtedness. This asset coverage ratio is multiplied by $1,000 to determine the asset coverage per unit. These amounts exclude SBIC LP’s SBA debentures from our asset coverage per unit computation pursuant to an Exemptive relief letter provided by the SEC in June 2011. |
| (10) | The average market value per unit is derived based on the monthly average closing price of the 2025 Notes trading on NYSE under the symbol “PNTA” since issuance, which were issued in increments of $25 per unit. |
11. DEBT
Credit Facility
We have a $430 million multi-currency Credit Facility with certain lenders and SunTrust Bank, acting as administrative agent, and JPMorgan Chase Bank, N.A., acting as syndication agent for the lenders. As of September 30, 2013 and 2012, there was $145.5 million (including a temporary draw of $28.0 million) and $145.0 million (including a temporary draw of $35.5 million), respectively, in outstanding borrowings under the Credit Facility, with a weighted average interest rate at the time of 3.33% and 3.49%, exclusive of the fee on undrawn commitments of 0.50%. The Credit Facility is a four-year revolving facility, with a stated maturity date of February 21, 2016, with a one-year term-out period following its third year and pricing is set at 275 basis points over LIBOR. The Credit Facility is secured by substantially all of the assets of the Company excluding assets held by our SBIC Funds.
In accordance with the 1940 Act, with certain limited exceptions, we are only allowed to borrow amounts such that we are in compliance with our asset coverage requirement, excluding SBA debentures, pursuant to exemptive relief from the SEC received in June 2011.
65
Table of Contents
PENNANTPARK INVESTMENT CORPORATION AND SUBSIDIARIES
NOTES TO CONSOLIDATED FINANCIAL STATEMENTS
SEPTEMBER 30, 2013
SBA Debentures
SBIC LP is able to borrow funds from the SBA against regulatory capital (which approximates equity capital) that is paid-in and is subject to customary regulatory requirements including an examination by the SBA. We have funded SBIC LP with $75.0 million of equity capital and had SBA debentures outstanding of $150.0 million as of September 30, 2013. In January 2013, our wholly-owned subsidiary, SBIC II, received a license from the SBA to operate as an SBIC under the 1958 Act. We have funded SBIC II with $2.5 million of seed capital. Our SBIC Funds are subject to a variety of regulations and oversight by the SBA concerning, among other things, the size and nature of the companies in which they may invest as well as the structure of those investments. SBA debentures are non-recourse to us, have a 10-year maturity, and may be prepaid at any time without penalty. The interest rate of SBA debentures is fixed at the time of issuance, often referred to as pooling, at a market-driven spread over 10-year U.S. Treasury Notes. Under current SBA regulations SBIC LP may borrow to a maximum of $150.0 million, which is up to twice its potential regulatory capital, and as part of a group of SBICs under common control may borrow a maximum of $225 million. SBIC LP has accessed the maximum borrowing with its $75.0 million in regulatory capital.
As of September 30, 2013, $150.0 million in debt commitments were fully drawn with a weighted average interest rate of 3.70%, exclusive of the 3.43% in upfront fees which are amortized over the life of the loan (4.04% after upfront fees). Our fixed rate SBA debentures as of September 30, 2013 were as follows:
| Issuance Dates |
Maturity | Fixed All-in Coupon Rate (1) |
Principal Balance |
|||||||||
| September 22, 2010 |
September 1, 2020 | 3.50 | % | $ | 500,000 | |||||||
| March 29, 2011 |
March 1, 2021 | 4.46 | 44,500,000 | |||||||||
| September 21, 2011 |
September 1, 2021 | 3.38 | 105,000,000 | |||||||||
|
|
|
|
|
|||||||||
| Weighted average rate / Total |
3.70 | % | $ | 150,000,000 | ||||||||
|
|
|
|
|
|||||||||
| (1) | Excluding 3.43% of upfront fees. |
Under SBA regulations, our SBIC Funds are subject to regulatory requirements, including making investments in SBA-eligible businesses, investing at least 25% of regulatory capital in eligible smaller businesses, as defined under the 1958 Act, placing certain limitations on the financing terms of investments, prohibiting investing in certain industries, requiring capitalization thresholds and being subject to periodic audits and examinations of their financial statements that are prepared on a basis of accounting other than GAAP (for example, fair value, as defined under ASC 820, is not required to be used for assets or liabilities for such compliance reporting). If our SBIC Funds fail to comply with applicable SBA regulations, the SBA could, depending on the severity of the violation, limit or prohibit their use of debentures, declare outstanding debentures immediately due and payable and/or limit them from making new investments. These actions by the SBA would, in turn, negatively affect us because our SBIC Funds are wholly-owned by us.
2025 Notes
In January 2013, we issued $71.3 million in aggregate principal amount of 2025 Notes, including the exercise of the over-allotment option, for net proceeds of $68.8 million after underwriting discounts and offering costs. Interest on the 2025 Notes is paid quarterly on February 1, May 1, August 1 and November 1, at a rate of 6.25% per year. The 2025 Notes mature on February 1, 2025. We may redeem the 2025 Notes in whole or in part at any time or from time to time on or after February 1, 2016. The 2025 Notes are general, unsecured obligations and rank equal in right of payment with all of our existing and future senior unsecured indebtedness. The 2025 Notes are structurally subordinated to our SBA debentures and the assets pledged or secured under our Credit Facility. Our 2025 Notes trade on the NYSE under the symbol “PNTA.”
12. COMMITMENTS, GUARANTEES AND CONTINGENCIES
From time to time, we, the Investment Adviser or the Administrator may be a party to legal proceedings in the ordinary course of business, including proceedings relating to the enforcement of our rights under contracts with our portfolio companies. While the outcome of these legal proceedings cannot be predicted with certainty, we do not expect that these proceedings will have a material effect upon our financial condition or results of operations. Unfunded debt investments described in the Consolidated Statement of Assets and Liabilities represent unfunded delayed draws on investments.
We, in the ordinary course of business, have guaranteed certain obligations of SPH. The guaranties are only triggered if there were administrative errors in acquiring assets which SPH subsequently sold or securitized. As of September 30, 2013 our maximum guaranty is $13.0 million. Based on SPH’s and industry historical loss rates we believe the risk of loss is remote, thus, we have not recorded a liability associated with the guaranties. The current guaranties will decline over time.
66
Table of Contents
SUPPLEMENTARY DATA
Selected Quarterly Data (Unaudited)
(dollar amounts in thousands, except per share data)
| 2013 | ||||||||||||||||
| Q4 | Q3 | Q2 | Q1 | |||||||||||||
| Total investment income |
$ | 31,447 | $ | 33,725 | $ | 31,057 | $ | 32,958 | ||||||||
| Net investment income |
$ | 17,099 | $ | 17,655 | $ | 14,063 | $ | 18,181 | ||||||||
| Net realized and unrealized gain (loss) |
$ | 5,379 | $ | (3,869 | ) | $ | 12,910 | $ | 10,360 | |||||||
| Net increase in net assets resulting from operations |
$ | 22,479 | $ | 13,786 | $ | 26,972 | $ | 28,541 | ||||||||
| Net increase in net assets resulting from operations per common share |
$ | 0.33 | $ | 0.21 | $ | 0.41 | $ | 0.44 | ||||||||
| Net asset value per share at the end of the quarter |
$ | 10.49 | $ | 10.43 | $ | 10.50 | $ | 10.38 | ||||||||
| Market value per share at the end of the quarter |
$ | 11.28 | $ | 11.05 | $ | 11.30 | $ | 11.00 | ||||||||
| 2012 | ||||||||||||||||
| Q4 | Q3 | Q2 | Q1 | |||||||||||||
| Total investment income |
$ | 30,806 | $ | 29,385 | $ | 26,362 | $ | 26,839 | ||||||||
| Net investment income |
$ | 16,742 | $ | 15,571 | $ | 9,759 | $ | 14,997 | ||||||||
| Net realized and unrealized gain (loss) |
$ | 948 | $ | (12,151 | ) | $ | 16,638 | $ | 849 | |||||||
| Net increase in net assets resulting from operations |
$ | 17,690 | $ | 3,420 | $ | 26,397 | $ | 15,846 | ||||||||
| Net increase in net assets resulting from operations per common share |
$ | 0.31 | $ | 0.06 | $ | 0.50 | $ | 0.34 | ||||||||
| Net asset value per share at the end of the quarter |
$ | 10.22 | $ | 10.16 | $ | 10.38 | $ | 10.19 | ||||||||
| Market value per share at the end of the quarter |
$ | 10.61 | $ | 10.35 | $ | 10.40 | $ | 10.09 | ||||||||
| 2011 | ||||||||||||||||
| Q4 | Q3 | Q2 | Q1 | |||||||||||||
| Total investment income |
$ | 26,139 | $ | 22,908 | $ | 22,712 | $ | 19,979 | ||||||||
| Net investment income |
$ | 15,095 | $ | 13,220 | $ | 13,159 | $ | 11,171 | ||||||||
| Net realized and unrealized (loss) gain |
$ | (46,260 | ) | $ | (10,901 | ) | $ | 428 | $ | 14,351 | ||||||
| Net (decrease) increase in net assets resulting from operations |
$ | (31,165 | ) | $ | 2,319 | $ | 13,587 | $ | 25,522 | |||||||
| Net increase in net assets resulting from operations per common share |
$ | (0.68 | ) | $ | 0.05 | $ | 0.33 | $ | 0.71 | |||||||
| Net asset value per share at the end of the quarter |
$ | 10.13 | $ | 11.08 | $ | 11.30 | $ | 11.14 | ||||||||
| Market value per share at the end of the quarter |
$ | 8.92 | $ | 11.21 | $ | 11.92 | $ | 12.25 | ||||||||
67
Table of Contents
| Item 9. | Changes in and Disagreements with Accountants on Accounting and Financial Disclosure |
None.
| Item 9A. | Controls and Procedures |
(a) Evaluation of Disclosure Controls and Procedures
As of September 30, 2013, we, including our Chief Executive Officer and Chief Financial Officer, evaluated the effectiveness of the design and operation of our disclosure controls and procedures (as defined in Rule 13a-15(e) of the Exchange Act). Based on that evaluation, our management, including the Chief Executive Officer and Chief Financial Officer, concluded that our disclosure controls and procedures were effective and provided reasonable assurance that information required to be disclosed in our periodic SEC filings is recorded, processed, summarized and reported within the time periods specified in the SEC’s rules and forms, and that such information is accumulated and communicated to our management, including our Chief Executive Officer and Chief Financial Officer, as appropriate, to allow timely decisions regarding required disclosure. However, in evaluating the disclosure controls and procedures, management recognized that any controls and procedures, no matter how well designed and operated can provide only reasonable assurance of achieving the desired control objectives, and management necessarily was required to apply its judgment in evaluating the cost-benefit relationship of such possible controls and procedures.
(b) Management’s Report on Internal Control Over Financial Reporting
Management’s Report on Internal Control Over Financial Reporting, which appears on page 42 of this Form 10-K, is incorporated by reference herein.
(c) Changes in Internal Controls Over Financial Reporting
There have been no changes in our internal control over financial reporting (as defined in Rules 13a-15(f) and 15d-15(f) of the Exchange Act) during our most recently completed fiscal quarter, that have materially affected, or are reasonably likely to materially affect, our internal control over financial reporting.
| Item 9B. | Other Information |
None.
68
Table of Contents
We will file a definitive Proxy Statement for our 2014 Annual Meeting of Stockholders with the SEC, pursuant to Regulation 14A, not later than 120 days after the end of our fiscal year. Accordingly, certain information required by Part III has been omitted under General Instruction G (3) to Form 10-K. Only those sections of our definitive Proxy Statement that specifically address the items set forth herein are incorporated by reference.
| Item 10. | Directors, Executive Officers and Corporate Governance |
The information required by Item 10 is hereby incorporated by reference from our definitive Proxy Statement relating to our 2014 Annual Meeting of Stockholders, to be filed with the Securities and Exchange Commission within 120 days following the end of our fiscal year.
| Item 11. | Executive Compensation |
The information required by Item 11 is hereby incorporated by reference from our definitive Proxy Statement relating to our 2014 Annual Meeting of Stockholders, to be filed with the Securities and Exchange Commission within 120 days following the end of our fiscal year.
| Item 12. | Security Ownership of Certain Beneficial Owners and Management and Related Stockholder Matters |
The information required by Item 12 is hereby incorporated by reference from our definitive Proxy Statement relating to our 2014 Annual Meeting of Stockholders, to be filed with the Securities and Exchange Commission within 120 days following the end of our fiscal year.
| Item 13. | Certain Relationships and Related Transactions, and Director Independence |
The information required by Item 13 is hereby incorporated by reference from our definitive Proxy Statement relating to our 2014 Annual Meeting of Stockholders, to be filed with the Securities and Exchange Commission within 120 days following the end of our fiscal year.
| Item 14. | Principal Accountant Fees and Services |
The information required by Item 14 is hereby incorporated by reference from our definitive Proxy Statement relating to our 2014 Annual Meeting of Stockholders, to be filed with the Securities and Exchange Commission within 120 days following the end of our fiscal year.
69
Table of Contents
| Item 15. | Exhibits and Financial Statement Schedules |
The following documents are filed as part of this Annual Report:
| (1) | Financial Statements—Refer to Item 8 starting on page 41. |
| (2) | Financial Statement Schedules—None. |
| (3) | Exhibits |
| 3.1 |
Articles of Incorporation (Incorporated by reference to the Registrant’s Pre-Effective Amendment No.1 to the Registration Statement on Form N-2/A (File No. 333-140092), filed on March 5, 2007). | |
| 3.2* |
Amended and Restated Bylaws of the Registrant. | |
| 4.1 |
Form of Share Certificate (Incorporated by reference to Exhibit 99(d)(1) to the Registrant’s Registration Statement on Form N-2 (File No. 333-150033), filed on April 2, 2008). | |
| 4.2 |
Base Indenture, dated as of January 22, 2013, relating to the 6.25% Senior Notes due 2025, between the Registrant and American Stock Transfer & Trust Company, LLC, as trustee (Incorporated by reference to Exhibit 99(d)(8) to the Registrant’s Post-Effective Amendment No.4 to the Registration Statement on Form N-2/A (File No.333-172524), filed on January 22, 2013). | |
| 4.3 |
First Supplemental Indenture, dated as of January 22, 2013, relating to the 6.25% Senior Notes due 2025, between the Registrant and American Stock Transfer & Trust Company, LLC, as trustee (Incorporated by reference to Exhibit 99(d)(9) to the Registrant’s Post-Effective Amendment No.4 to the Registration Statement on Form N-2/A (File No.333-172524), filed on January 22, 2013). | |
| 4.4 |
Form of 6.25% Senior Notes due 2025 (included as part of Exhibit 4.3). | |
| 10.1 |
Form of Investment Management Agreement between the Registrant and PennantPark Investment Advisers, LLC (Incorporated by reference to Exhibit 99(g) to the Registrant’s Registration Statement on Form N-2 (File No. 333-150033), filed on April 2, 2008). | |
| 10.2 |
Form of Administration Agreement between the Registrant and PennantPark Investment Administration LLC (Incorporated by reference to Exhibit 99(k)(1) to the Registrant’s Registration Statement on Form N-2 (File No. 333-150033), filed on April 2, 2008). | |
| 10.3 |
Dividend Reinvestment Plan (Incorporated by reference to Exhibit 99(e) to the Registrant’s Registration Statement on Form N-2 (File No. 333-150033), filed on April 2, 2008). | |
| 10.4 |
Amended and Restated Senior Secured Revolving Credit Agreement, dated as of February 21, 2012, among PennantPark Investment Corporation, as the borrower, the Lenders party hereto, SunTrust Bank, as administrative agent and JPMorgan Chase Bank, N.A., as syndication agent (Incorporated by reference to Exhibit 10.1 to the Registrant’s Quarterly Report on Form 10-Q (File No. 814-00736), filed on May 2, 2012). | |
| 11 |
Computation of Per Share Earnings (included in the notes to the audited financial statements contained in this Report). | |
| 14.1* |
Joint Code of Ethics of the Registrant. | |
| 21.1* |
Subsidiaries of the Registrant. | |
| 31.1* |
Certification of Chief Executive Officer pursuant to Rule 13a-14 of the Securities Exchange Act of 1934, as amended. | |
| 31.2* |
Certification of Chief Financial Officer pursuant to Rule 13a-14 of the Securities Exchange Act of 1934, as amended. | |
| 32.1* |
Certification of Chief Executive Officer pursuant to section 906 of the Sarbanes-Oxley Act of 2002. | |
| 32.2* |
Certification of Chief Financial Officer pursuant to section 906 of the Sarbanes-Oxley Act of 2002. | |
| 99.1 |
Privacy Policy of the Registrant (Incorporated by reference to Exhibit 99.1 to the Registrant’s Annual Report on Form 10-K (File No. 814-00736), filed on November 16, 2011). | |
| * | Filed herewith |
70
Table of Contents
Pursuant to the requirements of Section 13 or 15(d) of the Securities Exchange Act of 1934, the registrant has duly caused this report to be signed on its behalf by the undersigned, thereunto duly authorized.
| By: |
/s/ ARTHUR H. PENN | |
| Name: |
Arthur H. Penn | |
| Title: |
Chief Executive Officer and Chairman of the Board |
Pursuant to the requirements of the Securities Exchange Act of 1934, this report has been signed below by the following persons on behalf of the registrant and in the capacities and on the dates indicated.
| Signature |
Title |
Date | ||
| /s/ ARTHUR H. PENN Arthur H. Penn |
Chairman of the Board of Directors and Chief Executive Officer (Principal Executive Officer) | November 13, 2013 | ||
| /s/ AVIV EFRAT Aviv Efrat |
Chief Financial Officer and Treasurer (Principal Financial and Accounting Officer) | November 13, 2013 | ||
| /s/ ADAM K. BERNSTEIN Adam K. Bernstein |
Director | November 13, 2013 | ||
| /s/ JEFFREY FLUG Jeffrey Flug |
Director | November 13, 2013 | ||
| /s/ MARSHALL BROZOST Marshall Brozost |
Director | November 13, 2013 | ||
| /s/ SAMUEL L. KATZ Samuel L. Katz |
Director | November 13, 2013 | ||
71