Attached files
| file | filename |
|---|---|
| 8-K - 8-K - NELNET INC | nni11713form8-k.htm |
| EX-99.1 - EARNINGS RELEASE - NELNET INC | exhibit99111713earningsrel.htm |
For Release: November 7, 2013
Media Contact: Ben Kiser, 402.458.3024
Investor Contact: Phil Morgan, 402.458.3038
Nelnet, Inc. supplemental financial information for the third quarter 2013
(All dollars are in thousands, except per share amounts, unless otherwise noted)
The following information should be read in connection with Nelnet, Inc.'s (the “Company's”) press release for third quarter 2013 earnings, dated November 7, 2013, and the Company's Quarterly Report on Form 10-Q for the quarter ended September 30, 2013.
This earnings supplement contains forward-looking statements, including statements about the Company's plans and expectations for future financial condition, results of operations, or economic performance, or that address management's plans and objectives for future operations, and statements that assume or are dependent upon future events. The words “may,” “should,” “could,” “would,” “predict,” “potential,” “continue,” “expect,” “anticipate,” “future,” “intend,” “plan,” “believe,” “estimate,” “assume,” “forecast,” “will,” and similar expressions, as well as statements in future tense, are intended to identify forward-looking statements. These statements are subject to known and unknown risks, uncertainties, and other factors that may cause actual results and performance to be materially different from any future results or performance expressed or implied by such statements. These factors include, among others, the risks and uncertainties set forth in the "Risk Factors" section of the Company's Annual Report on Form 10-K for the year ended December 31, 2012 (the "2012 Annual Report"), in particular such risks and uncertainties as:
• | student loan portfolio risks such as interest rate basis and repricing risk resulting from the fact that the interest rate characteristics of the student loan assets do not match the interest rate characteristics of the funding for those assets, the risk of loss of floor income on certain student loans originated under the FFEL Program, risks related to the use of derivatives to manage exposure to interest rate fluctuations, and risks from changes in levels of student loan prepayment or default rates; |
• | financing and liquidity risks, including risks of changes in the general interest rate environment and in the securitization and other financing markets for student loans, which may increase the costs or limit the availability of financings necessary to purchase, refinance, or continue to hold student loans; |
• | risks from changes in the educational credit and services markets resulting from changes in applicable laws, regulations, and government programs, such as the expected decline over time in FFELP loan interest income and fee-based revenues due to the discontinuation of new FFELP loan originations in 2010 and potential government initiatives to consolidate existing FFELP loans to the Federal Direct Loan Program, risks related to the availability of government funds and actual extension of the Company's loan servicing contract with the Department for an additional five years, and the Company's ability to maintain or increase volumes under that contract, and the Company's ability to comply with agreements with third-party customers for the servicing of FFELP and Federal Direct Loan Program loans; |
• | risks related to a breach of or failure in the Company's operational or information systems or infrastructure, or those of third-party vendors; |
• | uncertainties inherent in forecasting future cash flows from student loan assets and related asset-backed securitizations; and |
• | risks associated with litigation and uncertainties inherent in the estimates and assumptions about future events that management is required to make in the preparation of the Company's consolidated financial statements. |
All forward-looking statements contained in this earnings supplement are qualified by these cautionary statements and are made only as of the date of this document. Although the Company may from time to time voluntarily update its prior forward-looking statements, it disclaims any commitment to do so except as required by securities laws.
1
Consolidated Statements of Income
(unaudited)
Three months ended | Nine months ended | ||||||||||||||
September 30, 2013 | June 30, 2013 | September 30, 2012 | September 30, 2013 | September 30, 2012 | |||||||||||
Interest income: | |||||||||||||||
Loan interest | $ | 158,675 | 158,063 | 150,528 | 472,277 | 454,574 | |||||||||
Investment interest | 1,562 | 1,483 | 1,140 | 4,662 | 3,290 | ||||||||||
Total interest income | 160,237 | 159,546 | 151,668 | 476,939 | 457,864 | ||||||||||
Interest expense: | |||||||||||||||
Interest on bonds and notes payable | 55,315 | 58,127 | 66,402 | 171,800 | 203,175 | ||||||||||
Net interest income | 104,922 | 101,419 | 85,266 | 305,139 | 254,689 | ||||||||||
Less provision for loan losses | 5,000 | 5,000 | 5,000 | 15,000 | 18,000 | ||||||||||
Net interest income after provision for loan losses | 99,922 | 96,419 | 80,266 | 290,139 | 236,689 | ||||||||||
Other income (expense): | |||||||||||||||
Loan and guaranty servicing revenue | 64,582 | 60,078 | 53,285 | 180,261 | 155,164 | ||||||||||
Tuition payment processing and campus commerce revenue | 19,927 | 18,356 | 17,928 | 61,694 | 56,675 | ||||||||||
Enrollment services revenue | 22,563 | 24,823 | 30,661 | 76,343 | 92,035 | ||||||||||
Other income | 8,613 | 12,288 | 12,699 | 30,317 | 32,453 | ||||||||||
Gain on sale of loans and debt repurchases | 2,138 | 7,355 | 195 | 10,900 | 1,130 | ||||||||||
Derivative settlements, net | (6,688 | ) | (8,357 | ) | (5,051 | ) | (23,229 | ) | (6,910 | ) | |||||
Derivative market value and foreign currency adjustments, net | (9,960 | ) | 48,545 | (26,224 | ) | 47,841 | (61,163 | ) | |||||||
Total other income | 101,175 | 163,088 | 83,493 | 384,127 | 269,384 | ||||||||||
Operating expenses: | |||||||||||||||
Salaries and benefits | 48,712 | 47,432 | 46,395 | 144,049 | 144,193 | ||||||||||
Cost to provide enrollment services | 14,668 | 16,787 | 20,151 | 51,097 | 62,203 | ||||||||||
Depreciation and amortization | 4,340 | 4,320 | 8,402 | 13,037 | 24,764 | ||||||||||
Other | 39,887 | 34,365 | 29,989 | 109,193 | 93,160 | ||||||||||
Total operating expenses | 107,607 | 102,904 | 104,937 | 317,376 | 324,320 | ||||||||||
Income before income taxes | 93,490 | 156,603 | 58,822 | 356,890 | 181,753 | ||||||||||
Income tax expense | 30,444 | 54,746 | 21,870 | 123,637 | 59,978 | ||||||||||
Net income | 63,046 | 101,857 | 36,952 | 233,253 | 121,775 | ||||||||||
Net income attributable to noncontrolling interest | 216 | 614 | 124 | 1,101 | 412 | ||||||||||
Net income attributable to Nelnet, Inc. | $ | 62,830 | 101,243 | 36,828 | 232,152 | 121,363 | |||||||||
Earnings per common share: | |||||||||||||||
Net income attributable to Nelnet, Inc. shareholders - basic and diluted | $ | 1.35 | 2.17 | 0.78 | 4.98 | 2.56 | |||||||||
Weighted average common shares outstanding - basic and diluted | 46,496,612 | 46,626,853 | 47,460,308 | 46,593,241 | 47,399,207 | ||||||||||
Condensed Consolidated Balance Sheets
As of | As of | As of | |||||||
September 30, 2013 | December 31, 2012 | September 30, 2012 | |||||||
(unaudited) | (unaudited) | ||||||||
Assets: | |||||||||
Student loans receivable, net | $ | 24,701,112 | 24,830,621 | 22,559,341 | |||||
Non-federally insured student loans receivable - held for sale | 28,480 | — | — | ||||||
Cash, cash equivalents, and investments | 284,054 | 149,343 | 186,534 | ||||||
Restricted cash and investments | 768,621 | 911,978 | 1,003,888 | ||||||
Goodwill and intangible assets, net | 124,050 | 126,511 | 131,478 | ||||||
Other assets | 630,611 | 589,442 | 527,603 | ||||||
Total assets | $ | 26,536,928 | 26,607,895 | 24,408,844 | |||||
Liabilities: | |||||||||
Bonds and notes payable | $ | 24,858,455 | 25,098,835 | 22,884,096 | |||||
Other liabilities | 300,560 | 343,847 | 348,510 | ||||||
Total liabilities | 25,159,015 | 25,442,682 | 23,232,606 | ||||||
Equity: | |||||||||
Total Nelnet, Inc. shareholders' equity | 1,377,863 | 1,165,208 | 1,175,821 | ||||||
Noncontrolling interest | 50 | 5 | 417 | ||||||
Total equity | 1,377,913 | 1,165,213 | 1,176,238 | ||||||
Total liabilities and equity | $ | 26,536,928 | 26,607,895 | 24,408,844 | |||||
2
Overview
The Company is an education services company focused primarily on providing fee-based processing services and quality education-related products and services in four core areas: loan financing, loan servicing, payment processing, and enrollment services. These products and services help students and families plan, prepare, and pay for their education and make the administrative and financial processes more efficient for schools and financial organizations. In addition, the Company earns net interest income on a portfolio of federally insured student loans.
A reconciliation of the Company's GAAP net income to net income, excluding derivative market value and foreign currency adjustments, is provided below.
Three months ended | Nine months ended | ||||||||||||||
September 30, 2013 | June 30, 2013 | September 30, 2012 | September 30, 2013 | September 30, 2012 | |||||||||||
GAAP net income attributable to Nelnet, Inc. | $ | 62,830 | 101,243 | 36,828 | 232,152 | 121,363 | |||||||||
Derivative market value and foreign currency adjustments, net of tax | 6,175 | (30,098 | ) | 16,259 | (29,661 | ) | 37,921 | ||||||||
Net income, excluding derivative market value and foreign currency adjustments (a) | $ | 69,005 | 71,145 | 53,087 | 202,491 | 159,284 | |||||||||
Earnings per share: | |||||||||||||||
GAAP net income attributable to Nelnet, Inc. | $ | 1.35 | 2.17 | 0.78 | 4.98 | 2.56 | |||||||||
Derivative market value and foreign currency adjustments, net of tax | 0.13 | (0.64 | ) | 0.34 | (0.63 | ) | 0.80 | ||||||||
Net income, excluding derivative market value and foreign currency adjustments (a) | $ | 1.48 | 1.53 | 1.12 | 4.35 | 3.36 | |||||||||
(a) | The Company provides non-GAAP information that reflects specific items management believes to be important in the evaluation of its financial position and performance. "Derivative market value and foreign currency adjustments" include (i) the unrealized gains and losses that are caused by changes in fair values of derivatives which do not qualify for "hedge treatment" under GAAP; and (ii) the foreign currency transaction gains or losses caused by the re-measurement of the Company's Euro-denominated bonds to U.S. dollars. The Company believes these point-in-time estimates of asset and liability values related to these financial instruments that are subject to interest and currency rate fluctuations affect the period-to-period comparability of the results of operations. Accordingly, the Company provides operating results excluding these items for comparability purposes. |
The increase in earnings for the 2013 periods compared to the 2012 periods was due to an increase in net interest income earned from the Company's student loan portfolio and an increase in revenue and operating margin from the Company's fee-based operating segments.
The Company earns net interest income on its FFELP student loan portfolio in its Asset Generation and Management ("AGM") operating segment. This segment is expected to generate a stable net interest margin and significant amounts of cash as the FFELP portfolio amortizes. As of September 30, 2013, the Company had a $24.7 billion student loan portfolio that will amortize over the next approximately 20 years. The Company actively seeks to acquire additional FFELP loan portfolios to leverage its servicing scale and expertise to generate incremental earnings and cash flow.
In addition, the Company earns fee-based revenue through the following reportable operating segments:
• | Student Loan and Guaranty Servicing ("LGS") - referred to as Nelnet Diversified Solutions ("NDS") |
• | Tuition Payment Processing and Campus Commerce ("TPP&CC") - referred to as Nelnet Business Solutions ("NBS") |
• | Enrollment Services - commonly called Nelnet Enrollment Solutions ("NES") |
3
The information below provides the operating results for each reportable operating segment for the three and nine months ended September 30, 2013 and 2012 (dollars in millions).
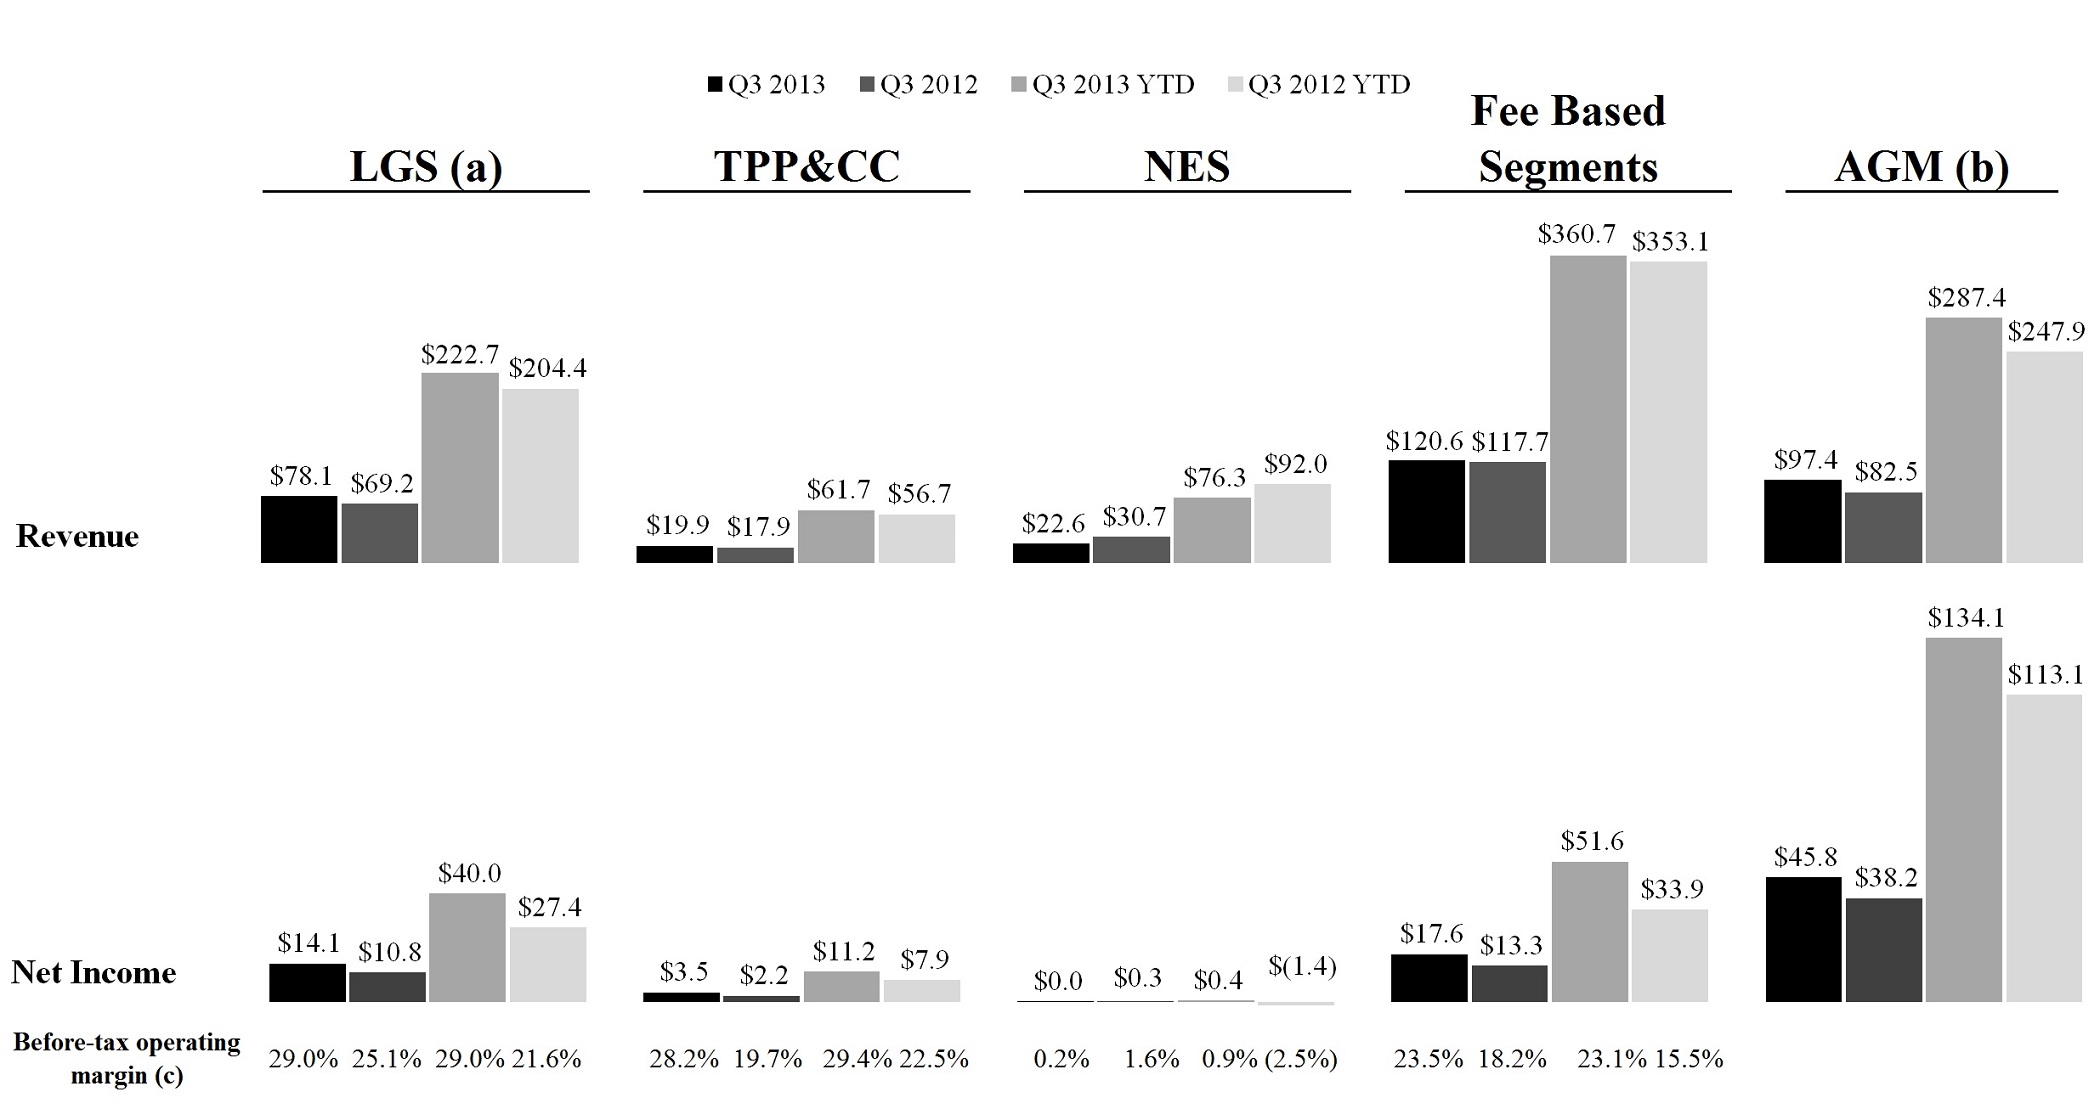
(a) | Revenue includes intersegment revenue of $13.5 million and $15.9 million for the three months ended September 30, 2013 and 2012, respectively, and $42.4 million and $49.2 million for the nine months ended September 30, 2013 and 2012, respectively, earned by LGS as a result of servicing loans for AGM. |
(b) | Total revenue includes "net interest income after provision for loan losses" and "total other income" from the Company's segment statements of income, excluding the impact from changes in fair values of derivatives and foreign currency transaction adjustments, which was an expense of $12.7 million and $30.7 million for the three months ended September 30, 2013 and 2012, respectively, and income of $35.7 million and an expense of $62.4 million for the nine months ended September 30, 2013 and 2012, respectively. Net income excludes changes in fair values of derivatives and foreign currency transaction adjustments, net of tax, which was an expense of $7.8 million and $19.0 million for the three months ended September 30, 2013 and 2012, respectively, and income of $22.1 million and an expense of $38.7 million for the nine months ended September 30, 2013 and 2012, respectively. |
(c) | Computed as income before income taxes divided by total revenue. |
Student Loan and Guaranty Servicing
• | As of September 30, 2013, the Company was servicing $135.0 billion in FFELP, private, and government owned student loans, as compared with $92.5 billion of loans as of September 30, 2012. |
• | Revenue increased in the three and nine months ended September 30, 2013 compared to the same periods in 2012 due to growth in servicing volume under the Company's contract with the Department and an increase in collection revenue from getting defaulted FFELP loan assets current on behalf of guaranty agencies. These increases were partially offset by decreases in traditional FFELP and guaranty servicing revenue. |
• | As of September 30, 2013, the Company was servicing $106.9 billion of loans for 5.1 million borrowers on behalf of the Department, compared with $63.6 billion of loans for 3.6 million borrowers as of September 30, 2012. Revenue from this contract increased to $26.0 million and $68.4 million for the three and nine months ended September 30, 2013, respectively, up from $19.1 million and $50.1 million for the same respective periods in 2012. The servicing contract with the Department spans five years (through June 2014), with a five-year extension at the option of the Department. On October 25, 2013, the Company received a letter from the Department notifying the Company of the Department's intent to exercise its optional ordering period to extend the contract for an additional five years through June 16, 2019, with actual extension subject to the availability of government funds. |
• | Before tax operating margin increased in the three and nine months ended September 30, 2013 compared to the same periods in 2012. The Company made investments and incurred certain costs in 2012 to improve performance metrics under the government servicing contract and to implement and comply with the Department's special direct consolidation |
4
loan initiative. In addition, intangible assets for this segment were fully amortized in 2012. Salaries and benefits and other expense increased in 2013 to support the increase in volume under the government servicing contract and due to an increase in costs related to getting defaulted FFELP loan assets current on behalf of guaranty agencies.
Tuition Payment Processing and Campus Commerce
• | Revenue increased in the three and nine months ended September 30, 2013 compared to the same periods in 2012 due to an increase in the number of managed tuition payment plans, campus commerce customers, and new school customers. |
• | Before tax operating margin increased in the three and nine months ended September 30, 2013 compared to the same periods in 2012. The increase was the result of efficiencies gained in the operations of the business and a decrease in amortization expense related to intangible assets. These decreases in expenses in 2013 compared to 2012 were partially offset by an increase in salaries and benefits due to adding personnel to support the increase in the number of tuition payment plans and campus commerce customers. |
• | This segment is subject to seasonal fluctuations. Based on the timing of when revenue is recognized and when expenses are incurred, revenue and operating margin are higher in the first quarter as compared to the remainder of the year. |
Enrollment Services
• | Revenue decreased in the three and nine months ended September 30, 2013 compared to the same periods in 2012 due to a decrease in inquiry generation and management revenue as a result of the regulatory uncertainty regarding recruiting and marketing to potential students in the for-profit college industry, which has caused schools to decrease spending on marketing efforts. Additionally, clients are shifting marketing budgets to more efficient or lower cost channels, which has caused a reduction in volume. |
• | The Company continues to focus on improving the profitability of this segment by reducing operating expenses in reaction to the ongoing decline in revenue and gross margin. |
Asset Generation and Management
• | The Company acquired $2.2 billion of FFELP student loans during the first nine months of 2013, including $1.1 billion purchased during the third quarter. The average loan portfolio balance for the three months ended September 30, 2013 and 2012 was $24.5 billion and $23.0 billion, respectively. |
• | On October 31, 2013, the Company purchased a student loan securitization trust, giving the Company rights to the residual interest in $1.6 billion of FFELP student loans. The trust includes student loans funded to term with notes payable. The student loans and debt within the trust will be included in the Company's consolidated financial statements. |
• | Core student loan spread increased to 1.57% for the three months ended September 30, 2013, compared to 1.44% for the three months ended September 30, 2012, and increased to 1.53% for the nine months ended September 30, 2013, compared to 1.43% for the same period in 2012. This increase was due to the improved corresponding relationship between the interest rate indices governing what the Company earns on its loans and what the Company pays to fund such loans. |
• | Due to historically low interest rates, the Company continues to earn significant fixed rate floor income. During the three months ended September 30, 2013 and 2012, the Company earned $37.8 million and $34.7 million, respectively, of fixed rate floor income (net of $7.2 million and $5.6 million of derivative settlements, respectively, used to hedge such loans), and $109.6 million and $109.8 million for the nine months ended September 30, 2013 and 2012, respectively (net of $24.0 million and $12.2 million of derivative settlements, respectively). |
Corporate Activities
• | Whitetail Rock Capital Management, LLC ("WRCM"), the Company's SEC-registered investment advisory subsidiary, recognized investment advisory revenue of $2.4 million and $2.6 million for the three months ended September 30, 2013 and 2012, respectively, and $11.5 million and $8.8 million for the nine months ended September 30, 2013 and 2012, respectively. These amounts include performance fees earned from the sale of managed securities. As of September 30, 2013, WRCM was managing an investment portfolio of $942.8 million for third-party entities. |
5
Income Taxes
• | The effective tax rate for the three months ended September 30, 2013 and 2012 was 32.6% and 37.2%, respectively, and was 34.8% and 33.0% for the nine months ended September 30, 2013 and 2012, respectively. During the third quarter of 2013, income tax expense was reduced by $4.1 million due to the resolution of various uncertain tax positions relating primarily to prior years resulting from examination closings and lapse of applicable statute of limitations. In addition, the Company reversed $1.3 million ($0.8 million after tax) of interest expense during the third quarter of 2013 related to the resolution of certain tax positions. The reversal of interest expense reduced "interest on bonds and notes payable" in the accompanying consolidated statement of income. During the second quarter of 2012, state income tax laws were enacted that reduced the Company's income tax expense during the second quarter by $4.6 million. |
Liquidity and Capital Resources
• | As of September 30, 2013, the Company had cash and investments of $284.1 million. |
• | For the nine months ended September 30, 2013, the Company generated $202.6 million in net cash provided by operating activities. |
• | Forecasted future cash flows from the Company's FFELP student loan portfolio financed in asset-backed securitization transactions are estimated to be approximately $2.10 billion as of September 30, 2013. |
• | As of September 30, 2013, $75.0 million was outstanding on the Company's unsecured line of credit and $200.0 million was available for future use. The unsecured line of credit has a maturity date of March 28, 2018. |
• | During the nine months ended September 30, 2013, the Company repurchased $84.7 million (face amount) of its own asset-backed debt securities for a gain totaling $10.9 million, including $15.4 million (face amount) for a gain of $2.1 million during the third quarter. |
• | During the nine months ended September 30, 2013, the Company repurchased 390,376 shares of Class A common stock for $13.0 million ($33.34 per share), including 111,220 shares for $4.0 million ($36.19 per share) during the third quarter. Included in the shares purchased during the third quarter were 107,614 shares remaining in the Company's 401(k) plan. Pursuant to an amendment to the 401(k) plan effective January 1, 2013, shares of the Company's Class A common stock are no longer an eligible investment alternative for the Company's matching contributions under the plan, and after this purchase, no shares of the Company's Class A common stock are held in the Company's 401(k) plan. |
• | During the nine months ended September 30, 2013, the Company paid cash dividends of $13.9 million, including $4.6 million ($0.10 per share) during the third quarter. |
• | The Company intends to use its strong liquidity position to capitalize on market opportunities, including FFELP student loan acquisitions; strategic acquisitions and investments in its core business areas of loan financing, loan servicing, payment processing, and enrollment services; and capital management initiatives, including stock repurchases, debt repurchases, and dividend distributions. |
Operating Segments
The Company earns fee-based revenue through its Student Loan and Guaranty Servicing, Tuition Payment Processing and Campus Commerce, and Enrollment Services operating segments. In addition, the Company earns net interest income on its student loan portfolio in its Asset Generation and Management operating segment. The Company’s operating segments are defined by the products and services they offer and the types of customers they serve, and they reflect the manner in which financial information is currently evaluated by management. See note 1 of the notes to the consolidated financial statements included in the 2012 Annual Report for a description of each operating segment, including the primary products and services offered.
The management reporting process measures the performance of the Company’s operating segments based on the management structure of the Company, as well as the methodology used by management to evaluate performance and allocate resources. Executive management (the "chief operating decision maker") evaluates the performance of the Company’s operating segments based on their financial results prepared in conformity with U.S. generally accepted accounting principles.
The accounting policies of the Company’s operating segments are the same as those described in note 2 of the notes to the consolidated financial statements included in the 2012 Annual Report. Intersegment revenues are charged by the segment that
6
provides a product or service to another segment. Intersegment revenues and expenses are included within each segment consistent with the income statement presentation provided to management. Changes in management structure or allocation methodologies and procedures may result in changes in reported segment financial information. Income taxes are allocated based on 38% of income (loss) before taxes for each individual operating segment. The difference between the consolidated income tax expense and the sum of taxes calculated for each operating segment is included in income taxes in Corporate Activity and Overhead.
Corporate Activity and Overhead
Corporate Activity and Overhead includes the following items:
• | The operating results of Whitetail Rock Capital Management, LLC ("WRCM"), the Company's SEC-registered investment advisory subsidiary |
• | Income earned on certain investment activities |
• | Interest expense incurred on unsecured debt transactions |
• | Other product and service offerings that are not considered operating segments |
Corporate Activity and Overhead also includes certain corporate activities and overhead functions related to executive management, human resources, accounting, legal, occupancy, and marketing. These costs are allocated to each operating segment based on estimated use of such activities and services.
7
Segment Results of Operations
The following tables include the results of each of the Company's operating segments reconciled to the consolidated financial statements.
Three months ended September 30, 2013 | ||||||||||||||||||||||||
Fee-Based | ||||||||||||||||||||||||
Student Loan and Guaranty Servicing | Tuition Payment Processing and Campus Commerce | Enrollment Services | Total Fee- Based | Asset Generation and Management | Corporate Activity and Overhead | Eliminations | Total | |||||||||||||||||
Total interest income | $ | 10 | — | — | 10 | 158,793 | 2,201 | (767 | ) | 160,237 | ||||||||||||||
Interest expense | — | — | — | — | 56,100 | (18 | ) | (767 | ) | 55,315 | ||||||||||||||
Net interest income (loss) | 10 | — | — | 10 | 102,693 | 2,219 | — | 104,922 | ||||||||||||||||
Less provision for loan losses | — | — | — | — | 5,000 | — | — | 5,000 | ||||||||||||||||
Net interest income (loss) after provision for loan losses | 10 | — | — | 10 | 97,693 | 2,219 | — | 99,922 | ||||||||||||||||
Other income (expense): | ||||||||||||||||||||||||
Loan and guaranty servicing revenue | 64,582 | — | — | 64,582 | — | — | — | 64,582 | ||||||||||||||||
Intersegment servicing revenue | 13,519 | — | — | 13,519 | — | — | (13,519 | ) | — | |||||||||||||||
Tuition payment processing and campus commerce revenue | — | 19,927 | — | 19,927 | — | — | — | 19,927 | ||||||||||||||||
Enrollment services revenue | — | — | 22,563 | 22,563 | — | — | — | 22,563 | ||||||||||||||||
Other income | — | — | — | — | 3,981 | 4,632 | — | 8,613 | ||||||||||||||||
Gain on sale of loans and debt repurchases | — | — | — | — | 2,138 | — | — | 2,138 | ||||||||||||||||
Derivative market value and foreign currency adjustments, net | — | — | — | — | (12,660 | ) | 2,700 | — | (9,960 | ) | ||||||||||||||
Derivative settlements, net | — | — | — | — | (6,432 | ) | (256 | ) | — | (6,688 | ) | |||||||||||||
Total other income (expense) | 78,101 | 19,927 | 22,563 | 120,591 | (12,973 | ) | 7,076 | (13,519 | ) | 101,175 | ||||||||||||||
Operating expenses: | ||||||||||||||||||||||||
Salaries and benefits | 29,719 | 9,229 | 4,491 | 43,439 | 555 | 4,718 | — | 48,712 | ||||||||||||||||
Cost to provide enrollment services | — | — | 14,668 | 14,668 | — | — | — | 14,668 | ||||||||||||||||
Depreciation and amortization | 2,677 | 1,117 | 57 | 3,851 | — | 489 | — | 4,340 | ||||||||||||||||
Other | 19,752 | 1,908 | 1,556 | 23,216 | 7,939 | 8,732 | — | 39,887 | ||||||||||||||||
Intersegment expenses, net | 1,457 | 1,431 | 1,139 | 4,027 | 13,705 | (4,213 | ) | (13,519 | ) | — | ||||||||||||||
Total operating expenses | 53,605 | 13,685 | 21,911 | 89,201 | 22,199 | 9,726 | (13,519 | ) | 107,607 | |||||||||||||||
Income (loss) before income taxes and corporate overhead allocation | 24,506 | 6,242 | 652 | 31,400 | 62,521 | (431 | ) | — | 93,490 | |||||||||||||||
Corporate overhead allocation | (1,822 | ) | (607 | ) | (607 | ) | (3,036 | ) | (1,302 | ) | 4,338 | — | — | |||||||||||
Income (loss) before income taxes | 22,684 | 5,635 | 45 | 28,364 | 61,219 | 3,907 | — | 93,490 | ||||||||||||||||
Income tax (expense) benefit | (8,620 | ) | (2,141 | ) | (17 | ) | (10,778 | ) | (23,263 | ) | 3,597 | — | (30,444 | ) | ||||||||||
Net income (loss) | 14,064 | 3,494 | 28 | 17,586 | 37,956 | 7,504 | — | 63,046 | ||||||||||||||||
Net income attributable to noncontrolling interest | — | — | — | — | — | 216 | — | 216 | ||||||||||||||||
Net income attributable to Nelnet, Inc. | $ | 14,064 | 3,494 | 28 | 17,586 | 37,956 | 7,288 | — | 62,830 | |||||||||||||||
8
Three months ended June 30, 2013 | ||||||||||||||||||||||||
Fee-Based | ||||||||||||||||||||||||
Student Loan and Guaranty Servicing | Tuition Payment Processing and Campus Commerce | Enrollment Services | Total Fee- Based | Asset Generation and Management | Corporate Activity and Overhead | Eliminations | Total | |||||||||||||||||
Total interest income | $ | 9 | — | — | 9 | 158,175 | 2,196 | (834 | ) | 159,546 | ||||||||||||||
Interest expense | — | — | — | — | 56,920 | 2,041 | (834 | ) | 58,127 | |||||||||||||||
Net interest income (loss) | 9 | — | — | 9 | 101,255 | 155 | — | 101,419 | ||||||||||||||||
Less provision for loan losses | — | — | — | — | 5,000 | — | — | 5,000 | ||||||||||||||||
Net interest income (loss) after provision for loan losses | 9 | — | — | 9 | 96,255 | 155 | — | 96,419 | ||||||||||||||||
Other income (expense): | ||||||||||||||||||||||||
Loan and guaranty servicing revenue | 60,078 | — | — | 60,078 | — | — | — | 60,078 | ||||||||||||||||
Intersegment servicing revenue | 13,903 | — | — | 13,903 | — | — | (13,903 | ) | — | |||||||||||||||
Tuition payment processing and campus commerce revenue | — | 18,356 | — | 18,356 | — | — | — | 18,356 | ||||||||||||||||
Enrollment services revenue | — | — | 24,823 | 24,823 | — | — | — | 24,823 | ||||||||||||||||
Other income | — | — | — | — | 3,030 | 9,258 | — | 12,288 | ||||||||||||||||
Gain on sale of loans and debt repurchases | — | — | — | — | 7,355 | — | — | 7,355 | ||||||||||||||||
Derivative market value and foreign currency adjustments | — | — | — | — | 43,096 | 5,449 | — | 48,545 | ||||||||||||||||
Derivative settlements, net | — | — | — | — | (7,845 | ) | (512 | ) | — | (8,357 | ) | |||||||||||||
Total other income (expense) | 73,981 | 18,356 | 24,823 | 117,160 | 45,636 | 14,195 | (13,903 | ) | 163,088 | |||||||||||||||
Operating expenses: | ||||||||||||||||||||||||
Salaries and benefits | 28,091 | 9,427 | 4,809 | 42,327 | 592 | 4,513 | — | 47,432 | ||||||||||||||||
Cost to provide enrollment services | — | — | 16,787 | 16,787 | — | — | — | 16,787 | ||||||||||||||||
Depreciation and amortization | 2,731 | 1,132 | 61 | 3,924 | — | 396 | — | 4,320 | ||||||||||||||||
Other | 18,031 | 2,192 | 1,243 | 21,466 | 7,923 | 4,976 | — | 34,365 | ||||||||||||||||
Intersegment expenses, net | 851 | 1,494 | 1,130 | 3,475 | 14,108 | (3,680 | ) | (13,903 | ) | — | ||||||||||||||
Total operating expenses | 49,704 | 14,245 | 24,030 | 87,979 | 22,623 | 6,205 | (13,903 | ) | 102,904 | |||||||||||||||
Income (loss) before income taxes and corporate overhead allocation | 24,286 | 4,111 | 793 | 29,190 | 119,268 | 8,145 | — | 156,603 | ||||||||||||||||
Corporate overhead allocation | (1,513 | ) | (504 | ) | (504 | ) | (2,521 | ) | (1,081 | ) | 3,602 | — | — | |||||||||||
Income (loss) before income taxes | 22,773 | 3,607 | 289 | 26,669 | 118,187 | 11,747 | — | 156,603 | ||||||||||||||||
Income tax (expense) benefit | (8,655 | ) | (1,370 | ) | (109 | ) | (10,134 | ) | (44,911 | ) | 299 | — | (54,746 | ) | ||||||||||
Net income (loss) | 14,118 | 2,237 | 180 | 16,535 | 73,276 | 12,046 | — | 101,857 | ||||||||||||||||
Net income attributable to noncontrolling interest | — | — | — | — | — | 614 | — | 614 | ||||||||||||||||
Net income (loss) attributable to Nelnet, Inc. | $ | 14,118 | 2,237 | 180 | 16,535 | 73,276 | 11,432 | — | 101,243 | |||||||||||||||
9
Three months ended September 30, 2012 | ||||||||||||||||||||||||
Fee-Based | ||||||||||||||||||||||||
Student Loan and Guaranty Servicing | Tuition Payment Processing and Campus Commerce | Enrollment Services | Total Fee- Based | Asset Generation and Management | Corporate Activity and Overhead | Eliminations | Total | |||||||||||||||||
Total interest income | $ | 12 | 3 | — | 15 | 150,661 | 1,891 | (899 | ) | 151,668 | ||||||||||||||
Interest expense | — | — | — | — | 64,829 | 2,472 | (899 | ) | 66,402 | |||||||||||||||
Net interest income (loss) | 12 | 3 | — | 15 | 85,832 | (581 | ) | — | 85,266 | |||||||||||||||
Less provision for loan losses | — | — | — | — | 5,000 | — | — | 5,000 | ||||||||||||||||
Net interest income (loss) after provision for loan losses | 12 | 3 | — | 15 | 80,832 | (581 | ) | — | 80,266 | |||||||||||||||
Other income (expense): | ||||||||||||||||||||||||
Loan and guaranty servicing revenue | 53,285 | — | — | 53,285 | — | — | — | 53,285 | ||||||||||||||||
Intersegment servicing revenue | 15,855 | — | — | 15,855 | — | — | (15,855 | ) | — | |||||||||||||||
Tuition payment processing and campus commerce revenue | — | 17,928 | — | 17,928 | — | — | — | 17,928 | ||||||||||||||||
Enrollment services revenue | — | — | 30,661 | 30,661 | — | — | — | 30,661 | ||||||||||||||||
Other income | — | — | — | — | 5,834 | 6,865 | — | 12,699 | ||||||||||||||||
Gain on sale of loans and debt repurchases | — | — | — | — | 195 | — | — | 195 | ||||||||||||||||
Derivative market value and foreign currency adjustments, net | — | — | — | — | (30,694 | ) | 4,470 | — | (26,224 | ) | ||||||||||||||
Derivative settlements, net | — | — | — | — | (4,319 | ) | (732 | ) | — | (5,051 | ) | |||||||||||||
Total other income (expense) | 69,140 | 17,928 | 30,661 | 117,729 | (28,984 | ) | 10,603 | (15,855 | ) | 83,493 | ||||||||||||||
Operating expenses: | ||||||||||||||||||||||||
Salaries and benefits | 27,716 | 8,578 | 5,147 | 41,441 | 462 | 4,492 | — | 46,395 | ||||||||||||||||
Cost to provide enrollment services | — | — | 20,151 | 20,151 | — | — | — | 20,151 | ||||||||||||||||
Depreciation and amortization | 4,691 | 1,703 | 1,633 | 8,027 | — | 375 | — | 8,402 | ||||||||||||||||
Other | 16,775 | 2,285 | 1,782 | 20,842 | 3,451 | 5,696 | — | 29,989 | ||||||||||||||||
Intersegment expenses, net | 1,262 | 1,379 | 1,000 | 3,641 | 16,064 | (3,850 | ) | (15,855 | ) | — | ||||||||||||||
Total operating expenses | 50,444 | 13,945 | 29,713 | 94,102 | 19,977 | 6,713 | (15,855 | ) | 104,937 | |||||||||||||||
Income (loss) before income taxes and corporate overhead allocation | 18,708 | 3,986 | 948 | 23,642 | 31,871 | 3,309 | — | 58,822 | ||||||||||||||||
Corporate overhead allocation | (1,337 | ) | (446 | ) | (446 | ) | (2,229 | ) | (909 | ) | 3,138 | — | — | |||||||||||
Income (loss) before income taxes | 17,371 | 3,540 | 502 | 21,413 | 30,962 | 6,447 | — | 58,822 | ||||||||||||||||
Income tax (expense) benefit | (6,601 | ) | (1,345 | ) | (191 | ) | (8,137 | ) | (11,765 | ) | (1,968 | ) | — | (21,870 | ) | |||||||||
Net income (loss) | 10,770 | 2,195 | 311 | 13,276 | 19,197 | 4,479 | — | 36,952 | ||||||||||||||||
Net income attributable to noncontrolling interest | — | — | — | — | — | 124 | — | 124 | ||||||||||||||||
Net income (loss) attributable to Nelnet, Inc. | $ | 10,770 | 2,195 | 311 | 13,276 | 19,197 | 4,355 | — | 36,828 | |||||||||||||||
10
Nine months ended September 30, 2013 | ||||||||||||||||||||||||
Fee-Based | ||||||||||||||||||||||||
Student Loan and Guaranty Servicing | Tuition Payment Processing and Campus Commerce | Enrollment Services | Total Fee- Based | Asset Generation and Management | Corporate Activity and Overhead | Eliminations | Total | |||||||||||||||||
Total interest income | $ | 29 | — | — | 29 | 472,622 | 6,708 | (2,420 | ) | 476,939 | ||||||||||||||
Interest expense | — | — | — | — | 170,502 | 3,718 | (2,420 | ) | 171,800 | |||||||||||||||
Net interest income (loss) | 29 | — | — | 29 | 302,120 | 2,990 | — | 305,139 | ||||||||||||||||
Less provision for loan losses | — | — | — | — | 15,000 | — | — | 15,000 | ||||||||||||||||
Net interest income (loss) after provision for loan losses | 29 | — | — | 29 | 287,120 | 2,990 | — | 290,139 | ||||||||||||||||
Other income (expense): | ||||||||||||||||||||||||
Loan and guaranty servicing revenue | 180,261 | — | — | 180,261 | — | — | — | 180,261 | ||||||||||||||||
Intersegment servicing revenue | 42,375 | — | — | 42,375 | — | — | (42,375 | ) | — | |||||||||||||||
Tuition payment processing and campus commerce revenue | — | 61,694 | — | 61,694 | — | — | — | 61,694 | ||||||||||||||||
Enrollment services revenue | — | — | 76,343 | 76,343 | — | — | — | 76,343 | ||||||||||||||||
Other income | — | — | — | — | 11,207 | 19,110 | — | 30,317 | ||||||||||||||||
Gain on sale of loans and debt repurchases | — | — | — | — | 10,900 | — | — | 10,900 | ||||||||||||||||
Derivative market value and foreign currency adjustments, net | — | — | — | — | 35,711 | 12,130 | — | 47,841 | ||||||||||||||||
Derivative settlements, net | — | — | — | — | (21,816 | ) | (1,413 | ) | — | (23,229 | ) | |||||||||||||
Total other income (expense) | 222,636 | 61,694 | 76,343 | 360,673 | 36,002 | 29,827 | (42,375 | ) | 384,127 | |||||||||||||||
Operating expenses: | ||||||||||||||||||||||||
Salaries and benefits | 86,254 | 28,015 | 15,067 | 129,336 | 1,709 | 13,004 | — | 144,049 | ||||||||||||||||
Cost to provide enrollment services | — | — | 51,097 | 51,097 | — | — | — | 51,097 | ||||||||||||||||
Depreciation and amortization | 8,197 | 3,387 | 179 | 11,763 | — | 1,274 | — | 13,037 | ||||||||||||||||
Other | 56,173 | 6,387 | 4,450 | 67,010 | 23,375 | 18,808 | — | 109,193 | ||||||||||||||||
Intersegment expenses, net | 3,243 | 4,350 | 3,418 | 11,011 | 42,955 | (11,591 | ) | (42,375 | ) | — | ||||||||||||||
Total operating expenses | 153,867 | 42,139 | 74,211 | 270,217 | 68,039 | 21,495 | (42,375 | ) | 317,376 | |||||||||||||||
Income (loss) before income taxes and corporate overhead allocation | 68,798 | 19,555 | 2,132 | 90,485 | 255,083 | 11,322 | — | 356,890 | ||||||||||||||||
Corporate overhead allocation | (4,332 | ) | (1,443 | ) | (1,443 | ) | (7,218 | ) | (3,095 | ) | 10,313 | — | — | |||||||||||
Income (loss) before income taxes | 64,466 | 18,112 | 689 | 83,267 | 251,988 | 21,635 | — | 356,890 | ||||||||||||||||
Income tax (expense) benefit | (24,498 | ) | (6,882 | ) | (261 | ) | (31,641 | ) | (95,755 | ) | 3,759 | — | (123,637 | ) | ||||||||||
Net income (loss) | 39,968 | 11,230 | 428 | 51,626 | 156,233 | 25,394 | — | 233,253 | ||||||||||||||||
Net income attributable to noncontrolling interest | — | — | — | — | — | 1,101 | — | 1,101 | ||||||||||||||||
Net income (loss) attributable to Nelnet, Inc. | $ | 39,968 | 11,230 | 428 | 51,626 | 156,233 | 24,293 | — | 232,152 | |||||||||||||||
11
Nine months ended September 30, 2012 | ||||||||||||||||||||||||
Fee-Based | ||||||||||||||||||||||||
Student Loan and Guaranty Servicing | Tuition Payment Processing and Campus Commerce | Enrollment Services | Total Fee- Based | Asset Generation and Management | Corporate Activity and Overhead | Eliminations | Total | |||||||||||||||||
Total interest income | $ | 44 | 8 | — | 52 | 455,413 | 5,226 | (2,827 | ) | 457,864 | ||||||||||||||
Interest expense | — | — | — | — | 199,675 | 6,327 | (2,827 | ) | 203,175 | |||||||||||||||
Net interest income (loss) | 44 | 8 | — | 52 | 255,738 | (1,101 | ) | — | 254,689 | |||||||||||||||
Less provision for loan losses | — | — | — | — | 18,000 | — | — | 18,000 | ||||||||||||||||
Net interest income (loss) after provision for loan losses | 44 | 8 | — | 52 | 237,738 | (1,101 | ) | — | 236,689 | |||||||||||||||
Other income (expense): | ||||||||||||||||||||||||
Loan and guaranty servicing revenue | 155,164 | — | — | 155,164 | — | — | — | 155,164 | ||||||||||||||||
Intersegment servicing revenue | 49,210 | — | — | 49,210 | — | — | (49,210 | ) | — | |||||||||||||||
Tuition payment processing and campus commerce revenue | — | 56,675 | — | 56,675 | — | — | — | 56,675 | ||||||||||||||||
Enrollment services revenue | — | — | 92,035 | 92,035 | — | — | — | 92,035 | ||||||||||||||||
Other income | — | — | — | — | 14,415 | 18,038 | — | 32,453 | ||||||||||||||||
Gain on sale of loans and debt repurchases | — | — | — | — | 1,130 | — | — | 1,130 | ||||||||||||||||
Derivative market value and foreign currency adjustments, net | — | — | — | — | (62,351 | ) | 1,188 | — | (61,163 | ) | ||||||||||||||
Derivative settlements, net | — | — | — | — | (5,431 | ) | (1,479 | ) | — | (6,910 | ) | |||||||||||||
Total other income (expense) | 204,374 | 56,675 | 92,035 | 353,084 | (52,237 | ) | 17,747 | (49,210 | ) | 269,384 | ||||||||||||||
Operating expenses: | ||||||||||||||||||||||||
Salaries and benefits | 85,663 | 25,771 | 17,587 | 129,021 | 1,723 | 13,449 | — | 144,193 | ||||||||||||||||
Cost to provide enrollment services | — | — | 62,203 | 62,203 | — | — | — | 62,203 | ||||||||||||||||
Depreciation and amortization | 13,629 | 5,174 | 4,867 | 23,670 | — | 1,094 | — | 24,764 | ||||||||||||||||
Other | 52,980 | 7,557 | 5,483 | 66,020 | 10,203 | 16,937 | — | 93,160 | ||||||||||||||||
Intersegment expenses, net | 3,832 | 4,042 | 2,824 | 10,698 | 49,842 | (11,330 | ) | (49,210 | ) | — | ||||||||||||||
Total operating expenses | 156,104 | 42,544 | 92,964 | 291,612 | 61,768 | 20,150 | (49,210 | ) | 324,320 | |||||||||||||||
Income (loss) before income taxes and corporate overhead allocation | 48,314 | 14,139 | (929 | ) | 61,524 | 123,733 | (3,504 | ) | — | 181,753 | ||||||||||||||
Corporate overhead allocation | (4,115 | ) | (1,372 | ) | (1,372 | ) | (6,859 | ) | (3,701 | ) | 10,560 | — | — | |||||||||||
Income (loss) before income taxes | 44,199 | 12,767 | (2,301 | ) | 54,665 | 120,032 | 7,056 | — | 181,753 | |||||||||||||||
Income tax (expense) benefit | (16,796 | ) | (4,851 | ) | 874 | (20,773 | ) | (45,610 | ) | 6,405 | — | (59,978 | ) | |||||||||||
Net income (loss) | 27,403 | 7,916 | (1,427 | ) | 33,892 | 74,422 | 13,461 | — | 121,775 | |||||||||||||||
Net income attributable to noncontrolling interest | — | — | — | — | — | 412 | — | 412 | ||||||||||||||||
Net income (loss) attributable to Nelnet, Inc. | $ | 27,403 | 7,916 | (1,427 | ) | 33,892 | 74,422 | 13,049 | — | 121,363 | ||||||||||||||
12
Net Interest Income, Net of Settlements on Derivatives
The Company maintains an overall risk management strategy that incorporates the use of derivative instruments to reduce the economic effect of interest rate volatility. Derivative settlements for each applicable period should be evaluated with the Company's net interest income.
The following table summarizes the components of “net interest income” and “derivative settlements, net” included in the attached consolidated statements of income.
Three months ended | Nine months ended | ||||||||||||||
September 30, 2013 | June 30, 2013 | September 30, 2012 | September 30, 2013 | September 30, 2012 | |||||||||||
Variable student loan interest margin, net of settlements on derivatives | $ | 59,100 | 58,076 | 47,543 | 172,797 | 142,484 | |||||||||
Fixed rate floor income, net of settlements on derivatives | 37,810 | 36,056 | 34,736 | 109,582 | 109,812 | ||||||||||
Investment interest | 1,562 | 1,483 | 1,140 | 4,662 | 3,290 | ||||||||||
Non-portfolio related derivative settlements | (256 | ) | (512 | ) | (732 | ) | (1,413 | ) | (1,480 | ) | |||||
Corporate debt interest expense (a) | 18 | (2,041 | ) | (2,472 | ) | (3,718 | ) | (6,327 | ) | ||||||
Net interest income (net of settlements on derivatives) | $ | 98,234 | 93,062 | 80,215 | 281,910 | 247,779 | |||||||||
(a) | During the third quarter of 2013, the Company reversed $1.3 million of interest expense related to the resolution of certain tax positions. |
13
Student Loan Servicing Volumes (dollars in millions)
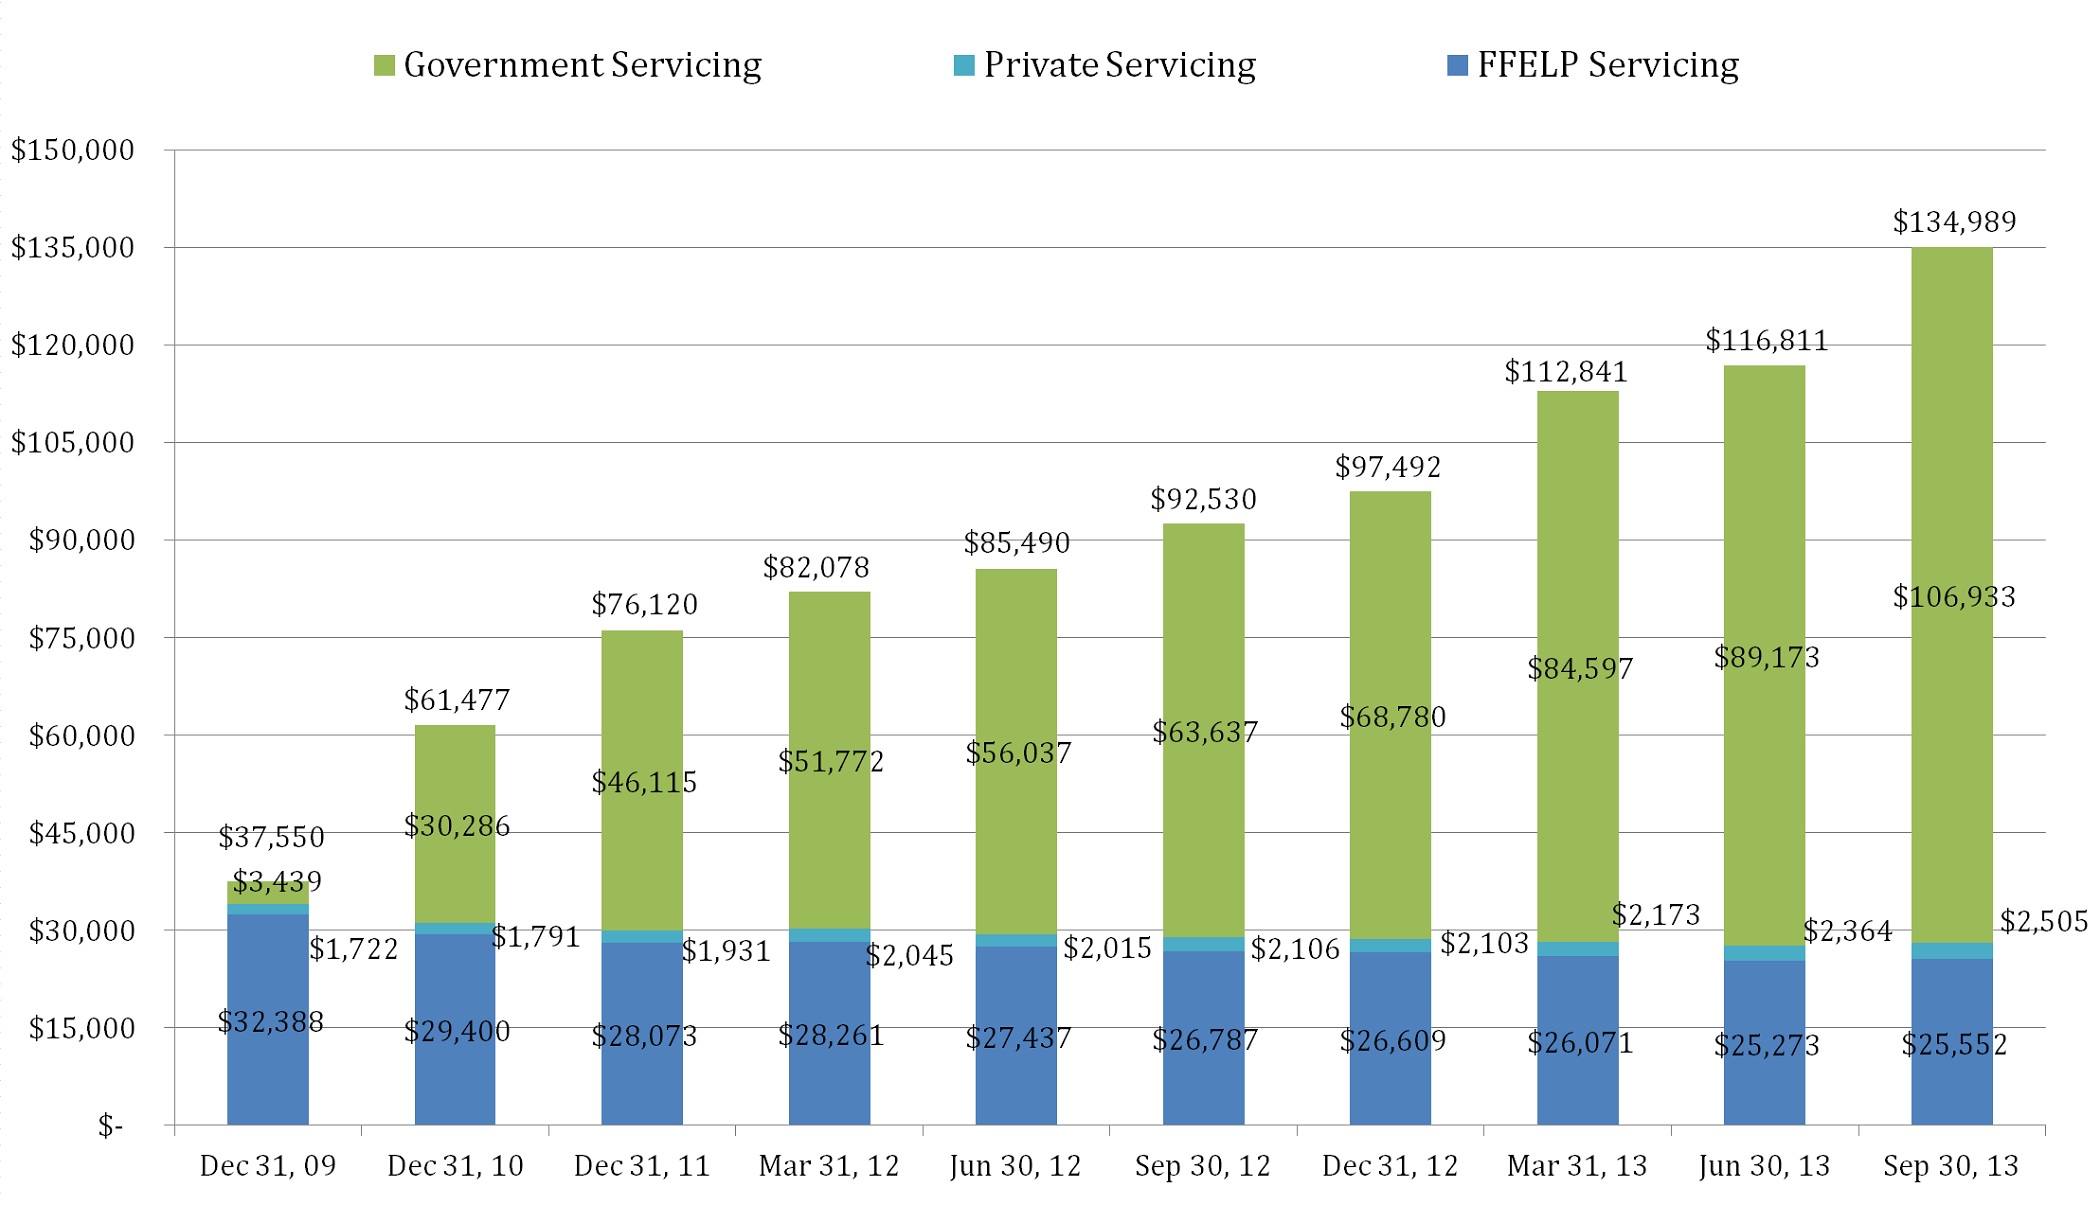
Company owned | $23,139 | $23,727 | $22,650 | $22,277 | $21,926 | $21,504 | $21,237 | $20,820 | $20,629 | $20,715 | ||||||||||||||||||||
% of total | 61.6% | 38.6% | 29.8% | 27.1% | 25.6% | 23.2% | 21.8% | 18.5% | 17.7% | 15.3% | ||||||||||||||||||||
Number of servicing borrowers: | ||||||||||||||||||||||||||||||
Government servicing: | 441,913 | 2,804,502 | 3,036,534 | 3,096,026 | 3,137,583 | 3,588,412 | 3,892,929 | 4,261,637 | 4,396,341 | 5,145,901 | ||||||||||||||||||||
FFELP servicing: | 2,311,558 | 1,912,748 | 1,799,484 | 1,779,245 | 1,724,087 | 1,659,020 | 1,626,146 | 1,586,312 | 1,529,203 | 1,507,452 | ||||||||||||||||||||
Private servicing: | 152,200 | 155,947 | 164,554 | 163,135 | 161,763 | 175,070 | 173,948 | 170,224 | 173,588 | 178,935 | ||||||||||||||||||||
Total: | 2,905,671 | 4,873,197 | 5,000,572 | 5,038,406 | 5,023,433 | 5,422,502 | 5,693,023 | 6,018,173 | 6,099,132 | 6,832,288 | ||||||||||||||||||||
Number of remote hosted borrowers: | 684,996 | 545,456 | 9,566,296 | 8,645,463 | 7,909,300 | 7,505,693 | 6,912,204 | 5,001,695 | 3,218,896 | 1,986,866 | ||||||||||||||||||||
14
Other Income
The following table summarizes the components of "other income" included in the attached consolidated statements of income.
Three months ended | Nine months ended | ||||||||||||||
September 30, 2013 | June 30, 2013 | September 30, 2012 | September 30, 2013 | September 30, 2012 | |||||||||||
Borrower late fee income | $ | 2,927 | 3,233 | 3,586 | 9,665 | 10,665 | |||||||||
Investment advisory fees | 2,352 | 6,334 | 2,639 | 11,516 | 8,793 | ||||||||||
Realized and unrealized gains/(losses) on investments, net | 1,096 | (214 | ) | 3,993 | 2,002 | 5,830 | |||||||||
Other | 2,238 | 2,935 | 2,481 | 7,134 | 7,165 | ||||||||||
Other income | $ | 8,613 | 12,288 | 12,699 | 30,317 | 32,453 | |||||||||
Derivative Settlements
The following table summarizes the components of "derivative settlements, net" included in the attached consolidated statements of income.
Three months ended | Nine months ended | ||||||||||||||
September 30, 2013 | June 30, 2013 | September 30, 2012 | September 30, 2013 | September 30, 2012 | |||||||||||
Settlements: | |||||||||||||||
1:3 basis swaps | $ | 781 | 782 | 1,100 | 2,474 | 3,651 | |||||||||
Interest rate swaps - floor income hedges | (7,178 | ) | (8,534 | ) | (5,595 | ) | (24,017 | ) | (12,237 | ) | |||||
Interest rate swaps - hybrid debt hedges | (256 | ) | (512 | ) | (733 | ) | (1,413 | ) | (1,479 | ) | |||||
Cross-currency interest rate swaps | (35 | ) | (93 | ) | 227 | (273 | ) | 3,390 | |||||||
Other | — | — | (50 | ) | — | (235 | ) | ||||||||
Total settlements - income (expense) | $ | (6,688 | ) | (8,357 | ) | (5,051 | ) | (23,229 | ) | (6,910 | ) | ||||
Derivative Market Value and Foreign Currency Adjustments
"Derivative market value and foreign currency adjustments" include (i) the unrealized gains and losses that are caused by changes in fair values of derivatives which do not qualify for "hedge treatment" under GAAP; and (ii) the foreign currency transaction gains or losses caused by the re-measurement of the Company's Euro-denominated bonds to U.S. dollars.
The following table summarizes the components of “derivative market value and foreign currency adjustments” included in the attached consolidated statements of income.
Three months ended | Nine months ended | ||||||||||||||
September 30, 2013 | June 30, 2013 | September 30, 2012 | September 30, 2013 | September 30, 2012 | |||||||||||
Change in fair value of derivatives - income (expense) | $ | 30,014 | 63,236 | (5,425 | ) | 73,743 | (67,349 | ) | |||||||
Foreign currency transaction adjustment - income (expense) | (39,974 | ) | (14,691 | ) | (20,799 | ) | (25,902 | ) | 6,186 | ||||||
Derivative market value and foreign currency adjustments - income (expense) | $ | (9,960 | ) | 48,545 | (26,224 | ) | 47,841 | (61,163 | ) | ||||||
15
Student Loans Receivable
The table below outlines the components of the Company’s student loan portfolio:
As of | As of | As of | ||||||||||
September 30, 2013 | December 31, 2012 | September 30, 2012 | ||||||||||
Held for investment | Held for sale | Held for investment | Held for investment | |||||||||
Federally insured loans | ||||||||||||
Stafford and other | $ | 6,884,348 | — | 7,261,114 | 6,652,639 | |||||||
Consolidation | 17,908,229 | — | 17,708,732 | 15,962,969 | ||||||||
Total | 24,792,577 | — | 24,969,846 | 22,615,608 | ||||||||
Non-federally insured loans | 66,283 | 28,480 | 26,034 | 29,272 | ||||||||
24,858,860 | 28,480 | 24,995,880 | 22,644,880 | |||||||||
Loan discount, net of unamortized loan premiums and deferred origination costs | (103,551 | ) | — | (113,357 | ) | (37,330 | ) | |||||
Allowance for loan losses – federally insured loans | (42,406 | ) | — | (40,120 | ) | (35,614 | ) | |||||
Allowance for loan losses – non-federally insured loans | (11,791 | ) | — | (11,782 | ) | (12,595 | ) | |||||
$ | 24,701,112 | 28,480 | 24,830,621 | 22,559,341 | ||||||||
Loan Activity
The following table sets forth the activity of loans:
Three months ended September 30, | Nine months ended September 30, | |||||||||||
2013 | 2012 | 2013 | 2012 | |||||||||
Beginning balance | $ | 24,718,368 | 23,582,595 | 24,995,880 | 24,359,625 | |||||||
Loan acquisitions | 1,053,972 | 152,016 | 2,200,756 | 898,606 | ||||||||
Repayments, claims, capitalized interest, participations, and other | (750,422 | ) | (466,355 | ) | (1,896,771 | ) | (1,345,883 | ) | ||||
Consolidation loans lost to external parties | (134,578 | ) | (590,148 | ) | (400,874 | ) | (1,172,316 | ) | ||||
Loans sold | — | (33,228 | ) | (11,651 | ) | (95,152 | ) | |||||
Ending balance | $ | 24,887,340 | 22,644,880 | 24,887,340 | 22,644,880 | |||||||
16
Student Loan Spread
The following table analyzes the student loan spread on the Company’s portfolio of student loans, which represents the spread between the yield earned on student loan assets and the costs of the liabilities and derivative instruments used to fund those assets.
Three months ended | Nine months ended | ||||||||||||||
September 30, 2013 | June 30, 2013 | September 30, 2012 | September 30, 2013 | September 30, 2012 | |||||||||||
Variable student loan yield, gross | 2.58 | % | 2.58 | % | 2.65 | % | 2.57 | % | 2.63 | % | |||||
Consolidation rebate fees | (0.76 | ) | (0.77 | ) | (0.75 | ) | (0.77 | ) | (0.75 | ) | |||||
Discount accretion, net of premium and deferred origination costs amortization | 0.02 | 0.03 | — | 0.03 | (0.01 | ) | |||||||||
Variable student loan yield, net | 1.84 | 1.84 | 1.90 | 1.83 | 1.87 | ||||||||||
Student loan cost of funds - interest expense | (0.89 | ) | (0.91 | ) | (1.08 | ) | (0.90 | ) | (1.10 | ) | |||||
Student loan cost of funds - derivative settlements | 0.01 | 0.01 | 0.02 | 0.01 | 0.04 | ||||||||||
Variable student loan spread | 0.96 | 0.94 | 0.84 | 0.94 | 0.81 | ||||||||||
Fixed rate floor income, net of settlements on derivatives | 0.61 | 0.58 | 0.60 | 0.59 | 0.62 | ||||||||||
Core student loan spread | 1.57 | % | 1.52 | % | 1.44 | % | 1.53 | % | 1.43 | % | |||||
Average balance of student loans | $ | 24,491,516 | 24,798,537 | 23,028,904 | 24,690,493 | 23,670,300 | |||||||||
Average balance of debt outstanding | 24,470,096 | 24,832,555 | 23,467,899 | 24,707,389 | 23,883,140 | ||||||||||
A trend analysis of the Company's core and variable student loan spreads is summarized below.
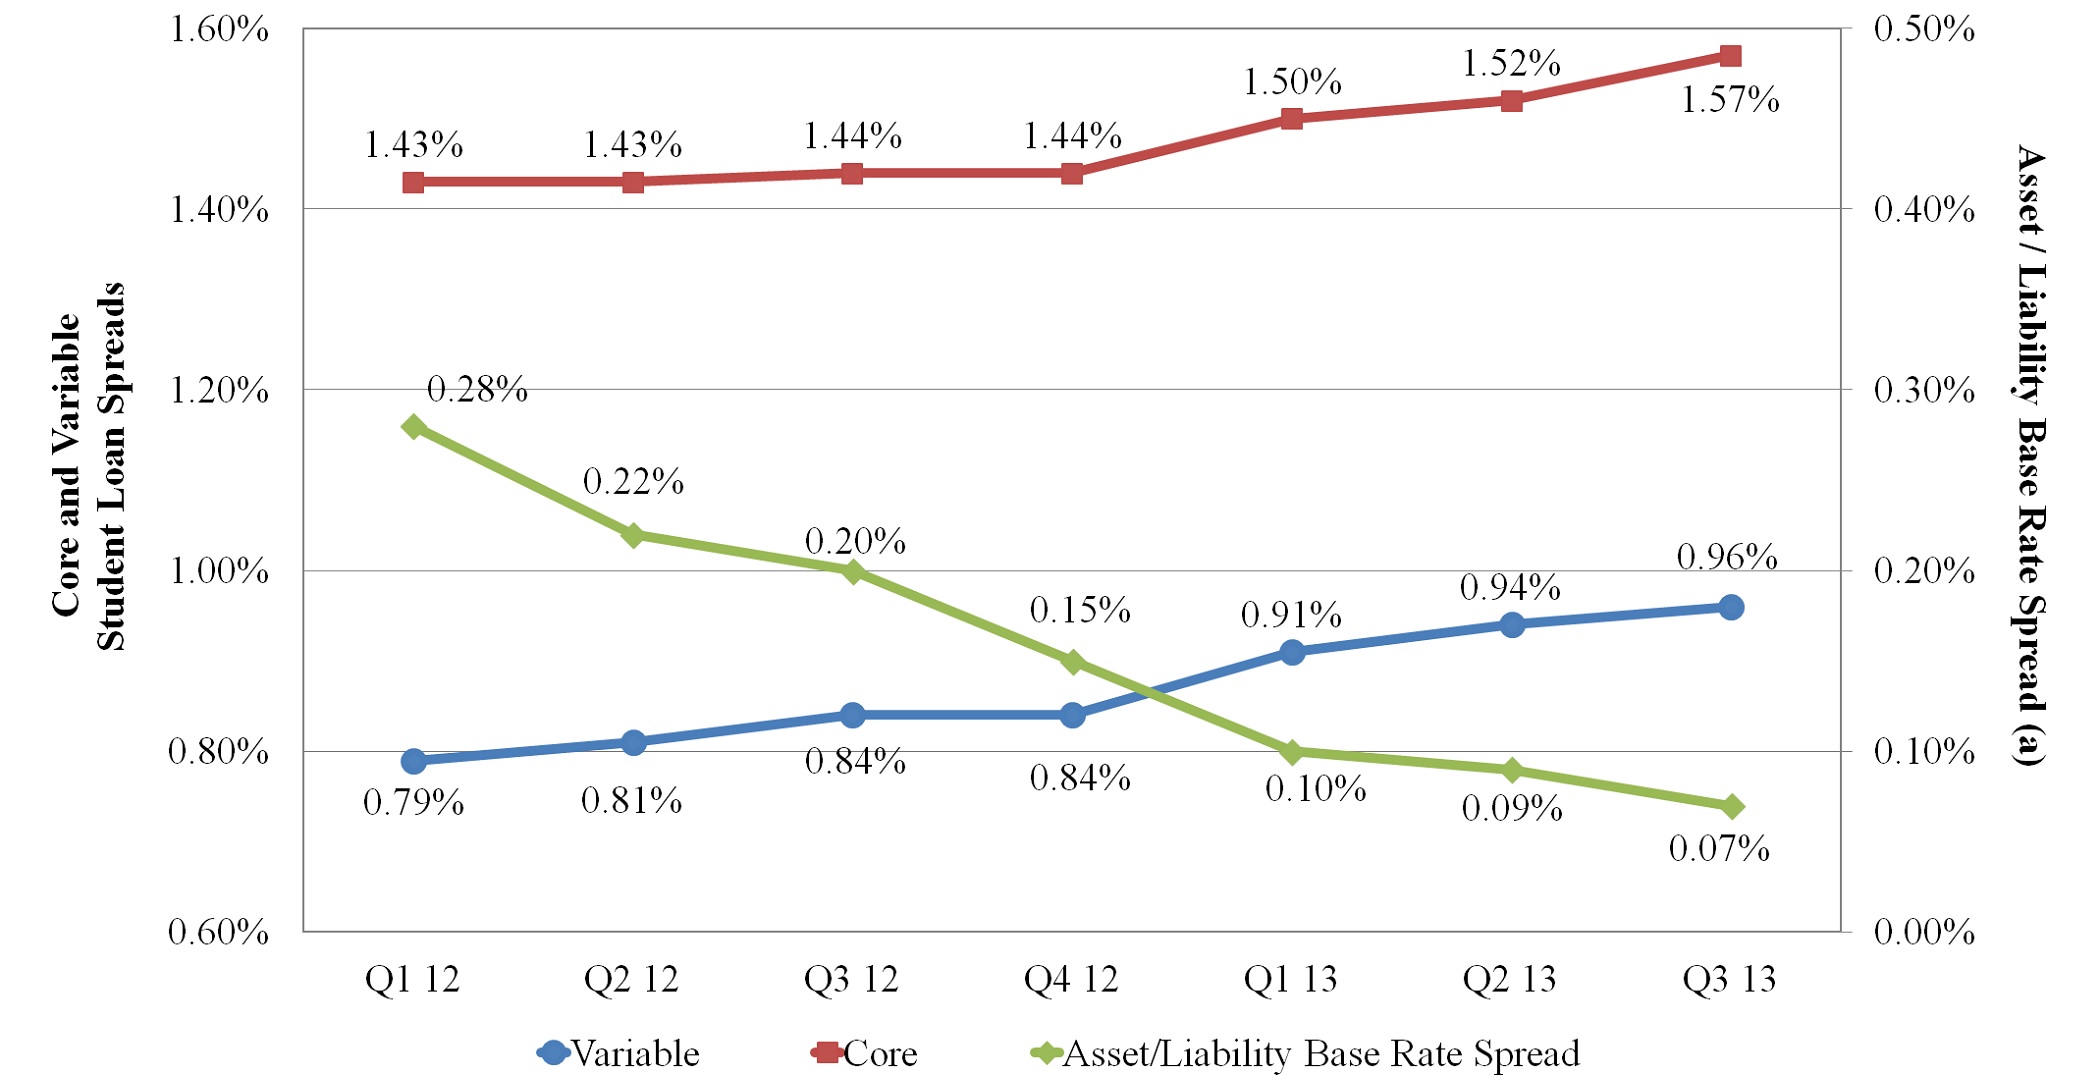
(a) | The interest earned on the majority of the Company's FFELP student loan assets is indexed to the one-month LIBOR rate. The Company funds the majority of its assets with three-month LIBOR indexed floating rate securities. The relationship between the indices in which the Company earns interest on its loans and funds such loans has a significant impact on student loan spread. This table (the right axis) shows the difference between the Company's liability base rate and the one-month LIBOR rate by quarter. |
17
Variable student loan spread increased during the three and nine months ended September 30, 2013 compared to the same periods in 2012 as a result of the tightening of the Asset/Liability Base Rate Spread as reflected in the previous table.
The primary difference between variable student loan spread and core student loan spread is fixed rate floor income. A summary of fixed rate floor income and its contribution to core student loan spread follows:
Three months ended | Nine months ended | ||||||||||||||
September 30, 2013 | June 30, 2013 | September 30, 2012 | September 30, 2013 | September 30, 2012 | |||||||||||
Fixed rate floor income, gross | $ | 44,988 | 44,590 | 40,331 | 133,599 | 122,049 | |||||||||
Derivative settlements (a) | (7,178 | ) | (8,534 | ) | (5,595 | ) | (24,017 | ) | (12,237 | ) | |||||
Fixed rate floor income, net | $ | 37,810 | 36,056 | 34,736 | 109,582 | 109,812 | |||||||||
Fixed rate floor income contribution to spread, net | 0.61 | % | 0.58 | % | 0.60 | % | 0.59 | % | 0.62 | % | |||||
(a) | Includes settlement payments on derivatives used to hedge student loans earning fixed rate floor income. |
Fixed Rate Floor Income
The following table shows the Company’s student loan assets that are earning fixed rate floor income as of September 30, 2013:
Borrower/ | Estimated | |||||||
Fixed | lender | variable | ||||||
interest | weighted | conversion | Loan | |||||
rate range | average yield | rate (a) | Balance | |||||
< 3.0% | 2.87% | 0.23% | $ | 1,772,119 | ||||
3.0 - 3.49% | 3.20% | 0.56% | 2,135,186 | |||||
3.5 - 3.99% | 3.65% | 1.01% | 1,944,371 | |||||
4.0 - 4.49% | 4.20% | 1.56% | 1,464,833 | |||||
4.5 - 4.99% | 4.72% | 2.08% | 842,142 | |||||
5.0 - 5.49% | 5.24% | 2.60% | 570,042 | |||||
5.5 - 5.99% | 5.67% | 3.03% | 346,790 | |||||
6.0 - 6.49% | 6.18% | 3.54% | 401,362 | |||||
6.5 - 6.99% | 6.70% | 4.06% | 365,898 | |||||
7.0 - 7.49% | 7.16% | 4.52% | 150,648 | |||||
7.5 - 7.99% | 7.71% | 5.07% | 256,097 | |||||
8.0 - 8.99% | 8.17% | 5.53% | 603,732 | |||||
> 9.0% | 9.04% | 6.40% | 301,635 | |||||
$ | 11,154,855 | |||||||
(a) | The estimated variable conversion rate is the estimated short-term interest rate at which loans would convert to a variable rate. As of September 30, 2013, the weighted average estimated variable conversion rate was 1.82% and the short-term interest rate was 19 basis points. |
18
The following table summarizes the outstanding derivative instruments as of September 30, 2013 used by the Company to economically hedge loans earning fixed rate floor income.
Maturity | Notional amount | Weighted average fixed rate paid by the Company (a) | |||||
2014 | $ | 1,750,000 | 0.71 | % | |||
2015 | 1,100,000 | 0.89 | |||||
2016 | 750,000 | 0.85 | |||||
2017 | 1,250,000 | 0.86 | |||||
$ | 4,850,000 | 0.81 | % | ||||
(a) | For all interest rate derivatives, the Company receives discrete three-month LIBOR. |
Future Cash Flow from Portfolio
The majority of the Company’s portfolio of student loans is funded in asset-backed securitizations that are structured to substantially match the maturity of the funded assets, thereby minimizing liquidity risk. In addition, due to (i) the difference between the yield the Company receives on the loans and cost of financing within these transactions, and (ii) the servicing and administration fees the Company earns from these transactions, the Company has created a portfolio that will generate earnings and significant cash flow over the life of these transactions.
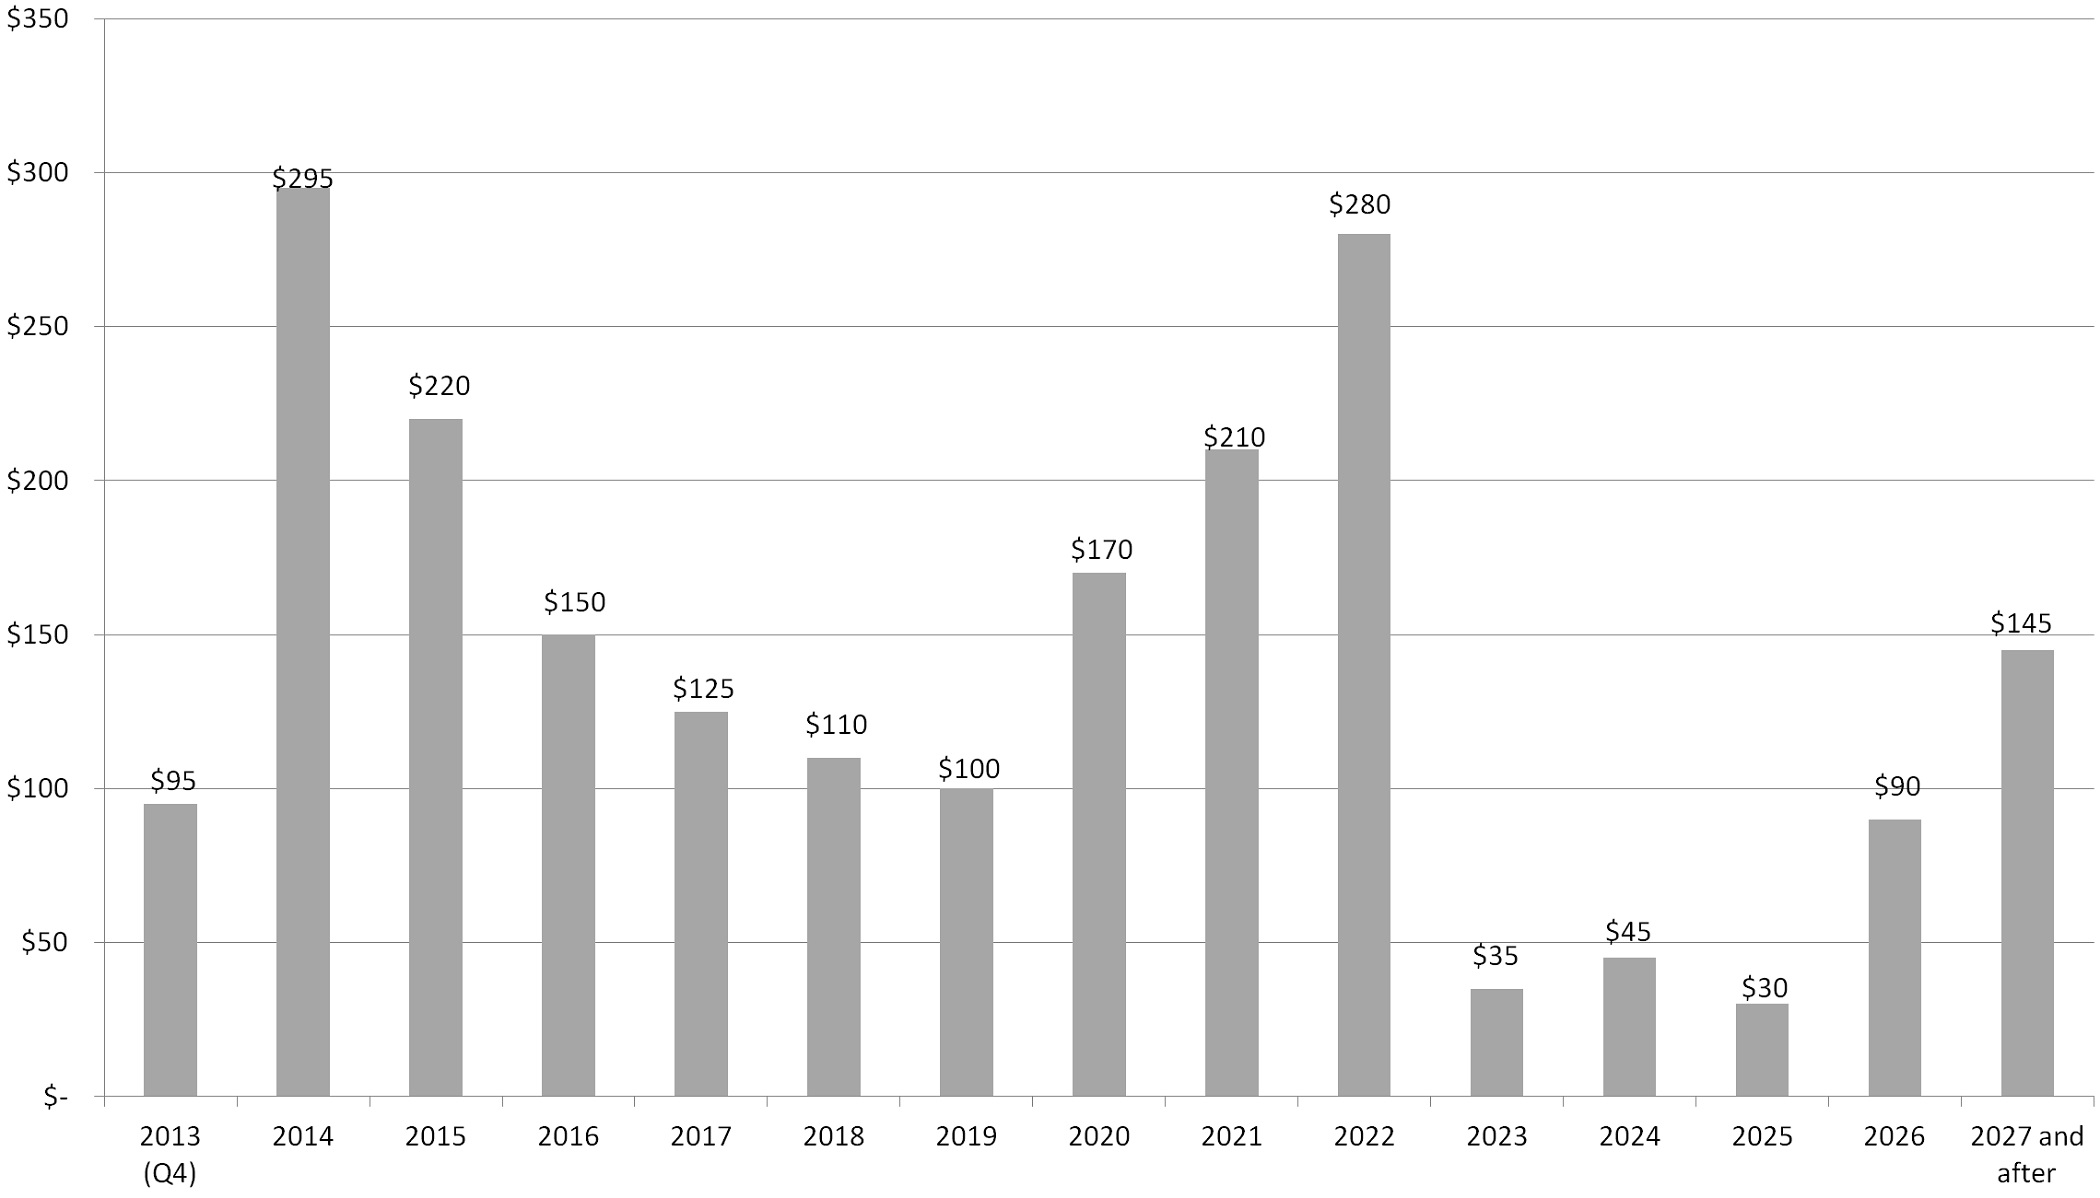
As of September 30, 2013, based on cash flow models developed to reflect management’s current estimate of, among other factors, prepayments, defaults, deferment, forbearance, and interest rates, the Company currently expects future undiscounted cash flows from its portfolio to be approximately $2.10 billion as detailed below. The $2.10 billion includes approximately $495.2 million (as of September 30, 2013) of overcollateralization included in the asset-backed securitizations. These excess net asset positions are reflected variously in the following balances in the consolidated balance sheet: "student loans receivable," "restricted cash and investments," and "accrued interest receivable."
The forecasted cash flow presented below includes all loans funded in asset-backed securitizations as of September 30, 2013. As of September 30, 2013, the Company had $23.5 billion of loans included in asset-backed securitizations, which represented 94.7 percent of its total FFELP student loan portfolio. The forecasted cash flow does not include cash flows that the Company expects to receive related to loans currently funded in its warehouse facilities or loans acquired subsequent to September 30, 2013.
19
FFELP Asset-backed Securitization Cash Flow Forecast
$2.10 billion
(dollars in millions)
The Company uses various assumptions, including prepayments and future interest rates, when preparing its cash flow forecast. These assumptions are further discussed below.
Prepayments: The primary variable in establishing a life of loan estimate is the level and timing of prepayments. Prepayment rates equal the amount of loans that prepay annually as a percentage of the beginning of period balance, net of scheduled principal payments. A number of factors can affect estimated prepayment rates, including the level of consolidation activity and default rates. Should any of these factors change, management may revise its assumptions, which in turn would impact the projected future cash flow. The Company’s cash flow forecast above assumes prepayment rates that are generally consistent with those utilized in the Company’s recent asset-backed securitization transactions. If management used a prepayment rate assumption two times greater than what was used to forecast the cash flow, the cash flow forecast would be reduced by approximately $210 million to $270 million.
Interest rates: The Company funds the majority of its student loans with three-month LIBOR indexed floating rate securities. Meanwhile, the interest earned on the Company’s student loan assets is indexed primarily to a one-month LIBOR rate. The different interest rate characteristics of the Company’s loan assets and liabilities funding these assets result in basis risk. The Company’s cash flow forecast assumes three-month LIBOR will exceed one-month LIBOR by 12 basis points for the life of the portfolio, which approximates the historical relationship between these indices. If the forecast is computed assuming a spread of 24 basis points between three-month and one-month LIBOR for the life of the portfolio, the cash flow forecast would be reduced by approximately $110 million to $150 million.
The Company uses the current forward interest rate yield curve to forecast cash flows. A change in the forward interest rate curve would impact the future cash flows generated from the portfolio. An increase in future interest rates will reduce the amount of fixed rate floor income the Company is currently receiving. The Company attempts to mitigate the impact of a rise in short-term rates by hedging interest rate risks. As of September 30, 2013, the net fair value of the Company’s interest rate derivatives used to hedge loans earning fixed rate floor income was a net liability of $12.2 million.
20