Attached files
| file | filename |
|---|---|
| 8-K - FORM 8-K - Genpact LTD | d623280d8k.htm |
| EX-99.1 - EX-99.1 - Genpact LTD | d623280dex991.htm |
 Genpact
Q3 2013 Earnings Presentation
November 6, 2013
Ticker (NYSE: G)
Exhibit 99.2 |
 Forward
Looking Statements These
materials
contain
certain
statements
concerning
our
future
growth
prospects
and
forward-looking
statements, as defined in the safe harbor provisions of the U.S.
Private Securities Litigation Reform Act of
1995. These statements are based on Genpact’s current expectations and
beliefs, as well as a number of assumptions
concerning
future
events.
These
statements
involve
a
number
of
risks,
uncertainties
and
other
factors that could cause actual results to differ materially from those in such
forward-looking statements. These risks and uncertainties include but
are not limited to a slowdown in the economies and sectors in which
our
clients
operate,
a
slowdown
in
the
BPM
and
IT
Services
sectors,
the
risks
and
uncertainties
arising from our past and future acquisitions, our ability to manage growth,
factors which may impact our cost advantage, wage increases, our ability to
attract and retain skilled professionals, risks and uncertainties regarding
fluctuations in our earnings, general economic conditions affecting our industry as
well as other risks detailed in our reports filed with the U.S. Securities and
Exchange Commission (the “SEC”),
including
the
Company's
Annual
Report
on
Form
10-K.
These
filings
are
available
at
www.sec.gov
or on the investor relations section of our website, www.genpact.com. Genpact may
from time to time make additional written and oral forward-looking
statements, including statements contained in our filings with the SEC. The
Company does not undertake to update any forward-looking statements that may be made from
time to time by or on behalf of the Company.
These materials also include measures defined by the SEC as non-GAAP financial
measures. Genpact believes that these non-GAAP measures can provide
useful supplemental information to investors regarding financial and
business trends relating to its financial condition and results of operations when
read in conjunction with the company’s reported results. Reconciliations of
these non-GAAP measures to GAAP are available in this presentation and
in our earnings release dated November 6, 2013. Non-GAAP Financial
Measures |
 3
Q3 2013 -
Highlights
Revenues, adjusted income from operations, margins and cash flows from
operations all increased year-over-year
Q3
‘13
versus
Q3
‘12
performance:
Total Revenue:
+9%
Revenue from Global Clients:
+13%
GE Revenue:
-3%
Adjusted
Income
from
Operations
:
+19%
Cash from Operations
+62%
Revenue growth impacted by delayed large deal decisions, mortgage business
and FX
Strong
Adjusted
Income
from
Operations
margin
(1)
of
17.8%
Increasing interest in large transformational deals, reflected in our
pipeline (1)
Adjusted Income from Operations is a Non-GAAP Measure. GAAP Income from Operations increased 22.9%
and GAAP Operating Margin was 16.1%.
Notes:
1)
|
 4
Our Growth Strategy
Lead
Guide global enterprises to best-in-class through our
proprietary SEP
framework
Expand
Invest in targeted industry verticals and domain expertise
Allocate
Allocate capital and resources to support sustainable,
profitable growth and shareholder value
Deliver
Execute seamlessly for clients across service lines and
geographies
We are actively driving change to our growth strategy to expand and capture a
bigger set of market opportunities:
Increasing focus on specific industry verticals, service lines and
geographies Redirecting management resources and investments to the best
opportunities SM |
 5
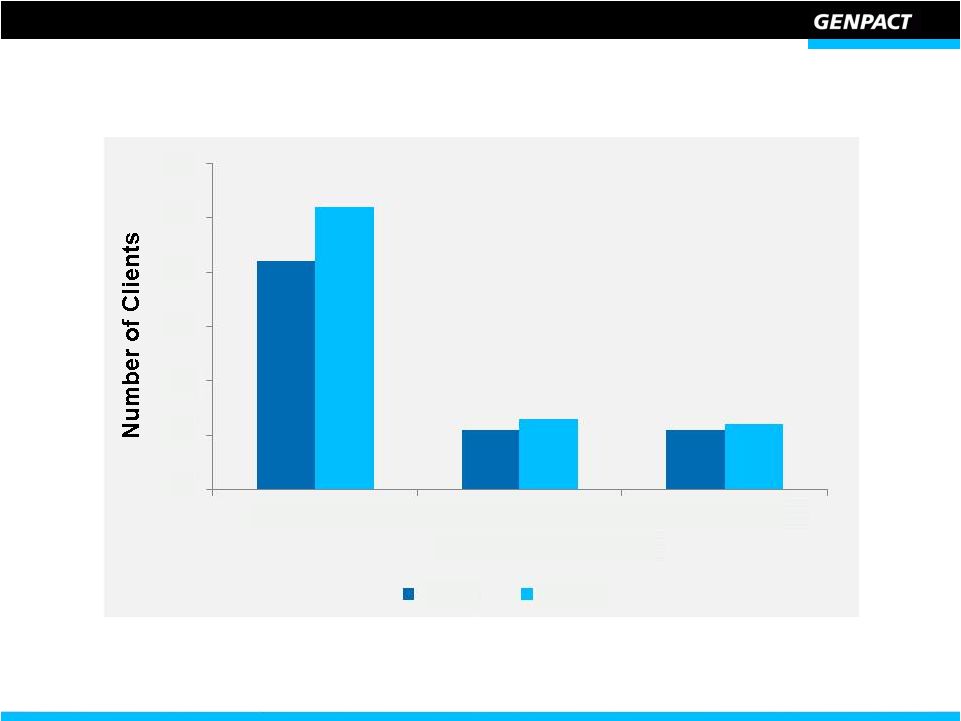
Continue to Expand Client Relationships
Notes:
1) Relationship size = Clients representing annual revenues based on rolling
four quarters 42
11
11
52
13
12
0
10
20
30
40
50
60
$5 to $15 MM
$15 to $25 MM
>$25 MM
Relationship Size
(1)
Q3 12
Q3 13 |
 6
Increased Pipeline Across Core Markets
Macro-environment continues to be mixed
Clients’ continued focus on improving business models to adapt to a
continuously challenging environment
Increasing interest in longer term, transformative engagements
Pipeline at historically high levels
Significantly bigger value and proportion of larger, transformative deals in the
pipeline, involving complex transformational changes
These larger deals take longer to convert to revenues
Win rates steady; pricing competitive but stable |
 7
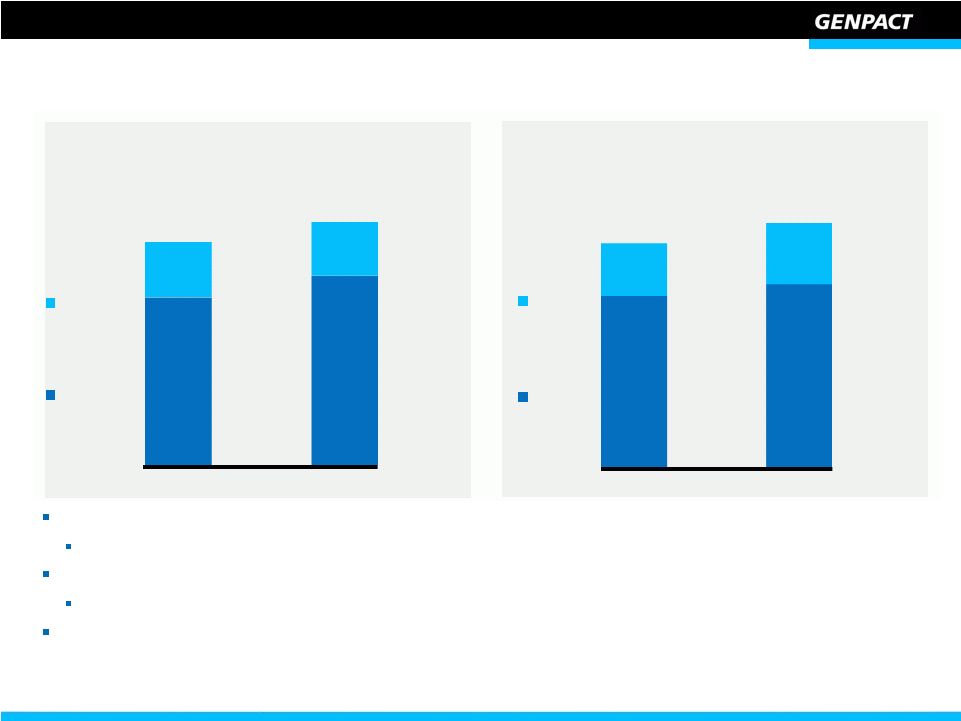
Revenue Growth of 8.9% Driven by Global Clients
Q3 2013 Global Clients
Business Process Management revenues increased 10% while ITO revenues increased
20% Q3 2013 GE
Decline
in
Business
Process
Management
partly
offset
by
growth
in
ITO
Year To Date 2013 revenue at $1.574 billion; up 12.9% year over year
Global
Clients
(1)
GE
(1)
BPM
ITO
8.9%
YoY
Growth%
12.7%
(2.7)%
8.9%
15.5%
6.9%
YoY
Growth%
$491.2
$534.9
Q3 ‘12
Q3 ‘13
Q3 ‘12
Q3 ‘13
($ in millions)
Notes:
1) Data adjusted for divestitures from GE
($ in millions)
369.9
416.9
121.3
118.0
376.1
401.9
115.1
133.0
$491.2
$534.9 |
 8
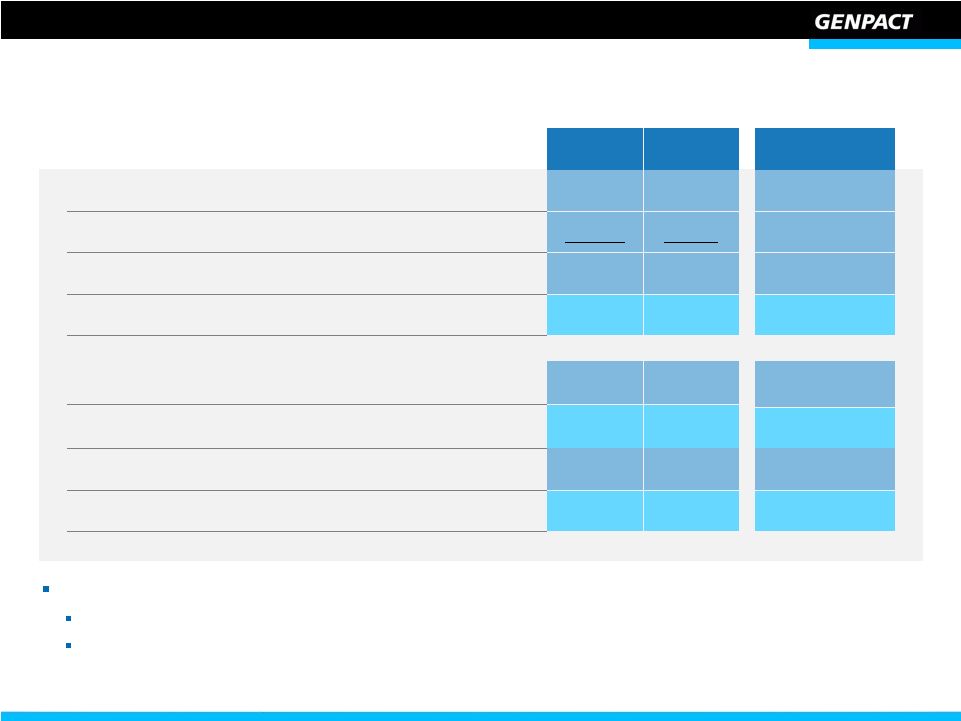
Adjusted Income From Operations Growth of 19.2%
Q3‘12
Q3‘13
YoY Growth
Revenue
$491.2
$534.9
8.9%
Cost Of Revenue
297.3
329.3
10.8%
Gross Profit
193.9
205.6
6.0%
Gross Profit % of Revenue
39.5%
38.4%
(110)bps
Selling, general and administrative expenses
118.5
117.0
(1.3)%
SG&A % of Revenue
24.1%
21.9%
(220)bps
Adjusted Income From Operations
(1)
79.7
95.0
19.2%
Adjusted Income From Operations Margin %
16.2%
17.8%
160 bps
Notes:
1) Adjusted Income from Operations is a Non-GAAP Measure. Income from
Operations was $70.0 million in Q3 ‘12 and $86.0 million in Q3 ’13
($ millions)
Strong Q3 2013 Adjusted Income from Operations margin driven by:
Continued efficiencies
Slower than expected ramps in front-end and domain expert hiring, and delays in
large deals that typically need upfront investments
|
 9
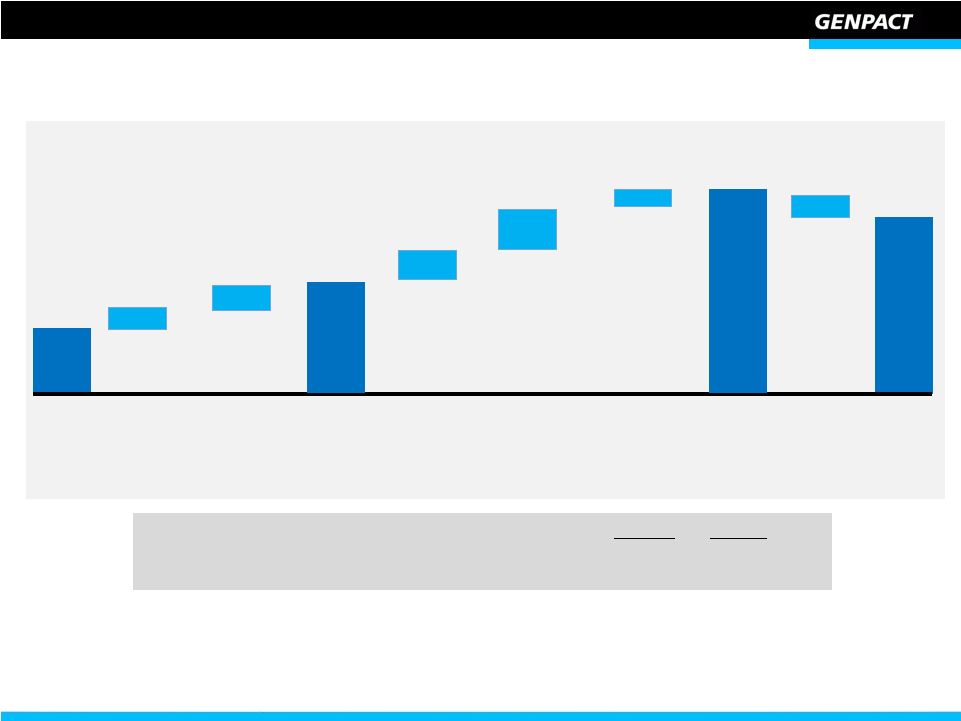
EPS Bridge
11
5
Adjusted
Income from
Operations
Q3 ‘12
GAAP
EPS
Q3 ‘12
Q3 ‘13
Adjusted Net Income ($ millions)
41.7
77.3
Diluted
Shares
Outstanding
(millions)
(2)
230
236
2
30
Fx
Re-measurement
Gains
(Cents per share)
Net
other
Adjustments
(1)
18
33
3
Net
other
Adjustments
(1)
Q3 ‘12
Adjusted
EPS
Q3 ‘13
Adjusted
EPS
Q3 ‘13
GAAP
EPS
Notes:
-
The above bridge reflects only significant variance items year over year
-
EPS = Diluted earnings per share
1)
Adjustments primarily include amortization of intangibles relating to acquisitions,
share-based compensation expenses and acquisition related expenses
2)
Weighted average number of diluted shares outstanding
4
‘12 one time
costs related to
recapitalization
8
Lower effective
tax rate
-3 |
 10
Strong Cash From Operations
Q3 2013 cash from operations increased 62% due to:
Higher Operating Margin
Lower working capital driven by improved Days Sales Outstanding
Q3 ‘12
Q3 ‘13
62%
$77
$126
YTD ‘12
YTD ‘13
$233
11%
42%
YoY
Growth%
YoY
Growth%
($ in millions)
Q3 ‘12
Q3 ‘13
Days Sales Outstanding
84
80
Cash
and
Liquid
Assets
($
millions)
(1)
395
499
Notes:
1) Cash and Liquid Assets = Cash and Cash equivalents and short-term
deposits ($ in millions)
Operating
Performance
Upfront Client
Payment
(One-time)
164
233
45
$209 |
 11
Full Year 2013 Outlook
FY 2013
Revenues ($B)
$2.12 -
$2.13
Adjusted Income from Operations -
Margin
16.5% -
16.8%
Other Metrics
Cash Flow From Operations
Decline < 5% YoY
Effective Tax Rate
24% -
26%
Capital Expenditure (% of revenue)
2.0% -
2.3% |
 Q&A |
 Annexure
1: Reconciliation of Adjusted Income from Operations
(USD, In Thousands)
September 30
2012
2013
Income from operations as per GAAP
$
69,952
$
85,957
Add: Amortization of acquired intangible assets resulting from
Formation Accounting
1,621
711
Add: Amortization of acquired intangible assets relating to
acquisitions
2,694
3,857
Add: Acquisition related expenses
298
-
Add: Consultancy and legal fees relating to change of shareholding
and capital restructuring (excluding expenses related to the credit
facility)
7,318
-
Add: Stock based compensation
5,613
5,312
Less: Provision (created) reversed for loss on divestitures
-
141
Add: Other income (expense)
(6,365)
184
Add: Gain on Equity-method investment activity, net
50
32
Less: Net income attributable to noncontrolling interest
(1,436)
(1,169)
Adjusted income from operations
$
79,745
$
95,025
Three
months
ended
13 |
 Annexure
2: Reconciliation of Adjusted Net Income (USD, In Thousands, except per share
data) Three
months
ended
September 30
2012
2013
Net income as per GAAP
$
25,175
$
70,262
Add: Amortization of acquired intangible assets resulting from
Formation Accounting
1,621
711
Add: Amortization of acquired intangible assets relating to
acquisitions
2,694
3,857
Add: Consultancy and legal fees relating to change of shareholding
and capital restructuring (excluding expenses related to the credit
facility)
7,318
-
Add: Stock based compensation
5,613
5,312
Add: Acquisition related expenses
298
-
Add:
Withholding
taxes
relating
to
remittance
of
funds
between
subsidiaries to partly fund the payment of special cash dividend in
respect of capital restructuring
2,300
-
Less: Tax impact on amortization of acquired intangibles resulting
from Formation Accounting
(357)
(114)
Less: Tax impact on amortization of acquired intangibles relating
from acquisitions
(893)
(1,319)
Less: Tax Impact on acquisition related expenses
(75)
-
Less: Tax Impact on stock based compensation
(1,971)
(1,458)
Adjusted net income
$
41,723
$
77,251
Adjusted diluted earnings per share
$
0.18
$
0.33
14 |
 Thank
You |