Attached files
| file | filename |
|---|---|
| 8-K - 8-K - BROADWIND, INC. | a13-23055_28k.htm |
| EX-99.1 - EX-99.1 - BROADWIND, INC. | a13-23055_2ex99d1.htm |
Exhibit 99.2
|
|
Broadwind Energy, Inc. Q3 2013 Investor Call Presentation © 2013 Broadwind Energy, Inc. All Rights Reserved. |

|
|
Industry Disclaimer and Forward Looking Statements Broadwind obtained the industry and market data used throughout this presentation from our own research, internal surveys and studies conducted by third parties, independent industry associations or general publications and other publicly available information. Independent industry publications and surveys generally state that they have obtained information from sources believed to be reliable, but do not guarantee the accuracy and completeness of such information. Forecasts are particularly likely to be inaccurate, especially over long periods of time. We are not aware of any misstatements in the industry data we have presented herein, but estimates involve risks and uncertainties and are subject to change based on various factors beyond our control. This presentation includes various forward-looking statements related to future, not past, events. Statements in this presentation that are not historical are forward-looking statements. These statements are based on current expectations and we undertake no obligation to update these statements to reflect events or circumstances occurring after this presentation. Such statements are subject to various risks and uncertainties that could cause actual results to vary materially from those stated. Such risks and uncertainties include, but are not limited to: expectations regarding our business, end-markets, relationships with customers and our ability to diversify our customer base; the impact of competition and economic volatility on the industries in which we compete; our ability to realize revenue from customer orders and backlog; the impact of regulation on end-markets, including the wind energy industry in particular; the sufficiency of our liquidity and working capital; our restructuring plans and the associated cost savings; the ability to preserve and utilize our tax net operating loss carry-forwards; and other risks and uncertainties described in our filings with the Securities and Exchange Commission. This presentation contains non-GAAP financial information. We believe that certain non-GAAP financial measures may provide users of this financial information meaningful comparisons between current results and results in prior operating periods. We believe that these non-GAAP financial measures can provide additional meaningful reflection of underlying trends of the business because they provide a comparison of historical information that excludes certain infrequently occurring or non-operational items that impact the overall comparability. Non-GAAP financial measures should be viewed in addition to, and not as an alternative to, our reported results prepared in accordance with GAAP. Please see our earnings release dated as of October 31, 2013 for a reconciliation of certain non-GAAP measures presented in this presentation. 2 © 2013 Broadwind Energy, Inc. All rights reserved. 10/31/2013 |
|
|
Q3 2013 Overview Business Highlights New orders of $87 million; excludes $106 million tower order received after quarter-end Revenue of $62.4 million, beat outlook and up 13% from prior year Gross profit margin (ex. restructuring) rose to 9.1%, up 370 bp from Q3 2012 Adj. EBITDA of $2.6 million – $4.1 million before regulatory settlement Operating working capital dropped to 2% of sales; cash assets rose to $24 million Market Highlights Wind Energy US wind market continues to mature: uptick in PPA/utility projects Continued focus on value-added services to drive lower operating costs Oil & Gas Shale plays over the last 3-5 years have moved U.S. to top global O&G producer Natural gas sector still weak although pricing has improved by $2.20 / MMbtu from 2012 low point Mining Market remains slow 10/31/2013 © 2013 Broadwind Energy, Inc. All rights reserved. 3 + 30% Excl. regulatory settlement |
|
|
Orders and Backlog 10/31/2013 © 2013 Broadwind Energy, Inc. All rights reserved. 4 Orders – $ Million New tower orders of $70 million $106 million in tower orders received after quarter-end; 2014 tower capacity substantially sold out, taking orders for 2015 Gearing orders of $13 million – mainly replacement gearing and other industrial Services orders above first half 2013 run rate, but still behind prior year Order Backlog – $M Q3 2013 ending backlog up 17% sequentially 2013 estimated revenue of $215-220 million, all booked as of 9/30/13 Backlog approaching $255 million at 10/31/13 Q3 12 Q3 13 YTD 12 YTD 13 Towers/Weldments 11.1 70.3 22.4 202.8 Gears 8.7 12.8 35.3 29.3 Services 5.9 3.9 16.2 6.1 Gross Orders 25.7 87.0 73.9 238.2 less: tower cancellations -8.0 0 -8.0 -34.5 Net Orders 17.7 87.0 65.9 203.7 |
|
|
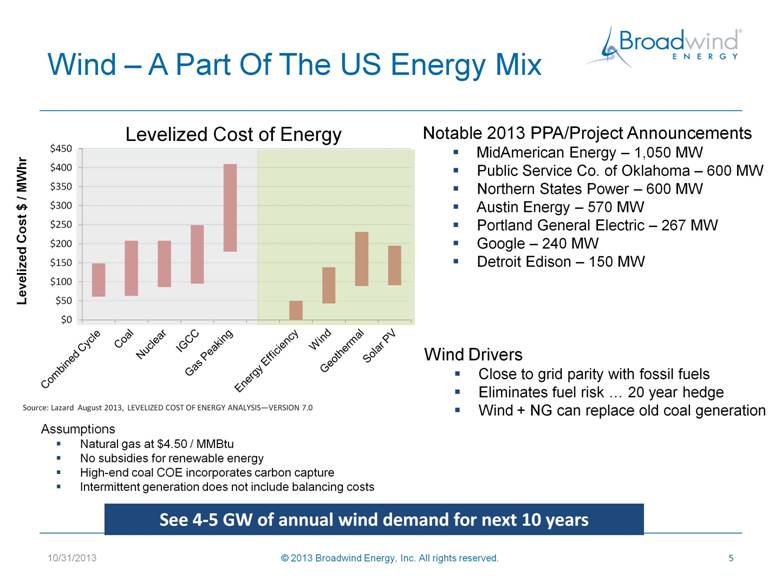
Wind – A Part Of The US Energy Mix 10/31/2013 © 2013 Broadwind Energy, Inc. All rights reserved. 5 Levelized Cost $ / MWhr Levelized Cost of Energy Notable 2013 PPA/Project Announcements MidAmerican Energy – 1,050 MW Public Service Co. of Oklahoma – 600 MW Northern States Power – 600 MW Austin Energy – 570 MW Portland General Electric – 267 MW Google – 240 MW Detroit Edison – 150 MW Assumptions Natural gas at $4.50 / MMBtu No subsidies for renewable energy High-end coal COE incorporates carbon capture Intermittent generation does not include balancing costs Source: Lazard August 2013, LEVELIZED COST OF ENERGY ANALYSIS—VERSION 7.0 See 4-5 GW of annual wind demand for next 10 years Wind Drivers Close to grid parity with fossil fuels Eliminates fuel risk 20 year hedge Wind + NG can replace old coal generation |
|
|
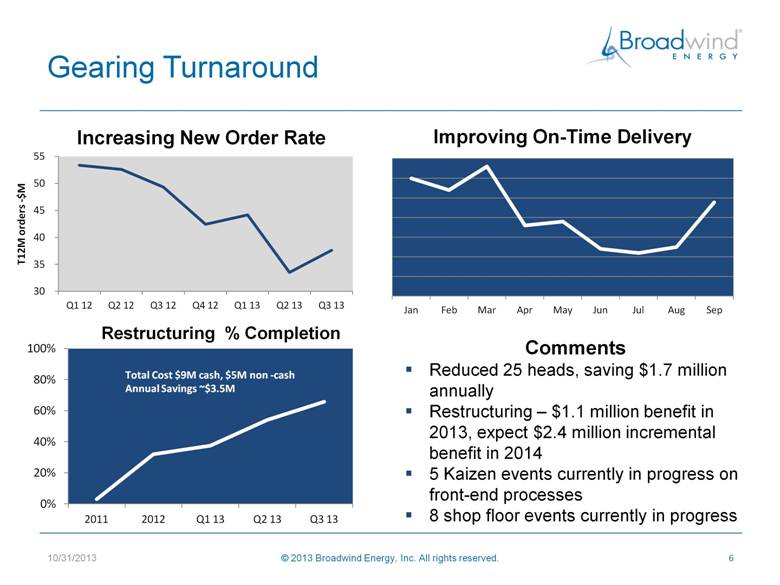
Gearing Turnaround 10/31/2013 © 2013 Broadwind Energy, Inc. All rights reserved. 6 Total Cost $9M cash, $5M non -cash Annual Savings ~$3.5M Comments Reduced 25 heads, saving $1.7 million annually Restructuring – $1.1 million benefit in 2013, expect $2.4 million incremental benefit in 2014 5 Kaizen events currently in progress on front-end processes 8 shop floor events currently in progress |
|
|
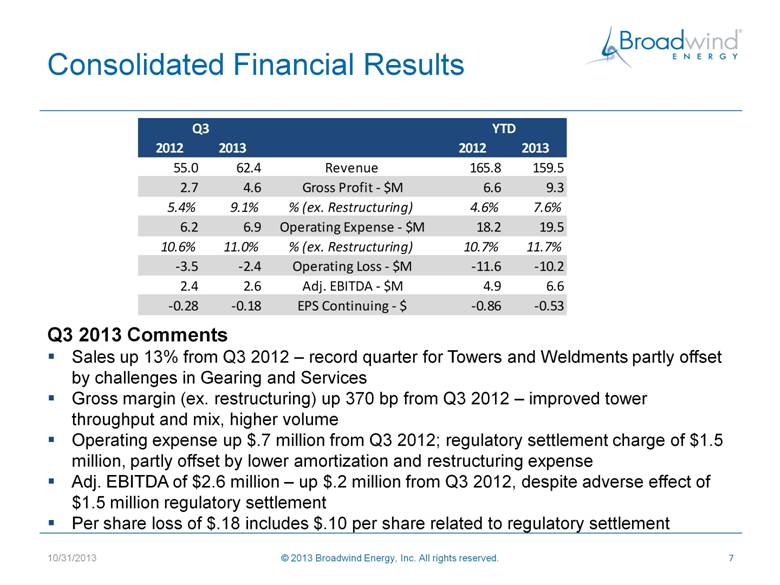
Consolidated Financial Results 10/31/2013 © 2013 Broadwind Energy, Inc. All rights reserved. 7 Q3 2013 Comments Sales up 13% from Q3 2012 – record quarter for Towers and Weldments partly offset by challenges in Gearing and Services Gross margin (ex. restructuring) up 370 bp from Q3 2012 – improved tower throughput and mix, higher volume Operating expense up $.7 million from Q3 2012; regulatory settlement charge of $1.5 million, partly offset by lower amortization and restructuring expense Adj. EBITDA of $2.6 million – up $.2 million from Q3 2012, despite adverse effect of $1.5 million regulatory settlement Per share loss of $.18 includes $.10 per share related to regulatory settlement 2012 2013 2012 2013 55.0 62.4 Revenue 165.8 159.5 2.7 4.6 Gross Profit - $M 6.6 9.3 5.4% 9.1% % (ex. Restructuring) 4.6% 7.6% 6.2 6.9 Operating Expense - $M 18.2 19.5 10.6% 11.0% % (ex. Restructuring) 10.7% 11.7% -3.5 -2.4 Operating Loss - $M -11.6 -10.2 2.4 2.6 Adj. EBITDA - $M 4.9 6.6 -0.28 -0.18 EPS Continuing - $ -0.86 -0.53 Q3 YTD |
|
|
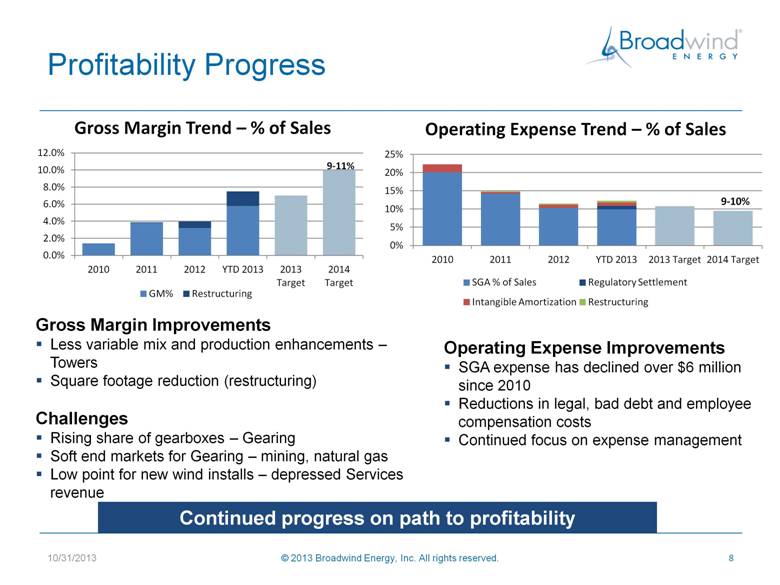
Profitability Progress 10/31/2013 © 2013 Broadwind Energy, Inc. All rights reserved. 8 9-11% 9-10% Gross Margin Improvements Less variable mix and production enhancements – Towers Square footage reduction (restructuring) Challenges Rising share of gearboxes – Gearing Soft end markets for Gearing – mining, natural gas Low point for new wind installs – depressed Services revenue Operating Expense Improvements SGA expense has declined over $6 million since 2010 Reductions in legal, bad debt and employee compensation costs Continued focus on expense management Continued progress on path to profitability |
|
|
Towers and Weldments 10/31/2013 © 2013 Broadwind Energy, Inc. All rights reserved. 9 Third Quarter 2013 Strongest quarter on record for Towers Tower section volume increased 18% compared to Q3 2012 Q3 2013 productivity increase from process improvements and more uniform tower types Adj. EBITDA margin nearly doubled due to better productivity and favorable mix Strategic Focus Use Continuous Improvement tools to drive increased throughput and efficiency Expanding capacity in our current footprint: >500 towers in 2014 Diversify by growing industrial weldments product line 2012 2013 2012 2013 93 124 Towers-No. 238 282 314 372 Sections-No. 969 938 37.4 48.7 Revenue-$M 109.6 116.2 1.7 6.7 Op. Income-$M 3.3 12.8 3.1 7.8 Adj. EBITDA-$M 7.1 16.5 8.2% 16.1% Adj. EBITDA Margin 6.5% 14.2% Q3 YTD |
|
|
Gearing 10/31/2013 © 2013 Broadwind Energy, Inc. All rights reserved. 10 Third Quarter 2013 Revenue affected by production delays related to product mix and by industrial end-market softness Adj. EBITDA decline due to regulatory settlement charge of $1.5M, lower volumes and margins, partly offset by other spending reductions Plant consolidation ~ 77% complete – ahead of schedule and on budget Strategic Focus Streamline production flow and order-to-shipment activities Improve capacity utilization — plant consolidation underway Diversify industrial customers Manage strategic shift in product mix 2012 2013 2012 2013 11.3 10.4 Revenue-$M 41.4 31.6 (2.6) (5.7) Op. Income-$M (5.4) (12.4) 0.9 (2.6) Adj. EBITDA-$M 4.0 (2.5) 7.6% -24.9% Adj. EBITDA Margin 9.7% -7.9% Q3 YTD |
|
|
Services 10/31/2013 © 2013 Broadwind Energy, Inc. All rights reserved. 11 Third Quarter 2013 Revenue down 46% from Q3 2012 – lower gearbox sales and depressed field service work resulting from period of low wind turbine installations Services work being in-sourced and longer OEM warranties contributing to revenue drop Strategic Focus Diversify revenue base, particularly with industrial customers Further develop proprietary product offerings Launched DriveMAX and BladeMAX campaigns Continue drive toward profitability Source: MAKE Consulting 2012 2013 2012 2013 6.9 3.7 Revenue-$M 16.0 15.3 (0.6) (1.3) Op. Income-$M (3.3) (3.2) 0.1 (0.8) Adj. EBITDA-$M (1.4) (1.5) 1.0% -21.9% Adj. EBITDA Margin -8.7% -9.6% Q3 YTD |
|
|
Operating Working Capital 10/31/2013 © 2013 Broadwind Energy, Inc. All rights reserved. 12 9/30/13 operating working capital decreased $5.5 million from 6/30/13 to $4 million, or 2% of annualized Q3 2013 sales Inventories dropped from Q2 2013 related to the shipment of $4.4 million of towers produced in Q2 but not signed off by customer until Q3 Operating working capital should remain low through year-end |
|
|
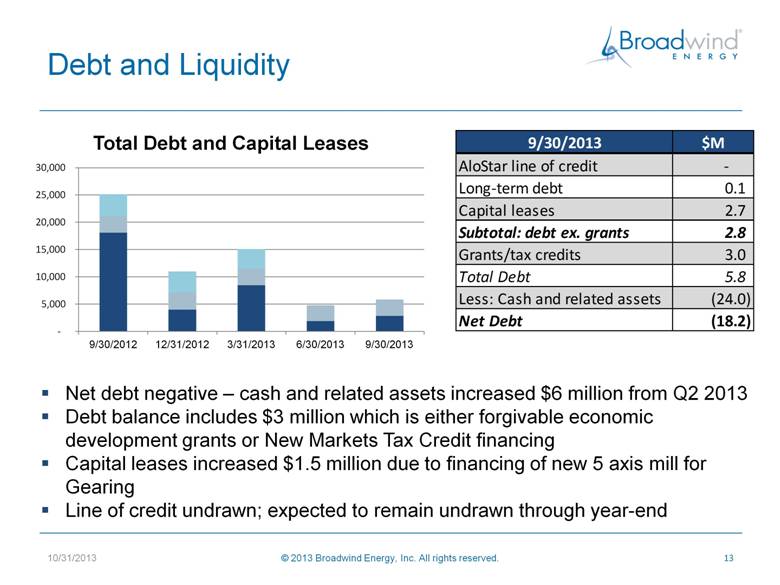
Debt and Liquidity 10/31/2013 © 2013 Broadwind Energy, Inc. All rights reserved. 13 Net debt negative – cash and related assets increased $6 million from Q2 2013 Debt balance includes $3 million which is either forgivable economic development grants or New Markets Tax Credit financing Capital leases increased $1.5 million due to financing of new 5 axis mill for Gearing Line of credit undrawn; expected to remain undrawn through year-end 9/30/2013 $M AloStar line of credit - Long-term debt 0.1 Capital leases 2.7 Subtotal: debt ex. grants 2.8 Grants/tax credits 3.0 Total Debt 5.8 Less: Cash and related assets (24.0) Net Debt (18.2) |
|
|
2013 Financial Outlook 10/31/2013 © 2013 Broadwind Energy, Inc. All rights reserved. 14 Towers and Weldments: Greater revenue visibility given improved supply/demand balance Level-loading, fewer tower types increasing throughput, efficiencies and margins Gearing: Revenue and end-market demand down from 2012, with some uncertainty in natural gas Margin challenged – restructuring benefits not material until late 2013/2014 Services: Strict cost management to minimize cash utilization FY 2010 FY 2011 FY 2012 2013 E Q4 2012 Q4 2013 Revenue-$M 137.0 186.0 210.7 215-218 44.9 55-58 Gross Profit-$M 1.9 7.2 6.8 0.2 -% (ex. Restructuring) 1.4% 3.9% 4.0% 1.8% Operating Expense-$M 30.4 27.6 24.1 5.9 -% (ex. Restructuring) 22.2% 14.6% 11.1% 12.6% Impairment Exp. -$M 40.8 Operating Income-$M (69.2) (20.4) (17.3) (5.7) Adj. EBITDA-$M (9.2) (2.1) 5.5 9-10 0.7 >2 EPS, Continuing (6.56) (1.79) (1.27) (.67-.69) (0.41) (.14-.16) |
|
|
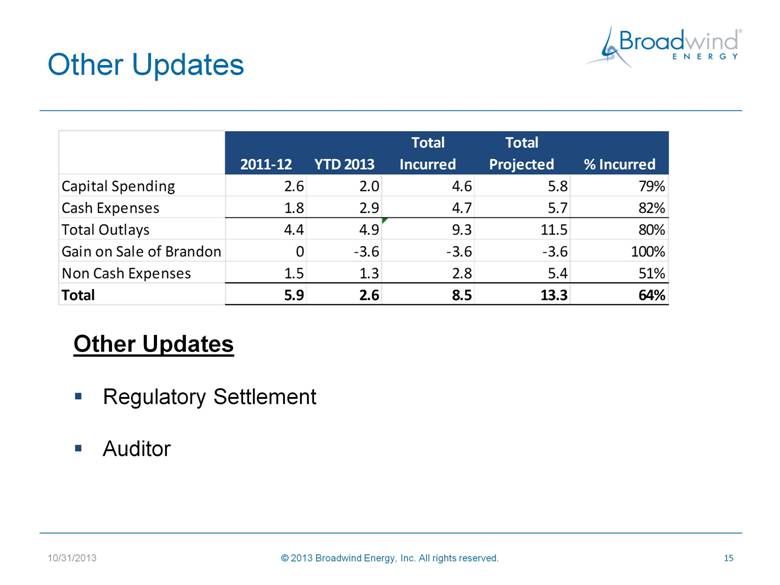
Other Updates 10/31/2013 © 2013 Broadwind Energy, Inc. All rights reserved. 15 Other Updates Regulatory Settlement Auditor 2011-12 YTD 2013 Total Incurred Total Projected % Incurred Capital Spending 2.6 2.0 4.6 5.8 79% Cash Expenses 1.8 2.9 4.7 5.7 82% Total Outlays 4.4 4.9 9.3 11.5 80% Gain on Sale of Brandon 0 -3.6 -3.6 -3.6 100% Non Cash Expenses 1.5 1.3 2.8 5.4 51% Total 5.9 2.6 8.5 13.3 64% |
|
|
Broadwind Energy is committed to helping customers maximize performance of their energy and infrastructure investments— quicker, easier and smarter. 16 © 2013 Broadwind Energy, Inc. All rights reserved. 10/31/2013 |