Attached files
| file | filename |
|---|---|
| 8-K - 8-K - Altra Industrial Motion Corp. | d614571d8k.htm |
| EX-99.1 - EX-99.1 - Altra Industrial Motion Corp. | d614571dex991.htm |
Exhibit 99.2

Third-Quarter 2013 Results
October 24, 2013 10:00 AM ET Dial In Number 877-407-8293 Domestic 201-689-8349 International Webcast at www.altramotion.com
Replay Number
Through November 7, 2013, 2013 877-660-6853 Domestic 201-612-7415 International Conference ID: # 422437 Webcast Replay at www.altramotion.com
Safe Harbor Statement
Cautionary Statement Regarding Forward Looking Statements
All statements, other than statements of historical fact included in this release are forward-looking statements, as that term is defined in the Private Securities Litigation Reform Act of 1995. These statements include, but are not limited to, any statement that may predict, forecast, indicate or imply future results, performance, achievements or events. Forward-looking statements can generally be identified by phrases such as "believes," "expects," "potential," "continues," "may," "should," "seeks," "predicts," "anticipates," "intends," "projects," "estimates," "plans," "could," "designed", "should be," and other similar expressions that denote expectations of future or conditional events rather than statements of fact. Forward-looking statements also may relate to strategies, plans and objectives for, and potential results of, future operations, financial results, financial condition, business prospects, growth strategy and liquidity, and are based upon financial data, market assumptions and management's current business plans and beliefs or current estimates of future results or trends available only as of the time the statements are made, which may become out of date or incomplete. Forward-looking statements are inherently uncertain, and investors must recognize that events could differ significantly from our expectations. These statements include, but may not be limited to, those relating to organic growth opportunities, end market expectations, plans to enhance bottom line performance, plans to gain market share, the contribution of new products and programs to Altra’s performance in the coming year, statements relating to future dividend payments, the Company’s acquisition strategy and its guidance for full year 2013.
In addition to the risks and uncertainties noted in this release, there are factors that could cause actual results to differ materially from those anticipated by some of the statements made. These include: (1) competitive pressures, (2) changes in economic conditions in the United States and abroad and the cyclical nature of our markets, (3) loss of distributors, (4) the ability to develop new products and respond to customer needs, (5) risks associated with international operations, including currency risks, (6) accuracy of estimated forecasts of OEM customers and the impact of the current global economic environment on our customers, (7) risks associated with a disruption to our supply chain, (8) fluctuations in the costs of raw materials used in our products, (9) product liability claims, (10) work stoppages and other labor issues, (11) changes in employment, environmental, tax and other laws and changes in the enforcement of laws, (12) loss of key management and other personnel, (13) changes in pension and retirement liabilities, (14) risks associated with compliance with environmental laws, (15) the ability to successfully identify, execute, manage and integrate key acquisitions and mergers, (16) failure to obtain or protect intellectual property rights, (17) risks associated with impairment of goodwill or intangibles assets, (18) failure of operating equipment or information technology infrastructure, (19) risks associated with our debt leverage and operating covenants under our debt instruments, (20) risks associated with restrictions contained in our Convertible Notes and Credit Facility, (21) risks associated with compliance with tax laws, (22) risks associated with the global recession and volatility and disruption in the global financial markets, (23) risks associated with implementation of our new ERP system, (24) risks associated with the Bauer and Lamiflex acquisitions and integration and other acquisitions, (25) risks associated with the Company's investment in a new manufacturing facility in China, and (26) other risks, uncertainties and other factors described in the Company's quarterly reports on Form 10-Q and annual reports on Form 10-K and in the Company's other filings with the U.S. Securities and Exchange Commission (SEC) or in materials incorporated therein by reference. Except as required by applicable law, Altra Holdings, Inc. does not intend to, update or alter its forward looking statements, whether as a result of new information, future events or otherwise.
| 1 |
|
Third-Quarter 2013 Highlights
Gross margin improved 80 basis points to 30.6%
Improvements at underperforming businesses and European restructuring contributed to margin improvements
YTD Operating cash flows improved 14% to $62.2 million
Net income increased 24% from the prior year quarter
| 2 |
|
End Market Review
Sales at Distribution were still down quarter over quarter Turf and Garden demand better than expected New product development led to top-line growth in Ag
Materials handling market is mixed, with strength in elevators and forklift trucks Energy market remains a good long-term market, but has slowed in 2013 Mining and metals improved from Q2 but remain weak
3
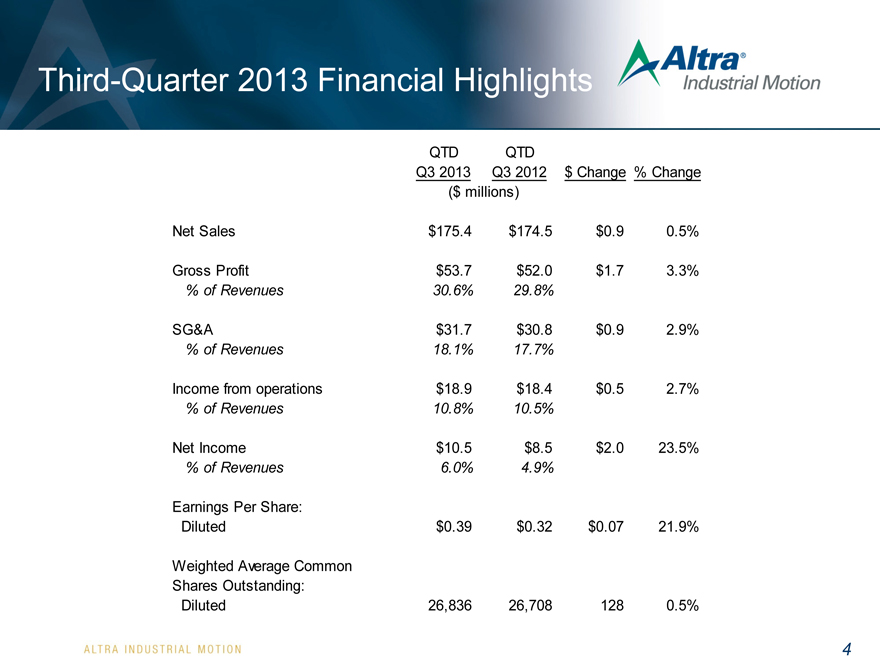
Third-Quarter 2013 Financial Highlights
QTD QTD
Q3 2013 Q3 2012 $ Change % Change
($ millions)
Net Sales $175.4 $174.5 $0.9 0.5%
Gross Profit $53.7 $52.0 $1.7 3.3%
% of Revenues 30.6% 29.8%
SG&A $31.7 $30.8 $0.9 2.9%
% of Revenues 18.1% 17.7%
Income from operations $18.9 $18.4 $0.5 2.7%
% of Revenues 10.8% 10.5%
Net Income $10.5 $8.5 $2.0 23.5%
% of Revenues 6.0% 4.9%
Earnings Per Share:
Diluted $0.39 $0.32 $0.07 21.9%
Weighted Average Common
Shares Outstanding:
Diluted 26,836 26,708 128 0.5%
| 4 |
|
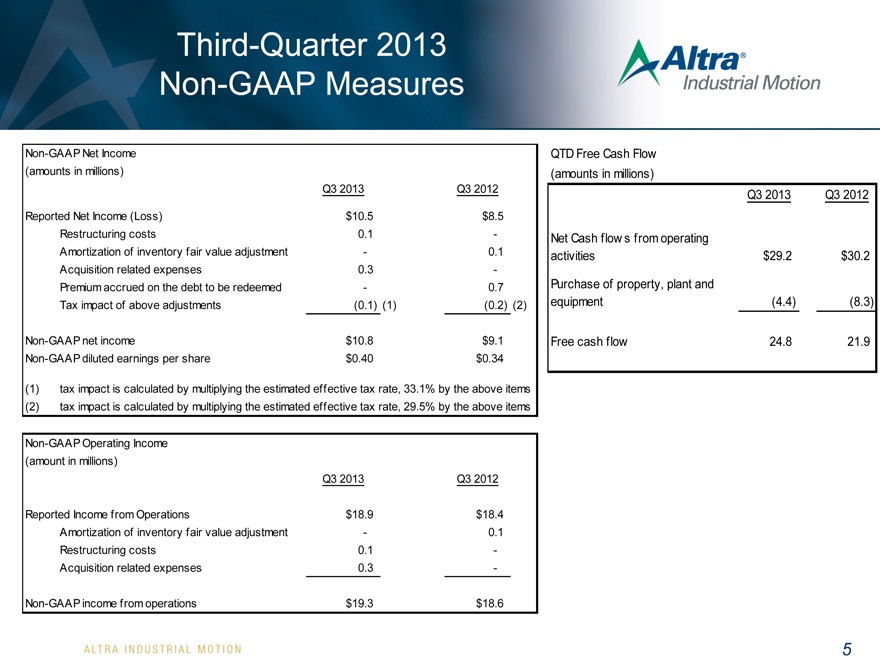
QTD Free Cash Flow
(amounts in millions)
Q3 2013 Q3 2012
Net Cash flows from operating
activities $29.2 $30.2
Purchase of property, plant and
equipment (4.4) (8.3)
Free cash flow 24.8 21.9
Weighted Average Common
Shares Outstanding:
Diluted 26,836 26,708 128 0.5%
Non-GAAP Net Income
(amounts in millions)
Q3 2013 Q3 2012
Reported Net Income (Loss) $ 10.5 $8.5
Restructuring costs 0.1 -
Amortization of inventory fair value adjustment - 0.1
Acquisition related expenses 0.3 -
Premium accrued on the debt to be redeemed - 0.7
Tax impact of above adjustments (0.1) (1) (0.2) (2)
Non-GAAP net income $ 10.8 $9.1
Non-GAAP diluted earnings per share $ 0.40 $0.34
(1) tax impact is calculated by multiplying the estimated effective tax rate, 33.1% by the above items
(2) tax impact is calculated by multiplying the estimated effective tax rate, 29.5% by the above items
Non-GAAP Operating Income
(amount in millions)
Q3 2013 Q3 2012
Reported Income from Operations $ 18.9 $18.4
Amortization of inventory fair value adjustment - 0.1
Restructuring costs 0.1 -
Acquisition related expenses 0.3 -
Non-GAAP income from operations $ 19.3 $18.6
| 5 |
|
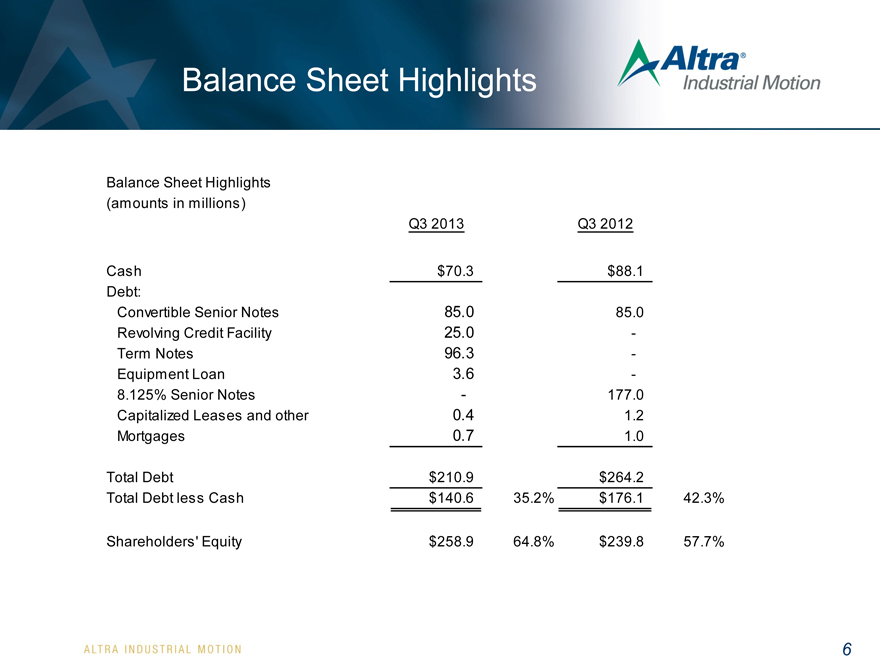
Balance Sheet Highlights
Balance Sheet Highlights
(amounts in millions)
Q3 2013 Q3 2012
Cash $70.3 $88.1
Debt:
Convertible Senior Notes 85.0 85.0
Revolving Credit Facility 25.0 -
Term Notes 96.3 -
Equipment Loan 3.6 -
8.125% Senior Notes - 177.0
Capitalized Leases and other 0.4 1.2
Mortgages 0.7 1.0
Total Debt $210.9 $264.2
Total Debt less Cash $140.6 35.2% $176.1 42.3%
Shareholders' Equity $258.9 64.8% $239.8 57.7%
| 6 |
|
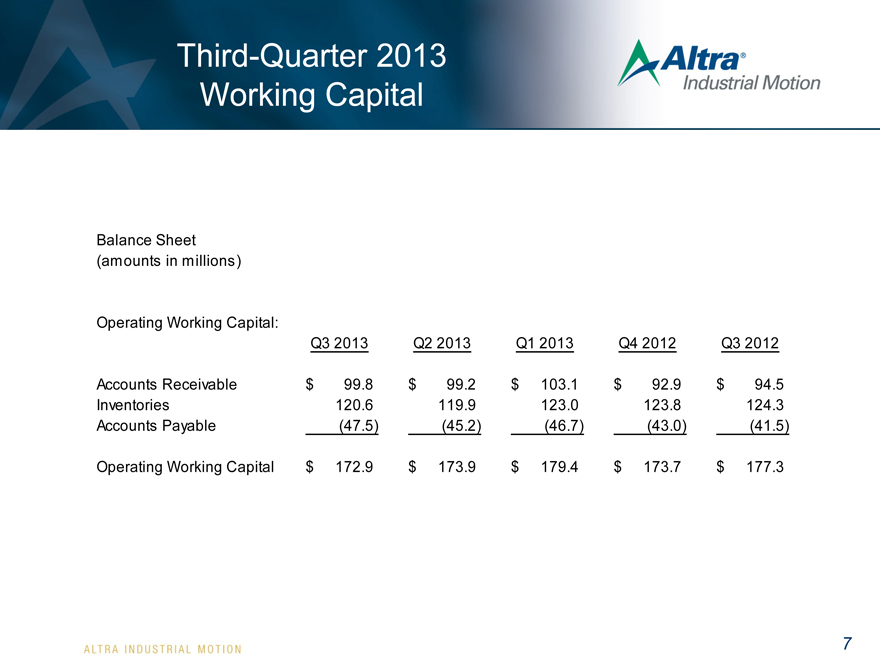
Third-Quarter 2013 Working Capital
Balance Sheet
(amounts in millions)
Operating Working Capital:
Q3 2013 Q2 2013 Q1 2013 Q4 2012 Q3 2012
Accounts Receivable $ 99.8 $ 99.2 $ 103.1 $ 92.9 $ 94.5
Inventories 120.6 119.9 123.0 123.8 124.3
Accounts Payable (47.5) (45.2) (46.7) (43.0) (41.5)
Operating Working Capital $ 172.9 $ 173.9 $ 179.4 $ 173.7 $ 177.3
| 7 |
|
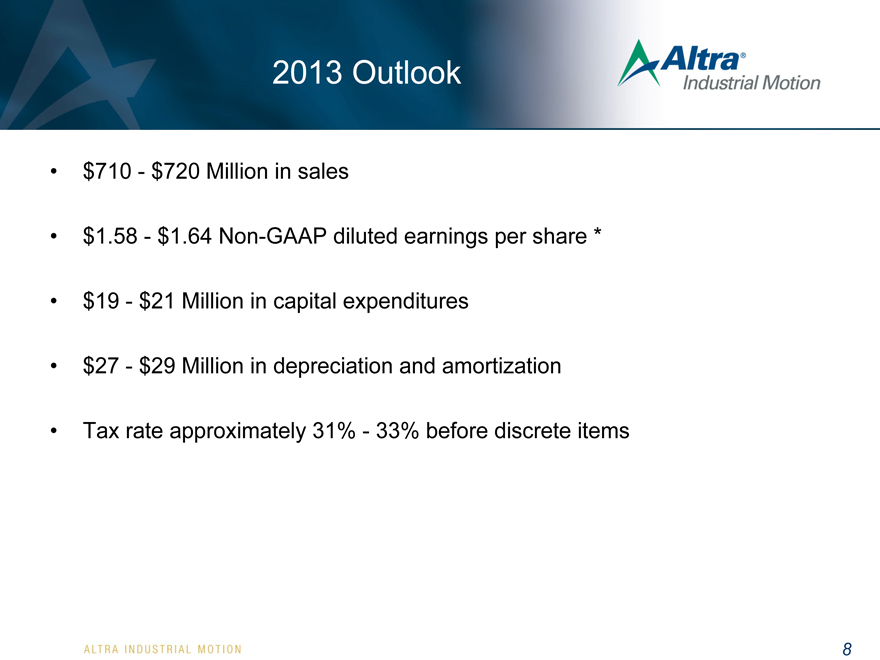
2013 Outlook
$ 710 - $ 720 Million in sales
$ 1.58 - $ 1.64 Non-GAAP diluted earnings per share *
$ 19 - $ 21 Million in capital expenditures
$ 27 - $ 29 Million in depreciation and amortization
Tax rate approximately 31% - 33% before discrete items
| 8 |
|
Summary
Expanding our presence into emerging geographies
Operational excellence is progressing well
Positive contribution to quarterly margin from initial pricing strategy actions Customer collaboration on new products will yield future orders Strong balance sheet makes us ready to execute on our acquisition strategy
9
Discussion of Non-GAAP Measures
* As used in this release and the accompanying slides posted on the Company’s website, non-GAAP diluted earnings per share, non-GAAP income from operations and non-GAAP net income are each calculated using either net income or income from operations that excludes acquisition related costs, restructuring costs, and other income or charges that management does not consider to be directly related to the Company's core operating performance. Non-GAAP diluted earnings per share is calculated by dividing non-GAAP net income by GAAP weighted average shares outstanding (diluted). Non-GAAP free cash flow is calculated by deducting purchases of property, plant and equipment from net cash provided by operating activities.
Altra believes that the presentation of non-GAAP net income, non-GAAP income from operations, non-GAAP diluted earnings per share and non-GAAP free cash flow provides important supplemental information to management and investors regarding financial and business trends relating to the Company's financial condition and results of operations.
10