Attached files
| file | filename |
|---|---|
| EX-32.2 - EX-32.2 - Altra Industrial Motion Corp. | aimc-ex322_8.htm |
| EX-32.1 - EX-32.1 - Altra Industrial Motion Corp. | aimc-ex321_11.htm |
| EX-31.2 - EX-31.2 - Altra Industrial Motion Corp. | aimc-ex312_13.htm |
| EX-31.1 - EX-31.1 - Altra Industrial Motion Corp. | aimc-ex311_10.htm |
| EX-23.1 - EX-23.1 - Altra Industrial Motion Corp. | aimc-ex231_6.htm |
| EX-21.1 - EX-21.1 - Altra Industrial Motion Corp. | aimc-ex211_9.htm |
UNITED STATES
SECURITIES AND EXCHANGE COMMISSION
Washington, D.C. 20549
Form 10-K
(Mark One)
|
☒ |
ANNUAL REPORT PURSUANT TO SECTION 13 OR 15(d) OF THE SECURITIES EXCHANGE ACT OF 1934 |
For the fiscal year ended December 31, 2017
OR
|
☐ |
TRANSITION REPORT PURSUANT TO SECTION 13 OR 15(d) OF THE SECURITIES EXCHANGE ACT OF 1934 |
For the transition period from to
Commission file number: 001-33209
ALTRA INDUSTRIAL MOTION CORP.
(Exact name of registrant as specified in its charter)
|
Delaware |
|
61-1478870 |
|
(State or other jurisdiction of incorporation or organization) |
|
(I.R.S. Employer Identification No.) |
|
|
|
|
|
300 Granite Street, Suite 201 Braintree, MA |
|
02184 |
|
(Address of principal executive offices) |
|
(Zip Code) |
Registrant’s telephone number, including area code:
(781) 917-0600
Securities registered pursuant to Section 12(b) of the Act:
|
|
Title of Each Class |
|
Name of Each Exchange on Which Registered |
|
|
|
Common Stock, $0.001 par value |
|
NASDAQ Global Market |
|
Securities registered pursuant to Section 12(g) of the Act:
NONE
Indicate by check mark if the registrant is a well-known seasoned issuer, as defined in Rule 405 of the Securities Act. Yes ☒ No ☐
Indicate by check mark if the registrant is not required to file reports pursuant to Section 13 or 15(d) of the Act. Yes ☐ No ☒
Indicate by check mark whether the registrant: (1) has filed all reports required to be filed by Section 13 or 15(d) of the Securities Exchange Act of 1934 during the preceding 12 months (or for such shorter period that the registrant was required to file such reports), and (2) has been subject to such filing requirements for the past 90 days. Yes ☒ No ☐
Indicate by check mark whether the registrant has submitted electronically and posted on its corporate Web site, if any, every Interactive Data File required to be submitted and posted pursuant to Rule 405 of Regulation S-T during the preceding 12 months (or for such shorter period that the registrant was required to submit and post such files). Yes ☒ No ☐
Indicate by check mark if disclosure of delinquent filers pursuant to Item 405 of Regulation S-K is not contained herein, and will not be contained, to the best of the registrant’s knowledge, in definitive proxy or information statements incorporated by reference in Part III of this Form 10-K or any amendment to this Form 10-K. ☐
Indicate by check mark whether the registrant is a large accelerated filer, an accelerated filer, a non-accelerated filer, or a smaller reporting company or an emerging growth company. See the definitions of “large accelerated filer,” “accelerated filer,” “smaller reporting company,” and “emerging growth company” in Rule 12b-2 of the Exchange Act. (Check one):
|
Large accelerated filer |
|
☒ |
|
Accelerated filer |
☐ |
|
Non-accelerated filer |
|
☐ |
(Do not check if a smaller reporting company) |
Smaller reporting company |
☐ |
Emerging growth company ☐
If an emerging growth company, indicate by check mark if the registrant has elected not to use the extended transition period for complying with any new or revised financial accounting standards provided pursuant to Section 13(a) of the Exchange Act.
Indicate by check mark whether the registrant is a shell company (as defined in Rule 12b-2 of the Exchange Act). Yes ☐ No ☒
The aggregate market value of the voting and non-voting common stock held by non-affiliates of the registrant based on the closing price (as reported by the NASDAQ Global Market) of such common stock on the last business day of the registrant’s most recently completed second fiscal quarter (June 30, 2017) was approximately $1.12 billion.
As of February 21, 2018, there were 29,315,963 shares of Common Stock, $0.001 par value per share, outstanding.
DOCUMENTS INCORPORATED BY REFERENCE:
Portions of the following document are incorporated herein by reference into the Part of the Form 10-K indicated.
|
Document |
|
Part of Form 10-K into which Incorporated |
|
Altra Industrial Motion Corp. Proxy Statement for the 2018 Annual Meeting of Stockholders |
|
Part III |
|
|
|
|
|
Page |
|
PART I |
|
|
|
|
|
Item 1. |
|
|
3 |
|
|
Item 1A. |
|
|
11 |
|
|
Item 1B. |
|
|
22 |
|
|
Item 2. |
|
|
22 |
|
|
Item 3. |
|
|
23 |
|
|
Item 4. |
|
|
23 |
|
|
|
|
|
|
|
|
PART II |
|
|
|
|
|
Item 5. |
|
|
24 |
|
|
Item 6. |
|
|
27 |
|
|
Item 7. |
|
Management’s Discussion and Analysis of Financial Condition and Results of Operations |
|
28 |
|
Item 7A. |
|
|
43 |
|
|
Item 8. |
|
|
44 |
|
|
Item 9 |
|
Changes in and Disagreements with Accountants on Accounting and Financial Disclosure |
|
78 |
|
Item 9A. |
|
|
78 |
|
|
Item 9B. |
|
|
80 |
|
|
|
|
|
|
|
|
PART III |
|
|
|
|
|
Item 10. |
|
|
80 |
|
|
Item 11. |
|
|
80 |
|
|
Item 12. |
|
Security Ownership of Certain Beneficial Owners and Management and Related Stockholder Matters |
|
80 |
|
Item 13. |
|
Certain Relationships and Related Transactions, and Director Independence |
|
80 |
|
Item 14. |
|
|
80 |
|
|
|
|
|
|
|
|
PART IV |
|
|
|
|
|
Item 15. |
|
|
81 |
|
|
Item 16. |
|
Form 10-K Summary |
|
85 |
2
Our Company
Altra Industrial Motion Corp. (“Altra” or the “Company”) (formerly Altra Holdings, Inc.) is a leading global designer, producer and marketer of a wide range of mechanical power transmission, or MPT, components. Our products are used to control and transmit power and torque in virtually any industrial application involving movement. With our global footprint, we sell our products in over 70 countries and serve customers in a diverse group of industries, including energy, general industrial, material handling, metals, mining, special machinery, transportation, and turf and garden. Our product portfolio includes clutches and brakes, couplings and gearing and other power transmission components. Our products are used in a wide variety of high-volume manufacturing processes, where the reliability and accuracy of our products are critical in both avoiding costly down time and enhancing the overall efficiency of manufacturing operations. Our products are also used in non-manufacturing applications where product quality and reliability are especially critical, such as clutches and brakes for elevators and residential and commercial lawnmowers. Altra was incorporated in 2004 in the State of Delaware and became a publicly traded company in 2006. Altra is headquartered in Braintree, Massachusetts.
We market our products under well recognized and established brands, many of which have been in existence for over 50 years. We believe many of our brands, when taken together with our brands in the same product category, have achieved the number one or number two position in terms of consolidated market share and brand awareness in their respective product categories. Our products are either incorporated into products sold by original equipment manufacturers, (“OEMs”), sold to end users directly, or sold through industrial distributors.
In this Annual Report on Form 10-K, the terms “Altra”, “Altra Industrial Motion,” “the Company,” “we,” “us” and “our” refer to Altra Industrial Motion Corp. and its subsidiaries, except where the context otherwise requires or indicates.
We file reports and other documents with the Securities and Exchange Commission. You may read and copy documents we file at the SEC’s Public Reference Room at 100 F Street, NE, Washington, D.C. 20549. You should call 1-800-SEC-0330 for more information on the public reference room. Our SEC Filings are also available to you on the SEC’s internet site at http://www.sec.gov.
Our internet address is www.altramotion.com. By following the link “Investor Relations” and then “SEC filings” on our internet website, we make available, free of charge, our Annual Report on Form 10-K, our Quarterly Reports on Form 10-Q, our Current Reports on Form 8-K, and amendments to those reports filed or furnished pursuant to Section 13(a) or 15(d) of the Securities Exchange Act of 1934, as amended (the “Exchange Act”) as soon as reasonably practicable after such forms are filed with or furnished to the Securities and Exchange Commission. We are not including information contained on or available through our website as a part of, or incorporating such information by reference into, this Annual Report on Form 10-K.
History and Acquisitions
Formation of Altra
Although Altra was incorporated in Delaware in 2004, much of our current business has its roots with the prior acquisition by Colfax Corporation, or Colfax, of the MPT (mechanical power transmission) group of Zurn Technologies, Inc. in December 1996. Colfax subsequently acquired Industrial Clutch Corp. in May 1997, Nuttall Gear Corp. in July 1997 and the Boston Gear and Delroyd Worm Gear brands in August 1997 as part of Colfax’s acquisition of Imo Industries, Inc. In February 2000, Colfax acquired Warner Electric, Inc., which sold products under the Warner Electric, Formsprag Clutch, Stieber, and Wichita Clutch brands. Colfax formed Power Transmission Holding, LLC or “PTH” in June 2004 to serve as a holding company for all of these power transmission businesses. Boston Gear was established in 1877, Warner Electric, Inc. in 1927, and Wichita Clutch in 1949.
On November 30, 2004, we acquired our original core business through the acquisition of PTH from Colfax. We refer to this transaction as the PTH Acquisition.
On October 22, 2004, The Kilian Company, or Kilian, a company formed at the direction of Genstar Capital, then the largest stockholder of Altra, acquired Kilian Manufacturing Corporation from Timken U.S. Corporation. At the completion of the PTH Acquisition, (i) all of the outstanding shares of Kilian capital stock were exchanged for shares of our capital stock and (ii) Kilian and its subsidiaries were transferred to our former wholly owned subsidiary Altra Power Transmission, Inc.
Recent Acquisitions and Transactions
On November 22, 2013, we changed our legal corporate name from Altra Holdings, Inc. to Altra Industrial Motion Corp.
3
On December 17, 2013, we acquired all of the issued and outstanding shares of Svendborg Brakes A/S and S.B. Patent Holding ApS (together “Svendborg”). Svendborg is a leading global manufacturer of premium quality caliper brakes.
On July 1, 2014, we acquired all of the issued and outstanding shares of Guardian Ind., Inc., now known as Guardian Couplings LLC or Guardian Couplings. Guardian Couplings is a manufacturer and supplier of flywheel, motion control and general industrial couplings.
On December 31, 2014, Altra Power Transmission, Inc., our former wholly owned subsidiary, was merged into Altra Industrial Motion Corp.
On December 30, 2016, we acquired the shares and certain assets and liabilities of the Stromag business from GKN plc. Stromag is a leading global manufacturer of highly engineered clutches and brakes, couplings, and limit switches for use in a variety of end markets including energy, metals and material handling. We refer to this transaction as the Stromag Acquisition.
Our Industry
Based on industry data supplied by the Power Transmission Distributors Association in collaboration with Industrial Market Information, we estimate that global industrial power transmission products generated sales of approximately $159 billion in 2017. These products are used to generate, transmit, control and transform mechanical energy. The industrial power transmission industry can be divided into three areas: MPT products; motors and generators; and adjustable speed drives. We compete primarily in the MPT area which, based on industry data, we estimate was a $94 billion global market in 2017.
The global MPT market is highly fragmented, with over 1,000 small manufacturers. While smaller companies tend to focus on regional niche markets with narrow product lines, larger companies that generate annual sales of over $100 million generally offer a much broader range of products and have global capabilities. Buyers of MPT products are broadly diversified across many sectors of the economy and typically place a premium on factors such as quality, reliability, availability, and design and application engineering support. We believe the most successful industry participants are those that leverage their distribution network, their products’ reputations for quality and reliability and their service and technical support capabilities to maintain attractive margins on products and gain market share.
Company Goals and Operational Excellence
Operational Excellence is our comprehensive business management system designed to achieve world class performance. It reflects our quest to improve the flow of value to our customers with the goal of securing long-term growth and prosperity for our company, our employees and our partners. Operational Excellence applies to every function and every aspect of how we do business.
We are committed to driving shareholder return by leveraging Operational Excellence to achieve superior organic growth and operating margins, creating a market-focused culture that drives growth through innovation and maintaining a disciplined approach to acquisitions.
Our Business Strategy
With a strong long-term focus on Operational Excellence, organic growth and strategic acquisitions, we strive to create superior value for our customers, stockholders and associates. We seek to achieve this vision through the following strategies:
Capitalize on Operational Excellence to Drive Margin Expansion and Organic Growth. We believe we can continue to improve profitability through cost control, overhead rationalization, global process optimization, continued implementation of lean manufacturing techniques and strategic pricing initiatives. Our operating plan, based on manufacturing centers of excellence, provides additional opportunities to consolidate purchasing processes and reduce costs by sharing best practices across geographies and business lines.
Collaborate with Customers to Create New Opportunities. We focus on aggressively developing new products across our business in response to customer needs in various markets. Our extensive application-engineering know-how drives both new and repeat sales and we have an established history of innovation with over 200 granted patents and pending patent applications worldwide. In total, new products developed by us during the past three years generated approximately $54.3 million in revenues during 2017.
4
Capturing the Benefits of Common Ownership. We foster the sharing of best practices throughout the organization. We challenge our businesses to work together to identify cross-selling opportunities to increase customer and distributor penetration as well as to expand into new markets and geographic regions. The realignment of our three divisions further enables these initiatives. Leveraging our global buying power, our businesses work together to identify cost saving opportunities and to improve supply chain management. Utilizing our common ERP system, we have implemented a shared services structure that supports all of our business units in the United States and Canada. This allows our businesses to receive the benefits of expanded customer service, cohesive marketing services and consolidated accounting functions, which will increase efficiency and help to reduce cost.
Selectively Pursue Strategic Acquisitions that Complement Our Strong Platform. We have a successful track record of identifying, acquiring and integrating acquisitions. We believe that in the future there may be a number of attractive potential acquisition candidates, in part due to the fragmented nature of the industries we serve. We plan to continue our disciplined pursuit of strategic acquisitions to strengthen our product portfolio, enhance our industry leadership, leverage fixed costs, expand our global footprint, and create value in products and markets that we know and understand.
Focus on Key Niche End Markets to Increase Organic Growth. We emphasize strategic marketing to focus on new growth opportunities in key end-user and OEM markets. Through a systematic process that leverages our core brands and products, we seek to identify attractive markets and product niches, collect customer and market data, identify market drivers, tailor product and service solutions to specific market and customer requirements, and deploy resources to gain market share and drive future sales growth.
Disciplined Capital Allocation. We expect that our businesses typically will generate annual free cash flow. We are focused on the most efficient allocation of our capital to maximize investment returns. To do this, we grow and support our existing businesses through annual investment in capital spending with a focus on internal projects to expand markets, develop products, and boost productivity. We continue to evaluate our portfolio for strategic fit and intend to make additional strategic acquisitions focused on our key markets. We have consistently provided shareholder returns by paying regular dividends, which have increased by 300% since being introduced during the quarter ended March 31, 2012. During the quarter ended June 30, 2014, we initiated purchases under our $50 million share repurchase program, the (“2014 Repurchase Program”), and we repurchased approximately $34.9 million of Altra common stock under the 2014 Repurchase Program prior to its termination in October 2016. On October 19, 2016, our board of directors approved a new share repurchase program authorizing the buyback of up to $30.0 million of the Company's common stock through December 31, 2019. This plan replaced the previous 2014 Repurchase Program which was terminated. No shares were purchased in 2017.
Our Strengths
Operational Excellence. We benefit from an established culture of lean management emphasizing quality, delivery and cost control through our Operational Excellence program. Operational Excellence is at the core of our performance-driven culture and drives both our strategic development and operational improvements. We continually evaluate every aspect of our business to identify possible productivity improvements and cost savings.
Leading Market Shares and Brand Names. We believe we hold the number one or number two market position in key products across many of our core platforms. In addition, we believe we have recently captured additional market share in several product lines due to our innovative product development efforts and exceptional customer service and product delivery.
Customized, Engineered Products Serving Niche Markets. We employ over 330 non-manufacturing engineers involved with product design, research and development, testing and technical customer support, and we often participate in lengthy design and qualification processes with our customers. Many of our product lines involve a large number of unique parts, are delivered in small order quantities with short lead times, and require varying levels of technical support and responsive customer service. As a result of these characteristics, as well as the essential nature of our products to the efficient operations of our customers, we generate a significant amount of recurring sales with repeat customers.
Aftermarket Sales Supported by Large Installed Base. On average, our brands have been in operation for over 85 years and we believe we benefit from one of the largest installed customer bases in the industry. The moving, wearing nature of our products necessitates regular replacement and our large installed base of products generates significant aftermarket replacement demand. This has created a recurring revenue stream from a diversified group of end-user customers. For 2017, we estimate that approximately 38% of our revenues were derived from aftermarket sales.
Diversified End Markets. Our revenue base has a balanced exposure across a diverse mix of end-user industries, including energy, food processing, general industrial, material handling, mining, transportation, and turf and garden. We believe our diversified end markets insulate us from volatility in any single industry or type of end-user. In 2017, no single industry represented more than
5
9% of our total sales. We are geographically diversified with approximately 49% of our sales coming from outside North America during 2017.
Strong Relationships with Distributors and OEMs. We have over 1,000 direct OEM customers and enjoy established, long-term relationships with the leading industrial MPT distributors, critical factors that contribute to our high base of recurring aftermarket revenues. We sell our products through more than 3,000 distributor outlets worldwide. We believe our scale, expansive product lines and end-user preference for our products make our product portfolio attractive to both large and multi-branch distributors, as well as regional and independent distributors in our industry.
Experienced, High-Caliber Management Team. We are led by a highly experienced management team with over 250 years of cumulative industrial business experience and an average of over 15 years with our companies. Our CEO, Carl Christenson, has over 30 years of experience in the MPT industry, while our CFO, Christian Storch, has more than 25 years of experience. Our management team has established a proven track record of execution, successfully completing and integrating several major strategic acquisitions and delivering significant growth and profitability.
Business Segments
We operate three business segments that are aligned by our product offerings:
Couplings, Clutches and Brakes business segment
Couplings. Couplings are the interface between two shafts, which enable power to be transmitted from one shaft to the other. Because shafts are often misaligned, we design our couplings with a measure of flexibility that accommodates various degrees of misalignment. Altra manufactures a diverse variety of couplings suitable for many industrial and specialty applications. Our various coupling products include: gear couplings, high performance diaphragm and disc couplings, elastomeric couplings, miniature and precision couplings, as well as universal joints, mill spindles and shaft locking devices. These products are sold into many different markets, including: food processing, oil and gas, power generation, material handling, medical, metals, mining, and mobile off-highway. Our couplings are primarily manufactured under the Ameridrives, Bibby, Lamiflex, TB Wood’s, Huco Dynatork, Guardian and Stromag brands in our facilities in Indiana, Pennsylvania, Texas, Brazil, the United Kingdom, Germany, China and Mexico.
Clutches and Brakes. Primarily utilized in heavy duty industrial, mining and energy applications, clutches are devices which use mechanical, magnetic, hydraulic, pneumatic, or friction type connections to facilitate engaging or disengaging two rotating members. Brakes are combinations of interacting parts that work to slow or stop machinery. We manufacture a variety of clutches and brakes in two main product categories: heavy duty and overrunning. Our core clutch and brake manufacturing facilities are located in Michigan, Texas, Denmark, Germany, France, the United Kingdom, Brazil, India and China.
|
|
• |
Heavy Duty Clutches and Brakes. Our heavy duty clutch and brake product lines serve various markets including metal forming, off-shore and land-based oil and gas drilling platforms, mining, material handling, marine, wind turbine applications and various off-highway and construction equipment segments. Our line of heavy duty pneumatic, hydraulic and caliper clutches and brakes are marketed under the Wichita Clutch, Twiflex, Industrial Clutch, Svendborg Brakes and Stromag brand names. |
|
|
• |
Overrunning Clutches. Products include overrunning, indexing and backstopping clutches which are generally used as a mechanical means of prohibiting a shaft’s rotation in one direction while enabling its rotation in the opposite direction. Primary industrial applications include conveyors, gear reducers, hoists and cranes, mining machinery, machine tools, paper machinery, and other specialty machinery. We also sell our overrunning clutch products into the aerospace and defense market for fixed and rotary wing aircraft. We market and sell these products under the Formsprag, Marland, and Stieber brand names. |
Engineered Belted Drives. Belted drives incorporate both a rubber-based belt and at least two sheaves or synchronous sprockets. Belted drives typically change the speed of an electric motor or engine to the level required for a particular piece of equipment. Our belted drive line includes three types of v-belts, three types of synchronous belts, standard and made-to-order sheaves and synchronous sprockets, and split taper bushings. We sell belted drives to a wide range of end markets, including aggregate, energy, chemical and material handling. Our engineered belted drives are primarily manufactured under the TB Wood’s brand in our facilities in Pennsylvania and Mexico.
6
Electromagnetic Clutches and Brakes business segment
Products in this segment include brakes and clutches that are used to electronically slow, stop, engage or disengage equipment utilizing electromagnetic friction type connections. Our industrial products include clutches and brakes with specially designed controls for material handling, forklift, elevator, medical mobility, mobile off-highway, baggage handling and plant productivity applications. We also offer a line of clutch and brake products for walk-behind mowers, residential lawn tractors and commercial mowers. While industrial applications are predominant, we also manufacture products for several niche vehicular applications including on-road refrigeration compressor clutches and agricultural equipment clutches. We market our electromagnetic products under the Warner Electric, Inertia Dynamics, Matrix and Stromag brand names. Our core electromagnetic clutches and brakes manufacturing facilities are located in Connecticut, Indiana, France, Germany, the United Kingdom and China.
Gearing business segment
Gearing. Gears reduce the output speed and increase the torque of an electric motor or engine to the level required to drive a particular piece of equipment. These products are used in various industrial, material handling, mixing, transportation and food processing applications. Specific product lines include vertical and horizontal gear drives, speed reducers and increasers, high-speed compressor drives, enclosed custom gear drives, various enclosed gear drive and gear motor configurations and open gearing products such as spur, helical, worm and miter/bevel gears. We design and manufacture a broad range of gearing and gear motor products under the Boston Gear, Nuttall Gear, Delroyd, and Bauer Gear Motor brand names. We manufacture our gearing products at our facilities in New York, North Carolina, Germany, Slovakia, and China, and sell to a wide variety of end markets.
Engineered Bearing Assemblies. Bearings are components that support, guide and reduce friction of motion between fixed and moving machine parts. Our engineered bearing assembly product line includes ball bearings, roller bearings, thrust bearings, track rollers, stainless steel bearings, polymer assemblies, housed units and custom assemblies. We manufacture a broad range of engineered bearing products under the Kilian brand name. We sell bearing products to a wide range of end industries, including the general industrial and automotive markets, with a particularly strong OEM customer focus. We manufacture our bearing products at our facilities in New York and Canada.
See Note 15 to the consolidated financial statements for financial information about our segments and geographic areas.
Research and Development and Product Engineering
We closely integrate new product development with marketing, manufacturing and product engineering in meeting the needs of our customers. We have product engineering teams that work to enhance our existing products and develop new product applications for our growing base of customers that require custom solutions. We believe these capabilities provide a significant competitive advantage in the development of high quality industrial power transmission products. Our product engineering teams focus on:
|
|
• |
lowering the cost of manufacturing our existing products; |
|
|
• |
redesigning existing product lines to increase their efficiency or enhance their performance; and |
|
|
• |
developing new product applications. |
Our continued investment in new product development is intended to help drive customer growth as we address key customer needs. We spend approximately 2.0% - 3.0% of net sales on our annual research and development efforts.
Sales and Marketing
We sell our products in over 70 countries to over 1,000 direct OEM customers and over 3,000 distributor outlets. We offer our products through our direct sales force comprised of approximately 230 company-employed sales associates as well as independent sales representatives. Our worldwide sales and distribution presence enables us to provide timely and responsive support and service to our customers, many of which operate globally, and to capitalize on growth opportunities in both developed and emerging markets around the world. While the Company did not have any individual customers that represented total sales of greater than 10.0%, the Gearing business segment had one customer that approximated 11.3% of total sales for the segment during the year ended December 31, 2017.
We employ an integrated sales and marketing strategy concentrated on both key industries and individual product lines. We believe this dual vertical market and horizontal product approach distinguishes us in the marketplace allowing us to quickly identify trends and customer growth opportunities and deploy resources accordingly. Within our key industries, we market to OEMs, encouraging them to incorporate our products into their equipment designs, to distributors and to end-users, helping to foster brand
7
preference. With this strategy, we are able to leverage our industry experience and product breadth to sell MPT and motion control solutions for a host of industrial applications.
Distribution
Our MPT components are either incorporated into end products sold by OEMs or sold through industrial distributors as aftermarket products to end users and smaller OEMs. We operate a geographically diversified business. For the year ended December 31, 2017, we derived approximately 51% of our net sales from customers in North America, 35% from customers in Europe and 14% from customers in Asia and the rest of the world. Our global customer base is served by an extensive global sales network comprised of our sales staff as well as our network of over 3,000 distributor outlets.
Rather than serving as passive conduits for delivery of product, our industrial distributors are active participants in influencing product purchasing decisions in the MPT industry. In addition, distributors play a critical role through stocking inventory of our products, which amplifies the accessibility of our products to aftermarket buyers. It is for this reason that distributor partner relationships are so critical to the success of the business. We enjoy strong established relationships with the leading distributors as well as a broad, diversified base of specialty and regional distributors.
Competition
We operate in highly fragmented and very competitive markets within the MPT market. Some of our competitors have achieved substantially more market penetration in certain of the markets in which we operate, such as helical gear drives, and some of our competitors are larger than us and have greater financial and other resources. In particular, we compete with Rexnord Corporation and Regal-Beloit Corporation. In addition, with respect to certain of our products, we compete with divisions of our OEM customers. Competition in our business lines is based on a number of considerations including quality, reliability, pricing, availability and design and application engineering support. Our customers increasingly demand a broad product range and we must continue to develop our expertise in order to manufacture and market these products successfully. To remain competitive, regular investment in manufacturing, customer service and support, marketing, sales, research and development and intellectual property protection is required. We may have to adjust the prices of some of our products to stay competitive. In addition, some of our larger, more sophisticated customers are attempting to reduce the number of vendors from which they purchase in order to increase their efficiency. There is substantial and continuing pressure on major OEMs and larger distributors to reduce costs, including the cost of products purchased from outside suppliers such as us. As a result of cost pressures from our customers, our ability to compete depends in part on our ability to generate production cost savings and, in turn, find reliable, cost-effective outside component suppliers or manufacturers for our products. See “Risk Factors — Risks Related to our Business — We operate in the highly competitive mechanical power transmission industry and if we are not able to compete successfully our business may be significantly harmed.”
Intellectual Property
We rely on a combination of patents, trademarks, copyright, and trade secret laws in the United States and other jurisdictions, as well as employee and third-party non-disclosure agreements, license arrangements, and domain name registrations to protect our intellectual property. We sell our products under a number of registered and unregistered trademarks, which we believe are widely recognized in the MPT industry. With the exception of Boston Gear, Warner Electric, TB Wood’s, Svendborg, Bauer and Stromag we do not believe any single patent, trademark or trade name is material to our business as a whole. Any issued patents that cover our proprietary technology and any of our other intellectual property rights may not provide us with adequate protection or be commercially beneficial to us and, patents applied for, may not be issued. The issuance of a patent is not conclusive as to its validity or its enforceability. Competitors may also be able to design around our patents. If we are unable to protect our patented technologies, our competitors could commercialize technologies or products which are substantially similar to ours.
With respect to proprietary know-how, we rely on trade secret laws in the United States and other jurisdictions and on confidentiality agreements. Monitoring the unauthorized use of our technology is difficult and the steps we have taken may not prevent unauthorized use of our technology. The disclosure or misappropriation of our intellectual property could harm our ability to protect our rights and our competitive position.
Some of our registered and unregistered trademarks include: Warner Electric, Boston Gear, TB Wood’s, Kilian, Nuttall Gear, Ameridrives, Wichita Clutch, Formsprag, Bibby Transmissions, Stieber, Matrix, Inertia Dynamics, Twiflex, Industrial Clutch, Huco Dynatork, Marland, Delroyd, Warner Linear, Bauer Gear Motor, PowerFlex, Svendborg Brakes, Guardian Couplings, and Stromag.]
8
Employees
As of December 31, 2017, we had approximately 4,580 full-time employees, of whom approximately 43% were located in North America (primarily U.S.), 42% in Europe, and 15% in Asia and the rest of the world. Approximately 9% of our full-time factory U.S. employees are represented by labor unions. In addition, approximately 1,332 employees or 82% of our European employees are represented by labor unions or works councils. Approximately 45 employees in the Lamiflex production facilities in Brazil are represented by a works council. Additionally, approximately 79 employees in the TB Wood’s production facility in Mexico are unionized under a collective bargaining agreement that is subject to annual renewals.
We are a party to three U.S. collective bargaining agreements. The agreements will expire in February 2021, November 2019, and June 2020.
We are also party to a collective bargaining agreement with approximately 42 union employees at our Toronto, Canada manufacturing facility. That agreement will expire in July 2018.
One of the three U.S. collective bargaining agreements contains provisions for additional, potentially significant, lump-sum severance payments to all employees covered by that agreement who are terminated as the result of a plant closing and one of our collective bargaining agreements contains provisions restricting our ability to terminate or relocate operations. See “Risk Factors — Risks Related to Our Business — We may be subject to work stoppages at our facilities, or our customers may be subjected to work stoppages, which could seriously impact our operations and the profitability of our business.”
Our facilities in Europe and Brazil have employees who are generally represented by local or national social works councils. Social works councils meet with employer industry associations periodically to discuss employee wages and working conditions. Our facilities in Denmark, France, Germany, Slovakia, and Brazil often participate in such discussions and adhere to any agreements reached.
We obtain raw materials, component parts and supplies from a variety of sources, generally from more than one supplier. Our suppliers and sources of raw materials are based in both the United States and other countries and we believe that our sources of raw materials are adequate for our needs for the foreseeable future. We do not believe the loss of any one supplier would have a material adverse effect on our business or results of operations. Our principal raw materials are steel and copper. We generally purchase our materials on the open market, where certain commodities such as steel and copper have fluctuated in price significantly in recent years. We have not experienced any significant shortage of our key materials and have not historically engaged in hedging transactions for commodity suppliers.
Our ability, including manufacturing or distribution capabilities, and that of our suppliers, business partners and contract manufacturers, to make, move and sell products is critical to our success. Damage or disruption to our or their manufacturing or distribution capabilities due to weather, natural disaster, fire or explosion, terrorism, pandemics, strikes, repairs or enhancements at our facilities, excessive demand, raw material shortages, or other reasons, could impair our ability, and that of our suppliers, to manufacture or sell our products. Failure to take adequate steps to mitigate the likelihood or potential impact of such events, or to effectively manage such events if they occur, could adversely affect our business, financial condition and results of operations, as well as require additional resources to restore our supply chain.
Seasonality
We experience seasonality in our turf and garden business, which represented approximately 9% of our net sales in 2017. As our large OEM customers prepare for the spring season, our shipments generally start increasing in December, peak in February and March, and begin to decline in April and May. This allows our customers to have inventory in place for the peak consumer purchasing periods for turf and garden products. The June-through-November period is typically the low season for us and our customers in the turf and garden market. Seasonality can also be affected by weather and the level of housing starts.
Regulation
We are subject to a variety of government laws and regulations that apply to companies engaged in international operations. These include compliance with the Foreign Corrupt Practices Act, U.S. Department of Commerce export controls, local government regulations and procurement policies and practices (including regulations relating to import-export control, investments, exchange controls and repatriation of earnings). We maintain controls and procedures to comply with laws and regulations associated with our international operations. In the event we are unable to remain compliant with such laws and regulations, our business may be adversely affected.
9
Environmental and Health and Safety Matters
We are subject to a variety of federal, state, local, foreign and provincial environmental laws and regulations, including those governing health and safety requirements, the discharge of pollutants into the air or water, the management and disposal of hazardous substances and wastes and the responsibility to investigate and cleanup contaminated sites that are or were owned, leased, operated or used by us or our predecessors. Some of these laws and regulations require us to obtain permits, which contain terms and conditions that impose limitations on our ability to emit and discharge hazardous materials into the environment and periodically may be subject to modification, renewal and revocation by issuing authorities. Fines and penalties may be imposed for non-compliance with applicable environmental laws and regulations and the failure to have or to comply with the terms and conditions of required permits. From time to time, our operations may not be in full compliance with the terms and conditions of our permits. We periodically review our procedures and policies for compliance with environmental laws and requirements. We believe that our operations generally are in material compliance with applicable environmental laws and requirements and that any non-compliance would not be expected to result in us incurring material liability or cost to achieve compliance. Historically, our costs of achieving and maintaining compliance with environmental laws and requirements have not been material.
Certain environmental laws in the United States, such as the federal Superfund law and similar state laws, impose liability for the cost of investigation or remediation of contaminated sites upon the current or, in some cases, the former site owners or operators and upon parties who arranged for the disposal of wastes or transported or sent those wastes to an off-site facility for treatment or disposal, regardless of when the release of hazardous substances occurred or the lawfulness of the activities giving rise to the release. Such liability can be imposed without regard to fault and, under certain circumstances, can be joint and several, resulting in one party being held responsible for the entire obligation. As a practical matter, however, the costs of investigation and remediation generally are allocated among the viable responsible parties on some form of equitable basis. Liability also may include damages to natural resources. In addition, from time to time, we are notified that we are a potentially responsible party and may have liability in connection with off-site disposal facilities. To date, we have generally resolved matters involving off-site disposal facilities for a nominal sum although there can be no assurance that we will be able to resolve pending and future matters in a similar fashion.
Executive Officers of Registrant
The following sets forth certain information with regard to our executive officers as of February 23, 2018 (ages are as of December 31, 2017):
Carl R. Christenson (age 58) has been our Chief Executive Officer since January 2009, a director since July 2007 and Chairman of the Board since 2014. Prior to his current position, Mr. Christenson served as our President and Chief Operating Officer from January 2005 to December 2008. From 2001 to 2005, Mr. Christenson was the President of Kaydon Bearings, a manufacturer of custom-engineered bearings and a division of Kaydon Corporation. Prior to joining Kaydon, Mr. Christenson held a number of management positions at TB Wood’s Incorporated and several positions at the Torrington Company. Mr. Christenson holds a M.S. and B.S. degree in Mechanical Engineering from the University of Massachusetts and an M.B.A. from Rensselaer Polytechnic.
Christian Storch (age 58) has been our Chief Financial Officer since December 2007. From 2001 to 2007, Mr. Storch was the Vice President and Chief Financial Officer at Standex International Corporation. Mr. Storch also served on the Board of Directors of Standex International from October 2004 to December 2007. Mr. Storch also served as Standex International’s Treasurer from 2003 to April 2006 and Manager of Corporate Audit and Assurance Services from July 1999 to 2001. Prior to Standex International, Mr. Storch was a Divisional Financial Director and Corporate Controller at Vossloh AG, a publicly held German transport technology company. Mr. Storch has also previously served as an Audit Manager with Deloitte & Touche, LLP. Mr. Storch holds a degree in business administration from the University of Passau, Germany.
Glenn Deegan (age 51) has been our Vice President, Legal and Human Resources, General Counsel and Secretary since June 2009. Prior to his current position, Mr. Deegan served as our General Counsel and Secretary since September 2008. From March 2007 to August 2008, Mr. Deegan served as Vice President, General Counsel and Secretary of Averion International Corp., a publicly held global provider of clinical research services. Prior to Averion, from June 2001 to March 2007, Mr. Deegan served as Director of Legal Affairs and then as Vice President, General Counsel and Secretary of MacroChem Corporation, a publicly held specialty pharmaceutical company. From 1999 to 2001, Mr. Deegan served as Assistant General Counsel of Summit Technology, Inc., a publicly held manufacturer of ophthalmic laser systems. Mr. Deegan previously spent over six years engaged in the private practice of law and also served as law clerk to the Honorable Francis J. Boyle in the United States District Court for the District of Rhode Island. Mr. Deegan holds a B.S. from Providence College and a J.D. from Boston College.
Gerald Ferris (age 68) has been our Vice President of Global Sales since May 2007 and held the same position with Power Transmission Holdings, LLC, our predecessor, since March 2002. He is responsible for the worldwide sales of our broad product
10
platform. Mr. Ferris joined our predecessor in 1978 and since joining has held various positions. He became the Vice President of Sales for Boston Gear in 1991. Mr. Ferris holds a B.A. degree in Political Science from Stonehill College.
Todd B. Patriacca (age 48) has been our Vice President of Finance, Corporate Controller and Treasurer since February 2010. Prior to his current position, Mr. Patriacca served as our Vice President of Finance, Corporate Controller and Assistant Treasurer since October 2008 and previous to that, as Vice President of Finance and Corporate Controller since May 2007 and as Corporate Controller since May 2005. Prior to joining us, Mr. Patriacca was Corporate Finance Manager at MKS Instrument Inc., a publicly held semi-conductor equipment manufacturer since March 2002. Prior to MKS, Mr. Patriacca spent over ten years at Arthur Andersen LLP in the Assurance Advisory practice. Mr. Patriacca is a Certified Public Accountant and holds a B.A. in History from Colby College and an M.B.A. and an M.S. in Accounting from Northeastern University.
Craig Schuele (age 54) has been our Vice President of Marketing and Business Development since May 2007 and held the same position with our predecessor since July 2004. He is responsible for global marketing as well as coordinating Altra’s merger and acquisition activity. Prior to his current position, Mr. Schuele has been Vice President of Marketing since March 2002, and previous to that he was a Director of Marketing. Mr. Schuele joined our predecessor in 1986 and holds a B.S. degree in Management from Rhode Island College.
Risks Related to Our Business
We operate in the highly competitive mechanical power transmission industry and if we are not able to compete successfully our business may be significantly harmed.
We operate in highly fragmented and very competitive markets in the MPT industry. Some of our competitors have achieved substantially more market penetration in certain of the markets in which we operate, such as helical gear drives, and some of our competitors are larger than us and have greater financial and other resources. With respect to certain of our products, we compete with divisions of our OEM customers. Competition in our business lines is based on a number of considerations, including quality, reliability, pricing, availability, and design and application engineering support. Our customers increasingly demand a broad product range and we must continue to develop our expertise in order to manufacture and market these products successfully. To remain competitive, regular investment in manufacturing, customer service and support, marketing, sales, research and development and intellectual property protection is required. In the future we may not have sufficient resources to continue to make such investments and may not be able to maintain our competitive position within each of the markets we serve. We may have to adjust the prices of some of our products to stay competitive.
Additionally, some of our larger, more sophisticated customers are attempting to reduce the number of vendors from which they purchase in order to increase their efficiency. If we are not selected to become one of these preferred providers, we may lose market share in some of the markets in which we compete.
There is substantial and continuing pressure on major OEMs and larger distributors to reduce costs, including the cost of products purchased from outside suppliers. As a result of cost pressures from our customers, our ability to compete depends in part on our ability to generate production cost savings and, in turn, to find reliable, cost effective outside suppliers to source components or manufacture our products. If we are unable to generate sufficient cost savings in the future to offset price reductions, then our gross margin could be materially adversely affected.
General economic changes in or the cyclical nature of our markets could harm our operations and financial performance.
Global economic and financial market conditions have been weak and/or volatile in recent years, and those conditions have adversely affected our business operations and are expected to continue to adversely affect our business. A weakening of current conditions or a future downturn may adversely affect our future results of operations and financial condition. Weak, challenging or volatile economic conditions in the end-markets, businesses or geographic areas in which we sell our products could reduce demand for products and result in a decrease in sales volume for a prolonged period of time, which would have a negative impact on our future results of operations.
Our financial performance depends, in large part, on conditions in the markets that we serve and on the U.S. and global economies in general. Some of the markets we serve are highly cyclical, such as the metals, mining, industrial equipment and energy markets, including oil and gas. In such an environment, expected cyclical activity or sales may not occur or may be delayed and may result in significant quarter-to-quarter variability in our performance. Any sustained weakness in demand, downturn or uncertainty in cyclical markets may reduce our sales and profitability.
11
We rely on independent distributors and the loss of these distributors could adversely affect our business.
In addition to our direct sales force and manufacturer sales representatives, we depend on the services of independent distributors to sell our products and provide service and aftermarket support to our customers. We support an extensive distribution network, with over 3,000 distributor locations worldwide. During the year ended December 31, 2017, approximately 26% of our net sales from continuing operations were generated through independent distributors. In particular, sales through our largest distributor accounted for approximately 6% of our net sales for the year ended December 31, 2017. Almost all of the distributors with whom we transact business offer competitive products and services to our customers. In addition, the distribution agreements we have are typically non-exclusive and cancelable by the distributor after a short notice period. The loss of any major distributor or a substantial number of smaller distributors or an increase in the distributors’ sales of our competitors’ products to our customers could materially reduce our sales and profits.
We must continue to invest in new technologies and manufacturing techniques; however, our ability to develop or adapt to changing technology and manufacturing techniques is uncertain and our failure to do so could place us at a competitive disadvantage.
The successful implementation of our business strategy requires us to invest continuously in new technologies and manufacturing techniques to evolve our existing products and introduce new products to meet our customers’ needs in the industries we serve and want to serve. For example, motion control products offer more precise positioning and control compared to industrial clutches and brakes. If manufacturing processes are developed to make motion control products more price competitive and less complicated to operate, our customers may decrease their purchases of MPT products.
Our products are characterized by performance and specification requirements that mandate a high degree of manufacturing and engineering expertise. We believe that our customers rigorously evaluate their suppliers on the basis of a number of factors, including:
|
|
• |
product quality and availability; |
|
|
• |
price competitiveness; |
|
|
• |
technical expertise and development capability; |
|
|
• |
reliability and timeliness of delivery; |
|
|
• |
product design capability; |
|
|
• |
manufacturing expertise; and |
|
|
• |
sales support and customer service. |
Our success depends on our ability to invest in new technologies and manufacturing techniques to continue to meet our customers’ changing demands with respect to the above factors. We may not be able to make required capital expenditures and, even if we do so, we may be unsuccessful in addressing technological advances or introducing new products necessary to remain competitive within our markets. Furthermore, our own technological developments may not be able to produce a sustainable competitive advantage. If we fail to invest successfully in improvements to our technology and manufacturing techniques, our business may be materially adversely affected.
Our operations are subject to international risks that could affect our operating results.
Our net sales outside North America represented approximately 49% of our total net sales for the year ended December 31, 2017. In addition, we sell products to domestic customers for use in their products sold overseas. We also source a significant portion of our products and materials from overseas. Our financial performance has been, and is expected to continue to be, adversely impacted by foreign currency exchange rates. Our business is subject to risks associated with doing business internationally, and our future results could be materially adversely affected by a variety of factors, including:
|
|
• |
fluctuations in currency exchange rates; |
|
|
• |
exchange rate controls; |
|
|
• |
tariffs or other trade protection measures and import or export licensing requirements; |
|
|
• |
potentially negative consequences from changes in tax laws; |
|
|
• |
interest rates; |
|
|
• |
unexpected changes in regulatory requirements; |
12
|
|
• |
changes in foreign intellectual property law; |
|
|
• |
differing labor regulations; |
|
|
• |
requirements relating to withholding taxes on remittances and other payments by subsidiaries; |
|
|
• |
restrictions on our ability to own or operate subsidiaries, make investments or acquire new businesses in various jurisdictions; |
|
|
• |
potential political instability and the actions of foreign governments; and |
|
|
• |
restrictions on our ability to repatriate dividends from our subsidiaries. |
In addition, our international operations are governed by various U.S. laws and regulations, including the Foreign Corrupt Practices Act and other similar laws that prohibit us and our business partners from making improper payments or offers of payment to foreign governments and their officials and political parties for the purpose of obtaining or retaining business. Any alleged or actual violations of these regulations may subject us to government scrutiny, severe criminal or civil sanctions and other liabilities.
As we continue to expand our business globally, our success will depend, in large part, on our ability to anticipate and effectively manage these and other risks associated with our international operations. However, any of these factors could materially adversely affect our international operations and, consequently, our operating results.
Our operations depend on commercial activities and production facilities throughout the world, many of which may be located in jurisdictions that are subject to increased risks of disrupted production or commercial activities causing delays in shipments and loss of customers and revenue.
We operate businesses with manufacturing facilities worldwide, many of which are located outside the United States including in Brazil, Canada, China, Denmark, France, Germany, India, Mexico, Russia, Slovakia, and the United Kingdom. Serving a global customer base requires that we place production in emerging markets to capitalize on market opportunities and cost efficiencies. Our international production facilities and operations and commercial activities could be disrupted by currency fluctuations and devaluation, capital and currency exchange controls, low or negative economic growth rates, natural disaster, labor strike, military activity or war, political unrest, terrorist activity, or public health concerns, particularly in emerging countries that are not well-equipped to handle such occurrences. Any such disruptions could materially adversely affect our business.
We rely on estimated forecasts of our OEM customers’ needs, and inaccuracies in such forecasts could materially adversely affect our business.
We generally sell our products pursuant to individual purchase orders instead of under long-term purchase commitments. Therefore, we rely on estimated demand forecasts, based upon input from our customers, to determine how much material to purchase and product to manufacture. Because our sales are based on purchase orders, our customers may cancel, delay or otherwise modify their purchase commitments with little or no consequence to them and with little or no notice to us. For these reasons, we generally have limited visibility regarding our customers’ actual product needs. The quantities or timing required by our customers for our products could vary significantly. Whether in response to changes affecting the industry or a customer’s specific business pressures, any cancellation, delay or other modification in our customers’ orders could significantly reduce our revenue, impact our working capital, cause our operating results to fluctuate from period to period and make it more difficult for us to predict our revenue. In the event of a cancellation or reduction of an order, we may not have enough time to reduce operating expenses to minimize the effect of the lost revenue on our business and we may purchase too much inventory and spend more capital than expected, which may materially adversely affect our business.
From time to time, our customers may experience deterioration of their businesses. In addition, during periods of economic difficulty, our customers may not be able to accurately estimate demand forecasts and may scale back orders in an abundance of caution. As a result, existing or potential customers may delay or cancel plans to purchase our products and may not be able to fulfill their obligations to us in a timely fashion. Such cancellations, reductions or inability to fulfill obligations could significantly reduce our revenue, impact our working capital, cause our operating results to fluctuate adversely from period to period and make it more difficult for us to predict our revenue.
Our inability to efficiently utilize or re-negotiate minimum purchase requirements in certain supply agreements could decrease our profitability.
Our ability to maintain and expand our business depends, in part, on our ability to continue to obtain raw materials and component parts on favorable terms from various suppliers. Agreements with some of our suppliers contain minimum purchase
13
requirements. We can give no assurance that we will be able to utilize the minimum amount of raw materials or component parts that we are required to purchase under certain supply agreements which contain minimum purchase requirements. If we are required to purchase more raw materials or component parts than we are able to utilize in the operation of our business, the costs of providing our products would likely increase, which could decrease our profitability and have a material adverse effect on our business, financial condition and results of operations.
Disruption of our supply chain could have an adverse effect on our business, financial condition and results of operations.
Our ability, including manufacturing or distribution capabilities, and that of our suppliers, business partners and contract manufacturers, to make, move and sell products is critical to our success. Damage or disruption to our or their manufacturing or distribution capabilities due to weather, natural disaster, fire or explosion, terrorism, pandemics, strikes, repairs or enhancements at our facilities, excessive demand, raw material shortages, or other reasons, could impair our ability, and that of our suppliers, to manufacture or sell our products. Failure to take adequate steps to mitigate the likelihood or potential impact of such events, or to effectively manage such events if they occur, could adversely affect our business, financial condition and results of operations, as well as require additional resources to restore our supply chain.
The materials used to produce our products are subject to price fluctuations that could increase costs of production and adversely affect our profitability.
The materials used to produce our products, especially copper and steel, are sourced on a global or regional basis and the prices of those materials are susceptible to price fluctuations due to supply and demand trends, transportation costs, government regulations and tariffs, changes in currency exchange rates, price controls, the economic climate and other unforeseen circumstances. If we are unable to continue to pass a substantial portion of such price increases on to our customers on a timely basis, our future profitability may be materially adversely affected. In addition, passing through these costs to our customers may also limit our ability to increase our prices in the future.
We face potential product liability claims relating to products we manufacture or distribute, which could result in our having to expend significant time and expense to defend these claims and to pay material damages or settlement amounts.
We face a business risk of exposure to product liability claims in the event that the use of our products is alleged to have resulted in injury or other adverse effects. We currently have several product liability claims against us with respect to our products. We may not be able to obtain product liability insurance on acceptable terms in the future, if at all, or obtain insurance that will provide adequate coverage against potential claims. Product liability claims can be expensive to defend and can divert the attention of management and other personnel for long periods of time, regardless of the ultimate outcome. An unsuccessful product liability defense could exceed any insurance that we maintain and could have a material adverse effect on our business, financial condition, results of operations or our ability to make payments under our debt obligations when due. In addition, we believe our business depends on the strong brand reputation we have developed. In the event that our reputation is damaged, we may face difficulty in maintaining our pricing positions with respect to some of our products, which would reduce our sales and profitability.
We also risk exposure to product liability claims in connection with products sold by businesses that we acquire. We cannot assure you that third parties that have retained responsibility for product liabilities relating to products manufactured or sold prior to our acquisition of the relevant business or persons from whom we have acquired a business that are required to indemnify us for certain product liability claims subject to certain caps or limitations on indemnification will in fact satisfy their obligations to us with respect to liabilities retained by them or their indemnification obligations. If those third parties become unable to or otherwise do not comply with their respective obligations including indemnity obligations, or if certain product liability claims for which we are obligated were not retained by third parties or are not subject to these indemnities, we could become subject to significant liabilities or other adverse consequences. Moreover, even in cases where third parties retain responsibility for product liabilities or are required to indemnify us, significant claims arising from products that we have acquired could have a material adverse effect on our ability to realize the benefits from an acquisition, could result in our reducing the value of goodwill that we have recorded in connection with an acquisition, or could otherwise have a material adverse effect on our business, financial condition, or operations.
We may be subject to litigation for a variety of claims, which could adversely affect our business, financial condition or results of operations.
In addition to product liability claims and securities class action litigation, which has often been brought against a company following a decline in the market price of its securities, we and our directors and officers may be subject to claims arising from our normal business activities. These may include claims, suits, and proceedings involving stockholder and fiduciary matters, intellectual property, labor and employment, wage and hour, commercial and other matters. The outcome of any litigation, regardless of its merits, is inherently uncertain. Any claims and lawsuits, and the disposition of such claims and lawsuits, could be time-consuming
14
and expensive to resolve, divert management attention and resources, and lead to attempts on the part of other parties to pursue similar claims. Any adverse determination related to litigation or settlement or other resolution of a legal matter could adversely affect our business, financial condition or results of operations, harm our reputation or otherwise negatively impact our business.
We may be subject to work stoppages at our facilities, or our customers may be subjected to work stoppages, which could seriously impact our operations and the profitability of our business.
As of December 31, 2017, we had approximately 4,580 full-time employees, of whom approximately 43% were located in North America (primarily U.S.), 42% in Europe, and 15% in Asia and the rest of the world. Approximately 9% of our full-time factory U.S. employees are represented by labor unions. In addition, approximately 1,332 employees or 82% of our European employees are represented by labor unions or works councils. Approximately 45 employees in the Lamiflex production facilities in Brazil are represented by a works council. Additionally, approximately 79 employees in the TB Wood’s production facility in Mexico are unionized under a collective bargaining agreement that is subject to annual renewals.
We are a party to three U.S. collective bargaining agreements. The agreements will expire in February 2021. November 2019, and June 2020. We are also party to a collective bargaining agreement with approximately 42 union employees at our Toronto, Canada manufacturing facility. That agreement will expire in July 2018. We may be unable to renew these agreements on terms that are satisfactory to us, if at all.
One of the three U.S. collective bargaining agreements contains provisions for additional, potentially significant, lump-sum severance payments to all employees covered by that agreement who are terminated as the result of a plant closing and one of our collective bargaining agreements contains provisions restricting our ability to terminate or relocate operations.
Our facilities in Europe and Brazil have employees who are generally represented by local or national social works councils. Social works councils meet with employer industry associations periodically to discuss employee wages and working conditions. Our facilities in Denmark, France, Germany, Slovakia, and Brazil often participate in such discussions and adhere to any agreements reached.
If our unionized workers or those represented by a works council were to engage in a strike, work stoppage or other slowdown in the future, we could experience a significant disruption of our operations. Such disruption could interfere with our ability to deliver products on a timely basis and could have other negative effects, including decreased productivity and increased labor costs. In addition, if a greater percentage of our work force becomes unionized, our business and financial results could be materially adversely affected. Many of our direct and indirect customers have unionized work forces. Strikes, work stoppages or slowdowns experienced by these customers or their suppliers could result in slowdowns or closures of assembly plants where our products are used and could cause cancellation of purchase orders with us or otherwise result in reduced revenues from these customers.
Changes in employment laws could increase our costs and may adversely affect our business.
Various federal, state and international labor laws govern our relationship with employees and affect operating costs. These laws include minimum wage requirements, overtime, unemployment tax rates, workers’ compensation rates paid, leaves of absence, mandated health and other benefits, and citizenship requirements. Significant additional government-imposed increases or new requirements in these areas could materially affect our business, financial condition, operating results or cash flow.
In the event our employee-related costs rise significantly, we may have to curtail the number of our employees or shut down certain manufacturing facilities. Any such actions would not only be costly but could also materially adversely affect our business.
We depend on the services of key executives, the loss of whom could materially harm our business.
Our senior executives are important to our success because they are instrumental in setting our strategic direction, operating our business, maintaining and expanding relationships with distributors, identifying, recruiting and training key personnel, identifying expansion opportunities and arranging necessary financing. Losing the services of any of these individuals could adversely affect our business until a suitable replacement could be found. We believe that our senior executives could not easily be replaced with executives of equal experience and capabilities but we cannot prevent our key executives from terminating their employment with us. We do not maintain key person life insurance policies on any of our executives.
If we lose certain of our key sales, marketing or engineering personnel, our business may be adversely affected.
Our success depends on our ability to recruit, retain and motivate highly skilled sales, marketing and engineering personnel. Competition for these persons in our industry is intense and we may not be able to successfully recruit, train or retain qualified
15
personnel. If we fail to retain and recruit the necessary personnel, our business and our ability to obtain new customers, develop new products and provide acceptable levels of customer service could suffer. If certain of these key personnel were to terminate their employment with us, we may experience difficulty replacing them, and our business could be harmed.
We are subject to environmental laws that could impose significant costs on us and the failure to comply with such laws could subject us to sanctions and material fines and expenses.
We are subject to a variety of federal, state, local, foreign and provincial environmental laws and regulations, including those governing the discharge of pollutants into the air or water, the management and disposal of hazardous substances and wastes and the responsibility to investigate and cleanup contaminated sites that are or were owned, leased, operated or used by us or our predecessors. Some of these laws and regulations require us to obtain permits, which contain terms and conditions that impose limitations on our ability to emit and discharge hazardous materials into the environment and periodically may be subject to modification, renewal and revocation by issuing authorities. Fines and penalties may be imposed for non-compliance with applicable environmental laws and regulations and the failure to have or to comply with the terms and conditions of required permits. From time to time, our operations may not be in full compliance with the terms and conditions of our permits. The operation of manufacturing plants entails risks related to compliance with environmental laws, requirements and permits, and a failure by us to comply with applicable environmental laws, regulations, or permits could result in civil or criminal fines, penalties, enforcement actions, third party claims for property damage and personal injury, requirements to clean up property or to pay for the costs of cleanup, or regulatory or judicial orders enjoining or curtailing operations or requiring corrective measures, including the installation of pollution control equipment or remedial actions. Moreover, if applicable environmental laws and regulations, or the interpretation or enforcement thereof, become more stringent in the future, we could incur capital or operating costs beyond those currently anticipated.
Certain environmental laws in the United States, such as the federal Superfund law and similar state laws, impose liability for the cost of investigation or remediation of contaminated sites upon the current or, in some cases, the former site owners or operators and upon parties who arranged for the disposal of wastes or transported or sent those wastes to an off-site facility for treatment or disposal, regardless of when the release of hazardous substances occurred or the lawfulness of the activities giving rise to the release. Such liability can be imposed without regard to fault and, under certain circumstances, can be joint and several, resulting in one party being held responsible for the entire obligation. As a practical matter, however, the costs of investigation and remediation generally are allocated among the viable responsible parties on some form of equitable basis. Liability also may include damages to natural resources. In addition, from time to time, we are notified that we are a potentially responsible party and may have liability in connection with off-site disposal facilities. There can be no assurance that we will be able to resolve pending and future matters relating to off-site disposal facilities at all or for nominal sums.
There is contamination at some of our current facilities, primarily related to historical operations at those sites, for which we could be liable for the investigation and remediation under certain environmental laws. The potential for contamination also exists at other of our current or former sites, based on historical uses of those sites. Our costs or liability in connection with potential contamination conditions at our facilities cannot be predicted at this time because the potential existence of contamination has not been investigated or not enough is known about the environmental conditions or likely remedial requirements. Currently, with respect to certain of our facilities, other parties with contractual liability are addressing or have plans or obligations to address those contamination conditions that may pose a material risk to human health, safety or the environment. In addition, there may be environmental conditions currently unknown to us relating to our prior, existing or future sites or operations or those of predecessor companies whose liabilities we may have assumed or acquired which could have a material adverse effect on our business.
We are being indemnified, or expect to be indemnified by third parties subject to certain caps or limitations on the indemnification, for certain environmental costs and liabilities associated with certain owned or operated sites. We cannot assure you that third parties who indemnify or who are expected to indemnify us for certain environmental costs and liabilities associated with certain owned or operated sites will in fact satisfy their indemnification obligations. If those third parties become unable to, or otherwise do not, comply with their respective indemnity obligations, or if certain contamination or other liability for which we are obligated is not subject to these indemnities, we could become subject to significant liabilities.
Our future success depends on our ability to integrate acquired companies and manage our growth effectively.
As part of our growth strategy, we have made and expect to continue to make, acquisitions. Our continued growth may depend on our ability to identify and acquire companies that complement or enhance our business on acceptable terms. We may not be able to identify or complete future acquisitions. In addition, our growth through acquisitions has placed, and will continue to place, significant demands on our management, operational and financial resources. Realization of the benefits of acquisitions often requires integration of some or all of the acquired companies’ sales and marketing, distribution, manufacturing, engineering, finance and administrative organizations. Integration of companies demands substantial attention from senior management and the management of the acquired
16
companies. We may not be able to integrate successfully our recent acquisitions, or any future acquisitions, operate these acquired companies profitably, or realize the potential benefits from these acquisitions.
The difficulties of integrating the operations of acquired businesses include, among others:
|
|
• |
failure to implement our business plan for the combined business; |
|
|
• |
unanticipated issues in integrating manufacturing, logistics, information, communications and other systems; |
|
|
• |
possible inconsistencies in standards, controls, procedures and policies, and compensation structures; |
|
|
• |
unanticipated changes in applicable laws and regulations; |
|
|
• |
failure to retain key employees; |
|
|
• |
failure to retain key customers; |
|
|
• |
the impact on our internal controls and compliance with the regulatory requirements under the Sarbanes-Oxley Act of 2002; and |
|
|
• |
unanticipated issues, expenses and liabilities. |
The market price of our common stock may decline as a result of acquisitions if, among other things, we are unable to achieve the expected growth in earnings, or if the operational cost savings estimates in connection with the integration of the acquired businesses are not realized, or if the transaction costs related to the acquisitions are greater than expected. The market price of our common stock also may decline if we do not achieve the perceived benefits of the acquisitions as rapidly or to the extent anticipated by financial or industry analysts or if the effect of the acquisitions on our financial results is not consistent with the expectations of financial or industry analysts.
We may not be able to protect our intellectual property rights, brands or technology effectively, which could allow competitors to duplicate or replicate our technology and could adversely affect our ability to compete.
We rely on a combination of patent, trademark, copyright, and trade secret laws in the United States and other jurisdictions, as well as on license, non-disclosure, employee and consultant assignment and other agreements and domain names registrations in order to protect our proprietary technology and rights. Applications for protection of our intellectual property rights may not be allowed, and the rights, if granted, may not be maintained. In addition, third parties may infringe or challenge our intellectual property rights. In some cases, we rely on unpatented proprietary technology. It is possible that others will independently develop the same or similar technology or otherwise obtain access to our unpatented technology. In addition, in the ordinary course of our operations, we pursue potential claims from time to time relating to the protection of certain products and intellectual property rights, including with respect to some of our more profitable products. Such claims could be time consuming, expensive and divert resources. If we are unable to maintain the proprietary nature of our technologies or proprietary protection of our brands, our ability to market or be competitive with respect to some or all of our products may be affected, which could reduce our sales and profitability.
We or our products could infringe on the intellectual property of others, which may cause us to engage in costly litigation and, if we are not successful, could cause us to pay substantial damages and prohibit us from selling our products.
Third parties may assert infringement or other intellectual property claims against us based on their patents or other intellectual property claims, and we may have to pay substantial damages, possibly including treble damages, if it is ultimately determined that our products infringe. We may have to obtain a license to sell our products if it is determined that our products infringe upon another party’s intellectual property. We might be prohibited from selling our products before we obtain a license, which, if available at all, may require us to pay substantial royalties. Even if infringement claims against us are without merit, defending these types of lawsuits takes significant time, may be expensive and may divert management attention from other business concerns.
Goodwill and indefinite-lived intangibles comprises a significant portion of our total assets, and if we determine that goodwill or indefinite-lived intangibles become impaired in the future, net income in such years may be materially and adversely affected.
Goodwill represents the excess of cost over the fair market value of net assets acquired in business combinations. Due to the acquisitions we have completed historically, goodwill comprises a significant portion of our total assets. In addition, indefinite lived intangibles, primarily tradenames and trademarks, comprise a significant portion of our total assets. We review goodwill and indefinite-lived intangibles annually for impairment and any excess in carrying value over the estimated fair value is charged to the results of operations. Future reviews of goodwill and indefinite lived intangibles could result in future reductions. Any reduction in net
17
income resulting from the write down or impairment of goodwill and indefinite-lived intangibles could adversely affect our financial results. If economic conditions deteriorate we may be required to impair goodwill and indefinite-lived intangibles in future periods.
Unplanned repairs or equipment outages could interrupt production and reduce income or cash flow.
Unplanned repairs or equipment outages, including those due to natural disasters, could result in the disruption of our manufacturing processes. Any interruption in our manufacturing processes would interrupt our production of products, reduce our income and cash flow and could result in a material adverse effect on our business and financial condition.
Our operations are highly dependent on information technology infrastructure and failures could significantly affect our business.
We depend heavily on our information technology, or IT, infrastructure in order to achieve our business objectives. If we experience a problem that impairs this infrastructure, such as a computer virus, a problem with the functioning of an important IT application, or an intentional disruption of our IT systems by a third party, the resulting disruptions could impede our ability to record or process orders, manufacture and ship in a timely manner, or otherwise carry on our business in the ordinary course. Any such events could cause us to lose customers or revenue and could require us to incur significant expense to eliminate these problems and address related security concerns.
Computer viruses, malware, and other “hacking” programs and devices (“hacking events”) expose us to risk of theft of assets including cash. Any such event could require us to incur significant expense to eliminate these problems and address related security concerns.
Hacking events may also cause significant damage, delays or interruptions to our systems and operations or to certain of the products that we sell resulting in damage to our reputation and brand names.
Additionally, hacking events may attack our infrastructure, industrial machinery, software, or hardware causing significant damage, delays or other service interruptions to our systems and operations. “Hacking” involves efforts to gain unauthorized access to information or systems or to cause intentional malfunctions, loss or corruption of data, software, hardware, or other computer equipment. In addition, increasingly sophisticated malware may target real-world infrastructure or product components, including certain of the products that we currently or may in the future sell by attacking, disrupting, reconfiguring and/or reprogramming industrial control software. Hacking events could result in significant damage to our infrastructure, industrial machinery, systems, or databases. We may incur significant costs to protect our systems and equipment against the threat of, and to repair any damage caused by, computer viruses and hacking events. Moreover, if hacking events affect our systems or products, our reputation and brand names could be materially damaged and use of our products may decrease.
If we are unable to successfully implement our ERP system across the Company or such implementation is delayed, our operations may be disrupted or become less efficient.
We are in the process of implementing a Enterprise Resource Planning system entitled “SAP” worldwide, with the aim of enabling management to achieve better control over the Company through: improved quality, reliability and timeliness of information; improved integration and visibility of information stemming from different management functions and countries; and optimization and global management of corporate processes. The adoption of the SAP system, which replaces the existing accounting and management systems, poses several challenges relating to, among other things, training of personnel, communication of new rules and procedures, changes in corporate culture, migration of data, and the potential instability of the new system. In order to mitigate the impact of such critical issues, the Company decided to implement the SAP system on a step-by-step basis, both geographically and in terms of processes. If the remaining implementation of the SAP system is delayed, in whole or in part, we would continue to use our current systems which may not be sufficient to support our planned operations and significant upgrades to the current systems may be warranted or required to meet our business needs pending SAP implementation. In addition, we rely on third-party vendors to provide long-term software maintenance support and hosting services for our information systems. Software vendors may decide to discontinue further development, integration or long-term software maintenance support for our information systems, which may increase our operational expense as well as disrupt the management of our business operations. In addition, we do not control the operation of any third party hosting facilities. These facilities are vulnerable to damage or interruption from natural disasters, fires, power loss, telecommunications failures and similar events. They are also subject to break-ins, computer viruses, sabotage, intentional acts of vandalism and other misconduct. The occurrence of any of these disasters or other unanticipated problems with our third party hosting vendors could disrupt the management of, and have a material adverse effect on, our business operations. However, there can be no assurance that the new SAP system will be successfully implemented and failure to do so could have a material adverse effect on the Company’s operations.
18
Our leverage could adversely affect our financial health and make us vulnerable to adverse economic and industry conditions.
As of December 31, 2017, we had approximately $262.9 million outstanding and $158.6 million available under our 2015 Revolving Credit Facility (as defined herein). Our indebtedness has important consequences; for example, it could:
|
|
• |
make it more challenging for us to obtain additional financing to fund our business strategy and acquisitions, debt service requirements, capital expenditures and working capital; |
|
|
• |
increase our vulnerability to interest rate changes and general adverse economic and industry conditions; |
|
|
• |
require us to dedicate a substantial portion of our cash flow from operations to service our indebtedness, thereby reducing the availability of our cash flow to finance acquisitions and to fund working capital, capital expenditures, research and development efforts and other general corporate activities; |
|
|
• |
make it difficult for us to fulfill our obligations under our credit and other debt agreements; |
|
|
• |
limit our flexibility in planning for, or reacting to, changes in our business and our markets; and |
|
|
• |
place us at a competitive disadvantage relative to our competitors that have less debt. |
Substantially all of the domestic personal property of the Company and its domestic subsidiaries and certain shares of certain non-domestic subsidiaries have been pledged as collateral against any outstanding borrowings under the Second Amended and Restated Credit Agreement dated October 22, 2015 (as amended from time to time, the “2015 Credit Agreement”) governing our 2015 Revolving Credit Facility. In addition, the 2015 Credit Agreement requires us to maintain specified financial ratios and satisfy certain financial condition tests, which may require that we take action to reduce our debt or to act in a manner contrary to our business objectives.
In the future, the then current economic and credit market conditions may limit our access to additional capital, to the extent that the 2015 Credit Agreement would otherwise permit additional financing, or may preclude our ability to refinance our existing indebtedness. There can be no assurance that there will not be a deterioration in the credit markets, a deterioration in the financial condition of our lenders or their ability to fund their commitments or, if necessary, that we will be able to find replacement financing, if need be, on similar or acceptable terms. An inability to access sufficient financing or capital could have an adverse impact on our operations and thus on our operating results and financial position.
Our 2015 Credit Agreement imposes significant operating and financial restrictions, which may prevent us from pursuing our business strategies or favorable business opportunities.
Subject to a number of important exceptions, the 2015 Credit Agreement may limit our ability to:
|
|
• |
incur more debt; |
|
|
• |
pay dividends or make other distributions; |
|
|
• |
redeem stock; |
|
|
• |
issue stock of subsidiaries; |
|
|
• |
make certain investments; |
|
|
• |
create liens; |
|
|
• |
reorganize our corporate structure; |
|
|
• |
enter into transactions with affiliates; |
|
|
• |
merge or consolidate; and |
|
|
• |
transfer or sell assets. |
The restrictions contained in the 2015 Credit Agreement may prevent us from taking actions that we believe would be in the best interest of our business, and may make it difficult for us to successfully execute our business strategy or effectively compete with companies that are not similarly restricted. A breach of any of these covenants or the inability to comply with the required financial ratios could result in a default under the 2015 Credit Agreement. If any such default occurs, the lenders under the 2015 Credit Agreement may elect to declare all of the outstanding debt under the 2015 Credit Agreement, together with accrued interest and other amounts payable thereunder, to be immediately due and payable. The lenders under the 2015 Credit Agreement also have the right in those circumstances to terminate any commitments they have to provide further borrowings. In addition, following an event of default
19
under the 2015 Credit Agreement, the lenders under the 2015 Credit Agreement will have the right to proceed against the collateral that secures the debt. If the debt under the 2015 Credit Agreement were to be accelerated, we may not have the ability to refinance that debt, and if we can, the terms of such refinancing may be less favorable than the current financing terms under the 2015 Credit Agreement. In the event that the indebtedness is accelerated, our assets may not be sufficient to repay in full all of our debt.
We face risks associated with our exposure to variable interest rates and foreign currency exchange rates.
We are exposed to various types of market risk in the normal course of business, including the impact of interest rate changes and foreign currency exchange rate fluctuations. Some of our indebtedness bears interest at variable rates, generally linked to market benchmarks such as LIBOR. Any increase in interest rates would increase our finance expenses relating to our variable rate indebtedness and increase the costs of refinancing our existing indebtedness and issuing new debt. A portion of our indebtedness is also euro denominated. In addition, we conduct our business and incur costs in the local currency of the countries in which we operate. As we continue expanding our business into markets such as Europe, China, Australia, India and Brazil, we expect that an increasing percentage of our revenue and cost of sales will be denominated in currencies other than the U.S. Dollar, our reporting currency. As a result, we are subject to currency translation risk, whereby changes in exchange rates between the dollar and the other currencies in which we borrow and do business could result in foreign exchange losses and have a material adverse effect on our results of operations.
We are exposed to swap counterparty credit risk that could materially and adversely affect our business, operating results, and financial condition.
From time to time, we rely on interest rate swap contracts and cross-currency swap contracts and hedging arrangements to effectively manage our interest rate risk. Failure to perform under derivatives contracts by one or more of our counterparties could disrupt our hedging operations, particularly if we were entitled to a termination payment under the terms of the contract that we did not receive, if we had to make a termination payment upon default of the counterparty, or if we were unable to reposition the swap with a new counterparty.
We are subject to tax laws and regulations in many jurisdictions and the inability to successfully defend claims from taxing authorities related to our current or acquired businesses could adversely affect our operating results and financial position.
We conduct business in many countries, which requires us to interpret the income tax laws and rulings in each of those taxing jurisdictions. Due to the subjectivity of tax laws between those jurisdictions as well as the subjectivity of factual interpretations, our estimates of income tax liabilities may differ from actual payments or assessments. Claims from taxing authorities related to these differences could have an adverse impact on our operating results and financial position. Moreover, changes to tax laws and regulations in the U.S. or other countries where we do business could have an adverse effect on our operating results and financial position.
Tax reform may significantly affect the Company and its stockholders.
On December 22, 2017, President Trump signed into law the Tax Cuts and Jobs Act (“TCJA”) that significantly reforms the Internal Revenue Code of 1986, as amended (the “Code”). The TCJA, among other things, includes changes to U.S. federal tax rates, including reduction of the corporate tax rate from a top marginal rate of 35% to a flat rate of 21%, limitations of the tax deduction for interest expense to 30% of adjusted earnings (except for certain small businesses), limitations of the deduction for net operating losses to 80% of current year taxable income and elimination of net operating loss carrybacks, one time taxation of offshore earnings at reduced rates regardless of whether they are repatriated, elimination of U.S. tax on foreign earnings (subject to certain important exceptions), immediate deductions for certain new investments instead of deductions for depreciation expense over time, modifying or repealing many business deductions and credits and putting into effect the migration from a “worldwide” system of taxation to a territorial system. Notwithstanding the reduction in the corporate income tax rate, the overall impact of the new federal tax law is uncertain and our business and financial condition could be adversely affected. In addition, it is uncertain if and to what extent various states will adjust their policies in response to the newly enacted federal tax law. The impact of this tax reform as well as other tax laws and regulations in the U.S. or other countries where we do business on holders of our common stock and our operating results and financial position is uncertain and could be adverse.
Certain of our businesses are exposed to renewable energy markets which depend significantly on the availability and size of government subsidies and economic incentives.
Certain of our businesses sell product to customers within the renewable energy market, which among other energy sources includes wind energy and solar energy. This market is inherently cyclical and can be impacted by governmental policy, the comparative cost differential between various forms of energy, and the general macroeconomic climate.
20
At present, the cost of many forms of renewable energy may exceed the cost of conventional power generation in locations around the world. Various governments have used different policy initiatives to encourage or accelerate the development and adoption of renewable energy sources such as wind energy and solar energy. Renewable energy policies are in place in the European Union, certain countries in Asia, including China, Japan and South Korea, and many of the states in Australia and the United States. Examples of government sponsored financial incentives include capital cost rebates, feed-in tariffs, tax credits, net metering and other incentives to end-users, distributors, system integrators and manufacturers of renewable energy products to promote the use of renewable energy and to reduce dependency on other forms of energy. Governments may decide to reduce or eliminate these economic incentives for political, financial or other reasons. Reductions in, or eliminations of, government subsidies and economic incentives could reduce demand for our products and, as our customers attempt to compete on a levelized playing field with other forms of nonrenewable energy, also increase pressure to reduce cost throughout the supply chain. Lower demand or increased pricing pressure could adversely affect our business prospects and results of operations.
Regulations related to conflict minerals could adversely impact our business
The Dodd-Frank Wall Street Reform and Consumer Protection Act contains provisions to improve transparency and accountability concerning the supply of certain minerals, known as conflict minerals, originating from the Democratic Republic of Congo (DRC) and adjoining countries. As a result, in August 2012 the SEC adopted annual disclosure and reporting requirements for those companies who use conflict minerals mined from the DRC and adjoining countries in their products. These new requirements required country of origin inquiries and potentially due diligence, with initial disclosure requirements beginning in May 2014 relating to activities in 2013. There have been and will continue to be costs associated with complying with these disclosure requirements, including for country of origin inquiries and due diligence to determine the sources of conflict minerals used in our products and other potential changes to products, processes or sources of supply as a consequence of such verification activities. These rules could adversely affect the sourcing, supply and pricing of materials used in our products. As there may be only a limited number of suppliers offering “conflict free” conflict minerals, we cannot be sure that we will be able to obtain necessary conflict minerals from such suppliers in sufficient quantities or at competitive prices. Also, we may face reputational challenges if we determine that certain of our products contain minerals not determined to be conflict free or if we are unable to verify sufficiently the origins for all conflict minerals used in our products through the procedures we have implemented.
Continued volatility and disruption in global financial markets could significantly impact our customers and suppliers, weaken the markets we serve and harm our operations and financial performance.
Our financial performance depends, in large part, on conditions in the markets that we serve and on the U.S. and global economies in general. As widely reported, U.S. and global financial markets have been experiencing disruption in recent years. Further, economic conditions in the European Union have deteriorated and, with the Bauer Acquisition, the Svendborg Acquisition and the Stromag Acquisition, our exposure to European markets has increased. Given the significance and widespread nature of these circumstances, the U.S., European, and global economies could remain significantly challenged for an indeterminate period of time. While currently these conditions have not impaired our ability to access credit markets and finance our operations, there can be no assurance that there will not be a further deterioration in financial markets and confidence in major economies. In addition, a tight credit market may adversely affect the ability of our customers to obtain financing for significant purchases and operations and could result in a decrease in or cancellation of orders for our products and services as well as impact the ability of our customers to make payments. Similarly, a tight credit market may adversely affect our supplier base and increase the potential for one or more of our suppliers to experience financial distress or bankruptcy. These conditions would harm our business by adversely affecting our sales, results of operations, profitability, cash flows, financial condition and long-term anticipated growth rate, which could result in potential impairment of certain long-term assets including goodwill.
We face risks associated with the Svendborg Acquisition and Stromag Acquisition Purchase Agreements.
In connection with the Svendborg Acquisition and the Stromag Acquisition, we are subject to substantially all of the liabilities of Svendborg and Stromag, respectively, that were not satisfied on or prior to the corresponding closing date. There may be liabilities that we underestimated or did not discover in the course of performing our due diligence investigation of Svendborg and Stromag. Under the Purchase Agreements, the sellers agreed to provide us with a limited set of representations and warranties, including with respect to outstanding and potential liabilities. Damages resulting from a breach of a representation or warranty could have a material and adverse effect on the Company’s financial condition and results of operations, and there is no guarantee that the Company would actually be able to recover all or any portion of the sums payable in connection with such breach.
21
We may not be able to achieve the efficiencies, savings and other benefits anticipated from our cost reduction, margin improvement and other business optimization initiatives.
We have in the past undertaken and expect to continue to undertake various restructuring activities and cost reduction initiatives in an effort to better align our organizational structure and costs with our strategy. We cannot assure you that we will be able to achieve all of the cost savings that we expect to realize from current or future activities and initiatives. Furthermore, in connection with these activities, we may experience a disruption in our ability to perform functions important to our strategy. Unexpected delays, increased costs, challenges with adapting our internal control environment to a new organizational structure, inability to retain and motivate employees or other challenges arising from these initiatives could adversely affect our ability to realize the anticipated savings or other intended benefits of these activities and could have a material adverse impact on our financial condition and operating results.
The uncertainty surrounding the implementation and effect of Brexit and related negative developments in the European Union could adversely affect our business and financial results. The vote by the United Kingdom to leave the European Union could adversely affect us.
In a Referendum of the United Kingdom (or the U.K.) held on June 23, 2016, the UK voted to leave the European Union (E.U.) (referred to as Brexit), which could cause disruptions to and create uncertainty surrounding our business, including affecting our relationships with our existing and future customers, suppliers and employees, which could have an adverse effect on our business, financial results and operations. The formal process for U.K. leaving the E.U. began in March 2017, when the U.K. served notice to the European Council under Article 50 of the Treaty of Lisbon. The long-term nature of the U.K.’s relationship with the E.U. is unclear and there is considerable uncertainty when any relationship will be agreed to and implemented. The political and economic instability created by Brexit has caused and may continue to cause significant volatility in global financial markets and uncertainty regarding the regulation of data protection in the U.K. Brexit could also have the effect of disrupting the free movement of goods, services, and people between the U.K., the E.U. and elsewhere. The effects of Brexit will depend on any agreements the U.K. makes to retain access to E.U. markets either during a transitional period or more permanently. The measures could potentially disrupt the markets we serve and the tax jurisdictions in which we operate and adversely change tax benefits or liabilities in these or other jurisdictions, and may cause us to lose customers, suppliers, and employees. In addition, Brexit could lead to legal uncertainty and potentially divergent national laws and regulations as the U.K. determines which E.U. laws to replace or replicate. Further, in the Brexit Referendum, Scotland voted to remain in the E.U., while England and Wales voted to exit. The disparity has renewed the Scottish independence movement. Scottish leaders have publicly stated that a second independence referendum will not be held until after the terms of the Brexit are clear; however, plans may change. Political issues and a potential breakup of the U.K. could create legal and economic uncertainty in the region and have a material adverse effect on the Company and other economies in which we operate. There can be no assurance that any or all of these events will not have a material adverse effect on our business operations, results of operations and financial condition.
None.
The number, type, location and size of the materially important physical properties used by our operations as of December 31, 2017 are shown in the following charts, by segment.
|
|
|
Number and Nature of Facilities |
|
|
Square footage |
|
||||||||||||||
|
|
|
Manufacturing |
|
|
Corporate Support |
|
|
Total |
|
|
Owned |
|
|
Leased |
|
|||||
|
Couplings, Clutches & Brakes |
|
|
20 |
|
|
|
— |
|
|
|
20 |
|
|
|
1,315,528 |
|
|
|
426,386 |
|
|
Electromagnetic Clutches & Brakes |
|
|
7 |
|
|
|
— |
|
|
|
7 |
|
|
|
169,889 |
|
|
|
445,934 |
|
|
Gearing |
|
|
6 |
|
|
|
— |
|
|
|
6 |
|
|
|
257,350 |
|
|
|
483,747 |
|
|
Corporate(1) |
|
|
— |
|
|
|
2 |
|
|
|
2 |
|
|
|
104,288 |
|
|
|
13,804 |
|
22
|
|
|
Locations |
|
|
Expiration dates of Leased Facilities (in years) |
|
||||||||||||||||||||||
|
|
|
North America |
|
|
Europe |
|
|
Asia |
|
|
Other |
|
|
Total |
|
|
Minimum |
|
|
Maximum |
|
|||||||
|
Couplings, Clutches & Brakes |
|
|
7 |
|
|
|
10 |
|
|
|
2 |
|
|
|
1 |
|
|
|
20 |
|
|
|
— |
|
|
|
20 |
|
|
Electromagnetic Clutches & Brakes |
|
|
2 |
|
|
|
4 |
|
|
|
1 |
|
|
|
— |
|
|
|
7 |
|
|
|
— |
|
|
|
24 |
|
|
Gearing |
|
|
4 |
|
|
|
2 |
|
|
|
— |
|
|
|
— |
|
|
|
6 |
|
|
|
— |
|
|
|
7 |
|
|
Corporate(1) |
|
|
2 |
|
|
|
— |
|
|
|
— |
|
|
|
— |
|
|
|
2 |
|
|
|
— |
|
|
|
6 |
|
|
(1) |
Shared services center, selective engineering functions, Corporate headquarters and selective customer service functions. |
We believe our owned and leased facilities are well-maintained and suitable for our operations.
We are, from time to time, party to various legal proceedings arising out of our business. These proceedings primarily involve commercial claims, product liability claims, intellectual property claims, environmental claims, personal injury claims and workers’ compensation claims. We cannot predict the outcome of these lawsuits, legal proceedings and claims with certainty. Nevertheless, we believe that the outcome of any currently existing proceedings should not have a material adverse effect on our business, financial condition and results of operations.
Not applicable.
23
PART II
|
Item 5. |
Market for Registrant’s Common Equity and Related Stockholder Matters and Issuer Purchases of Equity Securities |
Market Information
Our common stock trades on the NASDAQ Global Market under the symbol “AIMC”. As of February 21, 2018, the number of holders on record of our common stock was approximately 80.
The following table sets forth, for the periods indicated, the high and low sales price for our common stock as reported on The NASDAQ Global Market. Our common stock commenced trading on the NASDAQ Global Market on December 15, 2006.
|
|
|
U.S. Dollars |
|
|||||
|
|
|
High |
|
|
Low |
|
||
|
Fiscal year ended December 31, 2017 |
|
|
|
|
|
|
|
|
|
Fourth Quarter |
|
$ |
50.80 |
|
|
$ |
44.95 |
|
|
Third Quarter |
|
$ |
48.95 |
|
|
$ |
38.80 |
|
|
Second Quarter |
|
$ |
45.03 |
|
|
$ |
36.50 |
|
|
First Quarter |
|
$ |
46.90 |
|
|
$ |
35.20 |
|
|
Fiscal year ended December 31, 2016 |
|
|
|
|
|
|
|
|
|
Fourth Quarter |
|
$ |
39.85 |
|
|
$ |
27.35 |
|
|
Third Quarter |
|
$ |
29.23 |
|
|
$ |
26.24 |
|
|
Second Quarter |
|
$ |
30.00 |
|
|
$ |
25.77 |
|
|
First Quarter |
|
$ |
28.08 |
|
|
$ |
20.55 |
|
Dividends
The Company declared and paid dividends of $0.66 per share of common stock for the year ended December 31, 2017. The Company declared and paid dividends of $0.60 per share for the year ended December 31, 2016.
On February 13, 2018, the Company declared a dividend of $0.17 per share for the quarter ended March 31, 2018, payable on April 3, 2018 to stockholders of record as of March 19, 2018. See Note 17 to the consolidated financial statements.
Future declarations of quarterly cash dividends are subject to approval by the Board of Directors and to the Board’s continuing determination that the declaration of dividends are in the best interest of the Company’s stockholders and are in compliance with all laws and agreements of the Company applicable to the declaration and payment of cash dividends.
Securities Authorized for Issuance Under Equity Compensation Plans
The following table presents information concerning our equity compensation plans:
|
Plan category |
|
Number of Securities to be Issued Upon Exercise of Outstanding Options, Warrants and Rights |
|
|
Weighted-Average Exercise Price of Outstanding Options, Warrants and Rights |
|
|
Number of Securities Remaining Available for Future Issuance Under Equity Compensation Plans (Excluding Securities Reflected in Column (a) |
|
|||
|
|
|
(a) |
|
|
(b) |
|
|
(c) |
|
|||
|
Equity compensation plans approved by security holders(1) |
|
180,680(2) |
|
|
$ |
— |
|
|
|
860,793 |
|
|
|
Equity compensation plans not approved by security holders |
|
n/a |
|
|
n/a |
|
|
n/a |
|
|||
|
Total |
|
|
180,680 |
|
|
$ |
— |
|
|
|
860,793 |
|
|
(1) |
The 2014 Omnibus Incentive Plan was approved by the Company’s stockholders at its 2014 annual meeting. |
|
(2) |
Represents the maximum number of shares that may be issued under performance share awards that are outstanding as of December 31, 2017 based on achievement of the highest level of each applicable performance objective. A portion of the performance share awards (weighted 50% of the total performance share award) measures the Company’s return on invested capital (“ROIC”) against an annual ROIC target established by the Compensation Committee over each of three one-year |
24
|
measurement periods ending on December 31, 2015, December 31, 2016 and December 31, 2017. The performance share awards subject to the ROIC measurement periods ending on December 31, 2015 and December 31, 2016 have already been fixed by the Compensation Committee based on the Company’s actual ROIC for those measurement periods and issued as shares restricted stock and therefore are not included in this total. On February 13, 2018, based upon actual ROIC for the one-year measurement period ended December 31, 2017 and subject to completion of the Company’s annual audit and filing of this Annual Report on Form 10-K, the Compensation Committee fixed the award of shares for the ROIC performance objective at 89.5% of target. As a result, the number of shares subject to the ROIC portion of the awards for the measurement period ended December 31, 2017 overstates the expected dilution. A portion of the performance share awards (weighted 50% of the total performance share award) measures the Company’s total shareholder return (“TSR”) against the TSR for a peer group of companies over each of the three-year measurement periods ending on December 31, 2017, December 31, 2018 and December 31, 2019. On February 13, 2018, based upon actual TSR for the three-year measurement period ended December 31, 2017, the Compensation Committee fixed the award of shares for the TSR performance objective at 150% of target. As a result, 47,968 performance shares were earned as of December 31, 2017 and are included in the total. The payout for the TSR portions of the awards for the measurement periods ending on December 31, 2018 and December 31, 2019 have not yet been fixed and 89,948 shares subject to these awards, which is based on the achievement of the highest applicable performance objective, are not yet earned and may therefore overstate expected dilution. The weighted average exercise price set forth in column (b) does not take these performance share awards into account |
Issuer Repurchases of Equity Securities
The following table summarizes our share repurchase activity by month for the quarter ended December 31, 2017.
|
Period |
|
Total Number of Shares Purchased |
|
|
Average Price Paid per Share |
|
|
Total Number of Shares Purchased as Part of Publicly Announced Plans or Programs (1) |
|
|
Approximate Dollar Value of Shares That May Yet be Purchased Under The Plans or Programs |
|
||||
|
October 1, 2017 to October 31, 2017 |
|
|
— |
|
|
$ |
— |
|
|
|
— |
|
|
$ |
30,000,000 |
|
|
November 1, 2017 to November 30, 2017 |
|
|
— |
|
|
$ |
— |
|
|
|
— |
|
|
$ |
— |
|
|
December 1, 2017 to December 31, 2017 |
|
|
— |
|
|
$ |
— |
|
|
|
— |
|
|
$ |
— |
|
|
(1) |
On October 19, 2016, our board of directors approved a new share repurchase program authorizing the buyback of up to $30.0 million of the Company's common stock through December 31, 2019. This plan, which was announced on October 21, 2016, replaces the previous share repurchase program which was terminated. The Company expects to purchase shares on the open market, through block trades, in privately negotiated transactions, in compliance with SEC Rule 10b-18 (including through Rule 10b5-1 plans), or in any other appropriate manner. The timing of the shares repurchased will be at the discretion of management and will depend on a number of factors, including price, market conditions and regulatory requirements. Shares acquired through the repurchase program will be retired. The Company retains the right to limit, terminate or extend the share repurchase program at any time without prior notice. The Company expects to fund any further repurchases of its common stock through a combination of cash on hand and cash generated by operations. |
25
Performance Graph
The following graph compares the cumulative total stockholder return on our common stock for the 5-year period from December 31, 2012, through December 31, 2017, with the cumulative total return on shares of companies comprising the S&P Small Cap 600 Index and the newly-added S&P Small Cap 600 Capped Industrials Index in each case assuming an initial investment of $100, assuming dividend reinvestment.
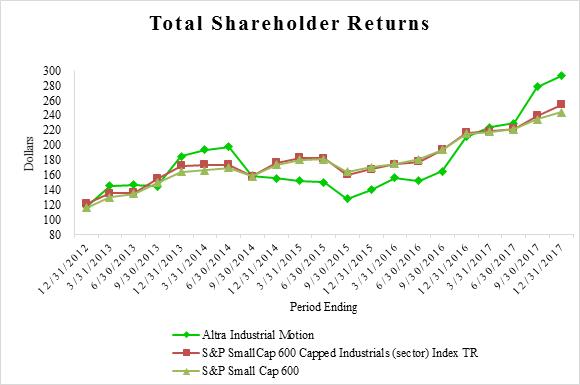
26
Item 6.Selected Financial Data.
The following table contains our selected historical financial data for the years ended December 31, 2017, 2016, 2015, 2014, and 2013. The following should be read in conjunction with “Management’s Discussion and Analysis of Financial Condition and Results of Operations” and the consolidated financial statements and notes included elsewhere in this Form 10-K.
|
|
Amounts in thousands, except per share data |
|
|||||||||||||||||
|
|
Year Ended December 31, |
|
|||||||||||||||||
|
|
2017 |
|
|
2016 |
|
|
2015 |
|
|
2014 |
|
|
2013 |
|
|||||
|
Net sales |
$ |
876,737 |
|
|
$ |
708,906 |
|
|
$ |
746,652 |
|
|
$ |
819,817 |
|
|
$ |
722,218 |
|
|
Cost of sales |
|
600,961 |
|
|
|
486,774 |
|
|
|
518,189 |
|
|
|
570,948 |
|
|
|
506,837 |
|
|
Gross profit |
|
275,776 |
|
|
|
222,132 |
|
|
|
228,463 |
|
|
|
248,869 |
|
|
|
215,381 |
|
|
Operating expenses: |
|
|
|
|
|
|
|
|
|
|
|
|
|
|
|
|
|
|
|
|
Selling, general and administrative expenses |
|
164,492 |
|
|
|
140,492 |
|
|
|
139,217 |
|
|
|
156,471 |
|
|
|
130,155 |
|
|
Research and development expenses |
|
24,434 |
|
|
|
17,677 |
|
|
|
17,818 |
|
|
|
15,522 |
|
|
|
12,536 |
|
|
Impairment of Intangible assets |
|
— |
|
|
|
6,568 |
|
|
|
— |
|
|
|
— |
|
|
|
— |
|
|
Restructuring costs |
|
4,143 |
|
|
|
9,849 |
|
|
|
7,214 |
|
|
|
1,767 |
|
|
|
1,111 |
|
|
Loss on partial settlement of pension plan |
|
1,720 |
|
|
|
— |
|
|
|
— |
|
|
|
— |
|
|
|
— |
|
|
|
|
194,789 |
|
|
|
174,586 |
|
|
|
164,249 |
|
|
|
173,760 |
|
|
|
143,802 |
|
|
Income from operations |
|
80,987 |
|
|
|
47,546 |
|
|
|
64,214 |
|
|
|
75,109 |
|
|
|
71,579 |
|
|
Other non-operating income and expense: |
|
|
|
|
|
|
|
|
|
|
|
|
|
|
|
|
|
|
|
|
Interest expense, net |
|
7,710 |
|
|
|
11,679 |
|
|
|
12,164 |
|
|
|
11,994 |
|
|
|
10,586 |
|
|
Loss on extinguishment of convertible debt |
|
1,797 |
|
|
|
1,989 |
|
|
|
— |
|
|
|
— |
|
|
|
— |
|
|
Other non-operating expense (income), net |
|
353 |
|
|
|
(7 |
) |
|
|
963 |
|
|
|
(3 |
) |
|
|
1,657 |
|
|
|
|
9,860 |
|
|
|
13,661 |
|
|
|
13,127 |
|
|
|
11,991 |
|
|
|
12,243 |
|
|
Income before income taxes |
|
71,127 |
|
|
|
33,885 |
|
|
|
51,087 |
|
|
|
63,118 |
|
|
|
59,336 |
|
|
Provision for income taxes |
|
19,700 |
|
|
|
8,745 |
|
|
|
15,744 |
|
|
|
22,936 |
|
|
|
19,151 |
|
|
Net income |
|
51,427 |
|
|
|
25,140 |
|
|
|
35,343 |
|
|
|
40,182 |
|
|
|
40,185 |
|
|
Net loss (income) attributable to non-controlling interest |
|
— |
|
|
|
— |
|
|
|
63 |
|
|
|
(15 |
) |
|
|
90 |
|
|
Net income attributable to Altra Industrial Motion Corp. |
$ |
51,427 |
|
|
$ |
25,140 |
|
|
$ |
35,406 |
|
|
$ |
40,167 |
|
|
$ |
40,275 |
|
|
Other Financial Data: |
|
|
|
|
|
|
|
|
|
|
|
|
|
|
|
|
|
|
|
|
Depreciation and amortization |
$ |
36,025 |
|
|
$ |
29,898 |
|
|
$ |
30,121 |
|
|
$ |
32,137 |
|
|
$ |
27,924 |
|
|
Purchases of fixed assets |
|
(32,826 |
) |
|
|
(18,941 |
) |
|
|
(22,906 |
) |
|
|
(28,050 |
) |
|
|
(27,823 |
) |
|
Cash flow provided by (used in): |
|
|
|
|
|
|
|
|
|
|
|
|
|
|
|
|
|
|
|
|
Operating activities |
|
80,581 |
|
|
|
76,641 |
|
|
|
86,816 |
|
|
|
84,499 |
|
|
|
89,625 |
|
|
Investing activities |
|
(26,722 |
) |
|
|
(206,908 |
) |
|
|
(21,705 |
) |
|
|
(42,294 |
) |
|
|
(130,005 |
) |
|
Financing activities |
|
(74,048 |
) |
|
|
149,772 |
|
|
|
(55,783 |
) |
|
|
(53,965 |
) |
|
|
17,991 |
|
|
Weighted average shares, basic |
|
28,949 |
|
|
|
25,719 |
|
|
|
26,064 |
|
|
|
26,713 |
|
|
|
26,766 |
|
|
Weighted average shares, diluted |
|
29,064 |
|
|
|
25,872 |
|
|
|
26,109 |
|
|
|
27,403 |
|
|
|
26,841 |
|
|
Basic Earnings per share: |
|
|
|
|
|
|
|
|
|
|
|
|
|
|
|
|
|
|
|
|
Net income attributable to Altra Industrial Motion Corp. |
$ |
1.78 |
|
|
$ |
0.97 |
|
|
$ |
1.36 |
|
|
$ |
1.50 |
|
|
$ |
1.50 |
|
|
Diluted earnings per share: |
|
|
|
|
|
|
|
|
|
|
|
|
|
|
|
|
|
|
|
|
Net income attributable to Altra Industrial Motion Corp. |
$ |
1.77 |
|
|
$ |
0.97 |
|
|
$ |
1.36 |
|
|
$ |
1.47 |
|
|
$ |
1.50 |
|
|
Cash dividend declared |
$ |
0.66 |
|
|
$ |
0.60 |
|
|
$ |
0.57 |
|
|
$ |
0.46 |
|
|
$ |
0.38 |
|
|
|
|
|
|
|
|
|
|
|
|
|
|
|
|
|
|
|
|
|
|
|
|
|
|
2017 |
|
|
2016 |
|
|
2015 |
|
|
2014 |
|
|
2013 |
|
|||||
|
Balance Sheet Data: |
|
|
|
|
|
|
|
|
|
|
|
|
|
|
|
|
|
|
|
|
|
Cash and cash equivalents |
|
$ |
51,994 |
|
|
$ |
69,118 |
|
|
$ |
50,320 |
|
|
$ |
47,503 |
|
|
$ |
63,604 |
|
|
Total assets |
|
|
920,657 |
|
|
|
869,824 |
|
|
|
632,332 |
|
|
|
676,402 |
|
|
|
727,408 |
|
|
Total debt, net of unaccreted discount |
|
|
275,971 |
|
|
|
369,659 |
|
|
|
234,755 |
|
|
|
255,752 |
|
|
|
278,272 |
|
|
Long-term liabilities, excluding long-term debt |
|
$ |
105,873 |
|
|
$ |
88,884 |
|
|
$ |
53,848 |
|
|
$ |
56,676 |
|
|
$ |
55,663 |
|
Comparability of the information included in the selected financial data has been impacted by the acquisitions of Svendborg in December 2013, Guardian in 2014, and Stromag in December 2016.
27
Cautionary Statement Regarding Forward-Looking Statements
This Annual Report on Form 10-K contains forward-looking statements, within the meaning of Section 27A of the Securities Act of 1933, as amended, and Section 21E of the Securities Exchange Act of 1934, as amended, and Section 21E of the Securities Exchange Act of 1934, as amended, which reflect the Company’s current estimates, expectations and projections about the Company’s future results, performance, prospects and opportunities. Forward-looking statements include, among other things, the information concerning the Company’s possible future results of operations including revenue, costs of goods sold, gross margin, future profitability, future economic improvement, business and growth strategies, financing plans, the Company’s competitive position and the effects of competition, the projected growth of the industries in which we operate, and the Company’s ability to consummate strategic acquisitions and other transactions. Forward-looking statements include statements that are not historical facts and can be identified by forward-looking words such as “anticipate,” “believe,” “could,” “estimate,” “expect,” “intend,” “plan,” “may,” “should,” “will,” “would,” “project,” “forecast,” and similar expressions. These forward-looking statements are based upon information currently available to the Company and are subject to a number of risks, uncertainties, and other factors that could cause the Company’s actual results, performance, prospects, or opportunities to differ materially from those expressed in, or implied by, these forward-looking statements. Important factors that could cause the Company’s actual results to differ materially from the results referred to in the forward-looking statements the Company makes in this report include:
|
|
• |
the effects of intense competition in the markets in which we operate; |
|
|
• |
the cyclical nature of the markets in which we operate; |
|
|
• |
the loss of independent distributors on which we rely; |
|
|
• |
changes in market conditions in which we operate that would influence the value of the Company’s stock; |
|
|
• |
the Company’s ability to achieve its business plans, including with respect to an uncertain economic environment; |
|
|
• |
the risks associated with international operations, including currency risks; |
|
|
• |
the Company’s ability to retain existing customers and our ability to attract new customers for growth of our business; |
|
|
• |
the effects of the loss or bankruptcy of or default by any significant customer, suppliers, or other entity relevant to the Company’s operations; |
|
|
• |
political and economic conditions nationally, regionally, and in the markets in which we operate; |
|
|
• |
natural disasters, war, civil unrest, terrorism, fire, floods, tornadoes, earthquakes, hurricanes, or other matters beyond the Company’s control; |
|
|
• |
the Company’s risk of loss not covered by insurance; |
|
|
• |
the accuracy of estimated forecasts of OEM customers and the impact of the current global and European economic environment on our customers; |
|
|
• |
the risks associated with certain minimum purchase agreements we have with suppliers; |
|
|
• |
disruption of our supply chain; |
|
|
• |
fluctuations in the costs of raw materials used in our products; |
|
|
• |
the outcome of litigation to which the Company is a party from time to time, including product liability claims; |
|
|
• |
work stoppages and other labor issues; |
|
|
• |
changes in employment, environmental, tax and other laws, including enactment of the Tax Cuts and Jobs Act, and changes in the enforcement of laws; |
|
|
• |
the Company’s ability to attract and retain key executives and other personnel; |
|
|
• |
the Company’s ability to successfully pursue the Company’s development activities and successfully integrate new operations and systems, including the realization of revenues, economies of scale, cost savings, and productivity gains associated with such operations; |
|
|
• |
the Company’s ability to obtain or protect intellectual property rights and avoid infringing on the intellectual property rights of others; |
|
|
• |
the risks associated with the portion of the Company’s total assets comprised of goodwill and indefinite lived intangibles; |
28
|
|
• |
changes in market conditions that would result in the impairment of goodwill or other assets of the Company; |
|
|
• |
changes in accounting rules and standards, audits, compliance with the Sarbanes-Oxley Act, and regulatory investigations; |
|
|
• |
the effects of changes to critical accounting estimates; |
|
|
• |
changes in volatility of the Company’s stock price and the risk of litigation following a decline in the price of the Company’s stock; |
|
|
• |
failure of the Company’s operating equipment or information technology infrastructure; |
|
|
• |
the Company’s ability to implement our Enterprise Resource Planning (ERP) system; |
|
|
• |
the Company’s access to capital, credit ratings, indebtedness, and ability to raise additional capital and operate under the terms of the Company’s debt obligations; |
|
|
• |
the risks associated with our debt; |
|
|
• |
the risks associated with the Company’s exposure to variable interest rates and foreign currency exchange rates; |
|
|
• |
the risks associated with interest rate swap contracts; |
|
|
• |
the risks associated with the Company’s being subject to tax laws and regulations in various jurisdictions; |
|
|
• |
the risks associated with the Company’s exposure to renewable energy markets; |
|
|
• |
the risks related to regulations regarding conflict minerals; |
|
|
• |
the risks associated with the volatility and disruption in the global financial markets; |
|
|
• |
the Company’s ability to successfully execute, manage and integrate key acquisitions and mergers, including the Svendborg Acquisition, and the Stromag Acquisition; |
|
|
• |
the Company’s ability to achieve the efficiencies, savings and other benefits anticipated from our cost reduction, margin improvement, restructuring, plant consolidation and other business optimization initiatives; |
|
|
• |
the risk associated with the UK vote to leave the European Union; and |
|
|
• |
other factors, risks, and uncertainties referenced in the Company’s filings with the Securities and Exchange Commission, including the “Risk Factors” set forth in this document. |
ALL FORWARD-LOOKING STATEMENTS SPEAK ONLY AS OF THE DATE OF THIS REPORT. EXCEPT AS REQUIRED BY LAW, WE UNDERTAKE NO OBLIGATION TO PUBLICLY UPDATE OR RELEASE ANY REVISIONS TO THESE FORWARD-LOOKING STATEMENTS TO REFLECT ANY EVENTS OR CIRCUMSTANCES AFTER THE DATE OF THIS REPORT OR TO REFLECT THE OCCURRENCE OF UNANTICIPATED EVENTS. ALL SUBSEQUENT WRITTEN AND ORAL FORWARD-LOOKING STATEMENTS ATTRIBUTABLE TO US OR ANY PERSON ACTING ON THE COMPANY’S BEHALF ARE EXPRESSLY QUALIFIED IN THEIR ENTIRETY BY THE CAUTIONARY STATEMENTS CONTAINED OR REFERRED TO IN THIS SECTION AND IN OUR RISK FACTORS SET FORTH IN PART I, ITEM 1A OF THE COMPANY’S ANNUAL REPORT ON FORM 10-K AND IN OTHER REPORTS FILED WITH THE SEC BY THE COMPANY.
The following discussion of the financial condition and results of operations of Altra Industrial Motion Corp. and its subsidiaries should be read together with the Selected Historical Financial Data, and the consolidated financial statements of Altra Industrial Motion Corp. and its subsidiaries and related notes included elsewhere in the Company’s Annual Report on Form 10-K. The following discussion includes forward-looking statements. For a discussion of important factors that could cause actual results to differ materially from the results referred to in the forward-looking statements, see “Forward-Looking Statements” and “Risk Factors”. Unless the context requires otherwise, the terms “Altra,” “Altra Industrial Motion Corp.,” “the Company,” “we,” “us” and “our” refer to Altra Industrial Motion Corp. and its subsidiaries.
We are a leading global designer, producer and marketer of a wide range of electromechanical power transmission and motion control products with a presence in over 70 countries. Our global sales and marketing network includes over 1,000 direct OEM customers and over 3,000 distributor outlets. Our product portfolio includes industrial clutches and brakes, enclosed gear drives, open gearing, couplings, engineered bearing assemblies, linear components, gear motors, and other related products. Our products serve a wide variety of end markets including energy, general industrial, material handling, mining, transportation and turf and garden. We
29
primarily sell our products to a wide range of OEMs and through long-standing relationships with industrial distributors such as Motion Industries, Applied Industrial Technologies, Kaman Industrial Technologies and W.W. Grainger.
While the power transmission industry has undergone some consolidation, we estimate that in 2017 the top five broad-based electromechanical power transmission companies represented approximately 14% of the U.S. power transmission market. The remainder of the power transmission industry remains fragmented with many small and family-owned companies that cater to a specific market niche often due to their narrow product offerings. We believe that consolidation in our industry will continue because of the increasing demand for global distribution channels, broader product mixes and better brand recognition to compete in this industry.
Business Outlook
Our future financial performance depends, in large part, on conditions in the markets that we serve and on the U.S., European, and global economies in general. Recently, our financial performance has been adversely impacted by challenging dynamics in several of our end markets including oil and gas, power generation and alternative energy. In addition, we face uncertainty relating to the impact of potential inflationary pressure and rising interest rates on our revenues and earnings. At the same time, we believe that our consolidation, supply chain, pricing and operational excellence initiatives will enable us to continue to enhance margins and accelerate profitability.
Critical Accounting Policies
The methods, estimates and judgments we use in applying our critical accounting policies have a significant impact on the results we report in our financial statements. We evaluate our estimates and judgments on an on-going basis. Our estimates are based upon historical experience and assumptions that we believe are reasonable under the circumstances. Our experience and assumptions form the basis for our judgments about the carrying value of assets and liabilities that are not readily apparent from other sources. Actual results may vary from what our management anticipates and different assumptions or estimates about the future could change our reported results.
We believe the following accounting policies are the most critical in that they are important to the financial statements and they require the most difficult, subjective or complex judgments in the preparation of the financial statements.
Inventory. Inventories are generally stated at the lower of cost or market using the first-in, first-out (FIFO) method. The cost of inventory includes direct materials, direct labor, and production overhead. Market is defined as net realizable value. We state inventories acquired through acquisitions at their fair value at the date of acquisition as based on the replacement cost of raw materials, the sales price of the finished goods less an appropriate amount representing the expected profitability from selling efforts, and for work-in-process the sales price of the finished goods less an appropriate amount representing the expected profitability from selling efforts and costs to complete.
We periodically review our quantities of inventories on hand and compare these amounts to the historical and expected usage of each particular product or product line. We record as a charge to cost of sales any amounts required to reduce the carrying value of inventories to net realizable value.
Business Combinations. Business combinations are accounted for at fair value. Acquisition costs are generally expensed as incurred and recorded in selling, general and administrative expenses. The accounting for business combinations requires estimates and judgment as to expectations for future cash flows of the acquired business, and the allocation of those cash flows to identifiable intangible assets, in determining the estimated fair value for assets and liabilities acquired. The fair value assigned to tangible and intangible assets acquired and liabilities assumed are based on management’s estimates and assumptions, as well as other information compiled by management, including valuations that utilize customary valuation procedures and techniques. If the actual results differ from the estimates and judgments used in these estimates, the amounts recorded in the financial statements could result in a possible impairment of the intangible assets and goodwill, or require acceleration of the amortization expense of finite-lived intangible assets
Goodwill, Intangibles and other long-lived assets. In connection with our acquisitions, goodwill and intangible assets were identified and recorded at fair value. We recorded intangible assets for customer relationships, trade names and trademarks, product technology, patents and goodwill. In valuing the customer relationships, trade names, and trademarks, we utilized variations of the income approach. The income approach was considered the most appropriate valuation technique because the inherent value of these assets is their ability to generate current and future income. The income approach relies on historical financial and qualitative information, as well as assumptions and estimates for projected financial information. Projected financial information is subject to risk if our estimates are incorrect. The most significant estimate relates to our projected revenues and profitability. If we do not meet the projected revenues and profitability used in the valuation calculations then the intangible assets could be impaired. In determining the
30
value of customer relationships, we reviewed historical customer attrition rates which were determined to be approximately 5% to 12% per year. Most of our customers tend to be long-term customers with very little turnover. While we do not typically have long-term contracts with customers, we have established long-term relationships with customers which make it difficult for competitors to displace us. Additionally, we assessed historical revenue growth within our industry and customers’ industries in determining the value of customer relationships. The value of our customer relationships intangible asset could become impaired if future results differ significantly from any of the underlying assumptions. This could include a higher customer attrition rate or a change in industry trends such as the use of long-term contracts which we may not be able to obtain successfully. Customer relationships and product technology and patents are considered finite-lived assets, with estimated lives ranging from 8 years to 17 years. The estimated lives were determined by calculating the number of years necessary to obtain 95% of the value of the discounted cash flows of the respective intangible asset.
Goodwill and trade names and trademarks are considered indefinite lived assets. Our trade names and trademarks identify us and differentiate us from competitors, and therefore competition does not limit the useful life of these assets. Additionally, we believe that our trade names and trademarks will continue to generate product sales for an indefinite period.
Accounting standards require that an annual goodwill impairment assessment be conducted at the reporting unit level using either a quantitative or qualitative approach. The Company has determined that its Couplings, Clutches, and Brakes (CCB) operating segment is comprised of two reporting units which are the Couplings reporting unit and the Heavy Duty and Overrunning Clutches and Brakes reporting unit. The Company has determined that its Gearing operating segment is comprised of two reporting units which are the Domestic Gearing reporting unit and the Bauer Gearing reporting unit. The Company has also determined that the Electromagnetic, Clutches and Brakes (ECB) operating segment comprises a single reporting unit.
As part of the annual goodwill impairment assessment we performed a quantitative assessment and estimated the fair value of each of our five reporting units using an income approach. We forecasted future cash flows by reporting unit for each of the next five years and applied a long term growth rate to the final year of forecasted cash flows. The cash flows were then discounted using our estimated discount rate. The forecasts of revenue and profitability growth for use in the long-range plan and the discount rate were the key assumptions in our goodwill fair value analysis.
As of December 31, 2017, each of our reporting units had estimated fair values that were substantially in excess of the carrying value.
Management believes the preparation of revenue and profitability growth rates for use in the long-range plan and the discount rate requires significant use of judgment. If any of our reporting units do not meet our forecasted revenue and/or profitability estimates, we could be required to perform an interim goodwill impairment analysis in future periods. In addition, if our discount rate increases, we could be required to perform an interim goodwill impairment analysis. Given the substantial excess fair value, we believe that a significant change in key valuation assumptions, including a decrease in revenues or profitability, or an increase in the discount rate, would not result in an indication of impairment.
Based on the above procedures, we did not identify any reporting unit that would be required to perform a step 2 goodwill impairment analysis as of December 31, 2017.
For our indefinite lived intangible assets, mainly trademarks, we estimate the fair value by first estimating the total revenue attributable to the trademarks. Second, we estimate an appropriate royalty rate using the return on assets method by estimating the required financial return on our assets, excluding trademarks, less the overall return generated by our total asset base. The return as a percentage of revenue provides an indication of our royalty rate. We compared the estimated fair value of the trademarks with the carrying value of the trademarks and did not identify any impairment as of December 31, 2017. There is increasing revenue pressure in the wind industry driven by changing government subsidies and resulting supplier auctions in an effort to reduce turbine costs. Our Svendborg entity has a significant presence in this market and currently has an indefinite lived intangible asset of approximately $9.0 million. If Svendborg sales were to decline to a level significantly below our current forecasts, we may be required to recognize an impairment in future periods.
Long-lived assets, including definite-lived intangible assets are reviewed for impairment when events or circumstances indicate that the carrying amount of a long lived asset may not be recovered. Long-lived assets are considered to be impaired if the carrying amount of the asset exceeds the undiscounted future cash flows expected to be generated by the asset over its remaining useful life. If an asset is considered to be impaired, the impairment is measured by the amount by which the carrying amount of the asset exceeds its fair value, and is charged to results of operations at that time.
31
The Company did not identify any impairments related to goodwill, definite-lived intangible assets as the fair value of our reporting units and definite lived intangibles assets were substantially in excess of their carrying value as of December 31, 2017. As of December 31, 2016, we recorded an impairment of the carrying value of the TB Woods tradename of $6.6 million primarily due to the loss of revenues as a result of the decline in the Oil and Gas end market.
Recent Accounting Standards
See the discussion of critical accounting policies in Note 1 of the consolidated financial statements for the year ended December 31, 2017.
Results of Operations.
Amounts in thousands, except percentage data
|
|
|
Year Ended |
|
|||||||||
|
|
||||||||||||
|
|
|
December 31, 2017 |
|
|
December 31, 2016 |
|
|
December 31, 2015 |
|
|||
|
Net sales |
|
$ |
876,737 |
|
|
$ |
708,906 |
|
|
$ |
746,652 |
|
|
Cost of sales |
|
|
600,961 |
|
|
|
486,774 |
|
|
|
518,189 |
|
|
Gross profit |
|
|
275,776 |
|
|
|
222,132 |
|
|
|
228,463 |
|
|
Gross profit percentage |
|
|
31.5 |
% |
|
|
31.3 |
% |
|
|
30.6 |
% |
|
Selling, general and administrative expenses |
|
|
164,492 |
|
|
|
140,492 |
|
|
|
139,217 |
|
|
Research and development expenses |
|
|
24,434 |
|
|
|
17,677 |
|
|
|
17,818 |
|
|
Impairment of Intangible Assets |
|
|
— |
|
|
|
6,568 |
|
|
|
— |
|
|
Restructuring costs |
|
|
4,143 |
|
|
|
9,849 |
|
|
|
7,214 |
|
|
Loss on partial settlement of pension plan |
|
|
1,720 |
|
|
|
— |
|
|
|
— |
|
|
Income from operations |
|
|
80,987 |
|
|
|
47,546 |
|
|
|
64,214 |
|
|
Interest expense, net |
|
|
7,710 |
|
|
|
11,679 |
|
|
|
12,164 |
|
|
Loss on extinguishment of covertible debt |
|
|
1,797 |
|
|
|
1,989 |
|
|
|
— |
|
|
Other non-operating (income) expense, net |
|
|
353 |
|
|
|
(7 |
) |
|
|
963 |
|
|
Income before income taxes |
|
|
71,127 |
|
|
|
33,885 |
|
|
|
51,087 |
|
|
Provision for income taxes |
|
|
19,700 |
|
|
|
8,745 |
|
|
|
15,744 |
|
|
Net income |
|
|
51,427 |
|
|
|
25,140 |
|
|
|
35,343 |
|
|
Net loss (income) attributable to non-controlling interest |
|
|
— |
|
|
|
— |
|
|
|
63 |
|
|
Net income attributable to Altra Industrial Motion Corp. |
|
$ |
51,427 |
|
|
$ |
25,140 |
|
|
$ |
35,406 |
|
|
|
32
Segment Performance.
Amounts in thousands, except percentage data
|
|
|
Years Ended December 31, |
|
|||||||||
|
|
|
2017 |
|
|
2016 |
|
|
2015 |
|
|||
|
Net Sales: |
|
|
|
|
|
|
|
|
|
|
|
|
|
Couplings, Clutches & Brakes |
|
$ |
441,887 |
|
|
$ |
305,406 |
|
|
$ |
342,299 |
|
|
Electromagnetic Clutches & Brakes |
|
|
251,505 |
|
|
|
217,856 |
|
|
|
219,676 |
|
|
Gearing |
|
|
191,789 |
|
|
|
192,003 |
|
|
|
192,252 |
|
|
Intra-segment eliminations |
|
|
(8,444 |
) |
|
|
(6,359 |
) |
|
|
(7,575 |
) |
|
Net sales |
|
$ |
876,737 |
|
|
$ |
708,906 |
|
|
$ |
746,652 |
|
|
Income from operations: |
|
|
|
|
|
|
|
|
|
|
|
|
|
Segment earnings: |
|
|
|
|
|
|
|
|
|
|
|
|
|
Couplings, Clutches & Brakes |
|
$ |
47,215 |
|
|
$ |
20,941 |
|
|
$ |
38,750 |
|
|
Electromagnetic Clutches & Brakes |
|
|
27,774 |
|
|
|
26,406 |
|
|
|
21,634 |
|
|
Gearing |
|
|
22,238 |
|
|
|
22,718 |
|
|
|
21,094 |
|
|
Restructuring |
|
|
(4,143 |
) |
|
|
(9,849 |
) |
|
|
(7,214 |
) |
|
Corporate expenses |
|
|
(10,377 |
) |
|
|
(12,670 |
) |
|
|
(10,050 |
) |
|
Loss on the partial settlement of pension plan |
|
|
(1,720 |
) |
|
|
- |
|
|
|
- |
|
|
Income from operations |
|
$ |
80,987 |
|
|
$ |
47,546 |
|
|
$ |
64,214 |
|
Year Ended December 31, 2017 Compared with Year Ended December 31, 2016
|
Amounts in thousands, except percentage data |
|
Year Ended |
|
|||||||||||||
|
|
|
December 31, 2017 |
|
|
December 31, 2016 |
|
|
Change |
|
|
% |
|
||||
|
Net sales |
|
$ |
876,737 |
|
|
$ |
708,906 |
|
|
$ |
167,831 |
|
|
|
23.7 |
% |
Net Sales. The increase in sales during the year ended December 31, 2017 was primarily due to the acquisition of Stromag, price increases and higher sales levels in several end markets. Changes in foreign exchange rates also had a favorable impact on net sales of $2.0 million. Of the increase in sales, approximately $137.9 million related to the inclusion of additional sales as a result of the acquisition of Stromag. In addition, price increases contributed $6.2 million. The remainder of the increase related to a recovery in sales levels in various end markets in the Couplings, Clutches, and Brakes business segment.
|
Amounts in thousands, except percentage data |
|
Year Ended |
|
|||||||||||||
|
|
|
December 31, 2017 |
|
|
December 31, 2016 |
|
|
Change |
|
|
% |
|
||||
|
Gross Profit |
|
|
275,776 |
|
|
|
222,132 |
|
|
|
53,644 |
|
|
|
24.1 |
% |
|
Gross Profit as a percent of sales |
|
|
31.5 |
% |
|
|
31.3 |
% |
|
|
|
|
|
|
|
|
Gross profit. Gross profit as a percentage of sales improved slightly during the year ended December 31, 2017. The increase was due to improvements realized from our facility consolidations, price increases and improving end markets. The increase in gross profit was partially offset by the impact of acquired inventory related to the Stromag acquisition in the amount of $2.3 million which was recorded at fair value rather than cost. Absent this fair value adjustment the gross profit as a percent of sales for 2017 would have been 31.7%.
|
Amounts in thousands, except percentage data |
|
Year Ended |
|
|||||||||||||
|
|
|
December 31, 2017 |
|
|
December 31, 2016 |
|
|
Change |
|
|
% |
|
||||
|
Selling, general and administrative expense (“SG&A”) |
|
$ |
164,492 |
|
|
$ |
140,492 |
|
|
$ |
24,000 |
|
|
|
17.1 |
% |
|
SG&A as a percent of sales |
|
|
18.8 |
% |
|
|
19.8 |
% |
|
|
|
|
|
|
|
|
33
Selling, general and administrative expenses. The vast majority of the increase in SG&A was due to the inclusion of SG&A related to the Stromag business. The decline of SG&A as a percentage of sales is primarily due to facility consolidation and restructuring activities.
|
Amounts in thousands, except percentage data |
|
Year Ended |
|
|||||||||||||
|
|
|
December 31, 2017 |
|
|
December 31, 2016 |
|
|
Change |
|
|
% |
|
||||
|
Research and development expenses (“R&D”) |
|
$ |
24,434 |
|
|
$ |
17,677 |
|
|
$ |
6,757 |
|
|
|
38.2 |
% |
Research and development expenses. Research and development expenses increased due to the inclusion of Stromag for the year ended December 31, 2017. Research and development expenses remained consistent as a percentage of sales compared to the prior year. We expect research and development costs to approximate 2.0% - 3% of sales in future periods.
|
Amounts in thousands, except percentage data |
|
Year Ended |
|
|||||||||||||
|
|
|
December 31, 2017 |
|
|
December 31, 2016 |
|
|
Change |
|
|
% |
|
||||
|
Restructuring Costs |
|
$ |
4,143 |
|
|
$ |
9,849 |
|
|
$ |
(5,706 |
) |
|
|
(57.9 |
)% |
Restructuring costs.
During 2015 the Company adopted a restructuring plan (“2015 Altra Plan”) in response to weak demand in Europe and to make certain adjustments to improve business effectiveness, reduce the number of facilities and streamline the Company’s cost structure. The actions taken pursuant to the 2015 Altra Plan included reducing headcount, facility consolidations and related asset impairments and limiting discretionary spending to improve profitability. The Company does not expect to incur any additional material costs as a result of the 2015 Plan.
During the quarter ended September 30, 2017, the Company commenced a new restructuring plan (“2017 Altra Plan”) as a result of the Stromag acquisition and to rationalize its global renewable energy business. The actions taken pursuant to the 2017 Altra Plan include reducing headcount, facility consolidations and the elimination of certain costs. The company expects to incur approximately $2.0 to $4.0 in additional expense through 2019 related to the 2017 Altra Plan.
|
Amounts in thousands, except percentage data |
|
Year Ended |
|
|||||||||||||
|
|
|
December 31, 2017 |
|
|
December 31, 2016 |
|
|
Change |
|
|
% |
|
||||
|
Interest Expense, net |
|
$ |
7,710 |
|
|
$ |
11,679 |
|
|
$ |
(3,969 |
) |
|
|
(34.0 |
)% |
Interest expense. Interest expense decreased significantly during the period as a result of the conversion and redemption of our Convertible Notes, in December 2016 and January 2017, and the favorable impact of the cross currency interest rate swaps despite the higher borrowing under our 2015 Revolving Credit Facility from the Stromag Acquisition.
|
Amounts in thousands, except percentage data |
|
Year End |
|
|||||||||||||
|
|
|
December 31, 2017 |
|
|
December 31, 2016 |
|
|
Change |
|
|
% |
|
||||
|
Other non-operating expense (income), net |
|
$ |
353 |
|
|
$ |
(7 |
) |
|
$ |
360 |
|
|
|
(5142.9 |
)% |
Other non-operating expense (income). Other non-operating expense (income) in each period in the chart above relates primarily to changes in foreign currency, primarily the Euro, British Pound, and Chinese Renminbi.
|
Amounts in thousands, except percentage data |
|
Year Ended |
|
|||||||||||||
|
|
|
December 31, 2017 |
|
|
December 31, 2016 |
|
|
Change |
|
|
% |
|
||||
|
Provision for income taxes |
|
|
19,700 |
|
|
|
8,745 |
|
|
$ |
10,955 |
|
|
|
125.3 |
% |
|
Provision for income taxes as a % of income before income taxes |
|
|
27.7 |
% |
|
|
25.8 |
% |
|
|
|
|
|
|
|
|
Provision for income taxes. The provision for income tax during the year ended December 31, 2017 was higher than that of 2016 due to increased income in 2017 in higher tax rate jurisdictions. During 2016 there was an impairment of intangibles in the United States and a loss on the extinguishment of debt which resulted in lower taxable income in the Company’s’ highest tax rate jurisdiction which impacted the effective tax rate. The provision for income taxes for 2017 reflected an increase in the tax provision of $7.4 million based on the recognition of a provisional U.S. tax charge for the deemed repatriation of foreign earnings as a result of the Tax Cut and Jobs Act which was offset by the benefit of $7.8 million derived from the revaluation of net deferred tax liabilities.
34
Going forward, due to the lowering of the U.S. corporate income tax rate, the Company expects its consolidated tax rate to be approximately 25% to 27%.
Segment Performance
Couplings, Clutches & Brakes
Net sales in the Couplings, Clutches & Brakes segment were $441.9 million in the year ended December 31, 2017, an increase of approximately $136.5 million or 44.7%, from the year ended December 31, 2016. Approximately $115.6 million of the increase was due to the inclusion of sales from the newly acquired Stromag business for the year. The remainder of the increase was due to a modest recovery in certain end markets. Segment operating income increased by approximately $26.3 million compared to the prior year, primarily as a result of the addition of Stromag.
Electromagnetic Clutches & Brakes
Net sales in the Electromagnetic Clutches & Brakes segment were $251.5 million in the year ended December 31, 2017, an increase of approximately $33.6 million, or 15.4%, from the year ended December 31, 2016. Approximately $22.3 million of the increase was due to the inclusion of sales from the Stromag business for the year. Segment operating income increased $1.4 million compared to the prior year primarily as a result of the addition of Stromag.
Gearing
Net sales in the Gearing business segment were $191.8 million in the year ended December 31, 2017, which were similar to the prior year. Segment operating income decreased $0.5 million compared to the prior year primarily due to supply chain issues at the Bauer business and certain project work not repeating in 2017.
Year Ended December 31, 2016 Compared with Year Ended December 31, 2015
|
Amounts in thousands, except percentage data |
|
Year Ended |
|
|||||||||||||
|
|
|
December 31, 2016 |
|
|
December 31, 2015 |
|
|
Change |
|
|
% |
|
||||
|
Net sales |
|
$ |
708,906 |
|
|
$ |
746,652 |
|
|
$ |
(37,746 |
) |
|
|
(5.1 |
)% |
Net Sales. The decrease in sales during the year ended December 31, 2016 was due to the effect of foreign exchange rates, and lower sales levels in several end markets. Of the decrease in sales, approximately $11.7 million related to the impact of changes to foreign exchanges relates primarily related to the Euro, British Pound, and Chinese Renminbi compared to the prior year. In addition, $32.2 million related to decreased sales in various end markets, primarily oil and gas, and mining and agriculture in our Clutches, Couplings, and Brakes and Electromagnetic, Clutches and Brakes business segments. This was offset somewhat by increased revenues due to price increases of $6.2 million during the year.
|
Amounts in thousands, except percentage data |
|
Year Ended |
|
|||||||||||||
|
|
|
December 31, 2016 |
|
|
December 31, 2015 |
|
|
Change |
|
|
% |
|
||||
|
Gross Profit |
|
|
222,132 |
|
|
|
228,463 |
|
|
|
(6,331 |
) |
|
|
(2.8 |
)% |
|
Gross Profit as a percent of sales |
|
|
31.3 |
% |
|
|
30.6 |
% |
|
|
|
|
|
|
|
|
Gross profit. Gross profit as a percentage of sales improved slightly during the year ended December 31, 2016. This increase was due to improvements realized from our facility consolidation and costs saving efforts, partially offset by unfavorable product mix and redundant labor costs associated with ongoing consolidation activities.
|
Amounts in thousands, except percentage data |
|
Year Ended |
|
|||||||||||||
|
|
|
December 31, 2016 |
|
|
December 31, 2015 |
|
|
Change |
|
|
% |
|
||||
|
Selling, general and administrative expense (“SG&A”) |
|
|
140,492 |
|
|
|
139,217 |
|
|
$ |
1,275 |
|
|
|
0.9 |
% |
|
SG&A as a percent of sales |
|
|
19.8 |
% |
|
|
18.6 |
% |
|
|
|
|
|
|
|
|
35
Selling, general and administrative expenses. The vast majority of the increase in SG&A, approximately $1.7 million, was due to acquisition costs related to the Stromag acquisition which closed in December 2016. Acquisition costs for 2016 were $2.3 million. Increased acquisition costs were offset by the favorable effect of foreign exchange rates.
|
Amounts in thousands, except percentage data |
|
Year Ended |
|
|||||||||||||
|
|
|
December 31, 2016 |
|
|
December 31, 2015 |
|
|
Change |
|
|
% |
|
||||
|
Research and development expenses (“R&D”) |
|
$ |
17,677 |
|
|
$ |
17,818 |
|
|
$ |
(141 |
) |
|
|
(0.8 |
)% |
Research and development expenses. Research an development expenses remained consistent compared to the prior year.
|
Amounts in thousands, except percentage data |
|
Year Ended |
|
|||||||||||||
|
|
|
December 31, 2016 |
|
|
December 31, 2015 |
|
|
Change |
|
|
% |
|
||||
|
Restructuring Costs |
|
$ |
9,849 |
|
|
$ |
7,214 |
|
|
$ |
2,635 |
|
|
|
36.5 |
% |
Restructuring costs.
During the quarter ended March 31, 2015, the Company commenced a restructuring plan (“2015 Altra Plan”) as a result of weak demand in Europe and to make certain adjustments to improve business effectiveness, reduce the number of facilities and streamline the Company’s cost structure.
The 2015 Altra Plan was a comprehensive plan and focused on facility consolidations and overall cost structure. The Company initiated eight facility consolidations under the 2015 Altra Plan. The majority of the increase relates to $1.6 million of expense recorded in the Couplings, Clutches, and Brakes business segment related to the consolidation efforts at the Company’s facility in Green Bay, Wisconsin.
|
Amounts in thousands, except percentage data |
|
Year Ended |
|
|||||||||||||
|
|
|
December 31, 2016 |
|
|
December 31, 2015 |
|
|
Change |
|
|
% |
|
||||
|
Interest Expense, net |
|
$ |
11,679 |
|
|
$ |
12,164 |
|
|
$ |
(485 |
) |
|
|
(4.0 |
)% |
Interest expense. Net interest expense remained consistent between 2015 and 2016. The Company entered into an agreement to amend its 2015 Credit Agreement during October 2016 which increased the capacity under the Company’s 2015 Revolving Credit Facility. The Company borrowed additional funds under the expanded facility to finance the purchase of Stromag and also entered into the associated cross-currency interest rate swaps.
|
Amounts in thousands, except percentage data |
|
Year Ended |
|
|||||||||||||
|
|
|
December 31, 2016 |
|
|
December 31, 2015 |
|
|
Change |
|
|
% |
|
||||
|
Other non-operating expense/(income), net |
|
$ |
(7 |
) |
|
$ |
963 |
|
|
$ |
(970 |
) |
|
|
(100.7 |
)% |
Other non-operating (income) expense. Other non-operating expense (income) in each period in the chart above related primarily to realized changes in foreign currency, primarily the Euro and British Pound.
|
Amounts in thousands, except percentage data |
|
Year Ended |
|
|||||||||||||
|
|
|
December 31, 2016 |
|
|
December 31, 2015 |
|
|
Change |
|
|
% |
|
||||
|
Provision for income taxes |
|
|
8,745 |
|
|
|
15,744 |
|
|
$ |
(6,999 |
) |
|
|
(44.5 |
)% |
|
Provision for income taxes as a % of income before income taxes |
|
|
25.8 |
% |
|
|
30.8 |
% |
|
|
|
|
|
|
|
|
Provision for income taxes.
The provision for income tax, as a percentage of income before taxes, during the year ended December 31, 2016 was lower than that of 2015. The 2016 impairment of intangibles in the United States, and loss on the extinguishment of debt resulted in a lower
36
taxable income in the Company’s highest tax rate jurisdiction. The remainder of the decrease in the provision, as a percentage of income before taxes, was due to the continued benefits of the prior reorganization of our foreign subsidiaries.
Segment Performance
Couplings, Clutches & Brakes.
Net sales in the Couplings, Clutches & Brakes segment were $305.4 million in the year ended December 31, 2016, a decrease of approximately $36.9 million or 10.8%, from the year ended December 31, 2015. Approximately $7.1 million of the decrease was due to the impact of changes to foreign exchange rates primarily related to the British Pound and Chinese Renminbi compared to the prior year. The remaining decrease in sales was due primarily to weakness in the oil and gas, metals and mining markets of approximately $29.8 million compared to the prior period. Segment operating income decreased $17.8 million compared to the prior year primarily as a result of the impact of weakness in the oil and gas, metals and mining markets.
Electromagnetic Clutches & Brakes.
Net sales in the Electromagnetic Clutches & Brakes segment were $217.9 million in the year ended December 31, 2016, a decrease of approximately $1.8 million, or 0.8%, from the year ended December 31, 2015. The impact of changes to foreign exchange rates primarily related to the Chinese Renminbi and British Pound caused net sales to decrease by approximately $3.3 million compared to the prior year. Segment operating income increased $4.8 million compared to the prior year primarily as a result of the impact of restructuring activities initiated during 2015 and early 2016.
Gearing.
Net sales in the Gearing business segment were $192.0 million in the year ended December 31, 2016, compared with $192.3 million in the year ended December 31, 2015, a decrease of $0.3 million. Approximately $1.3 million of the decrease was due to the impact of changes to foreign exchange rates primarily related to the Euro and Chinese Renminbi compared to the prior year, partially offset by higher sales at our Bauer business. Gearing segment operating income increased $1.6 million compared to the prior year primarily as a result of productivity improvements.
Liquidity and Capital Resources
Overview
We finance our capital and working capital requirements through a combination of cash flows from operating activities and borrowings under our 2015 Revolving Credit Facility. We expect that our primary ongoing requirements for cash will be for working capital, debt service, capital expenditures, acquisitions, pensions, dividends and share repurchases. In the event additional funds are needed for operations, we could borrow additional funds available under our existing 2015 Revolving Credit Facility, request an expansion by up to $150 million of the amount available to be borrowed under the 2015 Credit Agreement, attempt to secure new debt, attempt to refinance our loans under the 2015 Credit Agreement, or attempt to raise capital in the equity markets. At December 31, 2017, we have the ability under our 2015 Revolving Credit Facility to borrow an additional $158.6 million based on current availability calculations. There can be no assurance however that additional debt financing will be available on commercially acceptable terms, if at all. Similarly, there can be no assurance that equity financing will be available on commercially acceptable terms, if at all.
Second Amended and Restated Credit Agreement
On October 22, 2015, the Company entered into a Second Amended and Restated Credit Agreement by and among the Company, Altra Industrial Motion Netherlands, B.V. (“Altra Netherlands”), one of the Company’s foreign subsidiaries (collectively with the Company, the “Borrowers”), the lenders party to the Second Amended and Restated Credit Agreement from time to time (collectively, the “Lenders”), J.P. Morgan Securities LLC, Wells Fargo Securities, LLC, and KeyBanc Capital Markets, Inc., as joint lead arrangers and joint bookrunners, and JPMorgan Chase Bank, N.A., as administrative agent (the “Administrative Agent”), to be guaranteed through a Guarantee Agreement by certain domestic subsidiaries of the Company (each a “Guarantor” and collectively the “Guarantors”; the Guarantors collectively with the Borrowers, the “Loan Parties”), and which may be amended from time to time (the “2015 Credit Agreement”). The 2015 Credit Agreement amends and restates the Company’s former Amended and Restated Credit Agreement, dated as of December 6, 2013, as amended (the “2013 Credit Agreement”), by and among the Company, and certain of its
37
domestic subsidiaries, including former subsidiary Altra Power Transmission, Inc., the lenders party to the Amended and Restated Credit Agreement from time to time (the “Former Lenders”), J.P. Morgan Securities LLC, Wells Fargo Securities, LLC, and KeyBanc Capital Markets, Inc., as joint lead arrangers and joint bookrunners, and the Administrative Agent, guaranteed by certain domestic subsidiaries of the Company. The 2013 Credit Agreement itself was an amendment and restatement of a prior credit agreement. Pursuant to the 2013 Credit Agreement, the Former Lenders had made available to the Borrowers a revolving credit facility (the “Prior Revolving Credit Facility”) of $200 million, continued in effect an existing term loan then having a balance of approximately $94 million, and made an additional term loan of €50.0 million to Altra Netherlands. The two term loans described in the prior sentence are collectively referred to as the “Term Loans”.
Under the 2015 Credit Agreement, the amount of the Prior Revolving Credit Facility was increased to $350 million (the “2015 Revolving Credit Facility”). The amounts available under the 2015 Revolving Credit Facility can be used for general corporate purposes, including acquisitions, and to repay existing indebtedness. A portion of the 2015 Revolving Credit Facility was used to repay the Term Loans. The Company wrote off approximately $0.5 million of financing costs in connection with the repayment.
The stated maturity of the 2015 Revolving Credit Facility was extended to October 22, 2020. The maturity of the Prior Revolving Credit Facility was December 6, 2018. The 2015 Credit Agreement continues to provide for a possible expansion of the credit facilities by an additional $150.0 million, which can be allocated as additional term loans and/or additional revolving credit loans.
The amounts available under the 2015 Revolving Credit Facility may be drawn upon in accordance with the terms of the 2015 Credit Agreement. All amounts outstanding under the 2015 Revolving Credit Facility are due on the stated maturity or such earlier time, if any, required under the 2015 Credit Agreement. The amounts owed under the 2015 Revolving Credit Facility may be prepaid at any time, subject to usual notification and breakage payment provisions. Interest on the amounts outstanding under the credit facilities is calculated using either an ABR Rate or Eurodollar Rate, plus the applicable margin. The applicable margins for Eurodollar Loans are between 1.25% to 2.00%, and for ABR Loans are between 0.25% and 1.00%. The amounts of the margins are calculated based on either a consolidated total net leverage ratio (as defined in the 2015 Credit Agreement), or the then applicable rating(s) of the Company’s debt if and then to the extent as provided in the 2015 Credit Agreement. A portion of the 2015 Revolving Credit Facility may also be used for the issuance of letters of credit, and a portion of the amount of the 2015 Revolving Credit Facility is available for borrowings in certain agreed upon foreign currencies. The 2015 Credit Agreement contains various affirmative and negative covenants and restrictions, which among other things, will require the Borrowers to provide certain financial reports to the Lenders, require the Company to maintain certain financial covenants relating to consolidated leverage and interest coverage, limit maximum annual capital expenditures, and limit the ability of the Company and its subsidiaries to incur or guarantee additional indebtedness, pay dividends or make other equity distributions, purchase or redeem capital stock or debt, make certain investments, sell assets, engage in certain transactions, and effect a consolidation or merger. The 2015 Credit Agreement also contains customary events of default.
On October 21, 2016, the Company entered into an agreement to amend its 2015 Credit Agreement. This amendment, which became effective upon closing of Altra’s purchase of Stromag, which was December 30, 2016, increased the Company’s 2015 Revolving Credit Facility by $75 million to $425 million. The Company borrowed additional funds under the increased facility to finance its purchase of Stromag. The amendment also reset the possible expansion of up to $150 million of additional future loan commitments. In addition, the amendment increased the multicurrency sublimit to $250 million and adjusted certain financial covenants.
Ratification Agreement
Pursuant to an Omnibus Reaffirmation and Ratification and Amendment of Collateral Documents entered into on October 22, 2015 in connection with the 2015 Credit Agreement by and among the Company, the Loan Parties and the Administrative Agent (the “Ratification Agreement”), the Loan Parties (exclusive of the foreign subsidiary Borrower) have reaffirmed their obligations to the Lenders under the Pledge and Security Agreement dated November 20, 2012 (the “Pledge and Security Agreement”), pursuant to which each Loan Party pledges, assigns and grants to the Administrative Agent, on behalf of and for the ratable benefit of the Lenders, a security interest in all of its right, title and interest in, to and under all personal property, whether now owned by or owing to, or after acquired by or arising in favor of such Loan Party (including under any trade name or derivations), and whether owned or consigned by or to, or leased from or to, such Loan Party, and regardless of where located, except for specific excluded personal property identified in the Pledge and Security Agreement (collectively, the “Collateral”). Notwithstanding the foregoing, the Collateral does not include, among other items, more than 65% of the capital stock of the first tier foreign subsidiaries of the Company. The Pledge and Security Agreement contains other customary representations, warranties and covenants of the parties. The 2015 Credit Agreement provides that the obligation to grant the security interest can cease upon the obtaining of certain corporate family credit ratings for the Company, but the obligation to grant a security interest is subject to subsequent reinstatement if the ratings are not maintained as provided in the 2015 Credit Agreement.
38
Pursuant to the Ratification Agreement, the Loan Parties (other than the foregoing subsidiary Borrower) have also reaffirmed their obligations under each of the Patent Security Agreement and a Trademark Security Agreement in favor of the Administrative Agent dated November 20, 2012 (the “2012 Security Agreements”) pursuant to which each of the Loan Parties signatory thereto pledges, assigns and grants to the Administrative Agent, on behalf of and for the ratable benefit of the Lenders, a security interest in all of its right, title and interest in, to and under all registered patents, patent applications, registered trademarks and trademark applications owned by such Loan Parties.
Additional Trademark Security Agreement and Patent Security Agreement
In connection with the reaffirmation of the Pledge and Security Agreement, certain of the Loan Parties delivered a new Patent Security Agreement and a new Trademark Security Agreement in favor of the Administrative Agent pursuant to which each of the Loan Parties signatory thereto pledges, assigns and grants to the Administrative Agent, on behalf of and for the ratable benefit of the Lenders, a security interest in all of its right, title and interest in, to and under all registered patents, patent applications, registered trademarks and trademark applications owned by such Loan Parties and not covered by the 2012 Security Agreements.
As of December 31, 2017 and 2016 we had $262.9 million and $313.6 million outstanding on our 2015 Revolving Credit Facility, respectively. As of December 31, 2017 and 2016, we had $3.5 million and $4.1 million in letters of credit outstanding, respectively. We were in compliance in all material respects with all covenants of the indenture governing the 2015 Credit Agreement at December 31, 2017.
Convertible Senior Notes
In March 2011, the Company issued 2.75% Convertible Senior Notes (the “Convertible Notes”) due March 1, 2031. The Convertible Notes were guaranteed by the Company’s U.S. domestic subsidiaries. Interest on the Convertible Notes was payable semi-annually in arrears, on March 1 and September 1 of each year, commencing on September 1, 2011 at an annual rate of 2.75%. Proceeds from the offering were $81.3 million, net of fees and expenses that were capitalized.
On December 12, 2016, the Company gave notice to The Bank of New York Mellon Trust Company, N.A., the Trustee, under the Indenture governing the Convertible Notes of its intention to redeem all of the Convertible Notes outstanding on January 12, 2017 (the “Redemption Date”), pursuant to the optional redemption provisions in the Indenture. The redemption price for the Convertible Notes was 100% of the principal amount thereof, plus accrued and unpaid interest, if any, to, but not including, the Redemption Date plus a Make-Whole Premium equal to the present values of the remaining scheduled payments of interest on any Convertible Notes through March 1, 2018 (excluding interest accrued to, but excluding, the Redemption Date). In lieu of receiving the redemption price, holders of the Notes could surrender their Convertible Notes for conversion at any time before January 9, 2017. The Conversion Rate of the notes was 39.0809 shares of the Company’s common stock for each $1,000 of outstanding principal of the Convertible Notes. As of December 31, 2016, Convertible Notes with a principal value of approximately $39.3 million were surrendered for conversion resulting in the issuance of approximately 1.5 million shares. As a result of the conversion, the Company incurred a loss on extinguishment of debt of approximately $1.9 million and the carrying value of the remaining Convertible Notes was $42.9 million net of unamortized discount as of December 31, 2016. In January 2017, additional Convertible Notes with an outstanding principal of approximately $44.7 million were converted resulting in the issuance of 1.7 million shares of the Company’s common stock, and $0.9 million of Convertible Notes were redeemed for cash. The Company incurred an additional loss on extinguishment of debt of approximately $1.8 million during the quarter ended March 31, 2017. All Convertible Notes were converted or redeemed as of January 12, 2017.
Borrowings
|
|
|
Amounts in millions |
|
|||||
|
|
|
December 31, 2017 |
|
|
December 31, 2016 |
|
||
|
Debt: |
|
|
|
|
|
|
|
|
|
2015 Revolving Credit Facility |
|
$ |
262.9 |
|
|
$ |
313.6 |
|
|
Convertible Notes |
|
|
— |
|
|
|
45.7 |
|
|
Mortgages |
|
|
12.8 |
|
|
|
12.7 |
|
|
Capital leases |
|
|
0.2 |
|
|
|
0.4 |
|
|
Total debt |
|
$ |
275.9 |
|
|
$ |
372.4 |
|
39
Cash and Cash Equivalents
The following is a summary of our cash balances and cash flows (in thousands) as of and for the years ended December 31, 2017 and 2016, respectively.
|
|
|
2017 |
|
|
2016 |
|
|
Change |
|
|||
|
Cash and cash equivalents at the beginning of the year |
|
$ |
69,118 |
|
|
$ |
50,320 |
|
|
$ |
18,798 |
|
|
Cash flows provided by (used in) operating activities |
|
|
80,581 |
|
|
|
76,641 |
|
|
$ |
3,940 |
|
|
Cash flows provided by (used in) in investing activities |
|
|
(26,722 |
) |
|
|
(206,908 |
) |
|
$ |
180,186 |
|
|
Cash flows provided by (used in) financing activities |
|
|
(74,048 |
) |
|
|
149,772 |
|
|
$ |
(223,820 |
) |
|
Effect of exchange rate changes on cash and cash equivalents |
|
|
3,065 |
|
|
|
(707 |
) |
|
$ |
3,772 |
|
|
Cash and cash equivalents at the end of the period |
|
$ |
51,994 |
|
|
$ |
69,118 |
|
|
$ |
(17,124 |
) |
Cash Flows for 2017
Funds provided by operating activities totaled approximately $80.6 million for fiscal 2017, a significant portion of which resulted from cash provided by net income of $51.4 million. In addition, the net impact of the add-back of certain non-cash items including depreciation, amortization, stock-based compensation, loss on disposal of fixed assets, loss on impairment of intangibles, loss on extinguishment of debt, loss on settlement of partial pension plan, deferred financing costs, provision for deferred taxes, amortization of inventory fair value adjustment, and non-cash gain on foreign currency was approximately $40.7 million. This was partially offset by a net increase in current assets and liabilities of approximately $11.5 million.
Net cash used in investing activities for the year ended December 31, 2017 decreased approximately $180.2 million due to the acquisition of Stromag in December 2016 for $188.0 million, net of cash received.
Net cash used in financing activites in the year ended December 31, 2017 as compared to the year to date period ended December 31, 2016 decreased $223.8 million. In December 2016 we borrowed approximately $200 million under our 2015 Revolving Credit Facility for the Stromag Acquisition. In 2017, we have used our cash to pay down approximately $51.6 million of debt.
We intend to use our remaining cash and cash equivalents and cash flow from operations to provide for our working capital needs, to fund potential future acquisitions, to service our debt, including principal payments, for capital expenditures, for pension funding, for share repurchases and to pay dividends to our stockholders. As of December 31, 2017, we have approximately $44.9 million of cash and cash equivalents held by foreign subsidiaries that are subject to the Transition Toll Tax under the 2017 Tax Act, see Note 7. We believe our future operating cash flows will be sufficient to meet our future operating and investing cash needs. Furthermore, the existing cash balances and the availability of additional borrowings under our 2015 Revolving Credit Facility provide additional potential sources of liquidity should they be required.
Cash Flows for 2016
Amounts in thousands, except percentage data
|
|
|
2016 |
|
|
2015 |
|
|
Change |
|
|||
|
Cash and cash equivalents at the beginning of the period |
|
$ |
50,320 |
|
|
$ |
47,503 |
|
|
$ |
2,817 |
|
|
Cash flows from operating activities |
|
|
76,641 |
|
|
|
86,816 |
|
|
$ |
(10,175 |
) |
|
Cash flows from investing activities |
|
|
(206,908 |
) |
|
|
(21,705 |
) |
|
$ |
(185,203 |
) |
|
Cash flows from financing activities |
|
|
149,772 |
|
|
|
(55,783 |
) |
|
$ |
205,555 |
|
|
Effect of exchange rate changes on cash and cash equivalents |
|
|
(707 |
) |
|
|
(6,511 |
) |
|
|
5,804 |
|
|
Cash and cash equivalents at the end of the period |
|
$ |
69,118 |
|
|
$ |
50,320 |
|
|
$ |
18,798 |
|
Funds provided by operating activities totaled approximately $76.6 million for fiscal 2016, a significant portion of which resulted from cash provided by net income of $25.1 million. In addition, the net impact of the add-back of certain non-cash items including depreciation, amortization, stock-based compensation, accretion of debt discount, gain on disposal of fixed assets, loss on impairment of intangibles, loss on extinguishment of debt, deferred financing costs, provision for deferred taxes, and non-cash gain on foreign currency was approximately $46.6 million. The remainder of the funds were generated by a net decrease in current assets and liabilities of approximately $4.9 million.
40
Cash flows from operating activities decreased approximately $10.2 million primarily due from a decrease in net income of approximately $10.2 million. The decrease is primarily due to the decline in sales and the increase in restructuring expenses.
The change in net cash used in investing activities was primarily due to the acquisition of Stromag in December 2016 for $188.0 million, net of cash received.
The increase in net cash from financing activities was primarily due to the additional borrowing of approximately $200 million under our 2015 Revolving Credit Facility for the Stromag Acquisition offset by payments on the 2015 Revolving Credit Facility.
Capital Expenditures
We made capital expenditures of approximately $32.8 million and $18.9 million in the years ended December 31, 2017 and 2016, respectively. The increase in capital expenditures during 2017 was due to construction costs in 2017 at three of our facilities. These capital expenditures will support on-going business needs. In 2018, we forecast capital expenditures to be in the range of $25.0 million to $27.0 million.
Off-Balance Sheet Arrangements
We do not have any off-balance sheet arrangements that provide liquidity, capital resources, market or credit risk support that expose us to any liability that is not reflected in our consolidated financial statements.
Contractual Obligations
The following table is a summary of our contractual cash obligations as of December 31, 2017 (in thousands):
|
|
|
Payments Due by Period |
|
|||||||||||||||||||||||||
|
|
|
2018 |
|
|
2019 |
|
|
2020 |
|
|
2021 |
|
|
2022 |
|
|
Thereafter |
|
|
Total |
|
|||||||
|
Operating leases |
|
|
8,168 |
|
|
|
6,550 |
|
|
|
5,017 |
|
|
|
3,884 |
|
|
|
2,704 |
|
|
|
4,539 |
|
|
|
30,862 |
|
|
Capital leases |
|
|
148 |
|
|
|
72 |
|
|
|
3 |
|
|
|
— |
|
|
|
— |
|
|
|
— |
|
|
|
223 |
|
|
Heidelberg Germany mortgage(1) |
|
|
218 |
|
|
|
218 |
|
|
|
218 |
|
|
|
218 |
|
|
|
218 |
|
|
|
278 |
|
|
|
1,368 |
|
|
Esslingen Germany mortgage(2) |
|
|
— |
|
|
|
— |
|
|
|
7,118 |
|
|
|
— |
|
|
|
— |
|
|
|
— |
|
|
|
7,118 |
|
|
Zlate Moravce, Slovakia(3) |
|
|
582 |
|
|
|
582 |
|
|
|
582 |
|
|
|
582 |
|
|
|
— |
|
|
|
— |
|
|
|
2,328 |
|
|
Angers France mortgage(4) |
|
|
242 |
|
|
|
242 |
|
|
|
242 |
|
|
|
242 |
|
|
|
242 |
|
|
|
778 |
|
|
|
1,988 |
|
|
2015 Revolving Credit Facility(5) |
|
|
— |
|
|
|
— |
|
|
|
262,915 |
|
|
|
— |
|
|
|
— |
|
|
|
— |
|
|
|
262,915 |
|
|
Total contractual cash obligations |
|
$ |
9,358 |
|
|
$ |
7,664 |
|
|
$ |
276,095 |
|
|
$ |
4,926 |
|
|
$ |
3,164 |
|
|
$ |
5,595 |
|
|
$ |
306,802 |
|
|
(1) |
A foreign subsidiary of the Company entered into a mortgage with a bank for €1.5 million, or $1.7 million, secured by its facility in Heidelberg, Germany to replace its previously existing mortgage during the quarter ended September 30, 2015. The mortgage has an interest rate of 1.79% which is payable in monthly installments through August 2023. The mortgage has a remaining principal balance of €1.3 million, or $1.4 million, at December 31, 2017. |
|
(2) |
A foreign subsidiary of the Company entered into a mortgage with a bank to borrow €6.0 million, or $6.7 million, for the expansion of its facility in Esslingen, Germany during August 2014. The mortgage has an interest rate of 2.5% per year which is payable in annual interest payments of €0.1 million or $0.1 million to be paid in monthly installments which are not included in the table above. The mortgage has a remaining principal balance of €6.0 million, or $7.1 million, at December 31, 2017. The principal portion of the mortgage will be due in a lump-sum payment in May 2019. |
|
(3) |
During 2016, a foreign subsidiary of the Company entered into a loan with a bank to equip its facility in Zlate Moravce, Slovakia. As of December 31, 2017, the total principal outstanding was €1.9 million, or $2.3 million, and is guaranteed by land security at its parent company facility in Esslingen, Germany. The loan is due in installments through 2020, with an interest rate of 1.95%. |
|
(4) |
A foreign subsidiary of the Company entered into a mortgage with a bank for €2.0 million, or $2.3 million, for the expansion of its facility in Angers, France. The mortgage has an interest rate of 1.85% per year which is payable in monthly installments from June 2016 until May 2025. The mortgage has a balance of €1.9 million, or $2.0 million, at December 31, 2017. |
41
|
(5) |
We have up to $425.0 million of total borrowing capacity, through October 22, 2020, under our 2015 Revolving Credit Facility of which $158.6 million is currently available. As of December 31, 2017 and 2016, there were $3.5 million and $4.1 million, respectively, of outstanding letters of credit under our 2015 Revolving Credit Facility. We have variable monthly and/or quarterly cash interest requirements due on the 2015 Revolving Credit Facility through October 2020, which are not included in the above table. |
From time to time, we may have cash funding requirements associated with our pension plans. As of December 31, 2017, there were no requirements for 2018 to 2022 which are not included in the above table. These amounts are based on actuarial assumptions and actual amounts could be materially different.
We may be required to make cash outlays related to our unrecognized tax benefits. However, due to the uncertainty of the timing of future cash flows associated with our unrecognized tax benefits, we are unable to make reasonably reliable estimates of the period of cash settlement, if any, with the respective taxing authorities.
Stock-based Compensation
The Company's 2004 Equity Incentive Plan (the “2004 Plan”) permitted the grant of various forms of stock based compensation to our officers and senior level employees. The 2004 Plan expired in 2014 and, upon expiration, there were 750,576 shares subject to outstanding awards under the 2004 Plan. The 2014 Omnibus Incentive Plan (the “2014 Plan”) was approved by the Company's stockholders at its 2014 annual meeting. The 2014 Plan provides for various forms of stock based compensation to our directors, executive personnel and other key employees and consultants. Under the 2014 Plan, the total number of shares of common stock available for delivery pursuant to the grant of awards (“Awards”) was originally 750,000. Shares of our common stock subject to Awards or grants awarded under the 2004 Plan and outstanding as of the effective date of the 2014 Plan (except for substitute awards) that terminate without being exercised, expire, are forfeited or canceled, are exchanged for Awards that did not involve shares of common stock, are not issued on the stock settlement of a stock appreciation right, are withheld by the Company or tendered by a participant (either actually or by attestation) to pay an option exercise price or to pay the withholding tax on any Award, or are settled in cash in lieu of shares will again be available for Awards under the 2014 Plan. An amendment to the 2014 Plan to, among other things, make an additional 750,000 shares of common stock available for grant under the 2014 Plan was approved by the Company’s stockholders at its 2017 Annual Meeting.
As of December 31, 2017, there were 221,313 shares of unvested restricted stock outstanding under the 2004 Plan and the 2014 Plan. The remaining compensation cost to be recognized through 2020 is $4.4 million. Based on the stock price at December 31, 2017, of $50.40 per share, the intrinsic value of these awards as of December 31, 2017, was $11.2 million.
Income Taxes
We are subject to taxation in multiple jurisdictions throughout the world. Our effective tax rate and tax liability will be affected by a number of factors, such as the amount of taxable income in particular jurisdictions, the tax rates in such jurisdictions, tax treaties between jurisdictions, the extent to which we transfer funds between jurisdictions and repatriate income, and changes in law. Generally, the tax liability for each legal entity is determined either (a) on a non-consolidated and non-combined basis or (b) on a consolidated and combined basis only with other eligible entities subject to tax in the same jurisdiction, in either case without regard to the taxable losses of non-consolidated and non-combined affiliated entities. As a result, we may pay income taxes to some jurisdictions even though on an overall basis we incur a net loss for the period.
On December 22, 2017, the Tax Cuts and Jobs Act of 2017 (the “U.S. Tax Act”) was signed into law, making significant changes to the Internal Revenue Code. Changes include, but are not limited to, a U.S. federal corporate tax rate decrease from 35% to 21% effective for tax years beginning after December 31, 2017, the transition of U.S. international taxation from a worldwide tax system to a territorial system, and a one-time transition tax on the mandatory deemed repatriation of cumulative foreign earnings as of December 31, 2017. We have calculated our best estimate of the impact of the U.S. Tax Act in our year end income tax provision in accordance with guidance available as of the date of this filing. The provisional amount related to the one-time transition tax on the mandatory deemed repatriation of foreign earnings was $7.4 million. In addition, we recognized a benefit totaling $7.8 million upon the remeasurement of our net deferred tax liabilities from 35% to 21%.
Seasonality
We experience seasonality in our turf and garden business, which represented approximately 7.0% of our net sales. As our large OEM customers prepare for the spring season, our shipments generally start increasing in December, peak in February and March, and begin to decline in April and May. This allows our customers to have inventory in place for the peak consumer purchasing periods for
42
turf and garden products. The June-through-November period is typically the low season for us and our customers in the turf and garden market. Seasonality is also affected by weather and the level of housing starts.
Inflation
Inflation can affect the costs of goods and services we use. The majority of the countries that are of significance to us, from either a manufacturing or sales viewpoint, have in recent years enjoyed relatively low inflation although recently reports have suggested that certain economic data point to the potential for inflation to increase in future periods. The competitive environment in which we operate inevitably creates pressure on us to provide our customers with cost-effective products and services.
We are exposed to various market risk factors such as fluctuating interest rates, changes in foreign currency rates and changes in commodity prices. At present, with the exception of the interest rate swap described below, we do not utilize any other derivative instruments to manage these risks.
Currency translation. We are exposed to market risk from changes in foreign currency exchange rates primarily in connection with our foreign subsidiaries. The results of operations of our foreign subsidiaries are translated into U.S. Dollars at the average exchange rates for each period concerned. The balance sheets of foreign subsidiaries are translated into U.S. Dollars at the exchange rates in effect at the end of each period. Any adjustments resulting from the translation are recorded as other comprehensive income. For the year ended December 31, 2017, approximately 40% of our revenues and approximately 28% of our total operating income were denominated in foreign currencies.
We have performed a sensitivity analysis assuming a hypothetical 10% adverse movement in foreign currency exchange rates from the quoted foreign currency exchange rates at December 31, 2017. As of December 31, 2017, the analysis indicated that such an adverse movement would cause our revenues and operating income to fluctuate by approximately 4.6% and 2.8%, respectively.
Currency transaction exposure. Currency transaction exposure arises where actual sales, purchases and financing transactions are made by a business or company in a currency other than its own functional currency. Any transactional differences at an international location are recorded in net income on a monthly basis. In connection with the Stromag Acquisition, a subsidiary of the Company borrowed $170.0 million which is not the functional currency of the borrower or Stromag. We entered into cross-currency interest rate swaps in 2016 to manage the cash flow risk caused by foreign exchange changes on outstanding borrowings.
Interest rate risk. We are subject to market exposure to changes in interest rates on some of our financing activities. This exposure relates to borrowings under our 2015 Revolving Credit Facility that are subject to variable interest rates. Interest on the amounts outstanding under the credit facilities is calculated using either an ABR Rate or Eurodollar rate, plus the applicable margin. As of December 31, 2017, we had $262.9 million in borrowings under our 2015 Revolving Credit Facility. A hypothetical change in interest rates of 1% on our outstanding variable rate debt would increase our annual interest expense by approximately $2.7 million. We have entered into interest rate swap agreements with respect to approximately $50 million of our variable interest rate borrowings and as a result those borrowings would not be impacted by such a hypothetical change in interest rates.
We rely on interest rate swap contracts and hedging arrangements to effectively manage our interest rate risk. We entered into cross-currency interest rate swaps in 2016 to manage the cash flow risk caused by interest rate and foreign exchange changes on outstanding borrowings under the 2015 Credit Agreement of $130.0 million related to the Company’s foreign financing of the Stromag Acquisition. We are exposed to credit loss in the event of non-performance by the swap counterparty. With other variables held constant, a hypothetical 50 basis point increase in the Euro swap curve would have resulted in a decrease of approximately $1.2 million in the fair value of these swaps, while a 10% increase in the foreign exchange rate between the Euro and US Dollar would have resulted in a decrease of approximately $15.4 million in the fair value of these swaps.
Commodity price exposure. We have exposure to changes in commodity prices principally related to metals including steel, copper and aluminum. We primarily manage our risk associated with such increases through the use of surcharges or general pricing increases for the related products. We do not engage in the use of financial instruments to hedge our commodities price exposure.
43
REPORT OF INDEPENDENT REGISTERED PUBLIC ACCOUNTING FIRM
To the Stockholders and the Board of Directors of
Altra Industrial Motion Corp.
Opinion on the Financial Statements
We have audited the accompanying consolidated balance sheets of Altra Industrial Motion Corp. and subsidiaries (the "Company") as of December 31, 2017 and 2016, and the related consolidated statements of income, comprehensive income, stockholders' equity, and cash flows, for each of the three years in the period ended December 31, 2017, and the related notes and the financial statement schedule listed in the Index at Item 15 (collectively referred to as the "financial statements"). In our opinion, the financial statements present fairly, in all material respects, the financial position of the Company as of December 31, 2017 and 2016, and the results of its operations and its cash flows for each of the three years in the period ended December 31, 2017, in conformity with accounting principles generally accepted in the United States of America.
We have also audited, in accordance with the standards of the Public Company Accounting Oversight Board (United States) (PCAOB), the Company's internal control over financial reporting as of December 31, 2017, based on criteria established in Internal Control — Integrated Framework (2013) issued by the Committee of Sponsoring Organizations of the Treadway Commission and our report dated February 23, 2018 expressed an unqualified opinion on the Company's internal control over financial reporting.
Basis for Opinion
These financial statements are the responsibility of the Company's management. Our responsibility is to express an opinion on the Company's financial statements based on our audits. We are a public accounting firm registered with the PCAOB and are required to be independent with respect to the Company in accordance with the U.S. federal securities laws and the applicable rules and regulations of the Securities and Exchange Commission and the PCAOB.
We conducted our audits in accordance with the standards of the PCAOB. Those standards require that we plan and perform the audit to obtain reasonable assurance about whether the financial statements are free of material misstatement, whether due to error or fraud. Our audits included performing procedures to assess the risks of material misstatement of the financial statements, whether due to error or fraud, and performing procedures that respond to those risks. Such procedures included examining, on a test basis, evidence regarding the amounts and disclosures in the financial statements. Our audits also included evaluating the accounting principles used and significant estimates made by management, as well as evaluating the overall presentation of the financial statements. We believe that our audits provide a reasonable basis for our opinion.
/s/ Deloitte & Touche LLP
Boston, Massachusetts
February 23, 2018
We have served as the Company's auditor since 2009.
44
ALTRA INDUSTRIAL MOTION CORP.
Consolidated Balance Sheets
Amounts in thousands, except share and per share amounts
|
|
|
December 31, |
|
|||||
|
|
|
2017 |
|
|
2016 |
|
||
|
ASSETS |
|
|
|
|
|
|
|
|
|
Current assets: |
|
|
|
|
|
|
|
|
|
Cash and cash equivalents |
|
$ |
51,994 |
|
|
$ |
69,118 |
|
|
Trade receivables, less allowance for doubtful accounts of $4,542 and $3,114 at December 31, 2017 and December 31, 2016, respectively |
|
|
135,499 |
|
|
|
120,319 |
|
|
Inventories |
|
|
145,611 |
|
|
|
139,840 |
|
|
Income tax receivable |
|
|
6,634 |
|
|
|
607 |
|
|
Prepaid expenses and other current assets |
|
|
17,344 |
|
|
|
10,429 |
|
|
Assets held for sale |
|
|
1,081 |
|
|
|
3,874 |
|
|
Total current assets |
|
|
358,163 |
|
|
|
344,187 |
|
|
Property, plant and equipment, net |
|
|
191,918 |
|
|
|
177,043 |
|
|
Intangible assets, net |
|
|
159,613 |
|
|
|
154,683 |
|
|
Goodwill |
|
|
206,040 |
|
|
|
188,841 |
|
|
Deferred income taxes |
|
|
2,608 |
|
|
|
2,510 |
|
|
Other non-current assets, net |
|
|
2,315 |
|
|
|
2,560 |
|
|
Total assets |
|
$ |
920,657 |
|
|
$ |
869,824 |
|
|
LIABILITIES AND STOCKHOLDERS’ EQUITY |
|
|
|
|
|
|
|
|
|
Current liabilities: |
|
|
|
|
|
|
|
|
|
Accounts payable |
|
$ |
68,014 |
|
|
$ |
60,845 |
|
|
Accrued payroll |
|
|
32,091 |
|
|
|
31,302 |
|
|
Accruals and other current liabilities |
|
|
32,921 |
|
|
|
35,080 |
|
|
Income tax payable |
|
|
9,082 |
|
|
|
706 |
|
|
Current portion of long-term debt |
|
|
384 |
|
|
|
43,690 |
|
|
Total current liabilities |
|
|
142,492 |
|
|
|
171,623 |
|
|
Long-term debt - less current portion |
|
|
275,587 |
|
|
|
325,969 |
|
|
Deferred income taxes |
|
|
52,250 |
|
|
|
61,084 |
|
|
Pension liabilities |
|
|
25,038 |
|
|
|
23,691 |
|
|
Long-term taxes payable |
|
|
6,322 |
|
|
|
694 |
|
|
Other long-term liabilities |
|
|
22,263 |
|
|
|
3,415 |
|
|
Commitments and Contingencies (See Note 14) |
|
|
|
|
|
|
|
|
|
Stockholders’ equity: |
|
|
|
|
|
|
|
|
|
Common stock ($0.001 par value, 90,000,000 shares authorized, 29,058,117 and 27,206,162 issued and outstanding at December 31, 2017 and 2016, respectively) |
|
|
29 |
|
|
|
27 |
|
|
Additional paid-in capital |
|
|
223,336 |
|
|
|
168,299 |
|
|
Retained earnings |
|
|
223,204 |
|
|
|
191,108 |
|
|
Accumulated other comprehensive loss |
|
|
(49,864 |
) |
|
|
(76,086 |
) |
|
Total stockholders’ equity |
|
|
396,705 |
|
|
|
283,348 |
|
|
Total liabilities and stockholders’ equity |
|
$ |
920,657 |
|
|
$ |
869,824 |
|
The accompanying notes are an integral part of these consolidated financial statements.
45
ALTRA INDUSTRIAL MOTION CORP.
Consolidated Statements of Income
Amounts in thousands, except per share data
|
|
|
|
|
Years Ended December 31, |
|
|||||||||||
|
|
|
|
|
2017 |
|
|
2016 |
|
|
|
|
2015 |
|
|||
|
|
|
|
|
|
|
|
|
|
|
|
|
|
|
|
|
|
|
Net sales |
|
|
|
$ |
876,737 |
|
|
$ |
708,906 |
|
|
|
|
$ |
746,652 |
|
|
Cost of sales |
|
|
|
|
600,961 |
|
|
|
486,774 |
|
|
|
|
|
518,189 |
|
|
Gross profit |
|
|
|
|
275,776 |
|
|
|
222,132 |
|
|
|
|
|
228,463 |
|
|
Operating expenses: |
|
|
|
|
|
|
|
|
|
|
|
|
|
|
|
|
|
Selling, general and administrative expenses |
|
|
|
|
164,492 |
|
|
|
140,492 |
|
|
|
|
|
139,217 |
|
|
Research and development expenses |
|
|
|
|
24,434 |
|
|
|
17,677 |
|
|
|
|
|
17,818 |
|
|
Impairment of intangible assets |
|
|
|
|
— |
|
|
|
6,568 |
|
|
|
|
|
— |
|
|
Restructuring costs |
|
|
|
|
4,143 |
|
|
|
9,849 |
|
|
|
|
|
7,214 |
|
|
Loss on partial settlement of pension plan |
|
|
|
|
1,720 |
|
|
|
— |
|
|
|
|
|
— |
|
|
|
|
|
|
|
194,789 |
|
|
|
174,586 |
|
|
|
|
|
164,249 |
|
|
Income from operations |
|
|
|
|
80,987 |
|
|
|
47,546 |
|
|
|
|
|
64,214 |
|
|
Other non-operating income and expense: |
|
|
|
|
|
|
|
|
|
|
|
|
|
|
|
|
|
Interest expense, net |
|
|
|
|
7,710 |
|
|
|
11,679 |
|
|
|
|
|
12,164 |
|
|
Loss on extinguishment of convertible debt |
|
|
|
|
1,797 |
|
|
|
1,989 |
|
|
|
|
|
|
|
|
Other non-operating expense (income), net |
|
|
|
|
353 |
|
|
|
(7 |
) |
|
|
|
|
963 |
|
|
|
|
|
|
|
9,860 |
|
|
|
13,661 |
|
|
|
|
|
13,127 |
|
|
Income before income taxes |
|
|
|
|
71,127 |
|
|
|
33,885 |
|
|
|
|
|
51,087 |
|
|
Provision for income taxes |
|
|
|
|
19,700 |
|
|
|
8,745 |
|
|
|
|
|
15,744 |
|
|
Net income |
|
|
|
|
51,427 |
|
|
|
25,140 |
|
|
|
|
|
35,343 |
|
|
Net loss attributable to non-controlling interest |
|
|
|
|
— |
|
|
|
— |
|
|
|
|
|
63 |
|
|
Net income attributable to Altra Industrial Motion Corp. |
|
|
|
$ |
51,427 |
|
|
$ |
25,140 |
|
|
|
|
$ |
35,406 |
|
|
Weighted average shares, basic |
|
|
|
|
28,949 |
|
|
|
25,719 |
|
|
|
|
|
26,064 |
|
|
Weighted average shares, diluted |
|
|
|
|
29,064 |
|
|
|
25,872 |
|
|
|
|
|
26,109 |
|
|
Net income per share: |
|
|
|
|
|
|
|
|
|
|
|
|
|
|
|
|
|
Basic net income attributable to Altra Industrial Motion Corp. |
|
|
|
$ |
1.78 |
|
|
$ |
0.97 |
|
|
|
|
$ |
1.36 |
|
|
Diluted net income attributable to Altra Industrial Motion Corp. |
|
|
|
$ |
1.77 |
|
|
$ |
0.97 |
|
|
|
|
$ |
1.36 |
|
|
Cash dividend declared per share |
|
|
|
$ |
0.66 |
|
|
$ |
0.60 |
|
|
|
|
$ |
0.57 |
|
The accompanying notes are an integral part of these consolidated financial statements.
46
ALTRA INDUSTRIAL MOTION CORP.
Consolidated Statements of Comprehensive Income
Amounts in thousands, except per share data
|
|
|
Years Ended December 31, |
|
|||||||||||
|
|
|
2017 |
|
|
2016 |
|
|
|
|
2015 |
|
|||
|
|
|
|
|
|
|
|
|
|
|
|
|
|
|
|
|
Net income |
|
$ |
51,427 |
|
|
$ |
25,140 |
|
|
|
|
$ |
35,343 |
|
|
Other comprehensive income (loss): |
|
|
|
|
|
|
|
|
|
|
|
|
|
|
|
Reclassification adjustment from loss on partial settlement of pension plan, net of tax |
|
|
1,066 |
|
|
|
- |
|
|
|
|
|
- |
|
|
Pension liability adjustment, net of tax |
|
|
924 |
|
|
|
139 |
|
|
|
|
|
(989 |
) |
|
Change in fair value of interest rate swap, net of tax |
|
|
194 |
|
|
|
(506 |
) |
|
|
|
|
(283 |
) |
|
Foreign currency translation adjustment, net of tax |
|
|
24,038 |
|
|
|
(11,887 |
) |
|
|
|
|
(20,735 |
) |
|
Total comprehensive income |
|
|
77,649 |
|
|
|
12,886 |
|
|
|
|
|
13,336 |
|
|
Comprehensive income attributable to non-controlling interest |
|
|
- |
|
|
|
- |
|
|
|
|
|
(129 |
) |
|
Comprehensive income attributable to Altra Industrial Motion Corp. |
|
$ |
77,649 |
|
|
$ |
12,886 |
|
|
|
|
$ |
13,207 |
|
The accompanying notes are an integral part of these consolidated financial statements.
47
ALTRA INDUSTRIAL MOTION CORP.
Consolidated Statements of Stockholders’ Equity
Amounts in thousands, except per share data
|
|
|
Common Stock |
|
|
Shares |
|
|
Additional Paid in Capital |
|
|
Retained Earnings |
|
|
Accumulated Other Comprehensive Income (Loss) |
|
|
Total |
|
|
Redeemable Non- Controlling Interest |
|
|||||||
|
Balance at January 1, 2015 |
|
$ |
26 |
|
|
|
26,354 |
|
|
$ |
139,087 |
|
|
$ |
161,061 |
|
|
$ |
(41,415 |
) |
|
$ |
258,759 |
|
|
$ |
883 |
|
|
Stock-based compensation and vesting of restricted stock |
|
|
— |
|
|
|
82 |
|
|
|
2,822 |
|
|
|
— |
|
|
|
— |
|
|
|
2,822 |
|
|
|
— |
|
|
Net income |
|
|
— |
|
|
|
— |
|
|
|
— |
|
|
|
35,406 |
|
|
|
— |
|
|
|
35,406 |
|
|
|
— |
|
|
Net loss attributable to non-controlling interest |
|
|
— |
|
|
|
— |
|
|
|
— |
|
|
|
— |
|
|
|
— |
|
|
|
— |
|
|
|
(63 |
) |
|
Purchase of non-controlling interest |
|
|
— |
|
|
|
— |
|
|
|
223 |
|
|
|
— |
|
|
|
(410 |
) |
|
|
(187 |
) |
|
|
(691 |
) |
|
Dividends declared, $0.57 per share |
|
|
— |
|
|
|
— |
|
|
|
— |
|
|
|
(14,928 |
) |
|
|
— |
|
|
|
(14,928 |
) |
|
|
— |
|
|
Change in fair value of interest rate swap |
|
|
— |
|
|
|
— |
|
|
|
— |
|
|
|
— |
|
|
|
(283 |
) |
|
|
(283 |
) |
|
|
— |
|
|
Minimum Pension adjustment, net of $449 tax |
|
|
— |
|
|
|
— |
|
|
|
— |
|
|
|
— |
|
|
|
(989 |
) |
|
|
(989 |
) |
|
|
— |
|
|
Repurchases of common stock |
|
|
— |
|
|
|
(663 |
) |
|
|
(17,298 |
) |
|
|
— |
|
|
|
— |
|
|
|
(17,298 |
) |
|
|
— |
|
|
Cumulative foreign currency translation adjustment, net of $658 tax |
|
|
— |
|
|
|
— |
|
|
|
— |
|
|
|
— |
|
|
|
(20,735 |
) |
|
|
(20,735 |
) |
|
|
(129 |
) |
|
Balance at December 31, 2015 |
|
|
26 |
|
|
|
25,773 |
|
|
|
124,834 |
|
|
|
181,539 |
|
|
|
(63,832 |
) |
|
|
242,567 |
|
|
|
— |
|
|
Stock-based compensation and vesting of restricted stock |
|
|
— |
|
|
|
74 |
|
|
|
2,893 |
|
|
|
— |
|
|
|
— |
|
|
|
2,893 |
|
|
|
— |
|
|
Net income |
|
|
— |
|
|
|
— |
|
|
|
— |
|
|
|
25,140 |
|
|
|
— |
|
|
|
25,140 |
|
|
|
— |
|
|
Conversion of Convertible Debt |
|
|
1 |
|
|
|
1,536 |
|
|
|
45,285 |
|
|
|
|
|
|
|
|
|
|
|
45,286 |
|
|
|
|
|
|
Dividends declared, $0.60 per share |
|
|
— |
|
|
|
— |
|
|
|
— |
|
|
|
(15,571 |
) |
|
|
— |
|
|
|
(15,571 |
) |
|
|
— |
|
|
Change in fair value of interest rate swap, net of $52 tax |
|
|
— |
|
|
|
— |
|
|
|
— |
|
|
|
— |
|
|
|
(506 |
) |
|
|
(506 |
) |
|
|
— |
|
|
Minimum Pension adjustment, net of $111 tax |
|
|
— |
|
|
|
— |
|
|
|
— |
|
|
|
— |
|
|
|
139 |
|
|
|
139 |
|
|
|
— |
|
|
Cumulative foreign currency translation adjustment |
|
|
— |
|
|
|
— |
|
|
|
— |
|
|
|
— |
|
|
|
(11,887 |
) |
|
|
(11,887 |
) |
|
|
— |
|
|
Repurchase of common stock |
|
|
— |
|
|
|
(177 |
) |
|
|
(4,713 |
) |
|
|
— |
|
|
|
— |
|
|
|
(4,713 |
) |
|
|
— |
|
|
Balance at December 31, 2016 |
|
|
27 |
|
|
|
27,206 |
|
|
|
168,299 |
|
|
|
191,108 |
|
|
|
(76,086 |
) |
|
|
283,348 |
|
|
|
— |
|
|
Stock-based compensation and vesting of restricted stock |
|
|
— |
|
|
|
104 |
|
|
|
3,186 |
|
|
|
— |
|
|
|
— |
|
|
|
3,186 |
|
|
|
— |
|
|
Net income |
|
|
— |
|
|
|
— |
|
|
|
— |
|
|
|
51,427 |
|
|
|
— |
|
|
|
51,427 |
|
|
|
— |
|
|
Conversion of Convertible Debt |
|
|
2 |
|
|
|
1,748 |
|
|
|
51,851 |
|
|
|
— |
|
|
|
— |
|
|
|
51,853 |
|
|
|
|
|
|
Dividends declared, $0.66 per share |
|
|
— |
|
|
|
— |
|
|
|
— |
|
|
|
(19,331 |
) |
|
|
— |
|
|
|
(19,331 |
) |
|
|
— |
|
|
Change in fair value of interest rate swap, net of $101 tax |
|
|
— |
|
|
|
— |
|
|
|
— |
|
|
|
— |
|
|
|
194 |
|
|
|
194 |
|
|
|
— |
|
|
Minimum Pension adjustment, net of $1,118 tax |
|
|
— |
|
|
|
— |
|
|
|
— |
|
|
|
— |
|
|
|
1,990 |
|
|
|
1,990 |
|
|
|
— |
|
|
Cumulative foreign currency translation adjustment |
|
|
— |
|
|
|
— |
|
|
|
— |
|
|
|
— |
|
|
|
24,038 |
|
|
|
24,038 |
|
|
|
— |
|
|
Balance at December 31, 2017 |
|
$ |
29 |
|
|
|
29,058 |
|
|
$ |
223,336 |
|
|
$ |
223,204 |
|
|
$ |
(49,864 |
) |
|
$ |
396,705 |
|
|
$ |
— |
|
The accompanying notes are an integral part of these consolidated financial statements.
48
ALTRA INDUSTRIAL MOTION CORP.
Consolidated Statements of Cash Flows
Amounts in thousands
|
|
|
Years Ended December 31, |
|
|||||||||||
|
|
|
2017 |
|
|
2016 |
|
|
|
|
2015 |
|
|||
|
|
|
|
|
|
|
|
|
|
|
|
|
|
|
|
|
Cash flows from operating activities |
|
|
|
|
|
|
|
|
|
|
|
|
|
|
|
Net income |
|
$ |
51,427 |
|
|
$ |
25,140 |
|
|
|
|
$ |
35,343 |
|
|
Adjustments to reconcile net income to net cash flows: |
|
|
|
|
|
|
|
|
|
|
|
|
|
|
|
Depreciation |
|
|
26,511 |
|
|
|
21,604 |
|
|
|
|
|
21,559 |
|
|
Amortization of intangible assets |
|
|
9,514 |
|
|
|
8,294 |
|
|
|
|
|
8,562 |
|
|
Amortization of deferred financing costs |
|
|
599 |
|
|
|
802 |
|
|
|
|
|
1,366 |
|
|
Loss (Gain) on foreign currency, net |
|
|
381 |
|
|
|
259 |
|
|
|
|
|
(395 |
) |
|
Amortization of inventory fair value adjustment |
|
|
2,347 |
|
|
|
— |
|
|
|
|
|
— |
|
|
Accretion of debt discount, net |
|
|
— |
|
|
|
4,005 |
|
|
|
|
|
3,694 |
|
|
Loss on disposals and impairments |
|
|
584 |
|
|
|
8,273 |
|
|
|
|
|
2,003 |
|
|
Loss on extinguishment of debt |
|
|
1,797 |
|
|
|
1,989 |
|
|
|
|
|
— |
|
|
Loss on partial settlement of pension plans |
|
|
1,720 |
|
|
|
— |
|
|
|
|
|
— |
|
|
(Benefit) provision for deferred taxes |
|
|
(8,012 |
) |
|
|
(2,850 |
) |
|
|
|
|
(170 |
) |
|
Stock based compensation |
|
|
5,274 |
|
|
|
4,230 |
|
|
|
|
|
4,004 |
|
|
Changes in assets and liabilities: |
|
|
|
|
|
|
|
|
|
|
|
|
|
|
|
Trade receivables |
|
|
(8,103 |
) |
|
|
(4,140 |
) |
|
|
|
|
7,223 |
|
|
Inventories |
|
|
(2,379 |
) |
|
|
2,324 |
|
|
|
|
|
6,049 |
|
|
Accounts payable and accrued liabilities |
|
|
(2,994 |
) |
|
|
4,333 |
|
|
|
|
|
2,816 |
|
|
Other current assets and liabilities |
|
|
(3,178 |
) |
|
|
529 |
|
|
|
|
|
(3,343 |
) |
|
Other operating assets and liabilities |
|
|
5,093 |
|
|
|
1,849 |
|
|
|
|
|
(1,895 |
) |
|
Net cash (used)/provided by operating activities |
|
|
80,581 |
|
|
|
76,641 |
|
|
|
|
|
86,816 |
|
|
Cash flows from investing activities |
|
|
|
|
|
|
|
|
|
|
|
|
|
|
|
Purchase of property, plant and equipment |
|
|
(32,826 |
) |
|
|
(18,941 |
) |
|
|
|
|
(22,906 |
) |
|
Proceeds from sale of property |
|
|
3,221 |
|
|
|
— |
|
|
|
|
|
1,201 |
|
|
Acquisition of Stromag and Guardian businesses, net of cash acquired |
|
|
2,883 |
|
|
|
(187,967 |
) |
|
|
|
|
— |
|
|
Net cash (used)/provided in investing activities |
|
|
(26,722 |
) |
|
|
(206,908 |
) |
|
|
|
|
(21,705 |
) |
|
Cash flows from financing activities |
|
|
|
|
|
|
|
|
|
|
|
|
|
|
|
Payments of debt issuance costs |
|
|
— |
|
|
|
(650 |
) |
|
|
|
|
(1,006 |
) |
|
Payments on term loan facility |
|
|
— |
|
|
|
— |
|
|
|
|
|
(130,063 |
) |
|
Payments on Revolving Credit Facility |
|
|
(79,536 |
) |
|
|
(31,861 |
) |
|
|
|
|
(14,998 |
) |
|
Dividend payments |
|
|
(18,259 |
) |
|
|
(11,667 |
) |
|
|
|
|
(14,928 |
) |
|
Cash paid for redemption of convertible debt |
|
|
(954 |
) |
|
|
— |
|
|
|
|
|
— |
|
|
Borrowing under Revolving Credit Facility |
|
|
27,958 |
|
|
|
200,579 |
|
|
|
|
|
120,036 |
|
|
Payments of equipment, working capital notes, mortgages and other debt |
|
|
(1,168 |
) |
|
|
(3,308 |
) |
|
|
|
|
(3,864 |
) |
|
Proceeds from equipment, working capital notes, mortgages and other debt |
|
|
— |
|
|
|
2,729 |
|
|
|
|
|
8,398 |
|
|
Shares surrendered for tax withholding |
|
|
(2,089 |
) |
|
|
(1,337 |
) |
|
|
|
|
(1,182 |
) |
|
Purchase of non-controlling interest in Lamiflex |
|
|
— |
|
|
|
— |
|
|
|
|
|
(878 |
) |
|
Purchases of common stock under share repurchase program |
|
|
— |
|
|
|
(4,713 |
) |
|
|
|
|
(17,298 |
) |
|
Net cash (used)/provided by financing activities |
|
|
(74,048 |
) |
|
|
149,772 |
|
|
|
|
|
(55,783 |
) |
|
Effect of exchange rate changes on cash and cash equivalents |
|
|
3,065 |
|
|
|
(707 |
) |
|
|
|
|
(6,511 |
) |
|
Net change in cash and cash equivalents |
|
|
(17,124 |
) |
|
|
18,798 |
|
|
|
|
|
2,817 |
|
|
Cash and cash equivalents at beginning of year |
|
|
69,118 |
|
|
|
50,320 |
|
|
|
|
|
47,503 |
|
|
Cash and cash equivalents at end of period |
|
$ |
51,994 |
|
|
$ |
69,118 |
|
|
|
|
$ |
50,320 |
|
|
Cash paid during the period for: |
|
|
|
|
|
|
|
|
|
|
|
|
|
|
|
Interest |
|
$ |
6,921 |
|
|
$ |
7,161 |
|
|
|
|
$ |
7,237 |
|
|
Income taxes |
|
$ |
23,607 |
|
|
$ |
10,855 |
|
|
|
|
$ |
15,729 |
|
|
Non-cash Financing and Investing: |
|
|
|
|
|
|
|
|
|
|
|
|
|
|
|
Acquisition of property, plant and equipment included in accounts payable |
|
$ |
222 |
|
|
$ |
459 |
|
|
|
|
$ |
1,129 |
|
|
Conversion of convertible senior notes to common stock |
|
$ |
51,853 |
|
|
$ |
45,286 |
|
|
|
|
$ |
— |
|
|
Acquisition of property, plant and equipment through capital leases |
|
$ |
— |
|
|
$ |
— |
|
|
|
|
$ |
— |
|
The accompanying notes are an integral part of these consolidated financial statements
49
ALTRA INDUSTRIAL MOTION CORP.
Notes to Consolidated Financial Statements
Amounts in thousands (unless otherwise noted)
1. Description of Business and Summary of Significant Accounting Policies
Basis of Preparation and Description of Business
Headquartered in Braintree, Massachusetts, Altra Industrial Motion Corp. (the “Company”) is a leading multi-national designer, producer and marketer of a wide range of electro-mechanical power transmission products. The Company brings together strong brands covering over 42 product lines with production facilities in twelve countries. Altra’s leading brands include Ameridrives Couplings, Bauer Gear Motor, Bibby Turboflex, Boston Gear, Delroyd Worm Gear, Formsprag Clutch, Guardian Couplings, Huco, Industrial Clutch, Inertia Dynamics, Kilian Manufacturing, Lamiflex Couplings, Marland Clutch, Matrix, Nuttall Gear, Stieber Clutch, Stromag, Svendborg Brakes, TB Wood’s, Twiflex, Warner Electric, Warner Linear, and Wichita Clutch.
In November 2013, Altra Holdings, Inc. changed its name to Altra Industrial Motion Corp., and Altra Industrial Motion, Inc., the Company’s former wholly owned subsidiary, changed its name to Altra Power Transmission, Inc. In December 2014, Altra Power Transmission, Inc. was merged into Altra Industrial Motion Corp.
Principles of Consolidation
The consolidated financial statements include the accounts of the Company and its wholly-owned subsidiaries. All intercompany balances and transactions have been eliminated in consolidation.
Net Income Per Share
Basic earnings per share is based on the weighted average number of shares of common stock outstanding and diluted earnings per share is based on the weighted average number of shares of common stock outstanding and all potentially dilutive common stock equivalents outstanding. Common stock equivalent shares are included in the per share calculations when the effect of their inclusion is dilutive.
The following is a reconciliation of basic to diluted shares outstanding:
|
|
|
Years Ended December 31, |
|
|||||||||
|
|
|
2017 |
|
|
2016 |
|
|
2015 |
|
|||
|
Net income attributable to Altra Industrial Motion Corp. |
|
$ |
51,427 |
|
|
$ |
25,140 |
|
|
$ |
35,406 |
|
|
Shares used in net income per common share – basic |
|
|
28,949 |
|
|
|
25,719 |
|
|
|
26,064 |
|
|
Dilutive effect of the equity premium on Convertible Notes at the average price of common stock |
|
|
— |
|
|
|
132 |
|
|
|
43 |
|
|
Incremental shares of unvested restricted common stock |
|
|
115 |
|
|
|
21 |
|
|
|
2 |
|
|
Shares used in net income per common share – diluted |
|
|
29,064 |
|
|
|
25,872 |
|
|
|
26,109 |
|
On December 12, 2016 the Company gave notice to the holders of its 2.75% Convertible Senior Notes due 2031 (the “Convertible Notes”), of its intention to redeem all Convertible Notes outstanding on January 12, 2017 (the “Redemption Date”). In lieu of receiving the redemption price, holders of the Convertible Notes could surrender their Convertible Notes for conversion at any time before January 9, 2017. The conversion rate of the Convertible Notes was 39.0809 shares of the Company’s common stock, for each $1,000 of outstanding principal of the Convertible Notes. As of December 31, 2016 approximately $39.3 million of the Convertible Notes were converted resulting in the issuance of 1.5 million shares of the Company’s common stock. As a result of the conversion, the Company incurred a loss on extinguishment of debt of approximately $1.9 million and the carrying value of the Convertible Notes was $42.9 million as of December 31, 2016. In January 2017, the remaining principal was converted to 1.7 million shares of common stock, and $0.9 million was redeemed for cash. As a result of the conversion of the Convertible Notes in December 2016 and January 2017, the weighted-average basic shares outstanding includes an additional 3.2 million shares for the year ended December 31, 2017.
50
Fair Value of Financial Instruments
Fair value is determined based upon the exit price that would be received to sell an asset or paid to transfer a liability in an orderly transaction between market participants, as determined by either the principal market or the most advantageous market. Inputs used in the valuation techniques to derive fair values are classified based on a three-level hierarchy, as follows:
|
|
• |
Level 1- Quoted prices in active markets for identical assets or liabilities. |
|
|
• |
Level 2- Observable inputs other than Level 1 prices such as quoted prices for similar assets or liabilities; quoted prices in markets with insufficient volume or infrequent transactions (less active markets); or model-derived |
|
|
• |
Level 3- Unobservable inputs to the valuation methodology that are significant to the measurement of fair value of assets or liabilities. |
The Company considers all highly liquid investments purchased with a remaining maturity of three months or less to be cash equivalents. and are classified as Level 1.
During the year ended December 31, 2016, the company recorded an impairment of $0.9 million at its facility in Changzhou, China. The Company estimated the fair value of the buildings based on appraisals and sales prices of like properties (level 2). The net book value of the buildings is classified as an asset held for sale in the consolidated balance sheet (See Note 4).
During the fourth quarter of 2016, the Company recognized an impairment of the TB Woods trademark, part of the Couplings, Clutches and Brakes segment, totaling $6.6 million. The fair value of the trademark was measured using an income approach (Level 3 inputs) that required management to estimate future cash flows underlying the trademark and discounting those projections to arrive at the present value of those projected cash flows. The significant inputs include projected cash flows, an assumed royalty rate and the discount rate.
The Company determines the fair value of financial instruments using quoted market prices whenever available. When quoted market prices are not available for various types of financial instruments (such as forwards, options and swaps), the Company uses standard models with market-based inputs, which take into account the present value of estimated future cash flows and the ability of the Company or the financial counterparty to perform. For interest rate and cross currency swaps, the significant inputs to these models are interest rate curves for discounting future cash flows and are adjusted for credit risk. For forward foreign currency contracts, the significant inputs are interest rate curves for discounting future cash flows and exchange rate curves of the foreign currency for translating future cash flows. See additional discussion of the Company’s use of financial instruments including cross-currency swaps and interest rate swaps included in Note 13.
The carrying values of financial instruments, including accounts receivable, cash equivalents, accounts payable, and other accrued liabilities are carried at cost, which approximates fair value. Debt under the Company’s 2015 Credit Agreement with certain financial institutions including the 2015 Revolving Credit Facility of $262.9 million approximates the fair value due to the variable rate and the fact that the agreement was renegotiated in December 2016 and there have been no significant changes in our credit rating or pricing of similar debt.
Use of Estimates
The preparation of financial statements in conformity with accounting principles generally accepted in the United States requires management to make estimates and assumptions that affect the financial statements. Actual results could differ from those estimates.
Foreign Currency Translation
Assets and liabilities of subsidiaries operating outside of the United States with a functional currency other than the U.S. Dollar are translated into U.S. Dollars using exchange rates at the end of the respective period. Revenues and expenses are translated at average exchange rates effective during the respective period.
Foreign currency translation adjustments are included in accumulated other comprehensive loss as a separate component of stockholders’ equity. Net foreign currency transaction gains and losses are included in the results of operations in the period incurred and included in other non-operating expense (income), net in the accompanying consolidated statements of income.
51
Trade Receivables
An allowance for doubtful accounts is recorded for estimated collection losses that will be incurred in the collection of receivables. Estimated losses are based on historical collection experience, as well as a review by management of the status of all receivables. Collection losses have been within the Company’s expectations.
Inventories
Inventories are generally stated at the lower of cost or market using the first-in, first-out (“FIFO”) method.
The carrying value of inventories acquired by the Company in its acquisitions reflects fair value at the date of acquisition as determined by the Company based on the replacement cost of raw materials, the sales price of the finished goods less an appropriate amount representing the expected profitability from selling efforts, and for work-in-process the sales price of the finished goods less an appropriate amount representing the expected profitability from selling efforts and costs to complete.
The Company periodically reviews its quantities of inventories on hand and compares these amounts to the expected usage of each particular product or product line. The Company records a charge to cost of sales for any amounts required to reduce the carrying value of inventories to its estimated net realizable value.
Property, Plant and Equipment
Property, plant and equipment are stated at cost, net of accumulated depreciation.
Depreciation of property, plant and equipment, including capital leases is provided using the straight-line method over the estimated useful life of the asset, as follows:
|
Buildings and improvements |
|
15 to 45 years |
|
Machinery and equipment |
|
2 to 15 years |
|
Capital lease |
|
Life of lease |
Leasehold improvements are depreciated on a straight-line basis over the estimated life of the asset or the life of the lease, if shorter.
Improvements and replacements are capitalized to the extent that they increase the useful economic life or increase the expected economic benefit of the underlying asset. Repairs and maintenance expenditures are charged to expense as incurred.
Intangible Assets
Intangible assets represent product technology, patents, tradenames, trademarks and customer relationships. Product technology, patents and customer relationships are amortized on a straight-line basis over 8 to 17 years, which approximates the period of economic benefit. The tradenames and trademarks are considered indefinite-lived assets and are not being amortized. Intangibles are stated at fair value on the date of acquisition. Intangibles are stated net of accumulated amortization.
Goodwill
Goodwill represents the excess of the purchase price paid by the Company over the fair value of the net assets acquired in each of the Company’s acquisitions.
Impairment of Goodwill and Indefinite-Lived Intangible Assets
The Company conducts an annual impairment review of goodwill and indefinite-lived intangible assets in December of each year, unless events occur which trigger the need for an interim impairment review.
In connection with the Company’s annual impairment review, goodwill is assessed for impairment by comparing the fair value of the reporting unit to the carrying value using a two-step approach. In the first step, the Company estimates future cash flows based upon historical results and current market projections, discounted at a market comparable rate. If the carrying amount of the reporting unit exceeds the estimated fair value, impairment may be present and the Company would then be required to perform a second step in its impairment analysis. In the second step, the Company would evaluate impairment losses based upon the fair value of the underlying assets and liabilities of the reporting unit, including any unrecognized intangible assets, and estimate the implied fair value
52
of the goodwill. An impairment loss is recognized to the extent that a reporting unit’s recorded value of the goodwill asset exceeded its deemed fair value. In addition, to the extent the implied fair value of any indefinite-lived intangible asset is less than the asset’s carrying value, an impairment loss is recognized on those assets. The Company did not identify any impairment of goodwill during the periods presented.
For our indefinite-lived intangible assets, mainly trademarks, we estimated the fair value first by estimating the total revenue attributable to the trademarks. Second, we estimated an appropriate royalty rate using the return on assets method by estimating the required financial return on our assets, excluding trademarks, less the overall return generated by our total asset base. The return as a percentage of revenue provides an indication of our royalty rate (between 1.0% and 1.25%). We compared the estimated fair value of our trademarks with the carrying value of the trademarks. For our indefinite lived intangible assets, mainly trademarks, we estimate the fair value by first estimating the total revenue attributable to the trademarks. Second, we estimate an appropriate royalty rate using the return on assets method by estimating the required financial return on our assets, excluding trademarks, less the overall return generated by our total asset base. The return as a percentage of revenue provides an indication of our royalty rate. We then compare the estimated fair value of our trademarks with the carrying value of the trademarks to record an impairment. For 2017 there was no impairment related to any of our trademarks or other intangibles.
Preparation of forecasts of revenue and profitability growth for use in the long-range plan and the discount rate require significant use of judgment. Changes to the discount rate and the forecasted profitability could affect the estimated fair value of one or more of the Company’s reporting units and could result in a goodwill impairment charge in a future period.
Impairment of Long-Lived Assets Other Than Goodwill and Indefinite-Lived Intangible Assets
Long-lived assets, including definite-lived intangible assets are reviewed for impairment when events or circumstances indicate that the carrying amount of a long lived asset may not be recovered. Long-lived assets are considered to be impaired if the carrying amount of the asset exceeds the undiscounted future cash flows expected to be generated by the asset over its remaining useful life. If an asset is considered to be impaired, the impairment is measured by the amount by which the carrying amount of the asset exceeds its fair value, and is charged to results of operations at that time.
Determining fair values based on discounted cash flows requires management to make significant estimates and assumptions, including forecasting of revenue and profitability growth for use in the long-range plan and estimating appropriate discount rates. Changes to the discount rate and the forecasted profitability could affect the estimated fair value of one or more of the Company’s indefinite-lived intangible assets and could result in an impairment charge in a future period.
Revenue Recognition
Product revenues are recognized, net of sales tax collected, at the time title and risk of loss pass to the customer, which generally occurs upon shipment to the customer. Product return reserves are accrued at the time of sale based on the historical relationship between shipments and returns, and are recorded as a reduction of net sales.
Certain large distribution customers receive annual volume discounts, which are estimated at the time the sale is recorded based on the estimated annual sales.
Shipping and Handling Costs
Shipping and handling costs associated with sales are classified as a component of cost of sales. Amounts collected from our customers for shipping and handling are recognized as revenue.
Warranty Costs
Estimated expenses related to product warranties are accrued at the time products are sold to customers. Estimates are established using historical information as to the nature, frequency, and average costs of warranty claims. See Note 6 to the consolidated financial statements.
Self-Insurance
Certain exposures are self-insured up to pre-determined amounts, above which third-party insurance applies, for medical claims, workers’ compensation, vehicle insurance, product liability costs and general liability exposure. The accompanying balance sheets
53
include reserves for the estimated costs associated with these self-insured risks, based on historic experience factors and management’s estimates for known and anticipated claims. A portion of medical insurance costs are offset by charging employees a premium equivalent to group insurance rates. The costs of retained loss for the self-insurance programs, at each balance sheet date, have not been material in any period.
Research and Development
Research and development costs are expensed as incurred.
Advertising
Advertising costs are charged to selling, general and administrative expenses as incurred and amounted to approximately $3.4 million, $2.8 million and $3.1 million, for the years ended December 31, 2017, 2016 and 2015, respectively.
Income Taxes
The Company records income taxes using the asset and liability method. Deferred income tax assets and liabilities are recognized for the future tax consequences attributable to differences between the financial statement carrying amounts of existing assets and liabilities and their respective income tax bases, and operating loss and tax credit carryforwards. The Company evaluates the realizability of its net deferred tax assets and assesses the need for a valuation allowance on a quarterly basis. The future benefit to be derived from its deferred tax assets is dependent upon the Company’s ability to generate sufficient future taxable income to realize the assets. The Company records a valuation allowance to reduce its net deferred tax assets to the amount that may be more likely than not to be realized.
To the extent the Company establishes a valuation allowance on net deferred tax assets generated from operations, an expense will be recorded within the provision for income taxes. In periods subsequent to establishing a valuation allowance on net deferred assets from operations, if the Company were to determine that it would be able to realize its net deferred tax assets in excess of their net recorded amount, an adjustment to the valuation allowance would be recorded as a reduction to income tax expense in the period such determination was made.
We assess our income tax positions and record tax benefits for all years subject to examination, based upon our evaluation of the facts, circumstances and information available at the reporting date. For those tax positions for which it is more likely than not that a tax benefit will be sustained, we record the amount that has a greater than 50% likelihood of being realized upon settlement with the taxing authority that has full knowledge of all relevant information. Interest and penalties are related to unrecognized tax benefits in income tax expense in the consolidated statement of income and included in accruals and other long-term liabilities in the Company’s consolidated balance sheet, where applicable. If we do not believe that it is more likely than not that a tax benefit will be sustained, no tax benefit is recognized.
On December 22, 2017, the Tax Cuts and Jobs Act of 2017 (the “U.S. Tax Act”) was signed into law, making significant changes to the Internal Revenue Code. Changes include, but are not limited to, a U.S. federal corporate tax rate decrease from 35% to 21% effective for tax years beginning after December 31, 2017, the transition of U.S. international taxation from a worldwide tax system to a territorial system, and a one-time transition tax on the mandatory deemed repatriation of cumulative foreign earnings as of December 31, 2017. We have calculated our best estimate of the impact of the U.S. Tax Act in our year end income tax provision in accordance with guidance available as of the date of this filing. The provisional amount related to the one-time transition tax on the mandatory deemed repatriation of foreign earnings was $7.4 million. In addition, we recognized a benefit totaling $7.8 million upon the remeasurment of our net deferred tax liabilities from 35% to 21%.
54
Changes in Accumulated Other Comprehensive Loss by Component
The following is a reconciliation of changes in Accumulated Other Comprehensive Loss for the periods presented:
|
|
|
Gains and Losses on Cash Flow Hedges |
|
|
Defined Benefit Pension Plans |
|
|
Cumulative Foreign Currency Translation Adjustment |
|
|
Total |
|
||||
|
Accumulated Other Comprehensive Loss by Component, January 1, 2015 |
|
$ |
143 |
|
|
$ |
(4,818 |
) |
|
$ |
(36,740 |
) |
|
$ |
(41,415 |
) |
|
Cumulative losses transferred from Lamiflex |
|
|
— |
|
|
|
— |
|
|
|
(410 |
) |
|
|
(410 |
) |
|
Net current-period Other Comprehensive Income (Loss), net of tax |
|
|
(283 |
) |
|
|
(989 |
) |
|
|
(20,735 |
) |
|
|
(22,007 |
) |
|
Accumulated Other Comprehensive Loss by Component, December 31, 2015 |
|
|
(140 |
) |
|
|
(5,807 |
) |
|
|
(57,885 |
) |
|
|
(63,832 |
) |
|
Net current-period Other Comprehensive Income Loss, net of tax |
|
|
(506 |
) |
|
|
139 |
|
|
|
(11,887 |
) |
|
|
(12,254 |
) |
|
Accumulated Other Comprehensive Loss by Component, December 31, 2016 |
|
|
(646 |
) |
|
|
(5,668 |
) |
|
|
(69,772 |
) |
|
|
(76,086 |
) |
|
Net current-period Other Comprehensive Income Loss, net of tax |
|
|
194 |
|
|
|
924 |
|
|
|
24,038 |
|
|
|
25,156 |
|
|
Reclassification adjustment from loss on partial settlement of pension plan, net of tax |
|
|
— |
|
|
|
1,066 |
|
|
|
— |
|
|
|
1,066 |
|
|
Accumulated Other Comprehensive Loss by Component, December 31, 2017 |
|
$ |
(452 |
) |
|
$ |
(3,678 |
) |
|
$ |
(45,734 |
) |
|
$ |
(49,864 |
) |
Recent Accounting Pronouncements
We have calculated our best estimate of the impact of the U.S. Tax Act in our year end income tax provision in accordance with guidance available as of the date of this filing. The provisional amount related to the one-time transition tax on the mandatory deemed repatriation of foreign earnings was $7.4 million. In addition, we recognized a benefit totaling $7.8 million upon the remeasurement of our net deferred tax liabilities from 35% to 21%. On December 22, 2017, Staff Accounting Bulletin No. 118 (“SAB 118”) was issued to address the application of generally accepted accounting principles in the United States, or GAAP, in situations when a registrant does not have the necessary information available, prepared, or analyzed (including computations) in reasonable detail to complete the accounting for certain income tax effects of the U.S. Tax Act. The ultimate impact of the U.S. Tax Act may differ from this estimate, possibly materially, due to changes in interpretations and assumptions, and guidance that may be issued and actions we may take in response to the U.S. Tax Act. The U.S. Tax Act is highly complex and we will continue to assess the impact that various provisions will have on our business. Any subsequent adjustment to these amounts will be recorded to current tax expense in the period when the analysis is complete.
In August 2017, the Financial Accounting Standards Board ("FASB") issued Accounting Standards Update ASU 2017-12, Derivatives and Hedging (Topic 815) (“ASU 2017-12”): Targeted Improvements to Accounting for Hedging Activities. This ASU provides new guidance about income statement classification and eliminates the requirement to separately measure and report hedge ineffectiveness. The entire change in fair value for qualifying hedge instruments included in the effectiveness will be recorded in other comprehensive income (OCI) and amounts deferred in OCI will be reclassified to earnings in the same income statement line item in which the earnings effect of the hedged item is reported. The guidance will be effective for interim and annual periods for the Company on January 1, 2019, with early adoption permitted. The Company does not expect the adoption of this ASU to have a material impact on its Consolidated Financial Statements.
In March 2017, the FASB issued ASU 2017-07, Compensation-Retirement Benefits (Topic 715) (“ASU 2017-07”): Improving the Presentation of Net Periodic Pension Cost and Net Periodic Postretirement Benefit Cost. This ASU changes the income statement presentation of defined benefit and post-retirement benefit plan expense by requiring separation between operating expense (service cost component of net periodic benefit expense) and non-operating expense (all other components of net periodic benefit expense, including interest cost, amortization of prior service cost, curtailments and settlements, etc.). The operating expense component is reported with similar compensation costs while the non-operating components are reported outside of operating income. The guidance
55
is effective for interim and annual periods for the Company on January 1, 2018. The Company does not expect the adoption of this ASU to have a material impact on its Consolidated Financial Statements.
In January 2017, the FASB issued ASU 2017-01, Business combinations (Topic 805) (“ASU 2017-01”): Clarifying the definition of a business, which clarifies the definition of a business and assists entities with evaluating whether transactions should be accounted for as acquisitions (or disposals) of assets or businesses. Under this guidance, when substantially all of the fair value of gross assets acquired is concentrated in a single asset (or group of similar assets), the assets acquired would not represent a business. In addition, in order to be considered a business, an acquisition would have to include at a minimum an input and a substantive process that together significantly contribute to the ability to create an output. The amended guidance also narrows the definition of outputs by more closely aligning it with how outputs are described in FASB guidance for revenue recognition. This guidance is effective for interim and annual periods for the Company on January 1, 2018, with early adoption permitted. The Company does not expect the adoption of this ASU to have a material impact on its Consolidated Financial Statements.
In January 2017, the Financial Accounting Standards Board (“FASB”) issued Accounting Standards update ASU 2017-04, Goodwill and Other (Topic 350) (“ASU 2017-04”): Simplifying the Test for Goodwill Impairment. The amended guidance simplifies the accounting for goodwill impairment for all entities by eliminating the requirement to perform a hypothetical purchase price allocation. A goodwill impairment charge will now be recognized for the amount by which the carrying value of a reporting unit exceeds its fair value, not to exceed the carrying amount of goodwill. The ASU is effective for interim and annual periods for the Company on January 1, 2020. with early adoption permitted. The Company does not expect the adoption of this ASU to have a material impact on its Consolidated Financial Statements.
In February 2015, the FASB issued ASU 2016-02, Leases (Topic 842) (“ASU 2016-02”). The ASU requires management to recognize lease assets and lease liabilities by lessees for all operating leases. The ASU is effective for periods ending on December 15, 2018 and interim periods therein on a modified retrospective basis. We are currently evaluating the impact this guidance will have on our financial statements but expect that we will record a material lease obligation upon the adoption of this standard. See Note 14 for additional information regarding our commitments under various lease obligations.
In March 2016, the FASB issued ASU 2016-09, Compensation - Stock Compensation (Topic 718): Improvements to Employee Share-Based Payment Accounting (“ASU 2016-09”). The updated guidance revises aspects of stock-based compensation guidance which include income tax consequences, classification of awards as equity or liabilities, and classification on the statement of cash flows. The Company adopted this guidance on January 1, 2017 which resulted in the recognition of excess tax benefits in our provision for income taxes with the Unaudited Condensed Consolidated Statements of Operations rather than paid-in capital and was not material for the year ended December 31, 2017. Additionally, our Unaudited Condensed Consolidated Statements of Cash Flows now present excess tax benefits as an operating activity, effective January 1, 2017. Finally, the Company elected to continue to estimate forfeitures based on historical data and recognizes forfeiture compensation expense over the vesting period of the award. The adoption of this ASU did not have a material impact to our Condensed Consolidated Financial Statements.
In May 2014, the FASB issued ASU No. 2014-09 Revenue from Contracts with Customers (“ASU 2014-09”) The guidance introduces a new five-step revenue recognition model in which an entity should recognize revenue to depict the transfer of promised goods or services to customers in an amount that reflects the consideration to which the entity expects to be entitled, in exchange for those goods or services. This ASU also requires disclosures sufficient to enable users to understand the nature, amount, timing and uncertainty of revenue and cash flows arising from contracts with customers, including qualitative and quantitative disclosures about contracts with customers, significant judgments and changes in judgments and assets recognized from the costs to obtain or fulfill a contract This guidance is effective for the Company on January 1, 2018.
The Company developed a project plan to guide the implementation. The project plan includes analyzing the ASU’s impact on the Company’s contract portfolio, surveying the Company’s business units and discussing the various revenue streams, completing contract reviews, comparing historical accounting policies and practices to the requirements of the new guidance, identifying potential differences from applying the requirements of the new guidance to its contracts and updating and providing training on its accounting policy. The Company has completed the process of evaluating controls and new disclosure requirements and identifying and implementing appropriate changes to its business processes and systems to support recognition and disclosure under the new guidance. The Company will adopt this new guidance using the modified retrospective method that will result in a cumulative effect adjustment, as of the date of adoption. The Company’s adoption of this ASU will not have a material impact on its Consolidated Financial Statements.
.
56
2. Acquisitions
On December 30, 2016, the Company consummated an agreement to acquire the Stromag business (“Stromag”) from GKN plc for €186.4 million ($196.7 million) less the cash remaining on the balance sheet of €8.3 ($8.8 million). In 2017, the Company received a payment totaling $2.9 million for the working capital settlement.
Stromag is a manufacturer of an array of engineered products including clutches and brakes, flexible couplings, limit switches and friction discs. Stromag serves the agricultural equipment, construction, crane & hoist, marine, metal processing, renewable energy and general industrial markets. The Stromag business is headquartered in Unna, Germany and has operations in Germany, France, the U.S., the UK, Brazil, India and China.
Altra financed the transaction through a combination of cash and additional borrowings under its 2015 Credit Agreement. Under the purchase agreement, the seller agreed to provide the Company with a limited set of representations and warranties, including with respect to outstanding and potential liabilities. Damages resulting from a breach of a representation or warranty could have a material and adverse effect on the Company’s financial condition and results of operations, and there is no guarantee that the Company would actually be able to recover all or any portion of the sums payable in connection with such breach. The Company is subject to substantially all the liabilities of Stromag that were not satisfied on or prior to the closing date. There may be liabilities that the Company underestimated or did not discover in the course of performing the Company’s due diligence investigation of Stromag.
The closing date of the Stromag Acquisition was December 30, 2016, and as a result, the Company’s consolidated financial statements reflect Stromag’s results of operations from the beginning of business on December 31, 2016 forward.
As of December 31, 2017, the Company’s acquisition accounting is complete and the allocation of price and the calculation of fair value, of all the acquired identifiable assets and liabilities, for the Stromag Acquisition is final. The measurement period adjustments which reflected new information obtained about facts and circumstances that existed as of the acquisition date were not material. The Company updated the acquisition accounting and the final purchase price allocation, as of the year ended December 31, 2017, is as follows:
|
|
|
|
|
|
|
Total purchase price, excluding acquisition costs of approximately $2.9 million |
|
$ |
191,852 |
|
|
Cash and cash equivalents |
|
$ |
8,758 |
|
|
Trade receivables |
|
|
24,087 |
|
|
Inventories |
|
|
22,039 |
|
|
Property, plant and equipment |
|
|
40,343 |
|
|
Intangible assets |
|
|
74,795 |
|
|
Prepaid expenses and other current assets |
|
|
778 |
|
|
Total assets acquired |
|
|
170,800 |
|
|
Accounts payable |
|
|
(15,370 |
) |
|
Accrued payroll |
|
|
(7,171 |
) |
|
Accrued expenses and other current liabilities |
|
|
(4,496 |
) |
|
Income tax payable |
|
|
(2,525 |
) |
|
Deferred tax liability |
|
|
(27,783 |
) |
|
Other long-term liabilities |
|
|
(1,255 |
) |
|
Pension liability |
|
|
(15,283 |
) |
|
Total liabilities assumed |
|
|
(73,883 |
) |
|
Net assets acquired |
|
|
96,917 |
|
|
Excess purchase price over fair value of net assets acquired |
|
$ |
94,935 |
|
The excess of the purchase price over the fair value of the net assets acquired was recorded as goodwill. The goodwill is generally not deductible for income tax purposes with the exception of approximately $12.8 million for certain assets acquired in the United States. The goodwill in this acquisition is attributable to the Company’s expectation to develop synergies, such as lower cost country sourcing, global procurement, the ability to cross-sell product, and the ability to penetrate certain geographic areas, as a result of the acquisition of Stromag.
|
Intangible assets acquired consist of: |
|
|
|
|
|
Customer relationships |
|
$ |
56,019 |
|
|
Trade names and trademarks |
|
|
18,776 |
|
|
Total intangible assets |
|
$ |
74,795 |
|
57
Customer relationships are subject to amortization, and will be recognized on a straight-line basis over the estimated useful lives of 15 years, which represents the anticipated period over which the Company estimates it will benefit from the acquired assets. The tradenames and trademarks are considered to have an indefinite life and will not be amortized.
The following table sets forth the unaudited pro forma results of operations of the Company for the year ended December 31, 2016 as if the Company had acquired Stromag on January 1, 2016. The pro forma information contains the actual operating results of the Company and Stromag, adjusted to include the pro forma impact of (i) additional depreciation expense as a result of estimated depreciation based on the fair value of fixed assets; (ii) additional expense as a result of the estimated amortization of identifiable intangible assets; (iii) additional interest expense for borrowings under the 2015 Credit Agreement associated with the Stromag Acquisition and (iv) inventory fair value adjustment. These pro forma amounts do not purport to be indicative of the results that would have actually been obtained if the acquisition occurred at the beginning of the period or that may be obtained in the future.
|
|
|
|
|
|
|
|
|
|
|
Proforma (unaudited) |
|
|
|
|
|
|
Year to Date Period Ended |
|
|
|
|
|
|
December 31, 2016 |
|
|
|
Total revenues |
|
|
$ |
851,537 |
|
|
Net income |
|
|
|
28,252 |
|
|
Basic earnings per share |
|
|
|
1.10 |
|
|
Diluted earnings per share |
|
|
$ |
1.10 |
|
|
|
|
|
|
|
|
|
|
|
|
|
|
|
3. Inventories
Inventories consisted of the following:
|
|
|
December 31, 2017 |
|
|
December 31, 2016 |
|
||
|
Raw materials |
|
$ |
49,351 |
|
|
$ |
45,507 |
|
|
Work in process |
|
|
22,914 |
|
|
|
20,128 |
|
|
Finished goods |
|
|
73,346 |
|
|
|
74,205 |
|
|
|
|
$ |
145,611 |
|
|
$ |
139,840 |
|
4. Property, Plant and Equipment
Property, plant and equipment consisted of the following:
|
|
|
December 31, 2017 |
|
|
December 31, 2016 |
|
||
|
Land |
|
$ |
31,228 |
|
|
$ |
28,098 |
|
|
Buildings and improvements |
|
|
79,468 |
|
|
|
69,350 |
|
|
Machinery and equipment |
|
|
268,592 |
|
|
|
239,669 |
|
|
|
|
|
379,288 |
|
|
|
337,117 |
|
|
Less-Accumulated depreciation |
|
|
(187,370 |
) |
|
|
(160,074 |
) |
|
|
|
$ |
191,918 |
|
|
$ |
177,043 |
|
During 2016, management completed the plan to exit its owned Electromagnetic Clutches and Brakes facility in Allones, France. The facility was consolidated into the Company’s existing Electromagnetic Clutches and Brakes operation in Saint Barthelemy, France. The Company also completed the closure of its Couplings, Clutches and Brakes facility in Changzhou, China and recognized an impairment loss on the building of approximately $0.9 million in 2016. The impairments for the facilities in Allones, France and Changzhou, China were recognized in restructuring costs in the consolidated statement of income during 2016. During 2017, the company completed the sale of the facility in Changzhou and obtained proceeds of approximately $3.2 million at the close of the transaction. There was no additional gain or loss recorded on the sale of the building which had been classified as an asset held for sale. In addition, the Gearing division is closing its facility in Milan, Italy. The buildings in Milan, Italy and Allones, France are actively being marketed by the Company and the Company expects to complete the sale of the properties within twelve months. The buildings having a net book value of approximately $1.1 million for the year ended December 31, 2017 and are classified as assets held for sale in the consolidated balance sheet.
58
The Company recorded $26.5 million, $21.6 million and $21.6 million of depreciation expense in the years ended December 31, 2017, 2016, and 2015, respectively.
5. Goodwill and Intangible Assets
The changes in the carrying value of goodwill by segment for the years ended December 31, 2017 and 2016 are as follows:
|
|
|
Couplings, Clutches & Brakes |
|
|
Electromagnetic Clutches & Brakes |
|
|
Gearing |
|
|
Total |
|
||||
|
Net goodwill balance January 1, 2016 |
|
$ |
25,290 |
|
|
$ |
24,661 |
|
|
$ |
47,358 |
|
|
$ |
97,309 |
|
|
Acquisition of Stromag |
|
|
80,340 |
|
|
|
12,785 |
|
|
|
- |
|
|
|
93,125 |
|
|
Impact of changes in foreign currency and other |
|
|
(1,165 |
) |
|
|
(285 |
) |
|
|
(143 |
) |
|
|
(1,593 |
) |
|
Net goodwill balance December 31, 2016 |
|
|
104,465 |
|
|
|
37,161 |
|
|
|
47,215 |
|
|
|
188,841 |
|
|
Impact of changes in foreign currency and other |
|
|
13,806 |
|
|
|
626 |
|
|
|
957 |
|
|
|
15,389 |
|
|
Measurement period adjustment related to acquisition of Stromag, including working capital settlement (See Note 2) |
|
|
1,692 |
|
|
|
118 |
|
|
|
- |
|
|
|
1,810 |
|
|
Net goodwill balance December 31, 2017 |
|
$ |
119,963 |
|
|
$ |
37,905 |
|
|
$ |
48,172 |
|
|
$ |
206,040 |
|
The following table provides the gross carrying value and accumulated amortization for each major class of intangible asset:
|
|
|
December 31, 2017 |
|
|
December 31, 2016 |
|
||||||||||||||||||
|
|
|
Cost |
|
|
Accumulated Amortization |
|
|
Net |
|
|
Cost |
|
|
Accumulated Amortization |
|
|
Net |
|
||||||
|
Other intangible assets |
|
|
|
|
|
|
|
|
|
|
|
|
|
|
|
|
|
|
|
|
|
|
|
|
|
Intangible assets not subject to amortization: |
|
|
|
|
|
|
|
|
|
|
|
|
|
|
|
|
|
|
|
|
|
|
|
|
|
Tradenames and trademarks |
|
$ |
54,883 |
|
|
$ |
— |
|
|
$ |
54,883 |
|
|
$ |
50,416 |
|
|
$ |
— |
|
|
$ |
50,416 |
|
|
Intangible assets subject to amortization: |
|
|
|
|
|
|
|
|
|
|
|
|
|
|
|
|
|
|
|
|
|
|
|
|
|
Customer relationships |
|
|
177,207 |
|
|
|
72,970 |
|
|
|
104,237 |
|
|
|
164,406 |
|
|
|
60,761 |
|
|
$ |
103,645 |
|
|
Product technology and patents |
|
|
5,853 |
|
|
|
5,360 |
|
|
|
493 |
|
|
|
6,090 |
|
|
|
5,468 |
|
|
$ |
622 |
|
|
Total intangible assets |
|
$ |
237,943 |
|
|
$ |
78,330 |
|
|
$ |
159,613 |
|
|
$ |
220,912 |
|
|
$ |
66,229 |
|
|
$ |
154,683 |
|
As a result of the annual indefinite-lived asset impairment review for the year 2017, the Company determined that there was no impairment for trademarks or any other intangibles during the year ended December 31, 2017. In 2016, the Company determined that the trademark at one reporting unit was impaired and therefore recorded a pre tax charge of $6.6 million in the consolidated statement of income.
The Company recorded $9.5 million, $8.3 million, and $8.6 million of amortization for the years ended December 31, 2017, 2016 and 2015, respectively.
Customer relationships, product technology and patents are amortized over their useful lives ranging from 8 to 17 years. The weighted average estimated useful life of intangible assets subject to amortization is approximately 11 years.
The estimated amortization expense for intangible assets is approximately $9.5 million in 2018 and in each of the next four years and then $57.1 million thereafter.
59
6. Warranty Costs
The contractual warranty period of the Company’s products generally ranges from three months to two years with certain warranties extending for longer periods. Estimated expenses related to product warranties are accrued at the time products are sold to customers and are recorded in accruals and other current liabilities on the consolidated balance sheet. Estimates are established using historical information as to the nature, frequency and average costs of warranty claims. Changes in the carrying amount of accrued product warranty costs for each of the years ended December 31, are as follows:
|
|
|
December 31, 2017 |
|
|
December 31, 2016 |
|
|
December 31, 2015 |
|
|||
|
Balance at beginning of period |
|
$ |
9,158 |
|
|
$ |
9,468 |
|
|
$ |
7,792 |
|
|
Accrued current period warranty expense |
|
|
1,057 |
|
|
|
1,355 |
|
|
|
4,429 |
|
|
Acquired warranty reserve |
|
|
— |
|
|
|
1,636 |
|
|
|
— |
|
|
Payments and adjustments |
|
|
(2,736 |
) |
|
|
(3,301 |
) |
|
|
(2,753 |
) |
|
Balance at end of period |
|
$ |
7,479 |
|
|
$ |
9,158 |
|
|
$ |
9,468 |
|
7. Income Taxes
Income before income taxes by domestic and foreign locations consists of the following:
|
|
|
December 31, 2017 |
|
|
December 31, 2016 |
|
|
December 31, 2015 |
|
|||
|
Domestic |
|
$ |
29,212 |
|
|
$ |
4,448 |
|
|
$ |
33,481 |
|
|
Foreign |
|
|
41,915 |
|
|
|
29,437 |
|
|
|
17,606 |
|
|
Total |
|
$ |
71,127 |
|
|
$ |
33,885 |
|
|
$ |
51,087 |
|
|
|
The components of the provision for income taxes consist of the following:
|
|
|
December 31, 2017 |
|
|
December 31, 2016 |
|
|
December 31, 2015 |
|
|||
|
Current: |
|
|
|
|
|
|
|
|
|
|
|
|
|
Federal |
|
$ |
14,836 |
|
|
$ |
3,525 |
|
|
$ |
8,866 |
|
|
State |
|
|
106 |
|
|
|
287 |
|
|
|
467 |
|
|
Non-US |
|
|
12,770 |
|
|
|
7,783 |
|
|
|
6,581 |
|
|
|
|
|
27,712 |
|
|
|
11,595 |
|
|
|
15,914 |
|
|
Deferred: |
|
|
|
|
|
|
|
|
|
|
|
|
|
Federal |
|
|
(6,222 |
) |
|
|
(2,177 |
) |
|
|
572 |
|
|
State |
|
|
371 |
|
|
|
(300 |
) |
|
|
280 |
|
|
Non-US |
|
|
(2,161 |
) |
|
|
(373 |
) |
|
|
(1,022 |
) |
|
|
|
|
(8,012 |
) |
|
|
(2,850 |
) |
|
|
(170 |
) |
|
Provision for income taxes |
|
$ |
19,700 |
|
|
$ |
8,745 |
|
|
$ |
15,744 |
|
60
A reconciliation from tax at the U.S. federal statutory rate to the Company’s provision for income taxes is as follows:
|
|
|
December 31, 2017 |
|
|
December 31, 2016 |
|
|
December 31, 2015 |
|
|||
|
Tax at US federal income tax rate |
|
$ |
24,896 |
|
|
$ |
11,871 |
|
|
$ |
17,881 |
|
|
Deferred tax impact of U.S. tax reform |
|
|
(7,819 |
) |
|
|
— |
|
|
|
— |
|
|
State taxes, net of federal income tax effect |
|
|
903 |
|
|
|
(141 |
) |
|
|
578 |
|
|
Other changes in tax rate |
|
|
(249 |
) |
|
|
(102 |
) |
|
|
32 |
|
|
Foreign reorganization |
|
|
— |
|
|
|
— |
|
|
|
(710 |
) |
|
Foreign taxes |
|
|
(3,051 |
) |
|
|
(2,593 |
) |
|
|
(2,050 |
) |
|
Transition tax (repatriation) |
|
|
7,374 |
|
|
|
— |
|
|
|
— |
|
|
Adjustments to accrued income tax liabilities and uncertain tax positions |
|
|
(451 |
) |
|
|
47 |
|
|
|
(18 |
) |
|
Valuation allowance |
|
|
(421 |
) |
|
|
118 |
|
|
|
1,218 |
|
|
Tax credits and incentives |
|
|
(495 |
) |
|
|
(296 |
) |
|
|
(420 |
) |
|
Domestic manufacturing deduction |
|
|
(762 |
) |
|
|
(486 |
) |
|
|
(1,051 |
) |
|
Other |
|
|
(225 |
) |
|
|
327 |
|
|
|
284 |
|
|
Provision for income taxes |
|
$ |
19,700 |
|
|
$ |
8,745 |
|
|
$ |
15,744 |
|
The Company and its subsidiaries file a consolidated federal income tax return in the United States, as well as consolidated and separate income tax returns in various states. The Company and its subsidiaries also file consolidated and separate income tax returns in various non-U.S. jurisdictions. In the normal course of business, the Company is subject to examination by taxing authorities in all of these jurisdictions. With the exception of certain foreign jurisdictions, the Company is no longer subject to income tax examinations for the tax years prior to 2014. Additionally, the Company has indemnification agreements with the sellers of the Guardian, Svendborg, Lamiflex, Bauer and Stromag entities that provide for reimbursement to the Company for payments made in satisfaction of income tax liabilities relating to pre-acquisition periods.
A reconciliation of the gross amount of unrecognized tax benefits excluding accrued interest and penalties is as follows:
|
|
|
December 31, 2017 |
|
|
December 31, 2016 |
|
|
December 31, 2015 |
|
|||
|
Balance at beginning of period |
|
$ |
409 |
|
|
$ |
409 |
|
|
$ |
434 |
|
|
Increases related to prior year tax positions |
|
|
— |
|
|
|
— |
|
|
|
— |
|
|
Decrease related to prior year tax positions |
|
|
— |
|
|
|
— |
|
|
|
— |
|
|
Increases related to current year tax positions |
|
|
— |
|
|
|
— |
|
|
|
— |
|
|
Settlements |
|
|
— |
|
|
|
— |
|
|
|
— |
|
|
Lapse of statute of limitations |
|
|
(409 |
) |
|
|
— |
|
|
|
(25 |
) |
|
Balance at end of period |
|
$ |
0 |
|
|
$ |
409 |
|
|
$ |
409 |
|
The Company recognizes interest and penalties related to unrecognized tax benefits in income tax expense. Accrued interest and penalties were not material in the period presented.
Deferred income taxes reflect the net tax effects of temporary differences between the carrying amounts of assets and liabilities for financial reporting purposes and the amounts used for income tax purposes. Significant components of the deferred tax assets and liabilities as of December 31, 2017 and 2016 are as follows:
61
|
|
|
2017 |
|
|
2016 |
|
||
|
Deferred tax assets: |
|
|
|
|
|
|
|
|
|
Post-retirement obligations |
|
$ |
3,283 |
|
|
$ |
2,833 |
|
|
Tax credits |
|
|
787 |
|
|
|
1,693 |
|
|
Expenses not currently deductible |
|
|
8,461 |
|
|
|
12,987 |
|
|
Net operating loss carryover |
|
|
3,670 |
|
|
|
5,228 |
|
|
Other |
|
|
1,045 |
|
|
|
994 |
|
|
Total deferred tax assets |
|
|
17,246 |
|
|
|
23,735 |
|
|
Valuation allowance for deferred tax assets |
|
|
(3,311 |
) |
|
|
(6,183 |
) |
|
Net deferred tax assets |
|
|
13,935 |
|
|
|
17,552 |
|
|
Deferred tax liabilities: |
|
|
|
|
|
|
|
|
|
Property, plant and equipment |
|
|
17,279 |
|
|
|
21,982 |
|
|
Intangible assets |
|
|
38,982 |
|
|
|
39,044 |
|
|
Basis difference - convertible debt |
|
|
— |
|
|
|
7,670 |
|
|
Goodwill |
|
|
7,316 |
|
|
|
7,430 |
|
|
Total deferred liabilities |
|
|
63,577 |
|
|
|
76,126 |
|
|
Net deferred tax liabilities |
|
$ |
49,642 |
|
|
$ |
58,574 |
|
On December 31, 2017 the Company had state net operating loss (NOL) carry forwards of $11.2 million, which expire between 2023 and 2033, and non U.S. NOL and capital loss carryforwards of $13.7 million, of which substantially all have an unlimited carryforward period. The NOL carryforwards available are subject to limitations on their annual usage. The Company also has federal and state tax credits of $1.0 million available to reduce future income taxes that expire between 2018 and 2031.
Valuation allowances are established for deferred tax assets when management believes it is more likely than not that the associated benefit may not be realized. The Company periodically reviews the adequacy of its valuation allowances and recognizes tax benefits only as reassessments indicate that it is more likely than not the benefits will be realized. Valuation allowances have been established due to the uncertainty of realizing the benefits of certain net operating losses, capital loss carryforwards, tax credits, and other tax attributes. The valuation allowances are primarily related to certain non-U.S. NOL carryforwards, capital loss carryforwards, and U.S. federal foreign tax credits.
The 2017 Tax Act, which was signed into law on December 22, 2017, has resulted in significant changes to the U.S. corporate income tax system. These changes include a federal statutory rate reduction from 35% to 21%, the elimination or reduction of certain domestic deductions and credits and limitations on the deductibility of interest expense and executive compensation. The 2017 Tax Act also transitions international taxation from a worldwide system to a modified territorial system and includes base erosion prevention measures on non-U.S. earnings, which has the effect of subjecting certain earnings of our foreign subsidiaries to U.S. taxation as global intangible low-taxed income (GILTI). These changes are effective beginning in 2018.
The 2017 Tax Act eliminates the deferral of U.S. income tax on the historical unrepatriated earnings by imposing the Transition Toll Tax, which is a one-time mandatory deemed repatriation tax on undistributed foreign earnings. The Transition Toll Tax is assessed on the U.S. shareholder's share of the foreign corporation's accumulated foreign earnings that have not previously been taxed. Earnings in the form of cash and cash equivalents will be taxed at a rate of 15.5% and all other earnings will be taxed at a rate of 8.0%. As of December 31, 2017, we have accrued income tax liabilities of $7.4 million under the Transition Toll Tax, of which $0.9 million is expected to be paid within one year. The Transition Toll Tax will be paid over an eight-year period, starting in 2018, and will not accrue interest.
In prior years, we considered our earnings to be permanently reinvested outside the U.S. and have therefore not recorded deferred tax liabilities associated with a repatriation of earnings. Given the significant changes in the tax law, we have not yet concluded on whether the foreign earnings will remain permanently reinvested. For purposes of the preparation of these financial statements, we have continued to apply the assertion that the foreign earnings will remain permanently reinvested. As such, no estimate of the total withholding taxes or state taxes that may be a result of our repatriation of earnings have been recognized, and it is not practical to estimate the amount of such taxes. We will re-evaluate that assumption as we finalize the determination of the changes in the tax basis of our foreign operations arising from the Transition Tax.
62
Our deferred tax assets and liabilities are measured at the enacted tax rate expected to apply when these temporary differences are expected to be realized or settled.
We have recorded a tax benefit of $7.8 million, reflecting the decrease in the U.S. corporate income tax rate and other changes to U.S. tax law to our net deferred tax liabilities. Our preliminary conclusion is that GILTI will likely not have a significant impact on our operations; however, we have not yet concluded on whether the impact of GILTI will be included in the measurement of our deferred taxes or recognized as any GILTI taxes are assessed as period costs.
Our preliminary estimate of the Transition Toll Tax and the remeasurement of our deferred tax assets and liabilities is subject to the finalization of management’s analysis related to certain matters, such as developing interpretations of the provisions of the 2017 Tax Act, changes to certain estimates and amounts related to the earnings and profits of our foreign subsidiaries and the filing of our tax returns. There is significant complexity in developing estimates of the foreign tax credits that may be available to us arising from the Transition Tax and we have yet to finalize these computations, but we believe the amounts provided are reasonable estimates. While we do not expect that the state tax effects of the deemed repatriation of foreign earnings under the Transition Toll Tax will be material, we have not yet completed the measurement of the amounts that may be due to the various states. U.S. Treasury regulations, administrative interpretations or court decisions interpreting the 2017 Tax Act may require further adjustments and changes in our estimates.
The final determination of the Transition Toll Tax and the remeasurement of our deferred assets and liabilities will be completed as additional information becomes available, but no later than one year from the enactment of the 2017 Tax Act.
8. Pension and Other Employee Benefits
Defined Benefit (Pension)
The Company sponsors various defined benefit (pension) plans for certain, primarily unionized, active employees (those in the employment of the Company at, and certain employees hired since, November 30, 2004).
63
The following tables represent the reconciliation of the benefit obligation, fair value of plan assets and funded status of the respective defined benefit (pension) plans as of December 31, 2017 and 2016:
|
|
|
Pension Benefits |
|
|||||||||||||||||||||
|
|
|
US Plan |
|
|
Non-U.S. Plans |
|
|
Total Pension Benefits |
|
|||||||||||||||
|
|
|
Year ended December 31, 2017 |
|
|
Year ended December 31, 2016 |
|
|
Year ended December 31, 2017 |
|
|
Year ended December 31, 2016 |
|
|
Year ended December 31, 2017 |
|
|
Year ended December 31, 2016 |
|
||||||
|
Change in benefit obligation: |
|
|
|
|
|
|
|
|
|
|
|
|
|
|
|
|
|
|
|
|
|
|
|
|
|
Obligation at beginning of period |
|
$ |
25,644 |
|
|
$ |
26,188 |
|
|
$ |
23,200 |
|
|
$ |
7,802 |
|
|
$ |
48,844 |
|
|
$ |
33,990 |
|
|
Assumed Stromag benefit obligation |
|
|
— |
|
|
|
— |
|
|
|
— |
|
|
|
15,284 |
|
|
|
— |
|
|
|
15,284 |
|
|
Service cost |
|
|
3 |
|
|
|
3 |
|
|
|
229 |
|
|
|
92 |
|
|
|
232 |
|
|
|
95 |
|
|
Interest cost |
|
|
948 |
|
|
|
1,016 |
|
|
|
423 |
|
|
|
171 |
|
|
|
1,371 |
|
|
|
1,187 |
|
|
Partial settlement payments |
|
|
(7,438 |
) |
|
|
— |
|
|
|
— |
|
|
|
(149 |
) |
|
|
(7,438 |
) |
|
|
(149 |
) |
|
Actuarial (gains) losses |
|
|
168 |
|
|
|
530 |
|
|
|
(204 |
) |
|
|
520 |
|
|
|
(36 |
) |
|
|
1,050 |
|
|
Foreign exchange effect |
|
|
— |
|
|
|
— |
|
|
|
3,112 |
|
|
|
(263 |
) |
|
|
3,112 |
|
|
|
(263 |
) |
|
Benefits paid |
|
|
(1,241 |
) |
|
|
(2,093 |
) |
|
|
(1,769 |
) |
|
|
(257 |
) |
|
|
(3,010 |
) |
|
|
(2,350 |
) |
|
Obligation at end of period |
|
$ |
18,084 |
|
|
$ |
25,644 |
|
|
$ |
24,991 |
|
|
$ |
23,200 |
|
|
$ |
43,075 |
|
|
$ |
48,844 |
|
|
Change in plan assets: |
|
|
|
|
|
|
|
|
|
|
|
|
|
|
|
|
|
|
|
|
|
|
|
|
|
Fair value of plan assets, beginning of period |
|
$ |
24,931 |
|
|
$ |
25,432 |
|
|
$ |
222 |
|
|
$ |
230 |
|
|
$ |
25,153 |
|
|
$ |
25,662 |
|
|
Partial settlement payments |
|
|
(7,438 |
) |
|
|
— |
|
|
|
— |
|
|
|
— |
|
|
|
(7,438 |
) |
|
|
— |
|
|
Actual return on plan assets |
|
|
1,823 |
|
|
|
1,765 |
|
|
|
21 |
|
|
|
8 |
|
|
|
1,844 |
|
|
|
1,773 |
|
|
Employer contributions |
|
|
— |
|
|
|
— |
|
|
|
98 |
|
|
|
248 |
|
|
|
98 |
|
|
|
248 |
|
|
Plan expenses |
|
|
(148 |
) |
|
|
(173 |
) |
|
|
29 |
|
|
|
(7 |
) |
|
|
(119 |
) |
|
|
(180 |
) |
|
Benefits paid |
|
|
(1,241 |
) |
|
|
(2,093 |
) |
|
|
(260 |
) |
|
|
(257 |
) |
|
|
(1,501 |
) |
|
|
(2,350 |
) |
|
Fair value of plan assets, end of period |
|
$ |
17,927 |
|
|
$ |
24,931 |
|
|
$ |
110 |
|
|
$ |
222 |
|
|
$ |
18,037 |
|
|
$ |
25,153 |
|
|
Funded status |
|
$ |
157 |
|
|
$ |
713 |
|
|
$ |
24,881 |
|
|
$ |
22,978 |
|
|
$ |
25,038 |
|
|
$ |
23,691 |
|
|
Amounts recognized in the balance sheet consist of: |
|
|
|
|
|
|
|
|
|
|
|
|
|
|
|
|
|
|
|
|
|
|
|
|
|
Total Non-current liabilities |
|
$ |
157 |
|
|
$ |
713 |
|
|
$ |
24,881 |
|
|
$ |
22,978 |
|
|
$ |
25,038 |
|
|
$ |
23,691 |
|
For all pension plans presented above, the accumulated and projected benefit obligations exceed the fair value of plan assets. The accumulated benefit obligation at December 31, 2017 and 2016 was $43.1 million and $48.8 million, respectively. Non-U.S. pension liabilities are $25.0 million and $23.2 million at December 31, 2017 and 2016, respectively.
Included in accumulated other comprehensive loss at December 31, 2017 and 2016, is $3.7 million (net of $1.0 million in taxes) and $ 5.7 million (net of $2.0 million in taxes), respectively, of unrecognized actuarial losses that have not yet been recognized in net periodic pension cost.
The discount rate used in the computation of the respective benefit obligations at December 31, 2017 and 2016, presented above are as follows:
|
|
|
US Pension Benefits |
|
|
Non US Pension Benefits |
|
||||||||||
|
|
|
2017 |
|
|
2016 |
|
|
2017 |
|
|
2016 |
|
||||
|
Pension benefits |
|
|
3.30 |
% |
|
|
3.80 |
% |
|
|
1.76 |
% |
|
|
1.75 |
% |
64
The following table represents the components of the net periodic benefit cost associated with the respective plans:
|
|
|
Pension Benefits |
|
|||||||||||||||||||||
|
|
|
US Plan |
|
|
Non-US Plans |
|
|
Total Pension Benefits |
|
|||||||||||||||
|
|
|
Year ended December 31, 2017 |
|
|
Year ended December 31, 2016 |
|
|
Year ended December 31, 2017 |
|
|
Year ended December 31, 2016 |
|
|
Year ended December 31, 2017 |
|
|
Year ended December 31, 2016 |
|
||||||
|
Service cost |
|
$ |
3 |
|
|
|
3 |
|
|
|
229 |
|
|
$ |
92 |
|
|
$ |
232 |
|
|
$ |
95 |
|
|
Interest cost |
|
|
948 |
|
|
|
1,016 |
|
|
|
423 |
|
|
|
171 |
|
|
|
1,371 |
|
|
|
1,187 |
|
|
Expected return on plan assets |
|
|
(764 |
) |
|
|
(770 |
) |
|
|
5 |
|
|
|
(7 |
) |
|
|
(759 |
) |
|
|
(777 |
) |
|
Non-cash impact of partial pension settlement |
|
|
— |
|
|
|
— |
|
|
|
— |
|
|
|
(149 |
) |
|
|
- |
|
|
|
(149 |
) |
|
Amortization of actuarial losses |
|
|
186 |
|
|
|
213 |
|
|
|
264 |
|
|
|
203 |
|
|
|
450 |
|
|
|
416 |
|
|
Recognized partial settlement loss |
|
|
1,720 |
|
|
|
— |
|
|
|
— |
|
|
|
— |
|
|
|
1,720 |
|
|
|
- |
|
|
Net periodic benefit cost |
|
$ |
2,093 |
|
|
$ |
462 |
|
|
$ |
921 |
|
|
$ |
310 |
|
|
$ |
3,014 |
|
|
$ |
772 |
|
The key economic assumptions used in the computation of the respective net periodic benefit cost for the periods presented above are as follows:
|
|
|
Pension Benefits |
|
|||||||||||||
|
|
|
US Plan |
|
|
Non US Plan |
|
||||||||||
|
|
|
Year ended December 31, 2017 |
|
|
Year ended December 31, 2016 |
|
|
Year ended December 31, 2017 |
|
|
Year ended December 31, 2016 |
|
||||
|
Discount rate |
|
|
3.80 |
% |
|
|
3.90 |
% |
|
|
2.50 |
% |
|
|
2.50 |
% |
|
Expected return on plan assets |
|
|
3.80 |
% |
|
|
3.90 |
% |
|
|
2.50 |
% |
|
|
2.50 |
% |
The expected long-term rate of return represents the average rate of earnings expected on the funds invested or to be invested to provide for the benefits included in the benefit obligation. The assumption reflects expectations regarding future rates of return for the investment portfolio, with consideration given to the distribution of investments by asset class and historical rates of return for each individual asset class.
Fair Value of Plan Assets
The fair value of the Company’s pension plan assets at December 31, 2017 and 2016 by asset category is as follows:
|
|
|
2017 |
|
|
2016 |
|
||
|
Asset Category |
|
|
|
|
|
|
|
|
|
Fixed income (Level 1) |
|
|
|
|
|
|
|
|
|
U.S. government |
|
$ |
2,915 |
|
|
$ |
3,849 |
|
|
Corporate bonds |
|
|
— |
|
|
|
— |
|
|
Investment grade |
|
|
5,308 |
|
|
|
6,239 |
|
|
High yield |
|
|
2,156 |
|
|
|
3,022 |
|
|
Total fixed income |
|
|
10,379 |
|
|
|
13,110 |
|
|
Investment grade (Level 2) |
|
|
7,336 |
|
|
|
11,560 |
|
|
Other (Level 2) |
|
|
108 |
|
|
|
222 |
|
|
Cash and cash equivalents (Level 1) |
|
|
214 |
|
|
|
261 |
|
|
Total assets at fair value |
|
$ |
18,037 |
|
|
$ |
25,153 |
|
65
The asset allocations for the Company’s funded retirement plan at December 31, 2017 and 2016, respectively, and the target allocation for 2017, by asset category, are as follows:
|
|
|
Allocation Percentage of Plan Assets at Year-End |
|
|||||
|
|
|
2017 Actual |
|
2017 Target |
|
2016 Actual |
|
|
|
Asset Category |
|
|
|
|
|
|
|
|
|
U.S. Government Bonds |
|
16% |
|
0 - 50% |
|
|
15% |
|
|
Investment Grade Bonds |
|
71% |
|
0 - 100% |
|
|
72% |
|
|
High Yield Bonds |
|
12% |
|
0 - 25% |
|
|
12% |
|
|
Cash |
|
1% |
|
0 - 5% |
|
|
1% |
|
The investment strategy is to achieve a rate of return on the plan’s assets that meets the performance of liabilities as calculated using a bank’s liability index with appropriate adjustments for benefit payments, service cost and actuarial assumption changes. A determinant of the plan’s return is the asset allocation policy. The plan’s asset mix will be reviewed by the Company periodically, but at least quarterly, to rebalance within the target guidelines. The Company will also periodically review investment managers to determine if the respective manager has performed satisfactorily when compared to the defined objectives, similarly invested portfolios, and specific market indices.
Expected cash flows
The following table provides the amounts of expected benefit payments, which are made from the plans’ assets and includes the participants’ share of the costs, which is funded by participant contributions. The amounts in the table are actuarially determined and reflect the Company’s best estimate given its current knowledge; actual amounts could be materially different.
|
|
|
Pension Benefits |
|
|
|
Expected benefit payments (from plan assets) |
|
|
|
|
|
2018 |
|
$ |
19,855 |
|
|
2019 |
|
|
1,702 |
|
|
2020 |
|
|
1,607 |
|
|
2021 |
|
|
1,521 |
|
|
2022 |
|
|
1,524 |
|
|
Thereafter |
|
$ |
12,735 |
|
The Company has no minimum cash funding requirements associated with its pension plans for years 2017 through 2021.
Defined Contribution Plans
Under the terms of the Company’s defined contribution plans, eligible employees may contribute up to 75% percent of their eligible compensation to the plan on a pre-tax basis, subject to annual IRS limitations. The Company makes matching contributions equal to half of the first six percent of eligible compensation contributed by each employee and made a unilateral contribution (including for non-contributing employees). The Company’s expense associated with the defined contribution plans was $4.1 million, $2.8 million and $4.0 million during the years ended December 31, 2017, 2016 and 2015, respectively.
Termination of Domestic Defined Benefit Pension Plan
Effective June 30, 2017, the Company amended the Altra Industrial Motion, Inc. Retirement Plan (the “Pension Plan”), its frozen U.S. defined benefit pension plan, to terminate the Pension Plan effective as of June 30, 2017. The Company commenced the plan termination process and distributed a portion of the Pension Plan assets at the end of 2017. The remainder will be distributed during the first quarter of 2018 prior to the filing of this Form 10-K. The Company recognized settlement losses of approximately $1.7 in the fourth quarter of 2017. During the first Quarter of 2018, The Company settled the remaining benefit obligation of approximately $18.7 million by transferring the remaining plan assets and liability obligations to a third party. The company will record an additional settlement loss of $5.3 million in the first Quarter of 2018.
66
9. Long-Term Debt
|
|
|
December 31, 2017 |
|
|
December 31, 2016 |
|
||
|
Debt: |
|
|
|
|
|
|
|
|
|
2015 Revolving Credit Facility |
|
$ |
262,915 |
|
|
$ |
313,620 |
|
|
Convertible Notes |
|
|
— |
|
|
|
45,656 |
|
|
Mortgages and other |
|
|
12,833 |
|
|
|
12,755 |
|
|
Capital leases |
|
|
223 |
|
|
|
363 |
|
|
Total debt |
|
|
275,971 |
|
|
|
372,394 |
|
|
Less: debt discount, net of accretion |
|
|
— |
|
|
|
(2,735 |
) |
|
Total debt, net of unaccreted discount |
|
$ |
275,971 |
|
|
$ |
369,659 |
|
|
Less current portion of long-term debt |
|
|
(384 |
) |
|
|
(43,690 |
) |
|
Total long-term debt, net of unaccreted discount |
|
$ |
275,587 |
|
|
$ |
325,969 |
|
Second Amended and Restated Credit Agreement
On October 22, 2015, the Company entered into a Second Amended and Restated Credit Agreement which may be amended from time to time (the “2015 Credit Agreement”). Under the 2015 Credit Agreement, the amount of the Company’s prior revolving credit facility was increased to $350 million (the “2015 Revolving Credit Facility”). The amounts available under the 2015 Revolving Credit Facility can be used for general corporate purposes, including acquisitions, and to repay existing indebtedness. The stated maturity of the 2015 Revolving Credit Facility is October 22, 2020.
The amounts available under the 2015 Revolving Credit Facility may be drawn upon in accordance with the terms of the 2015 Credit Agreement. All amounts outstanding under the 2015 Revolving Credit Facility are due on the stated maturity or such earlier time, if any, required under the 2015 Credit Agreement. The amounts owed under the 2015 Revolving Credit Facility may be prepaid at any time, subject to usual notification and breakage payment provisions. Interest on the amounts outstanding under the 2015 Revolving Credit Facility is calculated using either an ABR Rate or Eurodollar Rate, plus the applicable margin. The applicable margins for Eurodollar Loans are between 1.25% to 2.00%, and for ABR Loans are between 0.25% and 1.00%. The amounts of the margins are calculated based on either a consolidated total net leverage ratio (as defined in the 2015 Credit Agreement), or the then applicable rating(s) of the Company’s debt if and then to the extent as provided in the 2015 Credit Agreement. A portion of the 2015 Revolving Credit Facility may also be used for the issuance of letters of credit, and a portion of the amount of the 2015 Revolving Credit Facility is available for borrowings in certain agreed upon foreign currencies. The 2015 Credit Agreement contains various affirmative and negative covenants and restrictions, which among other things, will require the Borrowers to provide certain financial reports to the Lenders, require the Company to maintain certain financial covenants relating to consolidated leverage and interest coverage, limit maximum annual capital expenditures, and limit the ability of the Company and its subsidiaries to incur or guarantee additional indebtedness, pay dividends or make other equity distributions, purchase or redeem capital stock or debt, make certain investments, sell assets, engage in certain transactions, and effect a consolidation or merger. The 2015 Credit Agreement also contains customary events of default.
On October 21, 2016, the Company entered into an agreement to amend the 2015 Credit Agreement. This amendment, which became effective upon closing of the purchase of Stromag, which was December 30, 2016, increased the 2015 Revolving Credit Facility by $75 million to $425 million. The Company used additional borrowings under the increased facility to finance its purchase of Stromag. In addition, the amendment increased the multicurrency sublimit to $250 million and adjusted certain financial covenants. The pricing terms and maturity date under the 2015 Credit Agreement remain unchanged. The Company paid $0.6 million in fees in connection with the October 2016 amendment, which is recorded in other non-current assets.
As of December 31, 2017, the Company had $262.9 million outstanding on our 2015 Revolving Credit Facility, including $242.0 million outstanding on our USD tranche at an interest rate of 3.07% and €17.5 million or $20.9 million outstanding on our Euro tranche at an interest rate of 1.57%. As of December 31, 2017 and 2016, the Company had $3.5 million and $4.1 million in letters of credit outstanding, respectively. The Company had $158.6 million available to borrow under the 2015 Revolving Credit Facility at December 31, 2017 and may borrow an additional $150 million under certain circumstances.
Convertible Senior Notes
In March 2011, the Company issued Convertible Senior Notes (the “Convertible Notes”) due March 1, 2031. The Convertible Notes were guaranteed by the Company’s U.S. domestic subsidiaries. Interest on the Convertible Notes was payable semi-annually in
67
arrears, on March 1 and September 1 of each year, commencing on September 1, 2011 at an annual rate of 2.75%. Proceeds from the offering were $81.3 million, net of fees and expenses that were capitalized.
On December 12, 2016 the Company gave notice to the holders of the Convertible Notes of its intention to redeem all of the Convertible Notes outstanding on January 12, 2017 (the “Redemption Date”), pursuant to the optional redemption provisions in the Indenture. The redemption price for the Convertible Notes was 100% of the principal amount thereof, plus accrued and unpaid interest, if any, to, but not including, the Redemption Date plus a Make-Whole Premium equal to the present values of the remaining scheduled payments of interest on any Convertible Notes through March 1, 2018 (excluding interest accrued to, but excluding, the Redemption Date). In lieu of receiving the redemption price, holders of the Notes could surrender their Convertible Notes for conversion at any time before January 9, 2017. The conversion rate of the Convertible Notes was 39.0809 shares of the Company’s common stock for each $1,000 of outstanding principal of the Convertible Notes. As of December 31, 2016, Convertible Notes with an outstanding principal of approximately $39.3 million were converted resulting in the issuance of 1.5 million shares of the Company’s common stock. As a result of the conversion, the Company incurred a loss on extinguishment of debt of approximately $1.9 million and the carrying value of the Convertible Notes was $42.9 million as of December 31, 2016. In January 2017, additional Convertible Notes with an outstanding principal of approximately $44.7 million were converted resulting in the issuance of 1.7 million shares of the Company’s common stock, and $0.9 million of Convertible Notes were redeemed for cash. The Company incurred an additional loss on extinguishment of debt of approximately $1.8 million during the quarter ended March 31, 2017. All Convertible Notes were converted or redeemed as of January 12, 2017.
Mortgages
Heidelberg Germany
During 2015, a foreign subsidiary of the Company entered into a mortgage with a bank for €1.5 million, or $1.7 million, secured by its facility in Heidelberg, Germany to replace its previously existing mortgage. The mortgage has an interest rate of 1.79% which is payable in monthly installments through August 2023. The mortgage had a remaining principal balance of €1.1 million or $1.4 million and €1.3 million or $1.4 million at December 31, 2017 and December 31, 2016, respectively.
Esslingen Germany
During 2015, a foreign subsidiary of the Company entered into a mortgage with a bank for €6.0 million, or $6.7 million, secured by its facility in Esslingen, Germany. The mortgage has an interest rate of 2.5% per year which is payable in annual interest payments of €0.1 million or $0.1 million. The mortgage had a remaining principal balance of €6.0 million, or $7.1 million, and €6.0 million, or $6.3 million, at December 31, 2017 and December 31, 2016, respectively. The principal portion of the mortgage will be due in a lump-sum payment in May 2019.
Zlate Moravce Slovakia
During 2016, a foreign subsidiary of the Company entered in to a loan with a bank to equip its facility in Zlate Moravce, Slovakia. The total principal outstanding was €1.9 million, or $2.3 million, and €2.5 million, or $2.6 million, as of December 31, 2017 and 2016, respectively. The mortgage is guaranteed by land security at its parent company facility in Esslingen, Germany. The loan is due in installments through 2020, with an interest rate of 1.95%.
Angers France
During 2015, a foreign subsidiary of the Company entered into a mortgage with a bank for €2.0 million, or $2.3 million, secured by its facility in Angers, France. The mortgage has an interest rate of 1.85% per year which is payable in monthly installments through May 2025. The mortgage had a balance of €1.7 million, or $2.0 million and €1.9 million, or $2.0 million, at December 31, 2017 and December 31, 2016, respectively.
Capital Leases
The Company leases certain equipment under capital lease arrangements, whose obligations are included in both short-term and long-term debt. Capital lease obligations amounted to approximately $0.2 million and $0.4 million at December 31, 2017 and 2016, respectively. Assets subject to capital leases are included in property, plant and equipment with the related amortization recorded as depreciation expense.
68
Overdraft Agreements
Certain of our foreign subsidiaries maintain overdraft agreements with financial institutions. There were no borrowings as of December 31, 2017 or 2016 under any of the overdraft agreements.
10. Stockholders’ Equity
Common Stock (shares not in thousands)
As of December 31, 2017, there were 90,000,000 shares of common stock authorized and 29,058,117 outstanding.
On December 12, 2016 the Company gave notice to The Bank of New York Mellon Trust Company, N.A., the Trustee, under the Indenture governing the Convertible Notes, of its intention to redeem all of Convertible Notes outstanding on January 12, 2017, pursuant to the optional redemption provisions in the Indenture. In lieu of receiving the redemption price, holders of the Convertible Notes could surrender their Convertible Notes for conversion at any time before January 9, 2017. As of December 31, 2016, Convertible Notes with a principal value of approximately $39.3 million were surrendered for conversion resulting in the issuance of an additional 1.5 million shares. As a result of the conversion, the Company incurred a loss on extinguishment of debt of approximately $1.9 million and the carrying value of the remaining Convertible Notes was $42.9 million as of December 31, 2016. In January 2017, the remaining principal was converted to common stock, with the exception of $0.9 million that was redeemed for cash.
Preferred Stock
On December 20, 2006, the Company amended and restated its certificate of incorporation authorizing 10,000,000 shares of undesignated Preferred Stock (“Preferred Stock”). The Preferred Stock may be issued from time to time in one or more classes or series, the shares of each class or series to have such designations and powers, preferences, and rights, and qualifications, limitations and restrictions as determined by the Company’s Board of Directors. There was no Preferred Stock issued or outstanding at December 31, 2017 or 2016.
Restricted Common Stock
The Company’s 2004 Equity Incentive Plan (the “2004 Plan”) permitted the grant of various forms of stock based compensation to our officers and senior level employees. The 2004 Plan expired in 2014 and, upon expiration, there were 750,576 shares subject to outstanding awards under the 2004 Plan. The 2014 Omnibus Incentive Plan (the “2014 Plan”) was approved by the Company’s shareholders at its 2014 annual meeting. The 2014 Plan provides for various forms of stock based compensation to our directors, executive personnel and other key employees and consultants. Under the 2014 Plan, the total number of shares of common stock available for delivery pursuant to the grant of awards (“Awards”) is 860,793 as of December 31, 2017. Shares of our common stock subject to Awards and grants awarded under the 2004 Plan and outstanding as of the effective date of the 2014 Plan (except for substitute awards) that terminate without being exercised, expire, are forfeited or canceled, are exchanged for Awards that did not involve shares of common stock, are not issued on the stock settlement of a stock appreciation right, are withheld by the Company or tendered by a participant (either actually or by attestation) to pay an option exercise price or to pay the withholding tax on any Award, or are settled in cash in lieu of shares will again be available for Awards under the 2014 Plan.
The restricted shares issued pursuant to the 2014 Plan generally vest ratably over a period ranging from immediately to five years from the date of grant, provided, that the vesting of the restricted shares may accelerate upon the occurrence of certain events. Common stock awarded under the 2014 Plan is generally subject to restrictions on transfer, repurchase rights, and other limitations and rights as set forth in the applicable award agreements. The fair value of the shares repurchased are measured based on the share price on the date of grant.
The 2014 Plan permits the Company to grant, among other things, restricted stock, restricted stock units, and performance share awards to key employees and other persons who make significant contributions to the success of the Company. The restrictions and vesting schedule for restricted stock granted under the 2014 Plan are determined by the Personnel and Compensation Committee of the Board of Directors. Compensation expense recorded (in selling, general and administrative expense) during the years ended December 31, 2017, 2016 and 2015 was $5.3 million ($3.2 million, net of tax), $4.2 million ($2.9 million, net of tax), and $4.0 million ($2.8 million, net of tax), respectively. The Company recognizes stock-based compensation expense on a straight-line basis for the shares vesting ratably under the plan and uses the graded-vesting method of recognizing stock-based compensation expense for the performance share awards based on the probability of the specific performance metrics being achieved over the requisite service period.
69
The following table sets forth the activity of the Company’s restricted stock grants to date:
|
|
|
Shares |
|
|
Weighted-average grant date fair value |
|
||
|
Shares unvested January 1, 2017 |
|
|
199,712 |
|
|
$ |
24.68 |
|
|
Shares granted |
|
|
154,382 |
|
|
|
39.59 |
|
|
Shares for which restrictions lapsed |
|
|
(132,781 |
) |
|
|
43.73 |
|
|
Shares unvested December 31, 2017 |
|
|
221,313 |
|
|
$ |
31.42 |
|
Total remaining unrecognized compensation cost is approximately $4.4 million as of December 31, 2017, and will be recognized over a weighted average remaining period of two years. Based on the stock price at December 29, 2017, the last trading day of 2017 of $50.40 per share, the intrinsic value of these awards as of December 31, 2017, was $11.2 million. The fair value of the shares in which the restrictions have lapsed was $5.8 million, $3.8 million, and $3.5 million, during 2017, 2016, and 2015, respectively. Restricted shares granted are valued based on the fair market value of the stock on the date of grant.
Share Repurchase Program
In May 2014, our board of directors approved a share repurchase program the (“2014 Program”) authorizing the buyback of up to $50.0 million of the Company’s common stock. Through this program, the Company purchased shares on the open market, through block trades, in privately negotiated transactions, in compliance with SEC Rule 10b-18 (including through Rule 10b5-1 plans), or in any other appropriate manner. The timing of the shares repurchased was at the discretion of management and depended on a number of factors, including price, market conditions and regulatory requirements. Shares acquired through the repurchase program were retired.
On October 19, 2016, our board of directors approved a new share repurchase program authorizing the buyback of up to $30.0 million of the Company's common stock through December 31, 2019. This plan replaces the 2014 Program which was terminated. The Company expects to purchase shares on the open market, through block trades, in privately negotiated transactions, in compliance with SEC Rule 10b-18 (including through Rule 10b5-1 plans), or in any other appropriate manner. The timing of the shares repurchased will be at the discretion of management and will depend on a number of factors, including price, market conditions and regulatory requirements. Shares acquired through the repurchase program will be retired. The Company retains the right to limit, terminate or extend the share repurchase program at any time without prior notice. The Company expects to fund any further repurchases of its common stock through a combination of cash on hand and cash generated by operations.
The Company did not repurchase any shares during the year ended December 31, 2017. For the year ended December 31, 2016, the Company repurchased 177,053 shares of common stock at an average purchase price of $25.65 per share, all of which were purchased under the 2014 Program prior to its termination.
Dividends
The Company declared and paid dividends of $0.66 per share of common stock for the year ended December 31, 2017.
The Company declared and paid dividends of $0.60 per share of common stock for the year ended December 31, 2016.
Future declarations of quarterly cash dividends are subject to approval by the Board of Directors and to the Board’s continuing determination that the declaration of dividends are in the best interest of the Company’s stockholders and are in compliance with all laws and agreements of the Company applicable to the declaration and payment of cash dividends.
11. Concentrations
Financial instruments, which are potentially subject to counterparty performance and concentrations of credit risk, consist primarily of trade accounts receivable. The Company manages these risks by conducting credit evaluations of customers prior to delivery or commencement of services. When the Company enters into a sales contract, collateral is normally not required from the customer. Payments are typically due within 30 days of billing. An allowance for potential credit losses is maintained, and losses have historically been within management’s expectations. No customer represented greater than 10% of total sales for the years ended December 31, 2017, 2016 and 2015.
70
The Company is also subject to counter party performance risk of loss in the event of non-performance by counterparties to financial instruments, such as cash and investments and derivative transactions. Cash and investments are held by well-established financial institutions and invested in AAA rated mutual funds or United States Government securities. The Company is exposed to swap counterparty credit risk with financial institutions. The Company’s counterparty is a well-established financial institution.
Approximately 35% of the Company’s labor force (9% and 82% in the United States and Europe, respectively) is represented by collective bargaining agreements. The Company is a party to four U.S. collective bargaining agreements. The agreements will expire November 2019 and February 2021 respectively. The Company intends to renegotiate these contracts as they become due, though there is no assurance that this effort will be successful.
12. Restructuring, Asset Impairment, and Transition Expenses
From time to time, the Company will initiate various restructuring programs and incur severance and other restructuring costs.
During 2015, the Company commenced a restructuring plan (“2015 Altra Plan”) as a result of weak demand in Europe and to make certain adjustments to improve business effectiveness, reduce the number of facilities and streamline the Company's cost structure. The actions taken pursuant to the 2015 Altra Plan included reducing headcount, facility consolidations and related asset impairments, and limiting discretionary spending to improve profitability.
The following table details restructuring charges incurred by segment for the periods presented under the 2015 Altra Plan:
|
|
|
Years Ended December 31, |
|
|||||||||
|
|
|
2017 |
|
|
2016 |
|
|
2015 |
|
|||
|
Couplings, Clutches & Brakes |
|
$ |
1,849 |
|
|
$ |
7,302 |
|
|
$ |
2,527 |
|
|
Electromagnetic Clutches & Brakes |
|
|
50 |
|
|
|
1,286 |
|
|
|
1,600 |
|
|
Gearing |
|
|
1,076 |
|
|
|
287 |
|
|
|
3,080 |
|
|
Corporate (1) |
|
|
516 |
|
|
|
974 |
|
|
|
7 |
|
|
Total |
|
$ |
3,491 |
|
|
$ |
9,849 |
|
|
$ |
7,214 |
|
|
(1) |
Certain expenses are maintained at the corporate level and not allocated to the segments. These include various administrative expenses related to corporate headquarters, depreciation on capitalized software costs, non-capitalizable software implementation costs and acquisition related expenses and non-cash partial pension settlements. |
The amounts for 2017 are comprised of approximately $1.6 million in severance, $1.2 million in consolidation costs and $1.3 million in other restructuring consolidation costs and are classified in the accompanying condensed condensed statement of income as restructuring costs. The amounts for 2016 are comprised of approximately $2.7 million in severance, $1.7 million in consolidation costs, $2.8 million in relocation costs, $0.9 million in building impairments, and $1.7 million in other restructuring costs. The amounts for 2015 were related to approximately $5.2 million in severance and $2.0 million in building impairments.
During 2017, the Company commenced a new restructuring plan (“2017 Altra Plan”) as a result of the Stromag acquisition and to rationalize its global renewable energy business. The actions taken pursuant to the 2017 Altra Plan included reducing headcount, facility consolidations and the elimination of certain costs. The Company recognized $0.7 million in expense for the Couplings Clutches and Brakes segment related to the 2017 Altra Plan.
The following table details restructuring charges incurred by segment for the periods presented under the 2017 Altra Plan.
|
|
|
Year Ended December 31, |
|
|
|
|
|
2017 |
|
|
|
Couplings, Clutches & Brakes |
|
$ |
652 |
|
|
Electromagnetic Clutches & Brakes |
|
|
— |
|
|
Gearing |
|
|
— |
|
|
Corporate |
|
|
— |
|
|
Total |
|
$ |
652 |
|
71
The amounts for the year ended December 31, 2017 were comprised of approximately $0.4 million in severance and $0.2 million in consolidation costs, and are classified in the accompanying consolidated statement of income as restructuring costs.
The following table is a reconciliation of the accrued restructuring costs between January 1, 2015 and December 31, 2017.
|
|
|
2015 Plan |
|
|
2017 Plan |
|
|
Total |
|
|||
|
Balance at January 1, 2015 |
|
$ |
389 |
|
|
$ |
- |
|
|
$ |
389 |
|
|
Restructuring expense incurred |
|
|
7,214 |
|
|
|
— |
|
|
|
7,214 |
|
|
Non-cash loss on impairment of fixed assets |
|
|
(2,003 |
) |
|
|
— |
|
|
|
(2,003 |
) |
|
Cash payments |
|
|
(3,389 |
) |
|
|
— |
|
|
|
(3,389 |
) |
|
Balance at December 31, 2015 |
|
|
2,211 |
|
|
|
— |
|
|
$ |
2,211 |
|
|
Restructuring expense incurred |
|
|
9,849 |
|
|
|
— |
|
|
|
9,849 |
|
|
Non-cash loss on impairment of fixed assets |
|
|
(1,521 |
) |
|
|
— |
|
|
|
(1,521 |
) |
|
Cash payments |
|
|
(8,568 |
) |
|
|
— |
|
|
|
(8,568 |
) |
|
Balance at December 31, 2016 |
|
|
1,971 |
|
|
$ |
— |
|
|
|
1,971 |
|
|
Restructuring expense incurred |
|
|
3,491 |
|
|
|
652 |
|
|
|
4,143 |
|
|
Non-cash loss on impairment of fixed assets |
|
|
— |
|
|
|
— |
|
|
|
— |
|
|
Cash payments |
|
|
(4,662 |
) |
|
|
(444 |
) |
|
|
(5,106 |
) |
|
Balance at December 31, 2017 |
|
$ |
800 |
|
|
$ |
208 |
|
|
$ |
1,008 |
|
The total accrued restructuring reserve as of December 31, 2017 relates to severance costs to be paid to former employees in 2016 and is recorded in accruals and other current liabilities on the accompanying consolidated balance sheet. The Company does not expect to incur any additional material restructuring expenses related to the 2015 Altra Plan. The Company expects to incur between approximately $2.0 million and $4.0 in additional restructuring expenses under the 2017 Altra Plan through 2019.
13. Derivative Financial Instruments
The Company enters into contractual derivative arrangements to manage changes in market conditions related to interest on debt obligations, foreign currency exposures and occasionally on commodity prices. Derivative instruments utilized during the period include interest rate swap agreements and foreign currency contracts. All derivative instruments are recognized as either assets or liabilities on the balance sheet at fair value at the end of each period. The counterparties to the Company's contractual derivative agreements are all major global financial institutions. The Company is exposed to credit loss in the event of nonperformance by these counterparties. The Company continually monitors its positions and the credit ratings of its counterparties, and does not anticipate nonperformance by the counterparties. For designated hedging relationships, the Company formally documents the hedging relationship and its risk management objective and strategy for undertaking the hedge, the hedging instrument, the hedged item, the nature of the risk being hedged, how the hedging instrument's effectiveness in offsetting the hedged risk will be assessed prospectively and retrospectively, and a description of the method of measuring ineffectiveness. The Company also formally assesses, both at the hedge's inception and on an ongoing basis, whether the derivatives that are used in hedging transactions are highly effective in offsetting cash flows of hedged items.
Cross Currency Interest rate Swaps
The Company is exposed to foreign currency and interest rate cash flow exposure related to non-functional currency long-term debt of the Company’s wholly owned Dutch subsidiary. The currency adjustments related to this loan are recorded in Other non-operating (income) expense, net. The offsetting gains and losses on the related derivative contracts are also recorded in Other non-operating (income) expense, net. To manage this foreign currency and interest rate cash flow exposure, the Company entered into a cross-currency interest rate swap that converts $100.0 million of U.S. dollar denominated floating interest payments to functional currency (euro) fixed interest payments during the life of the hedging instrument. In addition, the Company entered into two cross-currency interest rate swaps that convert an additional $70.0 million of the U.S. dollar denominated floating interest payments to functional currency (euro) floating interest payments during the life of the hedging instruments. The effective period of one of the cross-currency interest rate swaps, in the amount of $30 million, expired as of December 31, 2017. The effective period of the second of these two cross-currency interest rate swaps, in the original amount of $40 million, now currently $30 million, expires on December 31, 2018. As changes in foreign exchange and interest rates impact the future cash flow of interest payments, the hedges are intended to offset changes in cash flows attributable to interest rate and foreign exchange movements.
72
The Company designated the $100.0 million swap as a cash flow hedge, with the effective portion of the gain or loss on the derivative reported as a component of other comprehensive income (loss) and reclassified into earnings in the same period or periods during which the hedged transaction impacts earnings. There were no amounts recorded for ineffectiveness for the periods reported herein related to the cross-currency interest rate swaps.
Changes in the fair value of a derivative that is designated as and meets all the required criteria for a cash flow hedge are recorded in accumulated other comprehensive income (loss) and reclassified into earnings as the underlying hedged item affects earnings. As of December 31, 2017 and 2016 approximately $0.2 million and ($0.7) million of unrealized gain and loss related to the interest rate swaps were included in accumulated other comprehensive loss, respectively.
The following table summarizes outstanding swap for which the Company has recorded at December 31, 2017.
|
|
|
|
|
Initial US$ |
|
|
|
|
|
|
|
|
|
|
|
|
|
Date |
|
Derivative |
|
Notional |
|
|
|
|
|
|
|
|
|
|
|
|
|
Entered |
|
Financial |
|
Amount |
|
|
Floating Leg |
|
|
|
Floating Leg |
|
Settlement |
|
Effective |
|
|
Into |
|
Instrument |
|
(thousands) |
|
|
(swap counterparty) |
|
Fixed Rate |
|
(Company) |
|
Dates |
|
Period of swap |
|
|
12/21/2016 |
|
Cross currency interest rate swap |
|
$ |
100,000 |
|
|
Variable rate 1-month USD Libor plus 1.50% to 3/31/17 and 1.75% thereafter |
|
1.027% EUR |
|
N/A |
|
Monthly on the last banking day of each month commencing December 30, 2016 |
|
12/23/2016 - 12/31/2019 |
|
12/21/2016 |
|
Cross currency interest rate swap |
|
|
40,000 |
|
|
Variable rate 1-month USD Libor plus 1.50% to 3/31/17 and 1.75% thereafter |
|
N/A |
|
Variable rate 1-month EURIBOR, floored at 0.00%, plus 0.920% |
|
Monthly on the last banking day of each month commencing December 30, 2016 |
|
12/23/2016 - 12/31/2018 |
|
6/28/2017 |
|
Cross currency interest rate swap |
|
|
30,000 |
|
|
Variable rate 1-month USD Libor plus 1.75% thereafter |
|
N/A |
|
Variable rate 1-month EURIBOR, floored at 0.00%, plus 1.11% |
|
Monthly on the last banking day of each month commencing July 31, 2017 |
|
6/30/2017-12/31/2017 |
|
1/31/2017 |
|
Interest rate swap |
|
$ |
50,000 |
|
|
Variable rate 1-month USD Libor |
|
1.625% USD |
|
N/A |
|
Monthly on the last banking day of each month commencing February 28, 2017 |
|
1/31/2017 - 1/31/2020 |
The following table summarizes the location and fair value, using Level 2 inputs (see Note 1 for a description of the fair value levels), of the Company's derivatives designated and not designated as hedging instruments in the Consolidated Balance Sheets (in thousands).
|
|
|
|
|
December 31, |
|
|
December 31, |
|
||
|
|
|
Balance Sheet Location |
|
2017 |
|
|
2016 |
|
||
|
Designated as hedging instruments: |
|
|
|
|
|
|
|
|
|
|
|
Cross currency swap agreements |
|
Other long-term liabilities |
|
$ |
15,569 |
|
|
$ |
1,642 |
|
|
Interest rate swap agreement |
|
Other long-term assets |
|
$ |
345 |
|
|
|
|
|
|
Not designated as hedging instruments: |
|
|
|
|
|
|
|
|
|
|
|
Cross currency swap agreements |
|
Other long-term liabilities |
|
|
4,597 |
|
|
|
889 |
|
|
|
|
|
|
$ |
19,821 |
|
|
$ |
2,531 |
|
The following table summarizes the location of (gain) loss reclassified from Accumulated other comprehensive loss into earnings for derivatives designated as hedging instruments and the location of (gain) loss for our derivatives not designated as hedging instruments in the Consolidated Statements of Income (in thousands).
|
|
|
|
|
December 31, |
|
|
December 31, |
|
||
|
|
|
Income Statement Location |
|
2017 |
|
|
2016 |
|
||
|
Designated as hedging instruments: |
|
|
|
|
|
|
|
|
|
|
|
Cross currency swap agreements |
|
Other non-operating (income) expense, net |
|
$ |
13,242 |
|
|
$ |
995 |
|
|
Not designated as hedging instruments: |
|
|
|
|
|
|
|
|
|
|
|
Cross currency swap agreements |
|
Other non-operating (income) expense, net |
|
|
3,708 |
|
|
|
889 |
|
|
|
|
|
|
$ |
16,950 |
|
|
$ |
1,884 |
|
73
14. Commitments and Contingencies
Minimum Lease Obligations
The Company leases certain offices, warehouses, manufacturing facilities, automobiles and equipment with various terms that range from a month to month basis to 11 years and which, generally, include renewal provisions. Future minimum rent obligations under non-cancelable operating and capital leases are as follows.
|
Year ending December 31: |
|
Operating Leases |
|
|
Capital Leases |
|
||
|
2018 |
|
$ |
8,168 |
|
|
$ |
148 |
|
|
2019 |
|
|
6,550 |
|
|
|
72 |
|
|
2020 |
|
|
5,017 |
|
|
|
8 |
|
|
2021 |
|
|
3,884 |
|
|
|
— |
|
|
2022 |
|
|
2,704 |
|
|
|
— |
|
|
Thereafter |
|
|
4,539 |
|
|
|
— |
|
|
Total lease obligations |
|
$ |
30,862 |
|
|
$ |
228 |
|
|
Less amounts representing interest |
|
|
|
|
|
|
(5 |
) |
|
Present value of minimum capital lease obligations |
|
$ |
30,862 |
|
|
$ |
223 |
|
Net rent expense under operating leases for the years ended December 31, 2017, 2016 and 2015 was approximately $9.1 million, $8.9 million, and $9.0 million, respectively.
General Litigation
The Company is involved in various pending legal proceedings arising out of the ordinary course of business. These proceedings primarily involve commercial claims, product liability claims, personal injury claims, and workers’ compensation claims. With respect to these proceedings, management believes that the Company will prevail, has adequate insurance coverage or has established appropriate reserves to cover potential liabilities. Any costs that management estimates may be paid related to these proceedings or claims are accrued when the liability is considered probable and the amount can be reasonably estimated. There can be no assurance, however, as to the ultimate outcome of any of these matters, and if all or substantially all of these legal proceedings were to be determined adversely to the Company, there could be a material adverse effect on the results of operations, cash flows, or financial condition of the Company. We have established loss provisions for matters in which losses are probable and can be reasonably estimated. For matters where a reserve has not been established and for which we believe a loss is reasonably possible, as well as for matters where a reserve has been recorded but for which an exposure to loss in excess of the amount accrued is reasonably possible, we believe that such losses, individually and in the aggregate, will not have a material effect on our consolidated financial statements.
Our estimates regarding potential losses and materiality are based on our judgment and assessment of the claims utilizing currently available information. Although we will continue to reassess our reserves and estimates based on future developments, our objective assessment of the legal merits of such claims may not always be predictive of the outcome and actual results may vary from our current estimates. We will continue to consider the applicable guidance in ASC 450-20, based on the facts known at the time of our future filings, as it relates to legal contingencies, and will adjust our disclosures as may be required under the guidance.
There were no material amounts accrued in the accompanying consolidated balance sheets for potential litigation as of December 31, 2017 or 2016.
The Company also risks exposure to product liability claims in connection with products it has sold and those sold by businesses that the Company acquired. Although in some cases third parties have retained responsibility for product liability claims relating to products manufactured or sold prior to the acquisition of the relevant business and in other cases the persons from whom the Company has acquired a business may be required to indemnify the Company for certain product liability claims subject to certain caps or limitations on indemnification, the Company cannot assure that those third parties will in fact satisfy their obligations with respect to liabilities retained by them or their indemnification obligations. If those third parties become unable to or otherwise do not comply with their respective obligations including indemnity obligations, or if certain product liability claims for which the Company is obligated were not retained by third parties or are not subject to these indemnities, the Company could become subject to significant liabilities or other adverse consequences. Moreover, even in cases where third parties retain responsibility for product liability claims or are required to indemnify the Company, significant claims arising from products that have been acquired could have a material adverse effect on the Company’s ability to realize the benefits from an acquisition, could result in the reduction of the value of goodwill that the Company recorded in connection with an acquisition, or could otherwise have a material adverse effect on the Company’s business, financial condition, or operations.
74
Environmental
There is contamination at some of the Company’s current facilities, primarily related to historical operations at those sites, for which the Company could be liable for the investigation and remediation under certain environmental laws. The potential for contamination also exists at other of the Company current or former sites, based on historical uses of those sites. The Company currently is not undertaking any remediation or investigations and the costs or liability in connection with potential contamination conditions at these facilities cannot be predicted at this time because the potential existence of contamination has not been investigated or not enough is known about the environmental conditions or likely remedial requirements. Currently, other parties with contractual liability are addressing or have plans or obligations to address those contamination conditions that may pose a material risk to human health, safety or the environment. In addition, while the Company attempts to evaluate the risk of liability associated with these facilities at the time the Company acquired them, there may be environmental conditions currently unknown to the Company relating to prior, existing or future sites or operations or those of predecessor companies whose liabilities the Company may have assumed or acquired which could have a material adverse effect on the Company’s business.
The Company is being indemnified, or expects to be indemnified by third parties subject to certain caps or limitations on the indemnification, for certain environmental costs and liabilities associated with certain owned or operated sites. Accordingly, based on the indemnification and the experience with similar sites of the environmental consultants who the Company has hired, the Company does not expect such costs and liabilities to have a material adverse effect on its business, operations or earnings. The Company cannot assure you, however, that those third parties will in fact satisfy their indemnification obligations. If those third parties become unable to, or otherwise do not, comply with their respective indemnity obligations, or if certain contamination or other liability for which the Company is obligated is not subject to these indemnities, the Company could become subject to significant liabilities.
From time to time, the Company is notified that it is a potentially responsible party and may have liability in connection with off-site disposal facilities. To date, the Company has generally resolved matters involving off-site disposal facilities for a nominal sum but there can be no assurance that the Company will be able to resolve pending or future matters in a similar fashion.
15. Segment and Geographic Information
The Company currently operates through three business segments that are aligned with key product types and end markets served:
|
|
• |
Couplings, Clutches & Brakes. Couplings are the interface between two shafts, which enable power to be transmitted from one shaft to the other. Clutches in this segment are devices which use mechanical, hydraulic, pneumatic, or friction type connections to facilitate engaging or disengaging two rotating members. Brakes are combinations of interacting parts that work to slow or stop machinery. Products in this segment are generally used in heavy industrial applications and energy markets. |
|
|
• |
Electromagnetic Clutches & Brakes. Products in this segment include brakes and clutches that are used to electronically slow, stop, engage or disengage equipment utilizing electromagnetic friction type connections. Products in this segment are used in industrial and commercial markets including agricultural machinery, material handling, motion control, and turf & garden. |
|
|
• |
Gearing. Gears are utilized to reduce the speed and increase the torque of an electric motor or engine to the level required to drive a particular piece of equipment. Gears produced by the Company are primarily utilized in industrial applications. |
The segment information presented below for the prior periods has been reclassified to conform to the new presentation.
75
Segment financial information and a reconciliation of segment results to consolidated results follows:
|
|
Year Ended December 31, |
|
|||||||||
|
|
2017 |
|
|
2016 |
|
|
2015 |
|
|||
|
Net Sales: |
|
|
|
|
|
|
|
|
|
|
|
|
Couplings, Clutches & Brakes |
$ |
441,887 |
|
|
$ |
305,406 |
|
|
$ |
342,299 |
|
|
Electromagnetic Clutches & Brakes |
|
251,505 |
|
|
|
217,856 |
|
|
|
219,676 |
|
|
Gearing |
|
191,789 |
|
|
|
192,003 |
|
|
|
192,252 |
|
|
Inter-segment eliminations |
|
(8,444 |
) |
|
|
(6,359 |
) |
|
|
(7,575 |
) |
|
Net sales |
|
876,737 |
|
|
|
708,906 |
|
|
|
746,652 |
|
|
Income from operations: |
|
|
|
|
|
|
|
|
|
|
|
|
Segment earnings: |
|
|
|
|
|
|
|
|
|
|
|
|
Couplings, Clutches & Brakes |
|
47,215 |
|
|
|
20,941 |
|
|
|
38,750 |
|
|
Electromagnetic Clutches & Brakes |
|
27,774 |
|
|
|
26,406 |
|
|
|
21,634 |
|
|
Gearing |
|
22,238 |
|
|
|
22,718 |
|
|
|
21,094 |
|
|
Restructuring |
|
(4,143 |
) |
|
|
(9,849 |
) |
|
|
(7,214 |
) |
|
Loss on partial settlement of pension plan |
|
(1,720 |
) |
|
|
- |
|
|
|
- |
|
|
Corporate expenses (1) |
|
(10,377 |
) |
|
|
(12,670 |
) |
|
|
(10,050 |
) |
|
Income from operations |
|
80,987 |
|
|
|
47,546 |
|
|
|
64,214 |
|
|
Other non-operating (income) expense: |
|
|
|
|
|
|
|
|
|
|
|
|
Net interest expense |
|
7,710 |
|
|
|
11,679 |
|
|
|
12,164 |
|
|
Loss on extinguishment of convertible debt |
|
1,797 |
|
|
|
1,989 |
|
|
- |
|
|
|
Other non-operating (income) expense, net |
|
353 |
|
|
|
(7 |
) |
|
|
963 |
|
|
|
|
9,860 |
|
|
|
13,661 |
|
|
|
13,127 |
|
|
Income before income taxes |
|
71,127 |
|
|
|
33,885 |
|
|
|
51,087 |
|
|
Provision for income taxes |
|
19,700 |
|
|
|
8,745 |
|
|
|
15,744 |
|
|
Net income |
$ |
51,427 |
|
|
$ |
25,140 |
|
|
$ |
35,343 |
|
|
(1) |
Certain expenses are maintained at the corporate level and not allocated to the segments. These include various administrative expenses related to the corporate headquarters, depreciation on capitalized software costs, non-capitalizable software implementation costs, acquisition related expenses and impairment of intangibles. |
While the Company did not have any customers that represented total sales of greater than 10%, the Gearing business segment had one customer that approximated 11.3% of total sales during the year ended December 31, 2017.
Selected information by segment (continued)
|
|
|
Years Ended December 31, |
|
|||||||||
|
|
|
2017 |
|
|
2016 |
|
|
2015 |
|
|||
|
Depreciation and amortization: |
|
|
|
|
|
|
|
|
|
|
|
|
|
Couplings, Clutches & Brakes |
|
$ |
20,905 |
|
|
$ |
15,180 |
|
|
$ |
15,897 |
|
|
Electromagnetic Clutches & Brakes |
|
|
4,950 |
|
|
|
4,615 |
|
|
|
4,565 |
|
|
Gearing |
|
|
6,866 |
|
|
|
7,000 |
|
|
|
6,617 |
|
|
Corporate |
|
|
3,304 |
|
|
|
3,103 |
|
|
|
3,042 |
|
|
Total depreciation and amortization |
|
$ |
36,025 |
|
|
$ |
29,898 |
|
|
$ |
30,121 |
|
|
|
|
|
|
|
|
|
|
|
|
|
|
|
|
|
|
Years Ended December 31, |
|
|
|
|
|
|||||
|
|
|
2017 |
|
|
2016 |
|
|
|
|
|
||
|
Total assets: |
|
|
|
|
|
|
|
|
|
|
|
|
|
Couplings, Clutches & Brakes |
|
$ |
547,738 |
|
|
$ |
511,934 |
|
|
|
|
|
|
Electromagnetic Clutches & Brakes |
|
|
183,197 |
|
|
|
169,507 |
|
|
|
|
|
|
Gearing |
|
|
155,541 |
|
|
|
147,829 |
|
|
|
|
|
|
Corporate (2) |
|
|
34,181 |
|
|
|
40,554 |
|
|
|
|
|
|
Total assets |
|
$ |
920,657 |
|
|
$ |
869,824 |
|
|
|
|
|
|
(2) |
Corporate assets are primarily cash and cash equivalents, tax related asset accounts, certain capitalized software costs, property, plant and equipment and deferred financing costs. |
76
|
|
|
Net Sales |
|
|
Property, Plant and Equipment |
|
||||||||||||||
|
|
|
Years Ended December 31, |
|
|||||||||||||||||
|
|
|
2017 |
|
|
2016 |
|
|
2015 |
|
|
2017 |
|
|
2016 |
|
|||||
|
North America (primarily U.S.) |
|
$ |
441,208 |
|
|
$ |
418,536 |
|
|
$ |
452,172 |
|
|
$ |
84,337 |
|
|
$ |
81,675 |
|
|
Europe |
|
|
342,867 |
|
|
|
217,736 |
|
|
|
218,857 |
|
|
|
100,733 |
|
|
|
89,672 |
|
|
Asia and other |
|
|
92,662 |
|
|
|
72,634 |
|
|
|
75,623 |
|
|
|
6,847 |
|
|
|
5,696 |
|
|
Total |
|
$ |
876,737 |
|
|
$ |
708,906 |
|
|
$ |
746,652 |
|
|
$ |
191,918 |
|
|
$ |
177,043 |
|
Net sales to third parties are attributed to the geographic regions based on the country in which the shipment originates. Amounts attributed to the geographic regions for property, plant and equipment are based on the location of the entity, which holds such assets.
16. Unaudited Quarterly Results of Operations:
Year ended December 31, 2017
|
|
|
Fourth Quarter |
|
|
Third Quarter |
|
|
Second Quarter |
|
|
First Quarter |
|
||||
|
Net Sales |
|
$ |
223,322 |
|
|
$ |
214,623 |
|
|
$ |
223,357 |
|
|
$ |
215,435 |
|
|
Gross Profit |
|
|
68,470 |
|
|
|
69,013 |
|
|
|
72,126 |
|
|
|
66,167 |
|
|
Net income (1) |
|
|
12,440 |
|
|
|
13,277 |
|
|
|
15,384 |
|
|
|
10,326 |
|
|
Earnings per share — Basic |
|
|
|
|
|
|
|
|
|
|
|
|
|
|
|
|
|
Net income |
|
$ |
0.43 |
|
|
$ |
0.46 |
|
|
$ |
0.53 |
|
|
$ |
0.36 |
|
|
Earnings per share — Diluted |
|
|
|
|
|
|
|
|
|
|
|
|
|
|
|
|
|
Net income |
|
$ |
0.43 |
|
|
$ |
0.46 |
|
|
$ |
0.53 |
|
|
$ |
0.36 |
|
|
(1) Includes restructuring costs by quarter |
|
$ |
367 |
|
|
$ |
680 |
|
|
$ |
1,198 |
|
|
$ |
1,898 |
|
Year ended December 31, 2016
|
|
|
Fourth Quarter |
|
|
Third Quarter |
|
|
Second Quarter |
|
|
First Quarter |
|
||||
|
Net Sales |
|
$ |
172,647 |
|
|
$ |
173,132 |
|
|
$ |
182,674 |
|
|
$ |
180,453 |
|
|
Gross Profit |
|
|
55,127 |
|
|
|
54,175 |
|
|
|
58,200 |
|
|
|
54,630 |
|
|
Net income (1) |
|
|
1,668 |
|
|
|
5,313 |
|
|
|
9,349 |
|
|
|
8,810 |
|
|
Earnings per share — Basic |
|
|
|
|
|
|
|
|
|
|
|
|
|
|
|
|
|
Net income |
|
$ |
0.06 |
|
|
$ |
0.21 |
|
|
$ |
0.36 |
|
|
$ |
0.34 |
|
|
Earnings per share — Diluted |
|
|
|
|
|
|
|
|
|
|
|
|
|
|
|
|
|
Net income |
|
$ |
0.06 |
|
|
$ |
0.21 |
|
|
$ |
0.36 |
|
|
$ |
0.34 |
|
|
(1) Includes restructuring costs by quarter |
|
$ |
3,258 |
|
|
$ |
3,397 |
|
|
$ |
1,641 |
|
|
$ |
1,553 |
|
17. Subsequent Events
On February 13, 2018, the Company declared a dividend of $0.17 per share for the quarter ended March 31, 2018, payable on April 3, 2018 to stockholders of record as of March 19, 2018.
Termination of Defined Benefit Plan
The Company commenced its plan to terminate its U.S. Pension Plan in June 2017 and distributed a portion of the Plan assets during the fourth quarter of 2017 as a partial plan settlement, see Note 8. During the first quarter of 2018, the company completed the plan termination and made a final contribution of $1.3 million to fully fund the benefit obligation prior to settlement. The company settled the remaining benefit obligation of approximately $18.7 million by transferring the remaining plan assets and liability obligations to a third party. The company will record an additional settlement loss of $5.3 million in the first Quarter of 2018.
77
Item 9.Changes in and Disagreements with Accountants on Accounting and Financial Disclosure
None.
1. Disclosure Controls and Procedures
As of December 31, 2017, or the Evaluation Date, our management, under the supervision and with the participation of our chief executive officer and chief financial officer, carried out an evaluation of the effectiveness of our “disclosure controls and procedures” as defined in Rules 13a-15(e) and 15d-15(e) of the Securities Exchange Act of 1934, as amended, or the Exchange Act. Our disclosure controls and procedures are designed to provide reasonable assurance that information required to be disclosed in reports filed under the Exchange Act, such as this Form 10-K, is (i) recorded, processed, summarized and reported within the time periods specified in the SEC’s rules and forms, and (ii) accumulated and communicated to management, including the principal executive and financial officers, as appropriate to allow timely decisions regarding required disclosures. Based upon that evaluation, our chief executive officer and chief financial officer have concluded that, as of the Evaluation Date, our disclosure controls and procedures are effective at a reasonable assurance level.
2. Internal Control Over Financial Reporting
(a) Management’s Report on Internal Control Over Financial Reporting
Our management is responsible for establishing and maintaining adequate internal control over financial reporting, as such term is defined in Rules 13a-15(f) and 15d-15(f) under the Exchange Act. Internal control over financial reporting is a process designed by, or under the supervision of, our chief executive officer and chief financial officer, and implemented by our Board of Directors, management and other personnel to provide reasonable assurance regarding the reliability of financial reporting and the preparation of financial statements for external purposes in accordance with generally accepted accounting principles. Internal control over financial reporting includes those policies and procedures that:
|
|
• |
pertain to the maintenance of records that in reasonable detail accurately and fairly reflect our transactions and dispositions of assets; |
|
|
• |
provide reasonable assurance that transactions are recorded as necessary to permit preparation of financial statements in accordance with GAAP, and that receipts and expenditures are being made only in accordance with authorizations of our management and directors; and |
|
|
• |
provide reasonable assurance regarding prevention or timely detection of unauthorized acquisition, use or disposition of our assets that could have a material effect on the financial statements. |
Because of inherent limitations, internal control over financial reporting may not prevent or detect misstatements. Also, projections of any evaluation of effectiveness to future periods are subject to the risk that controls may become inadequate because of changes in conditions, or that the degree of compliance with the policies or procedures may deteriorate.
Our management, under the supervision and with the participation of our chief executive officer and chief financial officer, has evaluated the effectiveness of our internal control over financial reporting as of December 31, 2017 based on the criteria established in Internal Control — Integrated Framework (2013) issued by the Committee of Sponsoring Organizations of the Treadway Commission (COSO). Management has concluded that our internal control over financial reporting was effective as of December 31, 2017.
The effectiveness of our internal control over financial reporting as of December 31, 2017 has been audited by Deloitte & Touche LLP, an independent registered public accounting firm, as stated in their report which is included in this Annual Report on Form 10-K.
78
(b) Report of the Independent Registered Public Accounting Firm
To the Stockholders and the Board of Directors of
Altra Industrial Motion Corp.
Opinion on Internal Control over Financial Reporting
We have audited the internal control over financial reporting of Altra Industrial Motion Corp. and subsidiaries (the “Company”) as of December 31, 2017, based on criteria established in Internal Control — Integrated Framework (2013) issued by the Committee of Sponsoring Organizations of the Treadway Commission (COSO). In our opinion, the Company maintained, in all material respects, effective internal control over financial reporting as of December 31, 2017, based on criteria established in Internal Control — Integrated Framework (2013) issued by COSO.
We have also audited, in accordance with the standards of the Public Company Accounting Oversight Board (United States) (PCAOB), the consolidated financial statements as of and for the year ended December 31, 2017, of the Company and our report dated February 23, 2018, expressed an unqualified opinion on those financial statements.
Basis for Opinion
The Company’s management is responsible for maintaining effective internal control over financial reporting and for its assessment of the effectiveness of internal control over financial reporting, included in the accompanying Management’s Report on Internal Control over Financial Reporting. Our responsibility is to express an opinion on the Company’s internal control over financial reporting based on our audit. We are a public accounting firm registered with the PCAOB and are required to be independent with respect to the Company in accordance with the U.S. federal securities laws and the applicable rules and regulations of the Securities and Exchange Commission and the PCAOB.
We conducted our audit in accordance with the standards of the PCAOB. Those standards require that we plan and perform the audit to obtain reasonable assurance about whether effective internal control over financial reporting was maintained in all material respects. Our audit included obtaining an understanding of internal control over financial reporting, assessing the risk that a material weakness exists, testing and evaluating the design and operating effectiveness of internal control based on the assessed risk, and performing such other procedures as we considered necessary in the circumstances. We believe that our audit provides a reasonable basis for our opinion.
Definition and Limitations of Internal Control over Financial Reporting
A company’s internal control over financial reporting is a process designed to provide reasonable assurance regarding the reliability of financial reporting and the preparation of financial statements for external purposes in accordance with generally accepted accounting principles. A company’s internal control over financial reporting includes those policies and procedures that (1) pertain to the maintenance of records that, in reasonable detail, accurately and fairly reflect the transactions and dispositions of the assets of the company; (2) provide reasonable assurance that transactions are recorded as necessary to permit preparation of financial statements in accordance with generally accepted accounting principles, and that receipts and expenditures of the company are being made only in accordance with authorizations of management and directors of the company; and (3) provide reasonable assurance regarding prevention or timely detection of unauthorized acquisition, use, or disposition of the company’s assets that could have a material effect on the financial statements.
Because of its inherent limitations, internal control over financial reporting may not prevent or detect misstatements. Also, projections of any evaluation of effectiveness to future periods are subject to the risk that controls may become inadequate because of changes in conditions, or that the degree of compliance with the policies or procedures may deteriorate.
/s/ Deloitte & Touche LLP
Boston, Massachusetts
February 23, 2018
79
(c) Changes in Internal Control over Financial Reporting
There has been no change in our internal control over financial reporting (as defined in Rule 13a–15(f) under the Exchange Act) that occurred during our quarter ended December 31, 2017, that has materially affected, or is reasonably likely to materially affect, our internal control over financial reporting.
Disclosure of Activities Under Section 13(r) of the Securities Exchange Act of 1934
Under Section 219 of the Iran Threat Reduction and Syria Human Rights Act of 2012, which added Section 13(r) to the Securities Exchange Act of 1934, as amended, we are required to disclose whether Altra or any of its affiliates knowingly engaged in certain activities, transactions or dealings relating to Iran or certain designated individuals or entities. Disclosure is required even when the activities were conducted outside the United States by non-U.S. entities and even when such activities were conducted in compliance with applicable law. The following information is disclosed pursuant to Section 13(r). None of the following activities involved U.S. affiliates of Altra.
During the three months ended December 31, 2017, Bibby Transmissions Limited, a subsidiary of Altra organized and existing under the laws of England (“Bibby”), sold couplings to a customer in the United Kingdom, for ultimate re-sale to an Iranian end user for use in a gas treating plant. Total gross revenues received by Bibby in connection with these transactions were approximately GBP 57.3 thousand and net profits were approximately GBP 21.1 thousand. Bibby intends to continue pursuing opportunities with this direct customer and end user, to the extent compliant with applicable law.
PART III
The information required by this item is incorporated by reference to our definitive 2018 Proxy Statement to be filed no later than 120 days after December 31, 2017.
The information required by this item is incorporated by reference to our definitive 2018 Proxy Statement to be filed no later than 120 days after December 31, 2017.
|
Item 12. |
Security Ownership of Certain Beneficial Owners and Management and Related Stockholder Matters |
The information required by this item is incorporated by reference to our definitive 2018 Proxy Statement to be filed no later than 120 days after December 31, 2017.
The information required by this item is incorporated by reference to our definitive 2018 Proxy Statement to be filed no later than 120 days after December 31, 2017.
The information required by this item is incorporated by reference to our definitive 2018 Proxy Statement to be filed no later than 120 days after December 31, 2017.
80
PART IV
(a) List of documents filed as part of this report:
(1) Financial Statements.
|
|
i. |
Consolidated Balance Sheets as of December 31, 2017 and 2016 |
|
|
ii. |
Consolidated Statements of Income for the Fiscal Years ended December 31, 2017, 2016 and 2015 |
|
|
iii. |
Consolidated Statements of Comprehensive Income for the Fiscal Years ended December 31, 2017, 2016 and 2015 |
|
|
iv. |
Consolidated Statements of Stockholders’ Equity as of December 31, 2017, 2016 and 2015 |
|
|
v. |
Consolidated Statements of Cash Flows for the Fiscal Years ended December 31, 2017, 2016 and 2015 |
|
|
vi. |
Unaudited Quarterly Results of Operations for the Fiscal Years ended December 31, 2017 and 2016 |
(2) Financial Statement Schedule
|
|
ii. |
Schedule II — Valuation and Qualifying Accounts |
81
(3) Exhibits List
|
Number |
|
Description |
|
|
|
|
|
2.1(1) |
|
LLC Purchase Agreement, dated as of October 25, 2004, among Warner Electric Holding, Inc., Colfax Corporation and CPT Acquisition Corp., a subsidiary of Altra Holdings, Inc. (P) |
|
|
|
|
|
2.2(1) |
|
Assignment and Assumption Agreement, dated as of November 21, 2004, between Altra Holdings, Inc. and Altra Industrial Motion, Inc. (P) |
|
|
|
|
|
2.3(2) |
|
Share Purchase Agreement, dated as of November 7, 2005, among Altra Industrial Motion, Inc. and the stockholders of Hay Hall Holdings Limited listed therein. (P) |
|
|
|
|
|
2.4(3) |
|
|
|
|
|
|
|
2.5(5) |
|
|
|
|
|
|
|
2.6(9) |
|
|
|
|
|
|
|
2.7(14) |
|
|
|
2.8(17) |
|
|
|
3.1(4) |
|
Second Amended and Restated Certificate of Incorporation of Altra Holdings, Inc. |
|
|
|
|
|
3.2(6) |
|
|
|
|
|
|
|
3.3(12) |
|
|
|
|
|
|
|
4.1(4) |
|
|
|
|
|
|
|
4.2(8) |
|
|
|
|
|
|
|
10.2(7) |
|
|
|
|
|
|
|
10.3(10) |
|
|
|
|
|
|
|
10.4(6) |
|
|
|
|
|
|
|
10.5(15) |
|
|
|
|
|
|
|
10.6(1) |
|
Altra Holdings, Inc. 2004 Equity Incentive Plan.† (P) |
|
|
|
|
|
10.7(3) |
|
Amendment to Altra Holdings, Inc. 2004 Equity Incentive Plan.† |
|
|
|
|
|
10.8(4) |
|
Second Amendment to Altra Holdings, Inc. 2004 Equity Incentive Plan.† |
|
|
|
|
|
10.9(13) |
|
The March 2012 Amendment to Altra Holdings, Inc. 2004 Equity Incentive Plan.† |
|
|
|
|
|
10.10(1) |
|
Form of Altra Holdings, Inc. Restricted Stock Award Agreement under Altra Holdings Inc.’s 2004 Equity Incentive Plan and the amendments thereto.† (P) |
|
|
|
|
|
10.11(8) |
|
|
|
|
|
|
|
10.12(16) |
|
|
82
|
Number |
|
Description |
|
10.13(17) |
|
|
|
10.14(16) |
|
|
|
|
|
|
|
10.15(11) |
|
|
|
|
|
|
|
10.16(11) |
|
|
|
|
|
|
|
10.17(11) |
|
|
|
|
|
|
|
10.18(16) |
|
|
|
|
|
|
|
10.19(16) |
|
|
|
|
|
|
|
10.20(18) |
|
|
|
|
|
|
|
10.21(16) |
|
|
|
|
|
|
|
10.22(16) |
|
|
|
|
|
|
|
21.1 |
|
Subsidiaries of Altra Industrial Motion Corp.* |
|
|
|
|
|
23.1 |
|
Consent of Deloitte & Touche LLP, independent registered public accounting firm.* |
|
|
|
|
|
31.1 |
|
Certification of Chief Executive Officer Pursuant to Section 302 of the Sarbanes-Oxley Act of 2002.* |
|
|
|
|
|
31.2 |
|
Certification of Chief Financial Officer Pursuant to Section 302 of the Sarbanes-Oxley Act of 2002.* |
|
|
|
|
|
32.1 |
|
Certification of Chief Executive Officer Pursuant to Section 906 of the Sarbanes-Oxley Act of 2002.* |
|
|
|
|
|
32.2 |
|
Certification of Chief Financial Officer Pursuant to Section 906 of the Sarbanes-Oxley Act of 2002.* |
|
|
|
|
|
101 |
|
The following materials from the Company’s Annual Report on Form 10-K for the year ended December 31, 2015, formatted in XBRL (Extensible Business Reporting Language): (i) the Audited Consolidated Statement of Income, (ii) the Audited Consolidated Statement of Comprehensive Income, (iii) the Audited Consolidated Balance Sheet, (iv) the Audited Consolidated Statement of Cash Flows, (v) the Statements of Stockholders’ Equity, (vi) Notes to Audited Consolidated Financial Statements, (vii) Valuation and Qualifying Accounts.* |
|
(1) |
Incorporated by reference to Altra Industrial Motion, Inc.’s Registration Statement on Form S-4 filed with the Securities and Exchange Commission on May 16, 2005. |
|
(2) |
Incorporated by reference to Altra Industrial Motion, Inc.’s Current Report on Form 8-K filed with the Securities and Exchange Commission on February 14, 2006. |
|
(3) |
Incorporated by reference to Altra Holdings, Inc.’s Registration Statement on Form S-1 filed with the Securities and Exchange Commission on September 29, 2006. |
|
(4) |
Incorporated by reference to Altra Holdings, Inc.’s Registration Statement on Form S-1/A filed with the Securities and Exchange Commission on December 4, 2006. |
|
(5) |
Incorporated by reference to Altra Holdings, Inc.’s Current Report on Form 8-K filed with the Securities and Exchange Commission on February 20, 2007. |
|
(6) |
Incorporated by reference to Altra Holdings, Inc.’s Current Report on Form 8-K filed with the Securities and Exchange Commission on October 27, 2008. |
|
(7) |
Incorporated by reference to Altra Holdings, Inc.’s Annual Report on Form 10-K filed with the Securities and Exchange Commission for the fiscal year ended December 31, 2008. |
|
(8) |
Incorporated by reference to Altra Holdings, Inc.’s Current Report on Form 8-K filed with the Securities and Exchange Commission on March 7, 2011. |
83
|
(9) |
Incorporated by reference to Altra Holdings, Inc.’s Quarterly Report on Form 10-Q filed with the Securities and Exchange Commission on August 9, 2011. |
|
(10) |
Incorporated by reference to Altra Holdings, Inc.’s Quarterly Report on Form 10-Q filed with the Securities and Exchange Commission on November 7, 2012. |
|
(11) |
Incorporated by reference to Altra Holdings, Inc.’s Annual Report on Form 10-K filed with the Securities and Exchange Commission for the fiscal year ended December 31, 2012. |
|
(12) |
Incorporated by reference to Altra Holdings, Inc.’s Current Report on Form 8-K filed with the Securities and Exchange Commission on November 25, 2013. |
|
(13) |
Incorporated by reference to Altra Holdings, Inc.’s Proxy Statement filed with the Securities and Exchange Commission on March 22, 2012. |
|
(14) |
Incorporated by reference to Altra Industrial Motion Corp.’s Annual Report on Form 10-K filed with the Securities and Exchange Commission for the fiscal year ended December 31, 2013. |
|
(15) |
Incorporated by reference to Altra Industrial Motion Corp.’s Quarterly Report on Form 10-Q filed with the Securities and Exchange Commission on May 4, 2015. |
|
(16) |
Incorporated by reference to Altra Industrial Motion Corp.’s Annual Report on Form 10-K filed with the Securities and Exchange Commission for the fiscal year ended December 31, 2015. |
|
(17) |
Incorporated by reference to Altra Industrial Motion Corp.’s Annual Report on Form 10-K filed with the Securities and Exchange Commission for the fiscal year ended December 31, 2016 |
|
(18) |
Incorporated by reference to Annex A filed with Altra Industrial Motion Corp.’s Proxy Statement filed with the Securities and Exchange Commission on March 24, 2017. |
|
* |
Filed herewith. |
|
† |
Management contract or compensatory plan or arrangement. |
|
# |
Application has been made to the Securities and Exchange Commission to seek confidential treatment of certain provisions. Omitted material for which confidential treatment has been requested has been filed separately with the Securities and Exchange Commission. |
|
** |
Schedules and exhibits to these agreements have been omitted from this filing pursuant to Item 601(b)(2) of Regulation S-K. The Company will furnish supplemental copies of such omitted schedules and exhibits to the Securities and Exchange Commission upon request. |
|
(P) |
This Exhibit was originally filed in paper format. Accordingly, a hyperlink has not been provided. |
Note: Altra Holdings, Inc. changed its name to Altra Industrial Motion Corp. effective November 22, 2013.
Item 15(a)(2)
ALTRA INDUSTRIAL MOTION CORP.
SCHEDULE II — VALUATION AND QUALIFYING ACCOUNTS
|
Reserve for Uncollectible Accounts: |
|
Balance at Beginning of Period |
|
|
Additions |
|
|
Deductions |
|
|
Balance at End of Period |
|
||||
|
For the year ended December 31, 2015 |
|
$ |
2,302 |
|
|
$ |
785 |
|
|
$ |
(922 |
) |
|
$ |
2,165 |
|
|
For the year ended December 31, 2016 |
|
$ |
2,165 |
|
|
$ |
1,245 |
|
|
$ |
(296 |
) |
|
$ |
3,114 |
|
|
For the year ended December 31, 2017 |
|
$ |
3,114 |
|
|
$ |
1,868 |
|
|
$ |
(440 |
) |
|
$ |
4,542 |
|
84
Exhibit Index
|
Number |
|
Description |
|
|
|
|
|
21.1 |
|
Subsidiaries of Altra Industrial Motion Corp. |
|
|
|
|
|
23.1 |
|
Consent of Deloitte & Touche LLP, independent registered public accounting firm. |
|
|
|
|
|
31.1 |
|
Certification of Chief Executive Officer Pursuant to Section 302 of the Sarbanes-Oxley Act of 2002. |
|
|
|
|
|
31.2 |
|
Certification of Chief Financial Officer Pursuant to Section 302 of the Sarbanes-Oxley Act of 2002. |
|
|
|
|
|
32.1 |
|
Certification of Chief Executive Officer Pursuant to Section 906 of the Sarbanes-Oxley Act of 2002. |
|
|
|
|
|
32.2 |
|
Certification of Chief Financial Officer Pursuant to Section 906 of the Sarbanes-Oxley Act of 2002. |
|
|
|
|
|
101 |
|
The following materials from the Company’s Annual Report on Form 10-K for the year ended December 31, 2017, formatted in XBRL (Extensible Business Reporting Language): (i) the Audited Consolidated Statement of Income, (ii) the Audited Consolidated Statement of Comprehensive Income, (iii) the Audited Consolidated Balance Sheet, (iv) the Audited Consolidated Statement of Cash Flows, (v) the Statements of Stockholders’ Equity, (vi) Notes to Audited Consolidated Financial Statements, and (vii) Valuation and Qualifying Accounts.* |
|
None |
85
SIGNATURES
Pursuant to the requirements of Section 13 or 15(d) of the Securities Exchange Act of 1934, the registrant has duly caused this report to be signed on its behalf by the undersigned, thereunto duly authorized.
|
|
|
ALTRA INDUSTRIAL MOTION CORP. |
||||
|
|
|
|
|
|
||
|
February 23, 2018 |
|
By: |
|
/s/ Carl R. Christenson |
||
|
|
|
|
|
Name: |
|
Carl R. Christenson |
|
|
|
|
|
Title: |
|
Chairman and Chief Executive |
|
|
|
|
|
|
|
Officer |
Pursuant to the requirements of the Securities Exchange Act of 1934, this report has been signed below by the following persons on behalf of the registrant and in the capacities and on the dates indicated.
|
February 23, 2018 |
|
By: |
|
/s/ Carl R. Christenson |
||
|
|
|
|
|
Name: |
|
Carl R. Christenson |
|
|
|
|
|
Title: |
|
Chairman and Chief Executive |
|
|
|
|
|
|
|
Officer, Director |
|
|
|
|
|
|
|
|
|
February 23, 2018 |
|
By: |
|
/s/ Christian Storch |
||
|
|
|
|
|
Name: |
|
Christian Storch |
|
|
|
|
|
Title: |
|
Vice President and Chief Financial |
|
|
|
|
|
|
|
Officer |
|
|
|
|
|
|
|
|
|
February 23, 2018 |
|
By: |
|
/s/ Todd B. Patriacca |
||
|
|
|
|
|
Name: |
|
Todd B. Patriacca |
|
|
|
|
|
Title: |
|
Chief Accounting Officer |
|
|
|
|
|
|
|
|
|
February 23, 2018 |
|
By: |
|
/s/ Edmund M. Carpenter |
||
|
|
|
|
|
Name: |
|
Edmund M. Carpenter |
|
|
|
|
|
Title: |
|
Director |
|
|
|
|
|
|
|
|
|
February 23, 2018 |
|
By: |
|
/s/ Lyle G. Ganske |
||
|
|
|
|
|
Name: |
|
Lyle G. Ganske |
|
|
|
|
|
Title: |
|
Director |
|
|
|
|
|
|
|
|
|
February 23, 2018 |
|
By: |
|
/s/ Michael S. Lipscomb |
||
|
|
|
|
|
Name: |
|
Michael S. Lipscomb |
|
|
|
|
|
Title: |
|
Director |
|
|
|
|
|
|
|
|
|
February 23, 2018 |
|
By: |
|
/s/ Larry P. McPherson |
||
|
|
|
|
|
Name: |
|
Larry P. McPherson |
|
|
|
|
|
Title: |
|
Director |
|
|
|
|
|
|
|
|
|
February 23, 2018 |
|
By: |
|
/s/ Thomas W. Swidarski |
||
|
|
|
|
|
Name: |
|
Thomas W. Swidarski |
|
|
|
|
|
Title: |
|
Director |
|
|
|
|
|
|
|
|
|
February 23, 2018 |
|
By: |
|
/s/ James H. Woodward, Jr. |
||
|
|
|
|
|
Name: |
|
James H. Woodward, Jr. |
|
|
|
|
|
Title: |
|
Director |
86