Attached files
| file | filename |
|---|---|
| 8-K - FORM 8-K - USG CORP | d612900d8k.htm |
| EX-10.1 - EX-10.1 - USG CORP | d612900dex101.htm |
| EX-2.2 - EX-2.2 - USG CORP | d612900dex22.htm |
| EX-2.1 - EX-2.1 - USG CORP | d612900dex21.htm |
| EX-99.1 - EX-99.1 - USG CORP | d612900dex991.htm |
| EX-99.2 - EX-99.2 - USG CORP | d612900dex992.htm |
 16
October 2013 Jim Metcalf
Chairman, President & CEO
Mike Kane
CEO & Managing Director
Creating a World Leading Joint Venture
Asia –
Australasia –
Middle East
Exhibit 99.3
® |
 2
USG Cautionary Statements
This presentation contains forward-looking statements within the meaning of the Private Securities
Litigation Reform Act of 1995 related to management’s expectations about future
conditions. Actual business, market or other conditions may differ materially from
management’s expectations and, accordingly, may affect our sales and profitability or
other results and liquidity. Actual results may differ materially due to various other factors, including:
economic conditions, such as the levels of new home and other construction activity, employment
levels, the availability of mortgage, construction and other financing, mortgage and other
interest rates, housing affordability and supply, the levels of foreclosures and home resales,
currency exchange rates and consumer confidence; capital markets conditions and the
availability of borrowings under our credit agreement or other financings; our substantial
indebtedness and our ability to incur substantial additional indebtedness; competitive conditions,
such as price, service and product competition; shortages in raw materials; changes in raw
material and energy costs; volatility in the assumptions used to determine the funded status of
our pension plans; the loss of one or more major customers and our customers’ ability to
meet their financial obligations to us; capacity utilization rates for us and the industry; our
ability to expand into new geographic markets and the stability of such markets; our ability to
successfully enter into and operate the joint venture with Boral Limited, including risks that
our joint venture partner, Boral Limited, may not fulfill its obligations as an investor or may
take actions that are inconsistent with our objectives; our ability to protect our intellectual
property and other proprietary rights; changes in laws or regulations, including environmental and
safety regulations; the satisfactory performance of certain business functions by third party service
providers; our ability to achieve anticipated savings from cost reduction programs; the outcome
in contested litigation matters; the effects of acts of terrorism or war upon domestic and
international economies and financial markets; and acts of God. We assume no obligation to
update any forward-looking information contained in this presentation. Additional
information concerning these and other factors may be found in our filings with the Securities and
Exchange Commission, including the “Risk Factors” in our most recent Annual Report on
Form 10-K. |
 3
Content
1.
Overview of the transaction / strategic rationale
2.
USG’s IP / Technology and adjacent products
3.
JV’s combined footprint and markets
4.
Synergies
5.
Key transaction terms
6.
Company specific factors
7.
Summary
Appendix |
 Boral and USG are forming a US $1.6 billion
1
plasterboard and
ceilings joint venture, USG Boral Building Products, bringing together
Boral’s leading plasterboard manufacturing and distribution footprint
in Asia and Australia with USG’s world-leading building products
technologies and strategic assets in Asia and the Middle East.
1.
Asset value of US$1.6bn subject to finalisation of fair valuation, completion
adjustments and final foreign exchange rates at the date of completion
® |
 5
1.
US$1.6bn asset valuation subject to finalisation of fair valuation, completion
adjustments and final foreign exchange rates at the date of completion
2.
Middle East joint venture refers to assets held in Saudi Arabia
Overview of the transaction
50:50 US$1.6bn plasterboard and ceilings joint venture, USG Boral Building
Products, will encompass the following assets:
-
Boral’s Gypsum operations in Asia and Australia, including its holdings in,
or portions of, Gypsum Resources Australia (GRA) and Rondo joint ventures
with CSR -
USG’s
wholly
owned
operations
in
Asia,
New
Zealand,
and
its
holdings
in,
or
portions
of,
current
joint
ventures
in
the
Middle
East²,
Oman
and
China
-
Exclusive rights to use USG’s intellectual property including its
world-leading plasterboard, joint compound and ceilings
technologies To achieve 50% ownership interest, USG will make a US$500m
upfront cash payment to Boral
-
Boral will also have the potential to receive earn out payments of up to US$75m,
based on three-
and five-year earnings targets
1 |
 6
Creating a leading building products partnership
in Asia, Australasia and the Middle East
1.
Includes Asia, Australasia and the Middle East
The joint venture will be the market leader in its Territory
in sales, scale, distribution,
coverage (product and geography) and technology
USG
is a world leader in building products technologies with strategic assets in the
Middle East, New Zealand and Asia
BORAL
has a leading plasterboard manufacturing and distribution footprint in Asia and
Australia
Combined
business
delivers:
#1 or #2 position in most markets served
Sustainable long-term competitive advantage through game-changing
technologies Substantial synergies, expected from
-
Roll-out of USG technology across Boral’s Gypsum operations
-
Leveraging Boral’s distribution network to offer USG’s adjacent
products Capability to pursue and self-fund new opportunities
Over 150 years of combined industry leadership and experience
1
|
 7
Building
Products
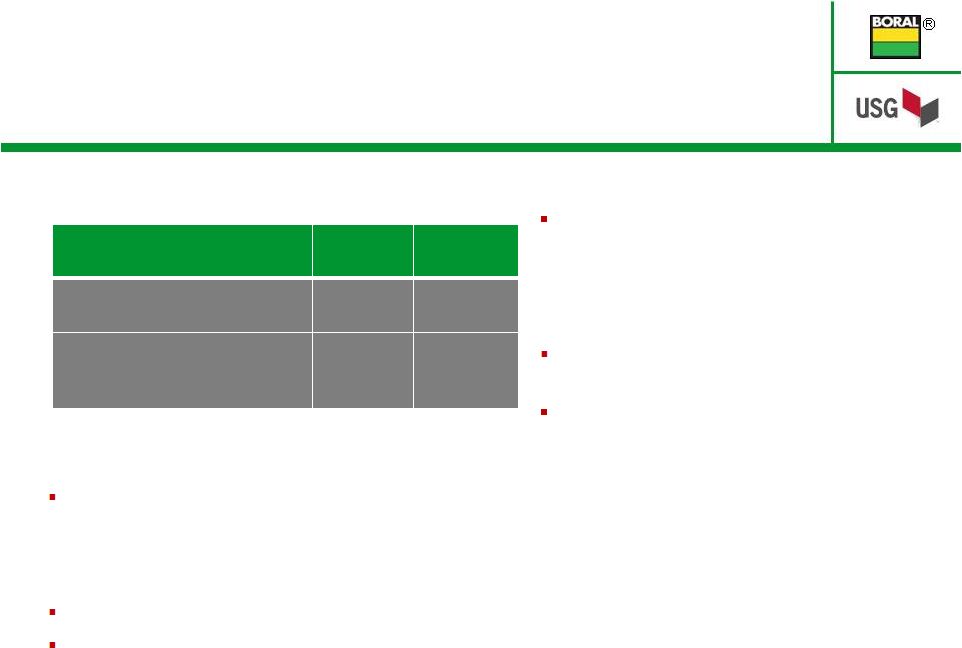
11%
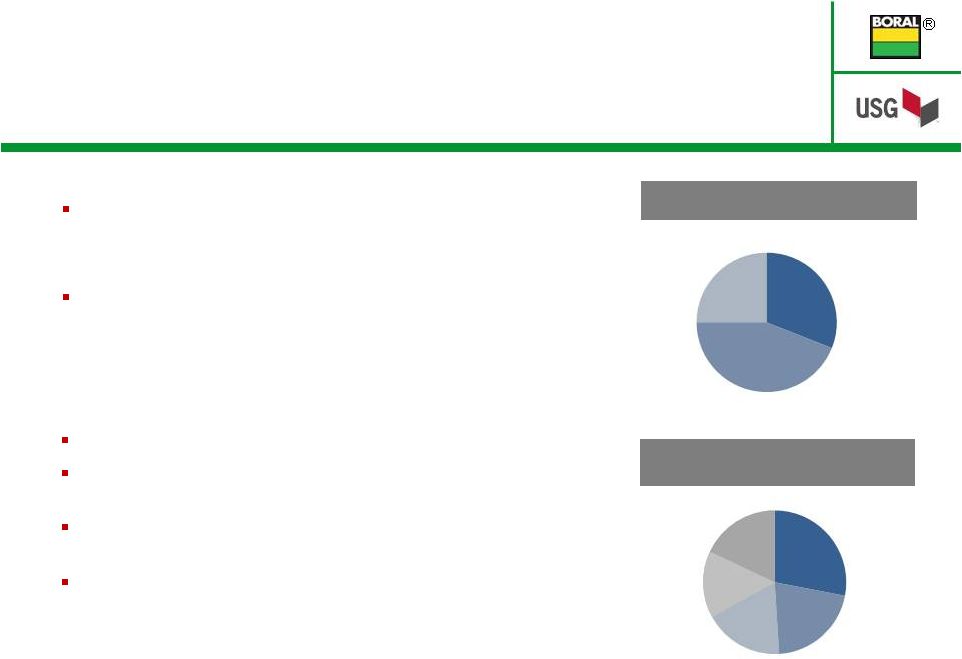
Overview of BORAL
(ASX: BLD)
A$3.7bn
market
cap
(US$3.5bn)
1
A$5.3bn
(US$5.4bn)
2
revenue
in
FY2013
3
12,610 employees as of 30 June 2013
Construction Materials, Building Products
and Gypsum
Australia, Asia and US
Overview of USG
(NYSE: USG)
US$3.0bn
market
cap
1
US$3.2bn
revenue
in
FY2012
3
8,500 employees as of 31 December 2012
Gypsum, Ceilings and Product Distribution
North America, South America, Asia and
Middle East
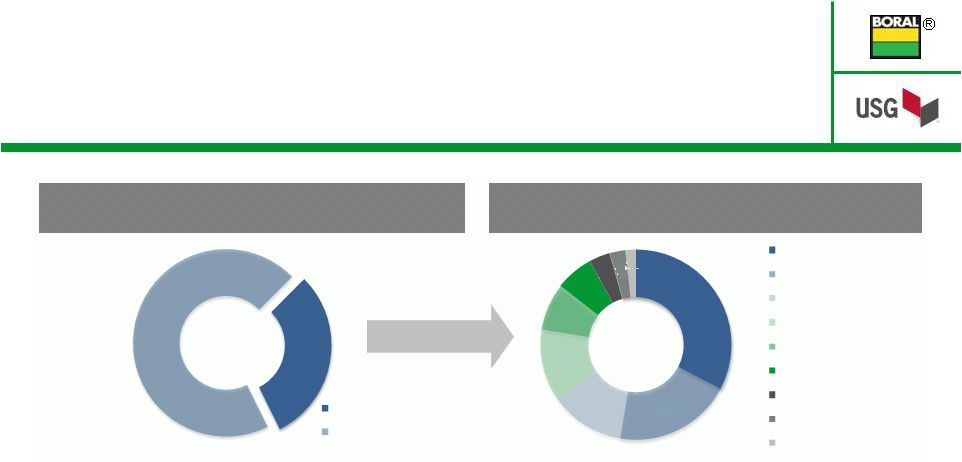
Geographic revenue –
FY2012
Segment revenue –
FY2012
Segment revenue –
FY2013
Geographic revenue –
FY2013
Construction
Materials &
Cement 60%
Boral USA 11%
Boral
Gypsum
18%
Australia
78%
Asia
11%
USA
11%
Product
distribution
4
31%
The joint venture partners
Gypsum
53%
Ceilings
16%
United
States
80%
Other
8%
Canada
12%
1.
Source: Company reports. Share price from IRESS and Factset as at 10 October 2013. Based on A$/US$
exchange rate of 0.95 as at 10 October 2013
2.
Based on average A$/US$ exchange rate of 1.02 for the year ended 30 June 2013 3.
Boral’s financial year ended 30 June 2013; USG’s financial year ended 31 December 2012 4.
USG’s Product Distribution business outside Asia and the Middle East and Boral’s Building
Products division (which includes Bricks, Roofing, Timber & Windows) are not a part of the
Joint Venture transaction |
 8
USG
BLD
50%
50%
Korea
Thailand/
Philippines
Aus/NZ
India
Middle East
86m m²
(0.9 BSF)
capacity & Boral
sales presence in
Australia
50% Rondo metal
products
50% GRA gypsum
mine
USG NZ grid
manufacturing
USG sales
presence
105m m²
(1.1 BSF)
capacity in
Thailand &
Boral sales
presence (71%
interest)
Gypsum mine
Boral metal
products
USG sales
presence
65m m²
(0.7 BSF)
capacity &
Boral sales
presence
Boral metal
products
USG sales
presence
10m
m²
(0.1 BSF)
capacity in
Malaysia &
Boral sales
presence
50% Rondo
metal products
USG joint
compound
manufacturing
USG sales
presence
155m m²
(1.7 BSF)
capacity³
&
Boral sales
presence
Boral metal
products
50% interest in
USG ceiling
tile, metal
ceiling grid &
mineral wool
manufacturing
9m
m²
(0.1 BSF)
capacity &
Boral sales
presence
Boral metal
products
50% Rondo
metal
products
USG Joint
Compound
USG sales
presence
Boral sales
presence
50% interest in
8m m² (0.1 BSF)
plant in Oman³
55% interest in
Oman gypsum
mine
45% interest in
ceiling, metal
ceiling grid,
metal stud, and
joint compound
plant in Saudi
Arabia
Vietnam
USG TECHNOLOGY
153m m²
(1.6 BSF)²
capacity &
Boral sales
presence
USG sales
presence
42m m²
(0.5 BSF)
capacity³
&
Boral sales
presence
Boral metal
products
USG sales
presence
Boral operations
USG operations
Indonesia
China
Malaysia/
Singapore
1.
Actual structure will be via two JV legal entities
2.
m m² refers to million square metres; BSF refers to
billion square feet 3.
Post completion of capacity expansion at Ho Chi Minh City (Vietnam) and Chongqing
(China) in financial year ending 30 June 2014 and construction of new plant
in Oman in calendar year 2014 (CY2014) 4.
Post completion of manufacturing facility expected in 1Q CY2014
Overview of joint venture operations in
Asia, Australasia and the Middle East
USG Boral Building
Products¹
Plant
4 |
 9
Content
1.
Overview of the transaction / strategic rationale
2.
USG’s IP / Technology and adjacent products
3.
JV’s combined footprint and markets
4.
Synergies
5.
Key transaction terms
6.
Company specific factors
7.
Summary
Appendix |
 10
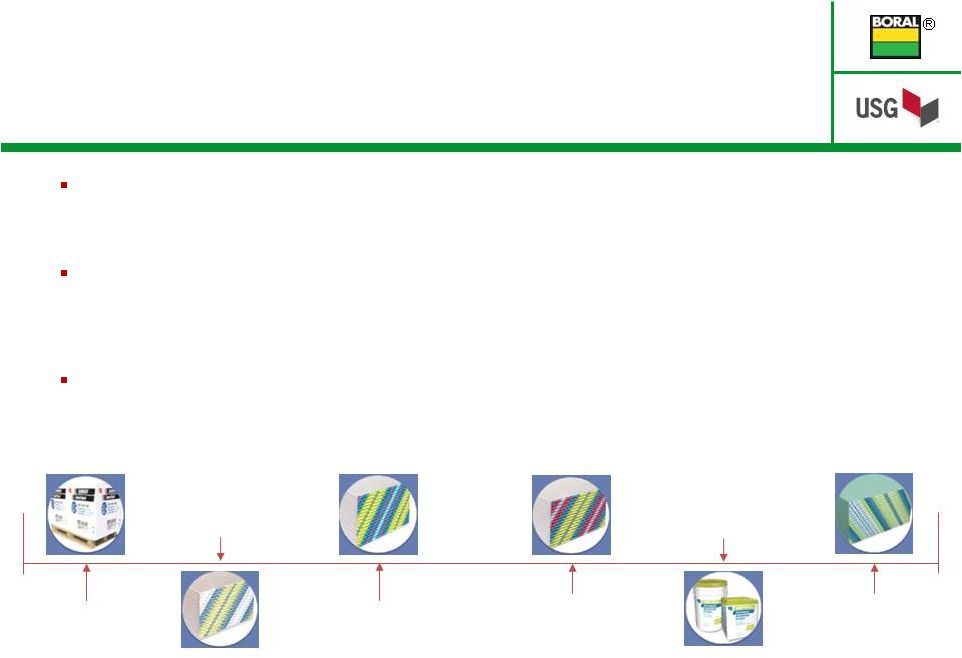
2009:
Durock
®
Cement Board
Next-Gen up to
25% lighter
2010:
SHEETROCK
®
Brand
UltraLight Panels up to 30%
lighter
2011:
SHEETROCK
®
Brand
UltraLight Panels
FIRECODE
®
30 up to
30% lighter
2011:
SHEETROCK
®
Brand
UltraLight Panels
FIRECODE
®
X
up to
15% lighter
2012:
SHEETROCK
®
Brand
UltraLightWeight
All Purpose Joint Compound up to
40% lighter
2013:
SHEETROCK
®
Brand
UltraLight Panels Mold
Tough
®
up to 20%
lighter
1.
See slide in appendix for an overview of USG’s technology journey and leading
innovations 2.
Equivalent cost compared to USG’s previous generation technology plasterboard,
but at a lower cost relative to industry standard / Boral Gypsum plasterboard
USG: A history of differentiating
through innovation
USG
has
led
every
major
industry
innovation
1
-
US$170m invested in R&D since 2003 with 2,000+ patents received
-
Dedicated research & development facility in Libertyville, Illinois, US
Significant recognition received for innovations
-
2011 –
Global Gypsum Magazine’s Product of the Year Award and The Home Depot’s
Product Innovation of the Year Award (SHEETROCK®
Brand UltraLight Panels)
-
2013 –
Ranked a Top Innovator in the Industrial Materials Sector by the Patent
Board Superior performing, lower weight products in plasterboard, cement
board and joint compound -
UltraLight
products
command
a
price
premium,
can
be
produced
at
equivalent
cost
2
and reduce freight
-
Better score and snap, superior sag resistance, and lighter weight characteristics
improve contractor and distributor productivities
|
 11
Strong market response and rapid
adoption of UltraLight technology
US: Total Board Volumes
1.
Classic volume refers to USG’s technologies preceding UltraLight third
generation technology Mexico
Improved performance attributes speeds adoption in emerging market
Lighter weight generates freight savings and improved profitability
Positioned as a premium price, superior performance product
Canada
Strong conversion rate attributed to performance characteristics
Lighter weight increases contractor productivity and profitability
High adoption rates in all end use markets
50% conversion across full USG plasterboard portfolio in 3
years ~80% of ½” wallboard converted to SHEETROCK®
Brand UltraLight Panels
Side by side comparison drives rapid adoption in the retail
channel Superior performance attributes encourage residential
adoption
Productivity enhancements yield strong
commercial conversion
United States
UltraLight Volume
USG Classic Volume
¹ |
 12
Customer testimonials illustrate the strong
value proposition of USG’s UltraLight portfolio
“When we started tracking board counts on this product we began seeing
production rate increases”
–
Commercial Contractor, US
“We will use the product whenever possible”
–
Residential Contractor, US
“I could do easily 5-10 more sheets”
–
Installer, US
“All attributes are excellent, I prefer this board”
–
Contractor, Mexico
“Lighter, easier to screw, easier to install, and has no difficulty
cutting” –
Contractor, Mexico
"Panel weight makes it easier to install & work with”
–
Contractor, Mexico
“It just flows onto the walls”
–
Contractor,
US
regarding
SHEETROCK®
Brand
UltraLightweight
Joint
Compound
For additional information :
www.theweighthasbeenlifted.com |
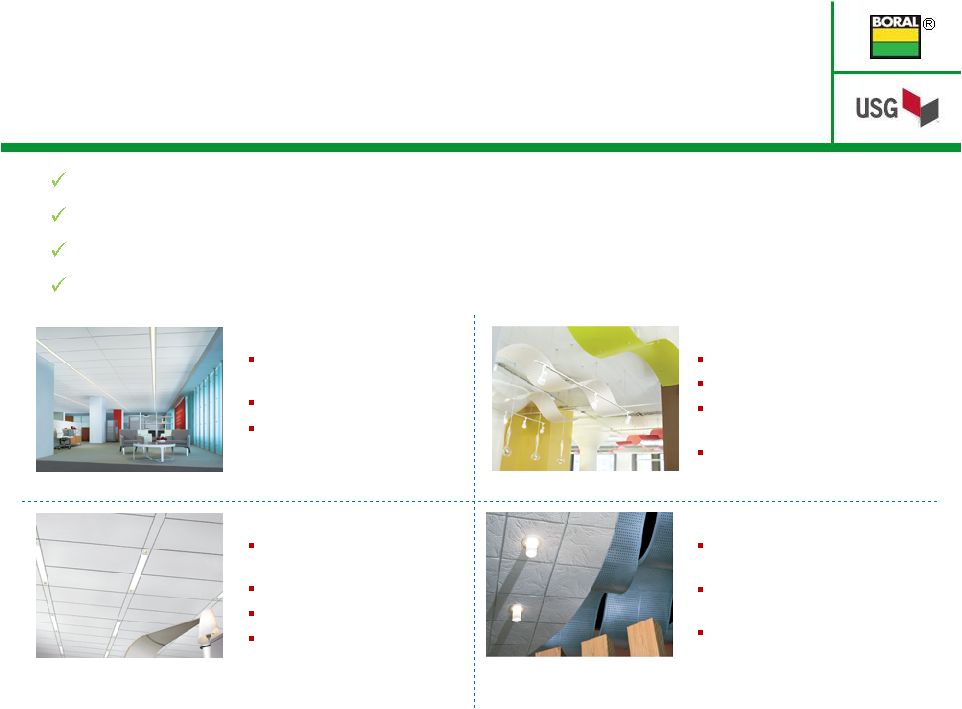 High-performance ceilings business provides
a strong, complementary adjacency that further
differentiates the joint venture
Acoustical Tile
Full-line high performance
offering
Sustainable solutions
Architectural specification
focused
Specialty Solutions
Innovator
Leading brands
Enhances the aesthetics of
finished space
Creates a basis of design for the
specifier
Suspension Systems
Globally recognised DONN®
grid
World class manufacturing
Complete code approvals
Partnered with GE for
integrated LED lighting solution
Commercial Segments
Extends the portfolio for
commercial projects
Strong in all commercial
segments
Broadens the portfolio of
product solutions for commercial
projects
#2 USG global share in the industry with leading brands
International manufacturing and market coverage
Profitable business with stable margins through the US cycle
Solutions focused on performance, sustainability and aesthetics
13 |
 14
Content
1.
Overview of the transaction / strategic rationale
2.
USG’s IP / Technology and adjacent products
3.
JV’
combined footprint and markets
4.
Synergies
5.
Key transaction terms
6.
Company specific factors
7.
Summary
Appendix |
 15
1.
Production either online or expected to be online in CY2014
2.
Production may be at the same physical location. Other production includes
ceiling tile, metal ceiling grid, metal products, joint compounds, mineral wool and cornice production
3.
Certain manufacturing facilities and gypsum quarries held in joint venture with
third parties (refer to page 8 of this presentation) CHINA
THAILAND
VIETNAM
MALAYSIA
INDONESIA
PHILIPPINES
SOUTH KOREA
AUSTRALIA
NEW ZEALAND
INDIA
SAUDI ARABIA
USG/ Boral
JV
Capacity
(m m²)1
633
Capacity
(BSF)1
6.8
Manufacturing footprint
(number of operations)
Boral plasterboard plant
Boral gypsum mine
³
Boral other production
2,3
USG plasterboard plant
1,3
USG gypsum mine
³
USG other production
1,2,3
18
2
28
3
1
4
2
3
1
3
1
3
2
1
3
1
3
3
5
6
1
2
OMAN
1
1
1
1
3
3
1
1
1
9
Joint venture has leading positions
across Asia, Australasia and the Middle East |
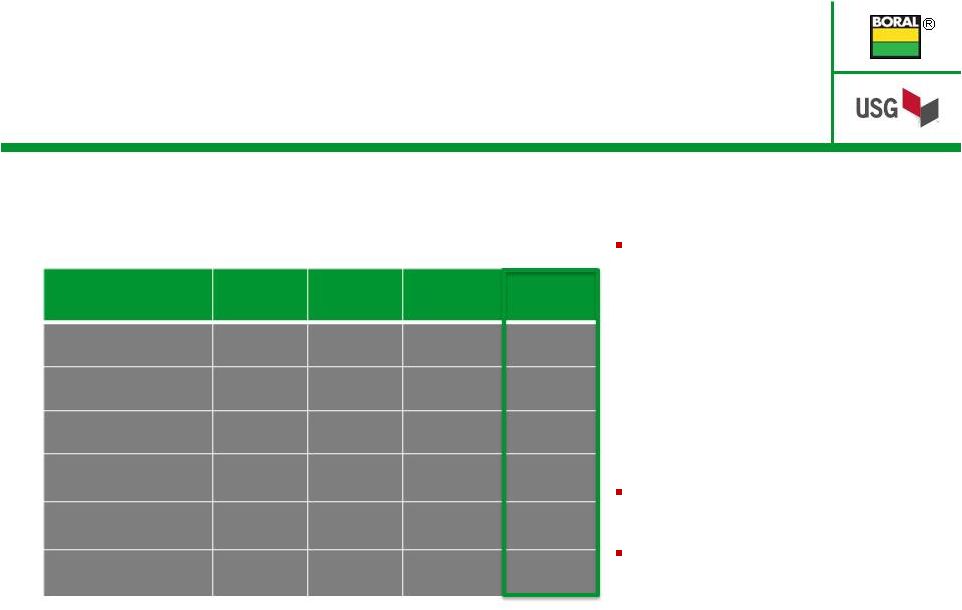
 16
JV plasterboard market share 2013
5
Country
Board Capacity
Board
lines
Non-board
production
Sales
offices
Gypsum
mine
(m m
2
)
(BSF)
China
155
1.7
7
9
7
-
Korea
153
1.6
4
3
6
-
Thailand
105
1.1
3
3
3
1
Australia
86
0.9
3
4
9
1
Indonesia
65
0.7
3
3
5
-
Vietnam
42
0.5
2
3
5
-
Malaysia/
Singapore
10
0.1
1
4
4
-
India
9
0.1
1
3
7
-
Other
4
-
-
-
1
8
-
New Zealand
-
-
-
1
1
-
Saudi Arabia
-
-
-
3
3
-
Oman
8
0.1
1
-
-
1
Total
633
6.8
25
37
58
3
Revenue contribution from largest to smallest
Joint venture market positions
37%
43%
54%
6%
41%
58%
48%
16%
55%
13%
1.
Production either online or expected to be online in CY2014 2.
Includes metal stud, metal ceiling grid, joint compound, ceiling tile, cornice and/or mineral wool
facilities
3.
Certain manufacturing facilities and gypsum mines held in joint venture with third parties (refer to
page 8 of this presentation)
4.
Other includes metal plant in the Philippines and export business in UAE, Philippines, and Hong Kong 5.
Source: management estimates based on plasterboard sales volume, excluding ceiling tiles
3
2
1
1
3
1
1
1
3
2
3
3
3
1
1
1 |
 17
2013
Market
size
in
JV
region
-
except
China
1
(million m²)
2013
Market
size
in
JV
region
1
(million m²)
Total
682
Total
2,262
1.
USG and Boral estimates for plasterboard market (excluding ceiling tiles)
2.
Middle East defined as including UAE, Oman and Saudi Arabia
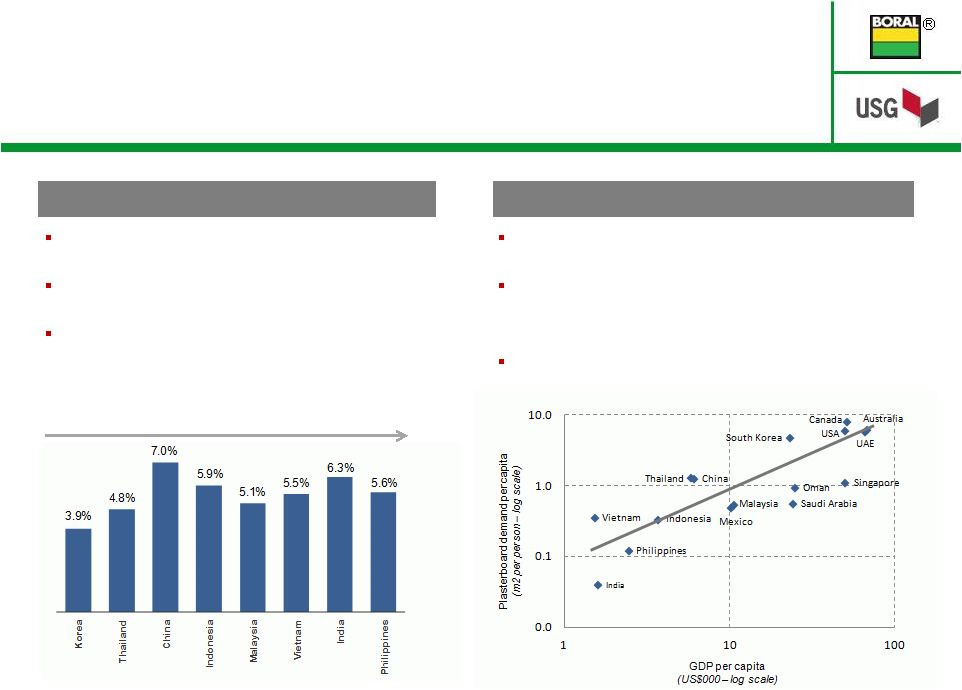
Asian markets represent strong growth
potential for JV building products
2
Non-China
China
223
136
87
83
55
44
24
18
12
Korea
Australia
Indonesia
Thailand
India
Vietnam
Malaysia & Singapore
Philippines
Middle East
Market Highlights
Korea:
Australia:
Indonesia:
Thailand:
China:
India:
Middle East:
mature market with appetite for high performance and high quality products
strong growth in third most populated country in Asia, with large consumer
market solid growth with opportunity to increase plasterboard
penetration largest market with continued growth due to government
limitations on brick and clay demand for faster building construction is
accelerating modern product usage steady growth resulting from strong
government investment in numerous markets mature market with strong
potential in residential wall penetration |
 18
Strong economic growth forecast across most
Asian markets
Increasing commercial projects expected to drive
growth in non-residential construction
Increasing urbanisation will drive growth in
residential new build
1.
Source: IMF data at October 2013
2.
Boral management estimates for plasterboard demand. GDP per capital and population
based on IMF 2013 forecast data. Real GDP growth –
Asian countries
Plasterboard demand/GDP per capita
Historically plasterboard use starts in ceilings then moves
to walls, and starts in commercial then moves to housing
Lightweight, flexible and easy to install characteristics
make plasterboard the interior lining product of choice
-
USG technology expected to enhance this attribute
Asia expected to become the world’s largest plasterboard
market by 2015
Forecast real GDP growth –
5 year CAGR to 2018
Revenue contribution from largest to smallest
Strong macro fundamentals driving
growing market demand
1
1
1 |
 19
Content
1.
Overview of the transaction / strategic rationale
2.
USG’s IP / Technology and adjacent products
3.
JV’s combined footprint and markets
4.
Synergies
5.
Key transaction terms
6.
Company specific factors
7.
Summary
Appendix |
 ®
Substantial synergies expected from both the application of
USG’s gypsum technologies (manufacturing and freight cost
savings plus revenue enhancements) and leveraging Boral’s
customer relationships and distribution platform
(USG’s adjacent products) |
 21
Targeted synergy breakdown
Manufacturing,
freight & other
cost savings
Adjacent products
through Boral
channels
Revenue
growth
Synergies -
geographic allocation
Australia
Korea
China
Thailand
Other
Anticipated synergies exceed US$50m per annum
within 3 years of completing technology roll-out
Synergies:
Adjacent product synergies to commence immediately
Other synergies to ramp up following 2 year phased
technology roll-out and as market penetration increases
Upfront operational expenditure will exceed synergies in first
two years
Based on extensive due diligence undertaken, including
product testing
Expect substantial synergies from:
Roll-out of USG’s technologies:
-
lower manufacturing & freight costs
-
enhanced revenues through price premium
Adjacent product sales through Boral market channels
-
ceiling products, metal products, cement and fibre board,
joint compounds |
 22
Implementation of technology
expected to be self-funded
Targeted roll-out of technologies across all gypsum manufacturing lines
Phased over approximately 2 years
Approximately US$50m of capital expenditure expected to implement technology
upgrades
Includes equipment modification, staff training, secondment of USG technology team
and other upgrades
Expected to be funded through JV cash flows |
 23
Content
1.
Overview of the transaction / strategic rationale
2.
USG’s IP / Technology and adjacent products
3.
JV’s combined footprint and markets
4.
Synergies
5.
Key transaction terms
6.
Company specific factors
7.
Summary
Appendix |
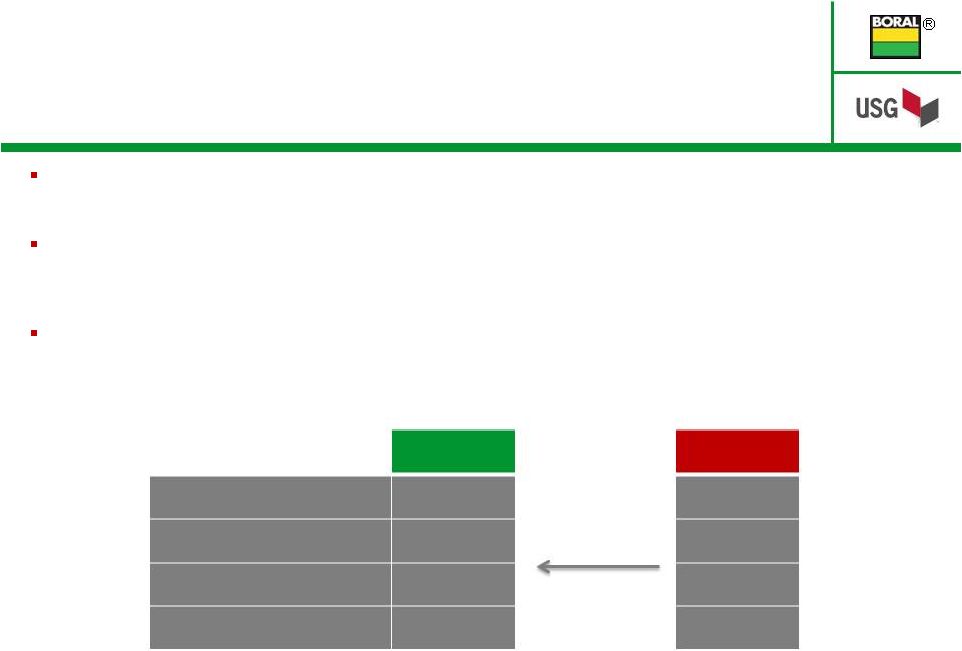 24
1.
Subject to finalisation of fair valuation, completion adjustments and final foreign
exchange rates at the date of completion Including USG’s and
Boral’s respective shares in non-controlling and controlled interests
2.
Subject to achieving three-
and five-year earnings targets
Estimated asset value of the joint venture is US$1.6bn¹
-
US$1.35bn for assets contributed by Boral; US$0.25bn for assets contributed by
USG USG’s contributed
assets include a perpetual licence in the JV’s Territory to USG’s
current plasterboard technology, and the ceilings, joint compound and grid
technologies currently used in the Territory (including improvements to
current technologies) Up to US$575m total payment from USG to Boral:
-
US$500m cash upfront
-
Earn out payments totalling up to US$75m² (net present
value of ~US$50m) Estimated transaction value¹ USD
BORAL
USG
Assets
$1,350m¹
$250m¹
Cash
($500m)
Balancing cash
payment
$500m
NPV of earn out
($50m)
²
From JV earnings
$50m
²
Net contribution to JV
$800m
$800m |
 25
Key transaction terms
Structure
USG’s and Boral’s respective assets to be contributed into the joint
venture USG to make US$500m initial payment, then two potential earn outs:
US$25m after 3 years and US$50m after 5 years upon achieving earnings
targets Management
CEO will be Frederic de Rougemont, Boral Gypsum
CFO will be Paul Monzella, USG Corporation
Joe Holmes, Chief Technology Officer, and Bill Hogan, VP Product
Adjacencies, from USG Corporation will be executives
Finance and Technical Committees will provide oversight and assistance to
joint venture management
Governance
Chairman will be Jennifer Scanlon, USG Corporation (no casting vote)
Right to appoint chairman will rotate every two years
Board
will
consist
of
equal
nominee
directors
from
Boral
and
USG
for
as
long
as they hold 50:50 interests
Funding
Joint
venture
expected
to
be
self
funding
with
ability
to
borrow
in
its
own
right,
subject to JV
Board approval
Targeted dividend distribution of 50% of after-tax profit
|
 26
Intellectual Property
Joint venture granted exclusive royalty-fee rights in the Territory to current
Boral IP and USG IP, including improvements to current technology
Exclusive
option
during
the
term
to
licence
future
“breakthrough
IP”
developed
by USG and Boral
Exclusive
option
during
the
term
to
licence
“adjacent
IP”
generated
by
USG
Distribution rights
Exclusive distribution rights for USG products in the JV Territory during the
term Non-compete
Joint venture
parties
will
not
compete
with
the
joint
venture
in
the
defined
Territory
Party who exits the joint venture will not compete until the later of the third
anniversary of their exit, or 10 years from the commencement of the joint
venture
Transfer of interest / change
of control
7 year standstill on transfer of interest in joint venture
Pre-emptive rights including
right
of
first
offer,
last
right
to
buy
and
tag-along
right for non-selling party
Change of control, which applies to any entity in the chain of ownership,
including the parent companies, triggers a call option for the other party at fair
market value
Key transaction terms |
 27
Content
1.
Overview of the transaction / strategic rationale
2.
USG’s IP / Technology and adjacent products
3.
JV’s combined footprint and markets
4.
Synergies
5.
Key transaction terms
6.
Company specific factors
7.
Summary
Appendix |
 28
US$m
Projected JV earnings
$35 -
$45
Adjustment for USG’s contribution to the JV
($6 -
$8)
USG projected interest expense
($22 -
$25)
Total projected JV impact to USG’s net income
in CY2014
$7 -
$12
Calendar
year
2014
expected
impact
to
USG
earnings
¹
Accretive
–
US$7-$12m expected
contribution to USG bottom line in
CY2014
5
. Results are expected to
increase over time as technology is
propagated and capabilities are
optimised
NPV
positive
–
expected
future
returns exceed present value of cash
contributions as synergies are realised
Balance
Sheet
positive
–
expected EBITDA to offset additional
leverage, with higher cash contribution
and lower debt/EBITDA over time
USG expects to fund the joint venture
through US$350m in long-term debt
and US$150m of cash from its
balance sheet, with earn out payments
of up to US$75m
6
1.
Guidance will not be provided on a quarterly or annual basis
2.
JV
results
will
be
reflected
in
USG’s
Equity
Method
Income
on
its
Statement
of
Operations,
below
the
Operating
Profit
line
and may vary based on
finalization of fair valuation at the date of completion and foreign exchange
rates 3.
Represents full projected earnings contributions from USG’s contributed
entities in 2014 4.
Expected interest payment related to the long-term debt used to fund the joint
venture 5.
Expected contribution is based on 12 months of operations, results may vary based
on the actual commencement date of JV operations 6.
$75m
earn
out
payments
have
a
Net
Present
Value
of
$50m
based
on
the
three-
and
five-year
performance
targets
USG funding and earnings implications
4
5
3
2
|
 29
US$500m upfront cash:
-
Majority of proceeds to be applied to
reducing Boral’s debt
-
May also consider capital management
initiatives, subject to market conditions
JV self funding
Strengthening BORAL’s Balance Sheet
Impact to financial statements
30 June
2013
Gearing
(Net debt / net debt + equity)
30%
22%
Gearing
(covenant calculation )
40%
29%
As at 30 June 2013 –
Proforma Gearing
Reduction in proforma gearing reflects
group net debt reducing to ~ A$0.9bn
Transaction will be reflected in Boral’s accounts as an equity accounted
interest (50%) in joint ventures following
Proforma
1
-
De-consolidation of existing Australian and Asian subsidiaries
-
Recognition of single balance sheet asset, equity accounted investment in joint
ventures, at fair value Final accounting impact will be finalised following
transaction completion Value accretive for Boral shareholders
1.
Illustrative impact on balance sheet ratios if the transaction had occurred on 30 June 2013. Unaudited
figures for illustrative purposes only, assumes FX AUD/ USD of 0.9257 |
 30
Year ended 30 June 2013 –
Proforma Income Statement
Illustrative FY2013 Income Statement as if transaction had occurred
on 1 July 2012
FY2013 proforma assumptions:
-
Interest savings based on initial debt
repayment of A$250m
4
and A$250m
4
cash on deposit
-
Excludes: impact from USG
contributed operations
5
, benefits from
synergies, integration costs and any
gain/ loss on disposal at date of
transaction (after fair value
adjustments) –
will be treated as a
significant item
In FY2014, expect Boral’s NPAT
to reduce by around A$15m
Expect ~US$35-$45m as 50%
share of JV post-tax earnings in
first full year
1.
Excluding significant items
2.
Illustrative deconsolidation of Gypsum Australian and Asian entities
3.
Illustrative impact of equity accounted post-tax earnings and interest
savings (excludes earnings from USG entities and synergies) 4.
Initial proceeds of US$500m at July 2012 FX rate 1:1
5.
Net contribution from USG in FY2013 is negligible
6.
Assumes a negligible level of net debt within the JV
Figures may not add due to rounding.
BORAL –
impact on Income Statement
Group
Proforma
adj²
Proforma
adj³
Proforma
Group
Revenue
5,286
(919)
-
4,367
EBIT
¹
228
(83)
27
172
Net interest
(97)
4
20
(73)
Income tax
expense¹
(20)
16
(6)
(10)
Non-controlling
interest
(6)
8
-
2
Profit after tax¹
104
(55)
41
91 |
 31
Content
1.
Overview of the transaction / strategic rationale
2.
USG’s IP / Technology and adjacent products
3.
JV’s combined footprint and markets
4.
Synergies
5.
Key transaction terms
6.
Company specific factors
7.
Summary
Appendix |
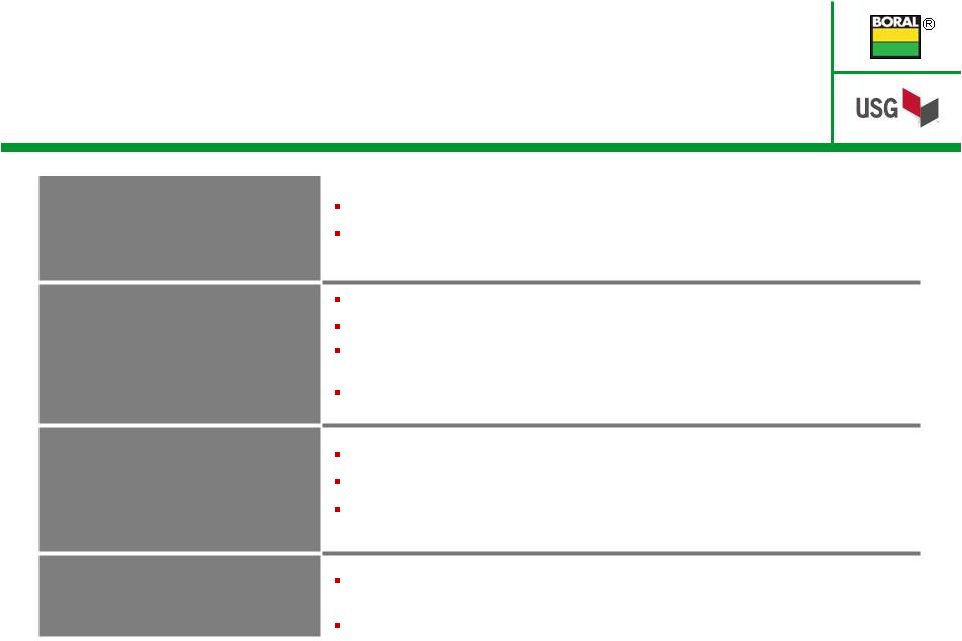
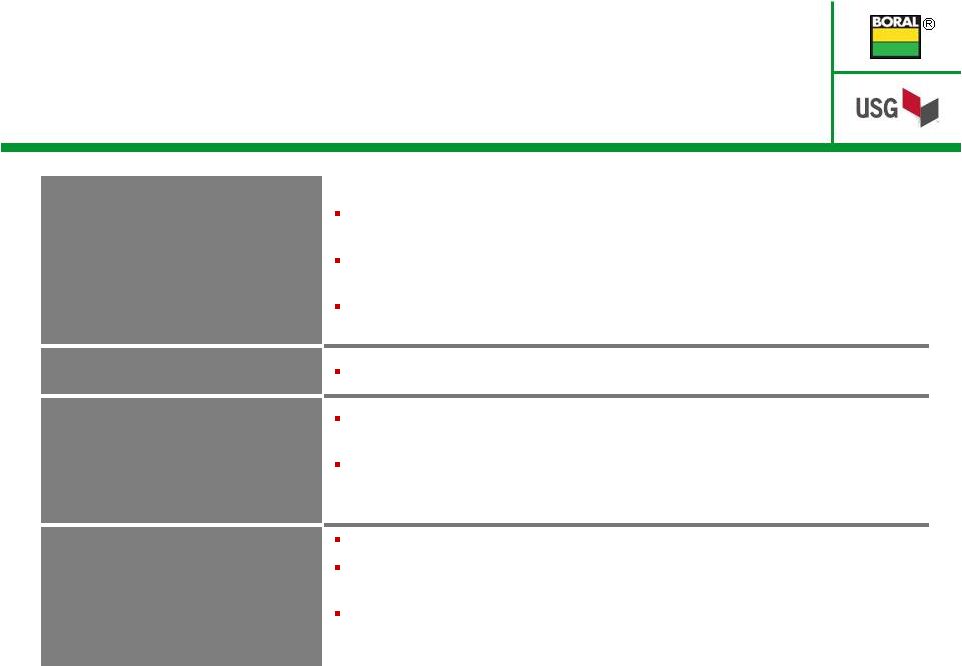
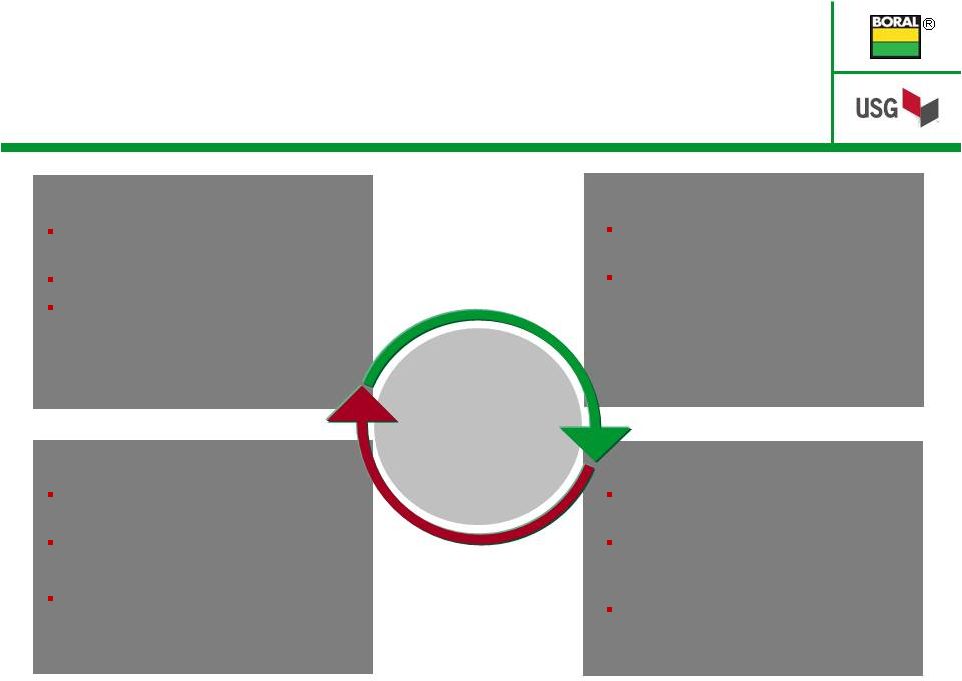 32
Combined
capability to
deliver significant
synergies
Strengthened
platform to drive
revenue and
margin growth
World class production capacity across
Asia, Australasia and the Middle East
Sales, marketing, and logistics
excellence and commercial leverage
World Class Capacity
World leading gypsum, ceilings, and joint
compound technologies
Market leader across Asia Pacific region
Experienced management and operating
team
Core Competitive Advantages
Strong Growth Potential
Strong underlying economic
growth forecast across key markets
Combined platform provides unrivalled
foundation for growth
Volume growth supported by >200m m²
currently unused capacity¹
Market Leading Positions
Strong brands respected for quality and
reliability
Extensive logistics and distribution
network in Asia, Australasia and the
Middle East
Deep customer relationships
1.
Based on 69% asset utilisation for year ended 30 June 2013 and includes capacity
expansion projects at Ho Chi Minh City (Vietnam) and Chongqing (China) and construction of
new plant in Oman to be completed in CY2014
Creating a world-leading plasterboard and ceiling
partnership in Asia, Australasia and the Middle East
BORAL asset
platform
+
USG technology
platform |
 QUESTIONS
Transaction completion targeted for January 2014
It’s your world. Build it.
Build Something Great
® |
 ®
APPENDIX
Build Something Great
It’s your world. Build it. |
 35
Sept 2013, USG ranked 9th in innovation
out of 112 companies in the Industrial
Materials Industry by the Patent Board
2000 –
2012
1,100+ US Patents
Sheetrock®
Brand
UltraLight Panels
Securock®
Glass-
Mat Roof Board
Durock®
Cement
Board Next-Gen
SHEETROCK®
Brand
UltraLightWeight
All Purpose Joint
Compound
Humitek®
Levelrock®
Next Generation Gypsum
Panels
Levelrock Floor
Underlayment System
USG™
Decorative Interior
Finish System
Geometrix™
Metal Ceiling
Panels
Astro™
ClimaPlus™
Ceiling
Panels
Translucents™
Luminous
Panels
Topo™
3-D Ceiling Panels
Humitek Gypsum Panels
Securock®
Roof Board
Sheetrock®
All Purpose Joint
Compound with Dust Control
Sheetrock®
Mold-Tough
panels
Zero-emitting ceiling tiles
High Recycled Content
Suspension Systems
True Wood Ceiling Panels
Securock®
Glass-Mat
Sheathing
Securock®
Glass-Mat Liner
Panels
Durock®
Fiberock®
Structocore Security
System
Durock Cement Board
Sheetrock Plus 3™
Joint
Compound
X-Technology Ceiling
Panels
Firecode®
Compound
3/4" Ultracode®
Core
Gypsum Panels
Compässo™
Suspension
Trim
Quick Release II Clip
Cuvatura™3-D System
Radar™
ClimaPlus™
Ceiling Panels
Fiberock Panels
USG Drywall Suspension
System
Ultrawall®
Structocore
Structocore™
Wall System
First Metal Stud Drywall
System
RC-1 Channel
Sheetrock WR Gypsum
Panels
Chemically Hardening Joint
Compound
SW Gypsum Panels
Blendtex Gypsum Panels
Exterior Ceiling Board
Ultrawall Relocatable Wall
System
USG Shaft Wall System
Textone SW Gypsum Panels
Area Separation Wall
System
Light Steel Framing
Pyrofill®
Firecode®
Structo-Gauge®
Gauging
Plaster
Pyrofill®
Poured Gypsum
Roof Deck
Water Repellent
Wallboard
Structo-Lite Perlited
Plaster
Sheetrock Firecode Core
(Type X)
Tapered Edge Panels
Ready-Mixed Joint
Compound
2" Solid Gypsum Wall
Board System
Acoustone®
Rocklath®
Gyplap®
Gypsum
Sheathing
Rocklath Gypsum Lath
Acoustone Ceiling Tiles
Perf-A-Tape®
Joint
Reinforcement
Sheetrock®
Sheetrock Gypsum
Panels
Pyrobar Gypsum
Partition Tile
Differentiate Through Innovation |