Attached files
| file | filename |
|---|---|
| 8-K - FORM 8-K - CrossAmerica Partners LP | d602230d8k.htm |
| EX-99.1 - EX-99.1 - CrossAmerica Partners LP | d602230dex991.htm |
| EX-14.1 - EX-14.1 - CrossAmerica Partners LP | d602230dex141.htm |
 Exhibit 99.2 |
 2
Forward Looking and Cautionary Statements
This presentation and oral statements made regarding the subjects of this
presentation may contain forward-looking statements, within the meaning
of the Private Securities Litigation Reform Act of 1995, or the Reform Act, which may include, but are not limited to,
statements regarding our plans, objectives, expectations and intentions and other
statements that are not historical facts, including statements identified by
words such as "outlook," "intends," "plans," "estimates," "believes," "expects," "potential," "continues," "may,"
"will," "should," "seeks," "approximately,"
"predicts," "anticipates," "foresees," or the negative version of these words or other comparable
expressions. All statements addressing operating performance, events, or
developments that the Partnership expects or anticipates will occur in the
future, including statements relating to revenue growth and earnings or earnings per unit growth, as well as statements
expressing optimism or pessimism about future operating results,
are forward-looking statements within the meaning of the Reform Act.
The forward-looking statements are based upon our current views and assumptions
regarding future events and operating performance and
are
inherently
subject
to
significant
business,
economic
and
competitive
uncertainties
and
contingencies
and
changes
in
circumstances, many of which are beyond our control. The statements in this
presentation are made as of the date of this presentation, even if
subsequently made available by us on our website or otherwise. We do not undertake any obligation to update or revise these
statements to reflect events or circumstances occurring after the date of this
presentation. Although the Partnership does not make forward-looking
statements unless it believes it has a reasonable basis for doing so, the
Partnership cannot guarantee their accuracy. Achieving the results described in
these statements involves a number of risks, uncertainties and other factors
that could cause actual results to differ materially, including the factors discussed in this presentation and
those described in the “Risk Factors”
section of the Partnership’s Form 10-K filed on March 28, 2013, with the
Securities and Exchange Commission
as
well
as
in
the
Partnership’s
other
filings
with
the
Securities
and
Exchange
Commission.
No
undue
reliance
should
be
placed on any forward-looking statements. |
 •
Lehigh
Gas
Partners
LP
(“LGP”
or
“Lehigh
Gas”)
is
a leading wholesale distributor of motor fuels and
owner and lessee of real estate related to retail
fuel distribution. Its Predecessor was founded in
1992
and leasing sites primarily located in
metropolitan and urban areas
•
Completed a $138 million Initial Public Offering on
October 30, 2012
•
Equity market capitalization of $372 million and
enterprise value of $628 million as of 6/30/13
•
As of 6/30/2013, distribute to 713 locations
primarily in the Northeastern United States, Florida
and Ohio
sites
and
through
eight
sub-wholesalers
•
Distributed 310.4 million gallons of motor fuel in
the period ending six months June 30, 2013
Lehigh Gas Overview
Top
10
Distributor
for
(3)
:
(1)
Includes
$18
million
exercise
of
over-allotment.
(2)
As
of
June
30,
2013.
(3)
Based
on
2012
volume.
Focused on distributing fuels to and owning
210
owned
sites
and
294
leased
sites
(2)
Also distribute to 209 independent dealer
(2)
3
(1) |
 4
Lehigh Gas Portfolio Overview
)
Dunmore Acquisition
Express Lane Acquisition
LGP Supplied
(1)
As of June 30 2013. Does not include the Rogers or Rocky Top portfolios.
|
 5
Lehigh Gas Operations
Industry Value Chain
Non-Qualifying Income
Qualified MLP Income
Wholesale Distribution
Rental Income (Realty)
•
Stable cash flow
•
Margin per gallon
•
Limited commodity exposure
•
Multi-year contracts
•
Stable cash flow
•
Prime locations
•
Multi-year contracts
Retail Distribution
Concessions
Rental Income (Personalty)
Pipeline / Storage
Wholesale Distributor
Gasoline Station |
 Investment Highlights
•
Stable Cash Flows from Rental Income
and Wholesale Fuel Distribution
•
Prime Real Estate Locations in Areas
with High Traffic
•
Long-Term Relationships with Major
Integrated Oil Companies and Refiners
•
Established History of Completing and
Integrating Acquisitions
•
Aligned Equity Ownership
•
Financial Flexibility to Pursue
Acquisitions and Expansion
Opportunities
BP Station
Union Centre Blvd., West Chester, OH
(Metro Cincinnati)
6 |
 7
•
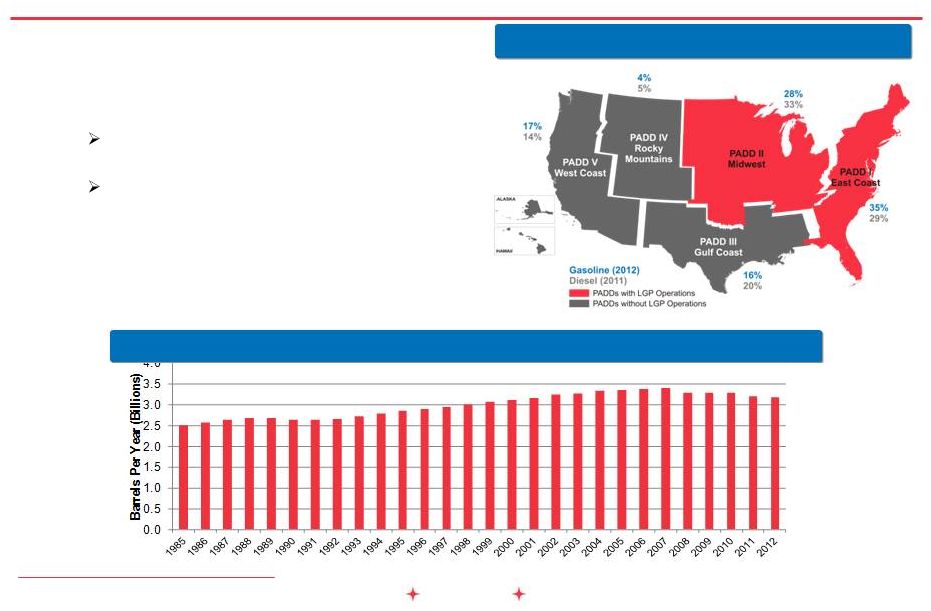
Gasoline consumption in the U.S. has proven to be stable,
with
growth
in
52
of
the
last
66
years
•
Since 1985 gasoline consumption has increased from
2.5
to 3.2
billion barrels per year in 2012 (CAGR of 1%)
Down years driven by historical external shocks or
other unusual economic factors
Except for the energy crisis of the late 1970s,
declines were less than 3% in any given year
•
Since 1985, diesel consumption has increased from 0.4 to
0.9 billion barrels in 2011 (CAGR 2.9%)
U.S. Motor Fuel Consumption
(1)
(1)
Source: Energy Information Administration (EIA).
(2)
Petroleum Administration for Defense Districts (PADD).
Historical Consumption of Gasoline in the U.S.
Motor Fuel Consumption by PADD
(2) |
 Wholesale Industry Overview
•
Lessee dealers
–
Wholesale distributor
owns or leases sites and leases or
subleases sites to the lessee dealer
•
Independent dealer
–
Sites are owned
by an independent dealer or leased by
an independent dealer from a third party
•
Sub-wholesalers
–
Wholesale
distributor sells to sub-wholesalers
•
Company
operated
stores
–
Wholesale distributor owns or leases
sites and conducts the retail operations
Classes of Trade
Wholesale Business
8
•
Wholesale motor fuel distribution
consists of sales of branded and
unbranded gasoline and diesel to retail
gas station operators and other
wholesale distributors
•
Wholesale
marketing
is
fragmented
and
local
•
Product
differentiation
is
achieved
through
branding
gasoline,
which
can
be
sold
at
a
premium
price
Exxon, Mobil, BP, Shell and Valero
are considered premium brands
•
SG&A costs are mostly fixed with a small
portion of variable costs
•
Wholesale
fuels
marketing
has
limited
commodity
exposure |
 •
Own or lease sites in prime
locations and seek to enhance
cash flow
•
Expand within and beyond core
geographic markets through
acquisitions
•
Serve as a preferred distributor
and dedicated supplier
•
Increase motor fuel distribution
business by expanding
market share
•
Maintain strong relationships
with major integrated oil
companies and refiners
•
Manage risk and mitigate
exposure
to environmental
liabilities
Lehigh Gas Strategy
9
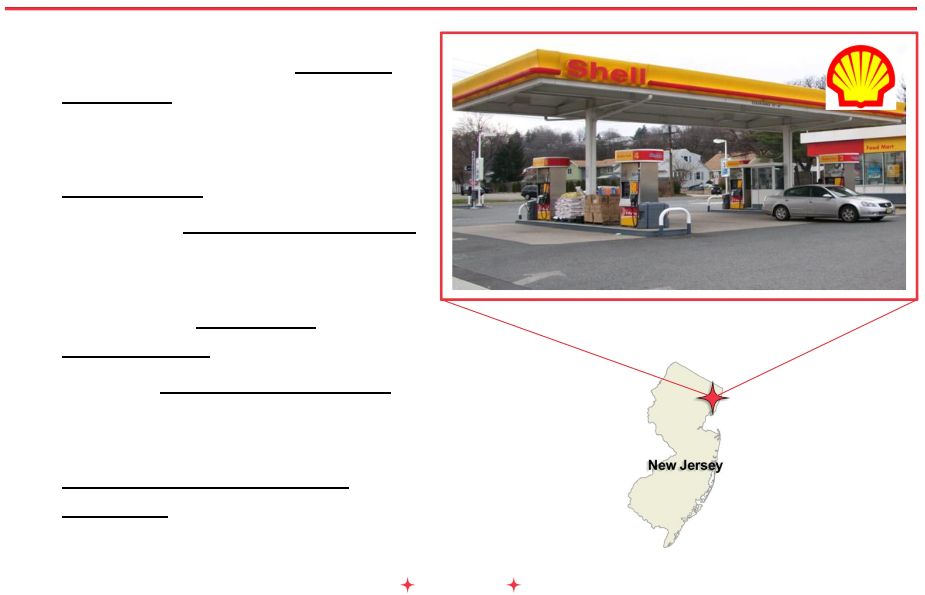
Shell Station
Route 17, Hasbrouck Heights, NJ |
 10
Lehigh Gas Operating Model
(1)
Lehigh
Gas
–
Ohio,
LLC
(“LGO”).
Independent
Transportation
Contractors
Payment Terms /
Discounts
Payment for Fuel
Motor Fuels
Master Limited Partnership
Lessee
Dealer
Independent
Dealer
LGO
(1)
(affiliate of LGP)
Sub-
Wholesaler
Suppliers
Wholesale
Distribution and
Rental Income
Distribution / Rental
Agreement
Motor Fuels |
 11
Stable Cash Flows: Wholesale Distribution
(1)
Wholesale Distribution Margin Per Gallon represents revenues from fuel sales minus
costs from fuel sales (including amounts to affiliates) divided by the gallons of motor fuel distributed.
(2)
YE (Year End) represents twelve months ended December 31 of the applicable year and
2012 PF (Pro Forma) represents 2012 pro forma as presented on Form 8-K filed with the SEC on March 28, 2013. 1H 2013 represents annualized
results for 1H 2013
(3)
Excludes gallons of motor fuel distributed to sites classified as discontinued
operations with respect to the periods presented for our predecessor. Stable
cash flows from long-term wholesale motor fuel distribution contracts
•
Our supply agreements with independent dealers generally have 10-year
terms •
Lessee dealers generally have 3-year terms
•
LGO generally has a 15-year term
LGP
Predecessor
LGP
Predecessor
Average
$0.0534
$0.0600
$0.0722
$0.0662
$0.0700
$0.0710
$-
$0.0100
$0.0200
$0.0300
$0.0400
$0.0500
$0.0600
$0.0700
$0.0800
YE
2009
YE
2010
YE
2011
YE
2011
PF
2012
1H
2013
Average Margin: $0.0655
438
519
532
562
591
621
0
150
300
450
600
750
YE
2009
YE
2010
YE
2011
YE
2011
PF 2012
1H 2013
(2)(3)
(1)(2)
Whole Distribution Margin Per Gallon
Gallons of Motor Fuel Distributed |
 Number
of
Sites
Owned
and
Leased
(2)
Rental
Income
Per
Site
(1)(2)
Stable cash flows from rental income associated with long-term leases
•
Lease
agreements
with
lessee
dealers
generally
have
3-year
terms
and
had
an
average
of
2.8
years
remaining as of June 30, 2013
•
LGO
agreements
have
15-year
terms
and
had
an
average
of
14.4
years
remaining
as
of
June
30
2013
Stable Cash Flows: Rental Income
(1)
Rental income is rental income from lessee dealers and from affiliates.
(2)
YE
(Year
End)
represents
twelve
months
ended
December
31
of
the
applicable
year
and
PF
2012
Pro
Forma)
represents
2012
pro
forma
as
presented
on
Form
8-K
filed
with
the
SEC
on
March
28,
2013.
1H
2013
represents
annualized
results
for
the
period
ending
June
30,
2013
for
the
purposes of
average
rent
per
site.
$65.1
$57.5
$55.8
$68.7
$49.4
$81.5
$-
$10.0
$20.0
$30.0
$40.0
$50.0
$60.0
$70.0
$80.0
$90.0
YE 2009
YE 2010
YE 2011
YE 2011
PF 2012
1H 2013
LGP
Predecessor
320
332
368
311
511
504
0
90
180
270
360
450
540
YE 2009
YE 2010
YE 2011
YE 2011
PF 2012
1H 2013
LGP
Predecessor
12 |
 13
Prime Real Estate Locations
•
We derive rental income from sites we own or lease that provide convenient fueling
locations primarily in areas that are densely populated
•
We
own
or
lease
sites
in
nine
states
(1)
•
Limited availability of undeveloped real estate in our current locations presents a high
barrier to entry for the development of competing sites
•
Due to prime locations, owned real estate sites have high alternate use values, which
provides additional risk mitigation
(1)
As of June 30, 2013.
(2)
Source EIA.
LGP Owned Sites by State
(1)
LGP Owned and Leased Sites by Area
(1)
Metropolitan /
Urban Areas
87%
Suburban / Rural
Areas
13%
Pennsylvania
35%
New Jersey
29%
Ohio
27%
Florida
4%
New York
2%
Massachusetts
2%
Kentucky
1%
Over
60%
of
US
gasoline
consumption
is
in
the
Midwest
and
Northeast
(2) |
 Long-Term Relationships
•
One of the ten largest independent distributors by
volume in the U.S. for Exxon, Mobil, and BP
branded fuels
Also distribute Shell, Valero, Sunoco,
Chevron and Gulf-branded motor fuels
•
Prompt payment history and good credit standing
with suppliers allow us to receive certain term
discounts on fuel purchases, which increases
wholesale profitability
•
Branded fuel is perceived by retail customers as
higher quality and commands a price premium
Brands Distributed
Supplier
% of
Total
Suppliers
Since:
ExxonMobil
42%
2002
BP
26%
2009
Shell
14%
2004
Valero
4%
2007
Chevron
5%
2012
Other Branded / Non-Branded
9%
n/a
Total
100%
14
ExxonMobil
42%
BP
26%
Shell
14%
Chevron
5%
Valero
4%
Other Branded /
Non-Branded
9%
LGP
Fuel
Distribution
by
Brand
(1)
(1)
For the Quarter ending June 30, 2013. Relationships shown began with our Predecessor.
|
 Established History of Acquisitions
•
We have grown primarily through acquisitions
Since 2004, LGP and our Predecessor, have grown the business from 9 owned sites to
210 owned sites, as of June 30, 2013
We have completed twelve acquisitions that included 10+ sites per
transaction •
Majority of our sites were purchased from major integrated oil companies
•
Established history of quickly financing and closing acquisitions
Wholesalers
sell
to
121,000
sites
across
the
US
(1)
~73%
of
convenience
store
operators
which
distributed
retail
fuel
own
50
or
fewer
sites
(1)
Major Acquisitions Since 1/1/2009
Recent Sellers
Convenience Store Operators with
Retail
Fuel
Distribution
Site
Count
(3)
(1)
Source: 2012 Association for Convenience & Fuel Retailing (NACS).
(2)
Motiva is a joint venture between Shell and Saudi Arabia Refining Company Inc.
(3)
Source: 2012 NACS Report.
(2)
201-500
Sites, 6.7%
51-200
Sites,
6.8%
11-50 Sites,
9.7%
1 Site, 58.2%
2-10 Sites,
5.1%
500+ Sites,
13.5%
15
Express Lane
2012
48
$45.4
Exxon/Chevron
FL
Dunmore Oil Company
2012
24
$29.0
Exxon/Valero
PA
Motiva Enterprises
(2)
2011
26
$30.4
Shell
30
NJ
BP Products North America
2009
85
$68.4
BP
2
OH & KY
Uni-Mart
2009
24
$12.1
BP
4
OH
States
Seller
Year
Sites
Acquired
Purchase
Price ($MM)
Brand
Wholesale
Supply
Agreements
•
Wholesale
marketing
is
fragmented
and
local,
providing
many
acquisition
opportunities |
 •
Announced two acquisitions during the third quarter of 2013
Rogers
Petroleum
(“Rogers”)
–
a
17
site
portfolio
in
Tri-Cities,
TN
Region
Rocky
Top
Markets,
LLC
(“Rocky
Top”)
–
a
34
site
portfolio
in
Knoxville,
TN
Region
•
Rogers portfolio purchase price of $21.1 million
Portfolio sold 18.7 million gallons of fuel in 2012
Primarily unbranded sites
•
Rocky Top portfolio purchase price of $36.9 million
Portfolio sold 34.1 million gallons of fuel in 2012
31 of 34 sites are Shell branded
•
Portfolios are geographically adjacent to each other
Provides economies of scale in region and a platform to expand
•
The Partnership will lease the sites to LGO and supply fuel to the sites for a
15-year initial period •
Since IPO, the Partnership has announced acquisitions of $132 million
Overview of Rogers and Rocky Top Acquisitions
16 |
 •
Liability on portfolio at IPO retained by predecessor entities
•
Rigorous diligence process to identify any issues prior to acquisition
•
Escrow funds at closing for identified liabilities
•
Purchase insurance to protect against cost overruns for known
liabilities and to protect against unknown conditions
•
Participate in state programs that provide funds to assist in
remediation
Risk Management Overview
Environmental
Commodity
Credit
Transportation
•
Purchase and deliver fuel on the same day
•
No overnight ownership of inventory
•
Daily collection and settlement procedures
•
Dealer credit card transactions routed through an LGP
subsidiary
•
Outsource delivery of fuel to independent third party haulers
•
Lowers capital and labor needs and reduces liability
exposure
17 |
 Topper Group / LGC Common vs.
Subordinated
Unit
Ownership
Topper Group / LGC vs. Public
Ownership
Aligned Equity Ownership
•
Topper
Group
and
LGC
(1)
retain
approximately
54.1%
ownership
in
LGP
92.3%
of
units
owned
by
Topper
Group
and
LGC
(1)
are
subordinated
•
Lehigh Gas GP (the general partner) has a non-economic general partner interest
in Lehigh •
45.9% of LGP held by public
18
Topper
Group /
LGC
54.1%
Public
45.9%
Common Unit
Ownership
7.7%
Subordinated
Unit
Ownership
92.3%
(1)
(1)
(1)
Lehigh Gas Corporation (LGC) is an entity in which Joe Topper holds a 100% ownership
interest. |
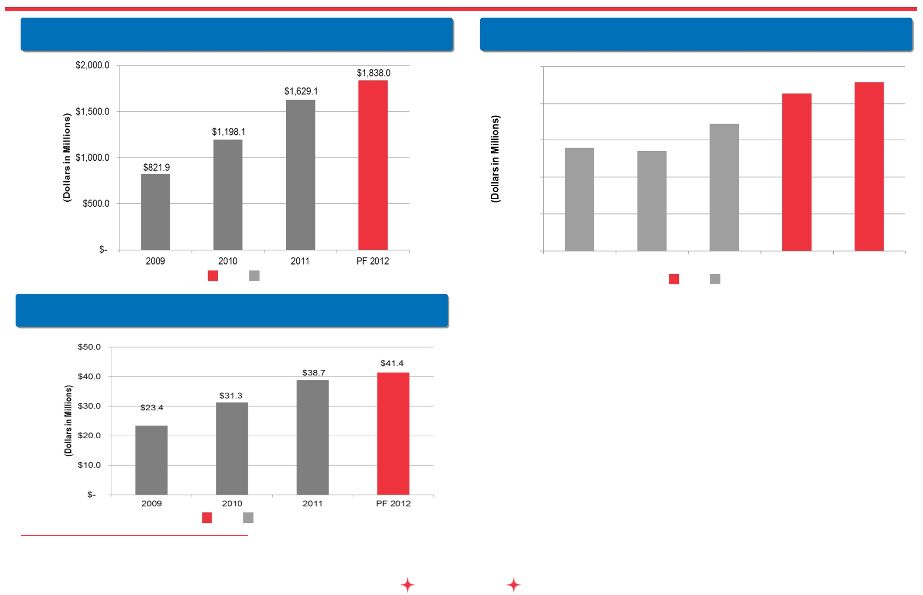 Historical Performance
Revenue
(1)
EBITDA
(1)(2)
Fuel
Gross
Profit
(1)
19
$-
$10.0
$20.0
$30.0
$40.0
$50.0
2009
2010
2011
2011 PF
PF 2012
$27.9
$26.9
$34.4
$42.7
$45.6
LGP
Predecessor
LGP
Predecessor
LGP
Predecessor
(1)
Based on the December 31, 2012 pro forma as presented on Form 8-K filed with the SEC on March 28,
2013. (2)
PF 2012 EBITDA excludes approximately $7.7 million in expenses in selling, general, and administrative
expenses related to our initial public offering and formation transactions and the two transactions closed at year end. See the 8-K filed with the
SEC on March 25, 2013 for additional detail. |
 Second Quarter Overview
•
Distributed 160.7 million gallons, a 4.4%
increase relative to 2012
•
Generated gross profit from fuel sales of $12
million, a 12.1% increase relative to 2012
•
Generated adjusted EBITDA of $14.9 million, a
34.1% increase relative to 2012
•
Distributable Cash Flow of $11.2 million or
$0.75 per common unit
•
Increased the distribution 5.5% to $1.91 / unit
on an annual basis
Since IPO, distribution has increased a
total of 9.1%
•
On May 13, increased credit facility by $75
million to $324 million
$126 million in pro forma availability
Amended certain financial covenants and
other terms to provide greater flexibility
for acquisitions
•
Committed to prudent acquisition strategy with
conservative financial management
Summary Second Quarter Metrics
(Dollars in thousands, except as noted)
Fuel Gross Profit
11,986
$
Gallons Distributed (millions)
160.7
Margin per Gallon ($)
0.075
$
Net Rental Income (revenue less expenses)
6,365
$
EBITDA
14,071
$
Non-Cash Equity Incentive Comp Expense
838
Adjusted EBITDA
14,897
$
Distributable Cash Flow (DCF)
11,224
$
DCF per Unit ($)
0.75
$
Distribution per Unit ($)
0.4775
$
Coverage (DCF / Distribution)
1.6x
Distribution Increase Over Previous Quarter
5.5%
20 |
 21
Investment Highlights
•
Stable Cash Flows from Rental Income
and Wholesale Fuel Distribution
•
Prime Real Estate Locations in Areas
with High Traffic
•
Long-Term Relationships with Major
Integrated Oil Companies and Refiners
•
Established History of Completing and
Integrating Acquisitions
•
Aligned Equity Ownership
•
Financial Flexibility to Pursue
Acquisitions and Expansion
Opportunities
BP Station
Main Street, Lebanon, OH |
