Attached files
| file | filename |
|---|---|
| 8-K - 8-K - AAR CORP | a13-20867_18k.htm |
Exhibit 99.1
|
|
AAR CORP. Investor Presentation Credit Suisse 4th Annual Small & Mid Cap Conference September 17-18, 2013 |

|
|
2 Forward-Looking Statements This presentation includes certain statements relating to future results, which are forward-looking statements as that term is defined in the Private Securities Litigation Reform Act of 1995. These forward-looking statements are based on beliefs of Company management, as well as assumptions and estimates based on information currently available to the Company, and are subject to certain risks and uncertainties that could cause actual results to differ materially from historical results or those anticipated, including those factors discussed under Item 1A, entitled “Risk Factors,” included in the Company’s Form 10-K for the fiscal year ended May 31, 2013. Should one or more of these risks or uncertainties materialize adversely, or should underlying assumptions or estimates prove incorrect, actual results may vary materially from those described. These events and uncertainties are difficult or impossible to predict accurately and many are beyond the Company’s control. The Company assumes no obligation to update any forward-looking statements to reflect events or circumstances after the date of such statements or to reflect the occurrence of anticipated or unanticipated events. For additional information, see the comments included in AAR’s filings with the Securities and Exchange Commission. |

|
|
3 Key Investment Highlights . Balanced portfolio of businesses – Leading provider of Aftermarket Solutions for the global aviation industry . Maintenance, Repair and Overhaul (MRO) . Aviation Supply Chain . Airlift Services – Recognized market leader in cargo systems and specialized mobility products design and manufacturing . Light weight, durable commercial cargo systems . Cargo systems, containers and shelters for defense applications . Steady organic growth supplemented by accretive strategic acquisitions . Strong financial position underpinned by record free cash flow – Free cash flow over 2.0x Net Income for 2013 |

|
|
4 Financial 2013 Performance Highlights – Delivering Strong Results Operating . Record sales of $2.14B, up 4% over prior year . Generated $125M of free cash flow . Reduced net debt position by $91M . Returned $27M to shareholders – Repurchased nearly 1 million shares at an average price of $14.90 – Paid out ~$13M in dividends . Growth in Commercial aviation – MRO gaining market share - new Duluth facility opened with anchor customer – Supply Chain in new accounts and geographies – new account wins e.g., Air Canada, Flybe, ExpressJet – Cargo Systems - Loading systems on 747-8 and A350 . Strong position in Defense/Govt. – Colombian Air Force contract – U.S. Marshals Service contract |

|
|
Company Overview & Strategy |

|
|
6 . Diversified $2.1B+ revenue stream . 60 years as a market leader in aviation support . Over 6,000 employees at more than 60 locations worldwide . Customer-centric business model Leading provider of Aviation Services and specialized Technology Products to commercial and defense/govt. markets Established Niche Player Serving Global Aviation & Aerospace |

|
|
7 . Number one independent provider of aircraft maintenance, repair and overhaul (MRO) and modifications in North America . Oklahoma City . Indianapolis . Miami . Ranked among the top providers of aircraft parts and supply chain services in the world . Supply chain management and logistics programs The right parts to the right place at the right time . Component repair and repair chain optimization services . Distribution of OEM components . Leading provider of Airlift Services Aviation Services A Leader in Aviation Services . Hot Springs . Duluth . Lake Charles |

|
|
8 Expanding MRO Platform into Wide-Body Market . 520,000 sf. of MRO service and administrative space . Can accommodate up to seven widebody or ten narrow-body aircraft . On-going facility expansion for an additional 118,000 sf. of space North America, 32% Europe, 28% Asia , 25% Middle East, 6% South America, 5% Africa, 4% 2013 = $9.2B Lake Charles – 6th MRO Facility Wide-Body MRO Market* * Source: ICF SH&E 5.0% 4.8% 0.8% Wide-body Narrow-body Regional 2013 – 2018 Demand CAGR (~$3.0B) |

|
|
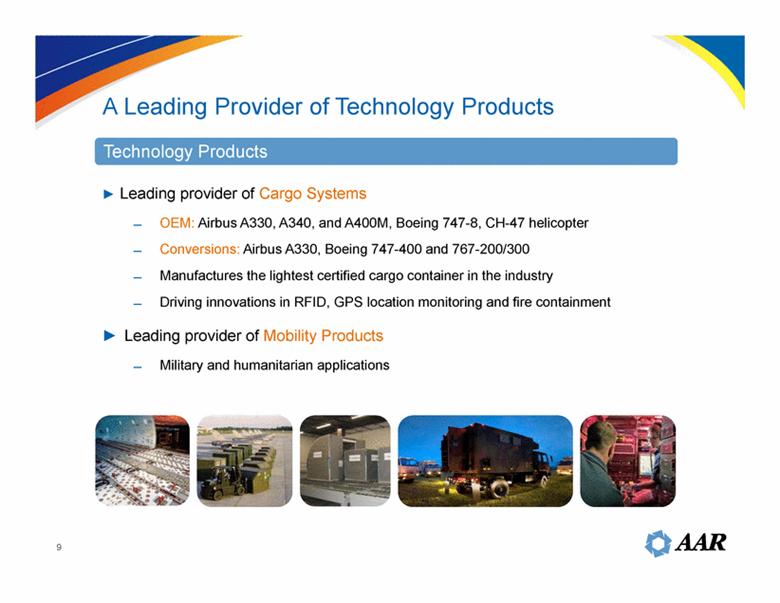
9 Technology Products A Leading Provider of Technology Products . Leading provider of Cargo Systems . OEM: Airbus A330, A340, and A400M, Boeing 747-8, CH-47 helicopter . Conversions: Airbus A330, Boeing 747-400 and 767-200/300 . Manufactures the lightest certified cargo container in the industry . Driving innovations in RFID, GPS location monitoring and fire containment . Leading provider of Mobility Products . Military and humanitarian applications |
|
|
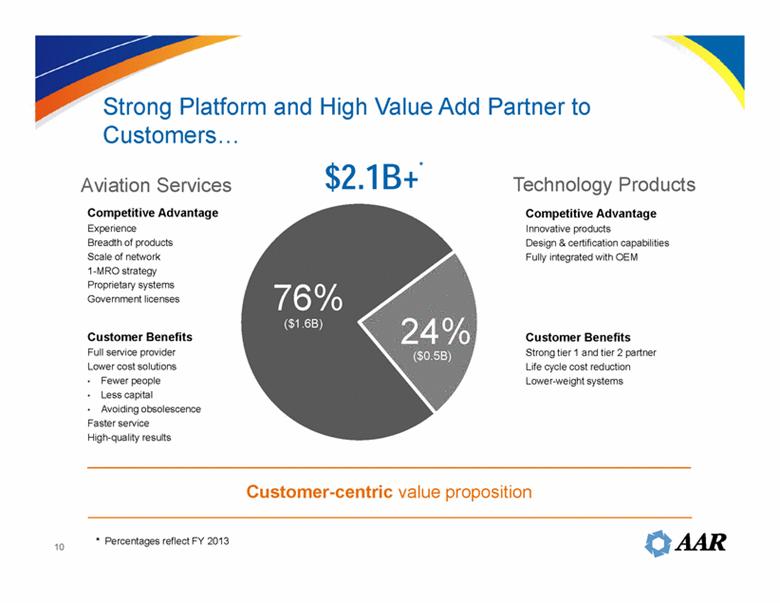
10 Aviation Services Technology Products Competitive Advantage Innovative products Design & certification capabilities Fully integrated with OEM Customer Benefits Full service provider Lower cost solutions • Fewer people • Less capital • Avoiding obsolescence Faster service High-quality results Competitive Advantage Experience Breadth of products Scale of network 1-MRO strategy Proprietary systems Government licenses $2.1B+* Customer-centric value proposition Strong Platform and High Value Add Partner to Customers Customer Benefits Strong tier 1 and tier 2 partner Life cycle cost reduction Lower-weight systems 76% 24% * Percentages reflect FY 2013 ($1.6B) ($0.5B) |
|
|
11 Commercial 47% ($1.0B) Defense 29% ($0.6B) Commercial 14% ($0.3B) Defense 10% ($0.2B) Machining Cargo MRO Supply Chain Strong portfolio of aerospace and defense businesses provides balance, strength and consistency through industry cycles Mobility Airlift Percentages reflect FY 2013 With a Well Balanced and Diversified Portfolio Aviation Services 76% ($1.6B) Technology Products 24% ($0.5B) |

|
|
12 $0.0 $0.2 $0.4 $0.6 $0.8 $1.0 $1.2 $1.4 $1.6 $1.8 $2.0 1970 1972 1974 1976 1978 1980 1982 1984 1986 1988 1990 1992 1994 1996 1998 2000 2002 2004 2006 2008 2010 Arab Oil Embargo Fuel Crisis Conflicts in Iran Economic Downturn Gulf War September 11 Attacks “Great Recession” Sales ($B)* After each down cycle, AAR has emerged a stronger and more diverse company 2012 Navigated Through 5 Major Industry Cycles 2013 2014E *As reported FY Sales |

|
|
13 Well Positioned with leading international and domestic airlines Strong Value Proposition outsourcing = savings . Outsourcing trend set to continue (e.g., Air Canada) .Worldwide third party MRO CAGR of 3.3% through 2022** . Increasing demand for integrated support services . Airlines looking to reduce cost = increased outsourcing . Airlines investing in customer experience = engineering opportunities . Airlines investing in fleet = strong commercial OE build cycle Increasing importance of commercial markets Commercial +14%* * Reflects FY 2013 ** Source: Team SAI and Ascend AAR in Commercial |

|
|
14 Defense customers utilize AAR for cost savings Strong Value Proposition “Commercial Off-The- Shelf Solutions” (COTS) Long-Term Requirements for Airlift Services Defense flat . Proven track record . Cost reductions and efficiency gains a central strategy in future budgets . Leadership position in niche markets AAR in Defense -10%* . All current options exercised . Adjacent market opportunities – DoD – DoS – Foreign Governments – Commercial operations in austere environments * Reflects FY 2013 |

|
|
15 Strong Customer Relationships NATO U.S. DoD U.K. MoD Colombian Air Force Airlines OEMs Cargo Government U.S. Marshals Service |

|
|
16 Growth Initiatives . Cross-sell services and leverage platform – Created Aviation Services Group . Air Canada Supply Chain/MRO/Landing Gear . UK Flybe Supply Chain/MRO . ExpressJet MRO/Landing Gear . Colombian Air Force . U.S. Marshals Service . Liebherr-Aerospace/MRO/Landing Gear . Expand capabilities – Airinmar repair management solutions – Increase design and engineering content . Pursue geographic expansion – Telair, Nordisk and Airinmar acquisitions accelerated global presence – Opened parts warehouse in Singapore |

|
|
Financial Performance |

|
|
18 $0.00 $0.75 $1.50 $2.25 $3.00 $3.75 $0.0 $0.5 $1.0 $1.5 $2.0 $2.5 2008 2009 2010 2011 2012 2013 2014 Guidance Revenue ($B) EBITDA* $1.4B $1.4B $1.4B $1.8B $2.1B Diverse capabilities + unique value propositions = steady growth Defense Commercial AAR Today: A Diversified $2B+ Business * EBITDA is defined in the Appendix $2.14B $181M $203M $140M $180M $228M $243M $2.18 – 2.23B $2.00 – $2.05 EPS $246M EPS |

|
|
19 . Generated $366M in operating cash flow during the last three fiscal years (FY2011 – FY2013) . Cash reinvested in the business – Acquisitions – Airlift growth . FY2013 Cash flow from Operations of $163 million* – Reduction in net debt: $91M – Capital expenditures: $38M – Acquisitions: $21M – Share repurchases: $15M – Dividend payments: $13M Intense focus on operating cash flows Generating Strong Cash Flow From Operations * Excludes proceeds from sale of equipment and aircraft joint ventures |

|
|
20 • Revenue CAGR of ~9% over the last five years Sustained Growth • #1 MRO in North America; # 3 worldwide* • Voted Parts Supplier of the Year** Leading Position in Niche Commercial Markets • Superior cash generating profile with free cash flow >2.0x Net Income Strong Cash Flow AAR Delivers * Source: Aviation Week magazine, 2013 ** Source: Airline Economics magazine, 2012 |

|
|
Appendix |

|
|
22 ($ in millions) FY2008 FY2009 FY2010 FY2011 FY2012 FY2013 Net income attributable to AAR $68.2 $56.8 $44.6 $69.8 $67.7 $55.0 Provision for income taxes 36.6 27.5 21.0 33.6 25.5 26.8 Interest expense, net 27.7 30.0 25.8 30.3 36.5 40.1 Loss (gain) on debt extinguishment 2.0 (14.7) (0.9) (0.1) 0.7 0.3 Loss (gain) on sale of investments (0.5) 1.4 1.2 - - - Loss from Discontinued Operations net of Tax 0.6 1.9 - - - - Depreciation & Amortization 39.6 40.1 38.9 57.8 72.0 79.7 Amortization of Stock-Based Compensation 6.4 6.2 9.3 12.3 12.5 11.1 Gain on sale of product line - - - (5.9) - - Impairment & Non-recurring Charges - 31.1 - 5.3 13.2 29.8 Adjusted EBITDA $180.6 $180.3 $139.9 $203.1 $228.1 $242.8 Non-GAAP Disclosure Reconciliation Pursuant to SEC Regulation G, the Company has included the following reconciliation of operating income reported on the basis of Generally Accepted Accounting Principles (“GAAP”) to Adjusted EBITDA on a non-GAAP basis. The Company believes the non-GAAP Adjusted EBITDA and ratios using Adjusted EBITDA are used by banks, debt holders and investors as important measures of the Company’s performance and ability to service debt obligations. |
