Attached files
| file | filename |
|---|---|
| 8-K - 8-K - SCHULMAN A INC | shlm130813pressrelease.htm |

A. Schulman Investor Presentation AUGUST 2013
Cautionary Note on Forward-Looking Statements A number of the matters discussed in this document that are not historical or current facts deal with potential future circumstances and developments and may constitute “forward-looking statements” within the meaning of the Private Securities Litigation Reform Act of 1995. Forward-looking statements can be identified by the fact that they do not relate strictly to historic or current facts and relate to future events and expectations. Forward-looking statements contain such words as “anticipate,” “estimate,” “expect,” “project,” “intend,” “plan,” “believe,” and other words and terms of similar meaning in connection with any discussion of future operating or financial performance. Forward-looking statements are based on management’s current expectations and include known and unknown risks, uncertainties and other factors, many of which management is unable to predict or control, that may cause actual results, performance or achievements to differ materially from those expressed or implied in the forward-looking statements. Important factors that could cause actual results to differ materially from those suggested by these forward-looking statements, and that could adversely affect the Company’s future financial performance, include, but are not limited to, the following: • worldwide and regional economic, business and political conditions, including continuing economic uncertainties in some or al l of the Company’s major product markets or countries where the Company has operations; • the effectiveness of the Company’s efforts to improve operating margins through sales growth, price increases, productivity gains, and improved purchasing techniques; • competitive factors, including intense price competition; • fluctuations in the value of currencies in major areas where the Company operates; • volatility of prices and availability of the supply of energy and raw materials that are critical to the manufacture of the Company’s products, particularly plastic resins derived from oil and natural gas; • changes in customer demand and requirements; • effectiveness of the Company to achieve the level of cost savings, productivity improvements, growth and other benefits anticipated from acquisitions, joint ventures and restructuring initiatives including any proposed combination with Ferro Corporation; • escalation in the cost of providing employee health care; • uncertainties regarding the resolution of pending and future litigation and other claims; • the performance of the global automotive market; and • further adverse changes in economic or industry conditions, including global supply and demand conditions and prices for products. The risks and uncertainties identified above are not the only risks the Company faces. Additional risk factors that could affect the Company’s performance are set forth in the Company’s Annual Report on Form 10-K for the fiscal year ended August 31, 2012. In addition, risks and uncertainties not presently known to the Company or that it believes to be immaterial also may adversely affect the Company. Should any known or unknown risks or uncertainties develop into actual events, or underlying assumptions prove inaccurate, these developments could have material adverse effects on the Company’s business, financial condition and results of operations. 2
• This presentation includes certain financial information determined by methods other than in accordance with accounting principles generally accepted in the United States ("GAAP"). These non-GAAP financial measures include: net income per diluted share excluding certain items and EBITDA. However, non-GAAP measures are not in accordance with, nor are they a substitute for, GAAP measures, and tables included in the appendix reconcile each non-GAAP financial measure with the most directly comparable GAAP financial measure. The most directly comparable GAAP financial measures for these purposes are net income per diluted share and net income from continuing operations. The Company's non-GAAP financial measures are not meant to be considered in isolation or as a substitute for comparable GAAP financial measures, and should be read only in conjunction with the Company's consolidated financial statements prepared in accordance with GAAP. • The Company uses these non-GAAP financial measures to make decisions, assess performance and allocate resources, and the Company believes that these non-GAAP financial measures are useful to investors for financial analysis. • While the Company believes that these non-GAAP financial measures provide useful supplemental information to investors, there are very significant limitations associated with their use. These non-GAAP financial measures are not prepared in accordance with GAAP, may not be reported by all of the Company's competitors and may not be directly comparable to similarly titled measures of the Company's competitors due to potential differences in the exact method of calculation. The Company compensates for these limitations by using these non-GAAP financial measures as supplements to GAAP financial measures and by reviewing the reconciliations of the non-GAAP financial measures to their most comparable GAAP financial measures. 3 Use of Non-GAAP Financial Measures
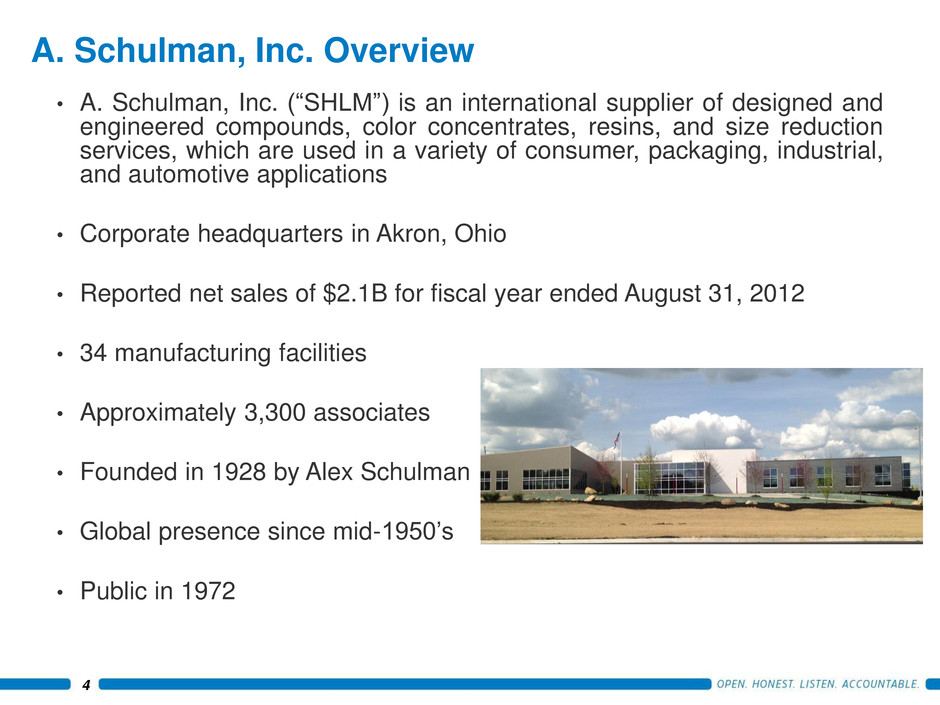
• A. Schulman, Inc. (“SHLM”) is an international supplier of designed and engineered compounds, color concentrates, resins, and size reduction services, which are used in a variety of consumer, packaging, industrial, and automotive applications • Corporate headquarters in Akron, Ohio • Reported net sales of $2.1B for fiscal year ended August 31, 2012 • 34 manufacturing facilities • Approximately 3,300 associates • Founded in 1928 by Alex Schulman • Global presence since mid-1950’s • Public in 1972 4 A. Schulman, Inc. Overview
• Specialty chemical and attribute provider of masterbatch solutions, niche engineered plastics, custom color technologies, specialty powders and size reduction • Global footprint to maximize growth opportunities • Growth Playbook which focuses on adjacent markets, new products & technologies and cross selling • Proven track record of acquisitions to drive growth and restructuring programs to optimize cost structure • Unbroken track record of dividends since going public in 1972 • Experienced management team SHLM Investment Highlights 5
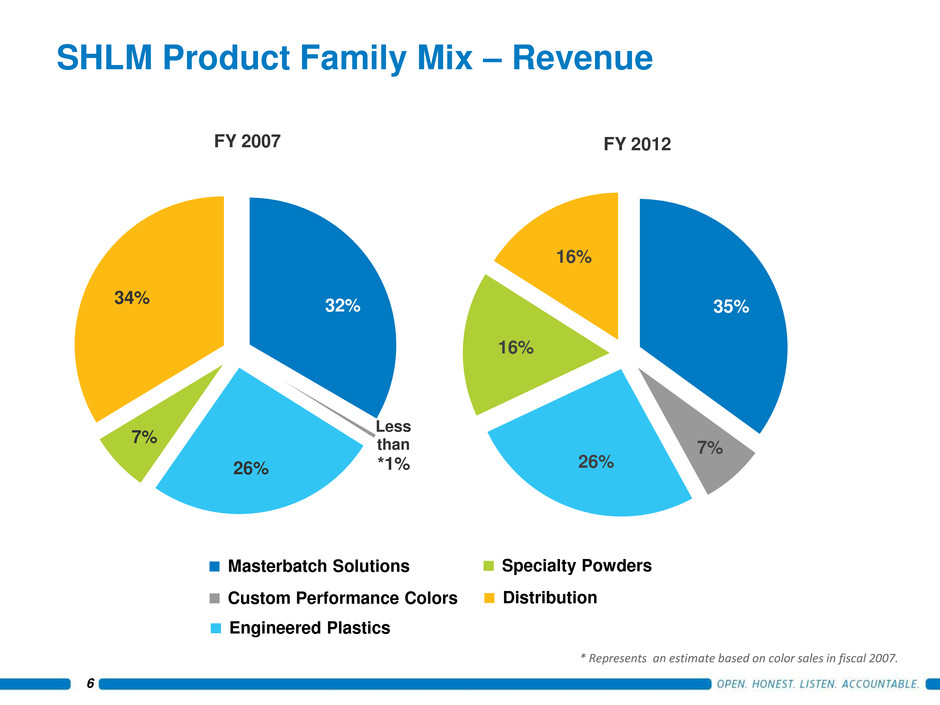
35% 7% 26% 16% 16% FY 2012 SHLM Product Family Mix – Revenue Masterbatch Solutions Engineered Plastics Specialty Powders Distribution 32% Less than *1% 26% 7% 34% FY 2007 6 Custom Performance Colors * Represents an estimate based on color sales in fiscal 2007.
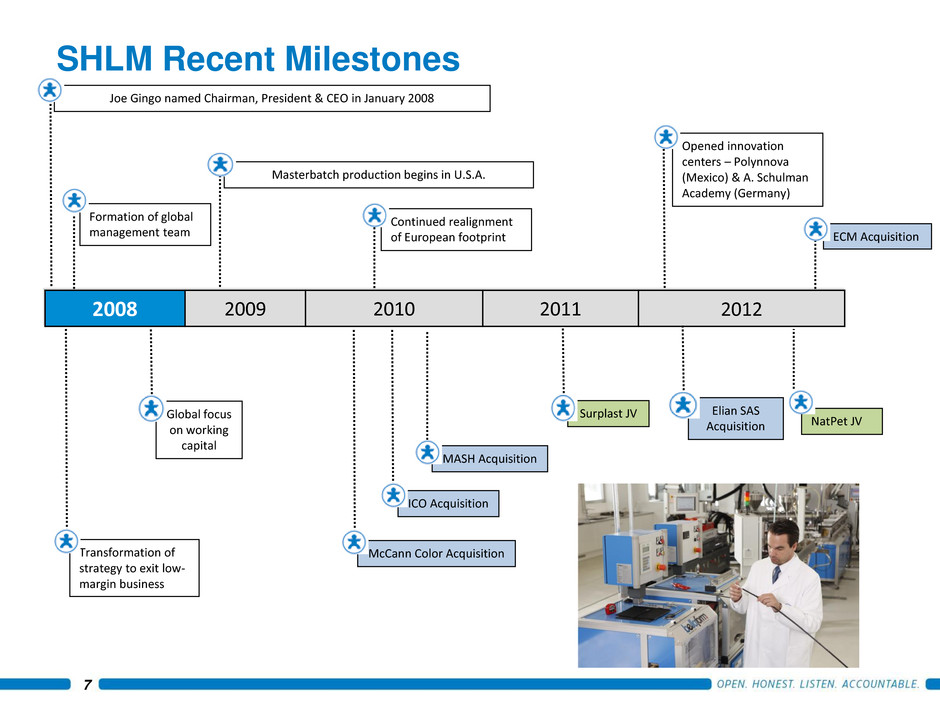
SHLM Recent Milestones Joe Gingo named Chairman, President & CEO in January 2008 Masterbatch production begins in U.S.A. McCann Color Acquisition ICO Acquisition MASH Acquisition Surplast JV 2008 2009 2010 2011 2012 Formation of global management team NatPet JV Continued realignment of European footprint Elian SAS Acquisition Global focus on working capital Transformation of strategy to exit low- margin business Opened innovation centers – Polynnova (Mexico) & A. Schulman Academy (Germany) ECM Acquisition 7
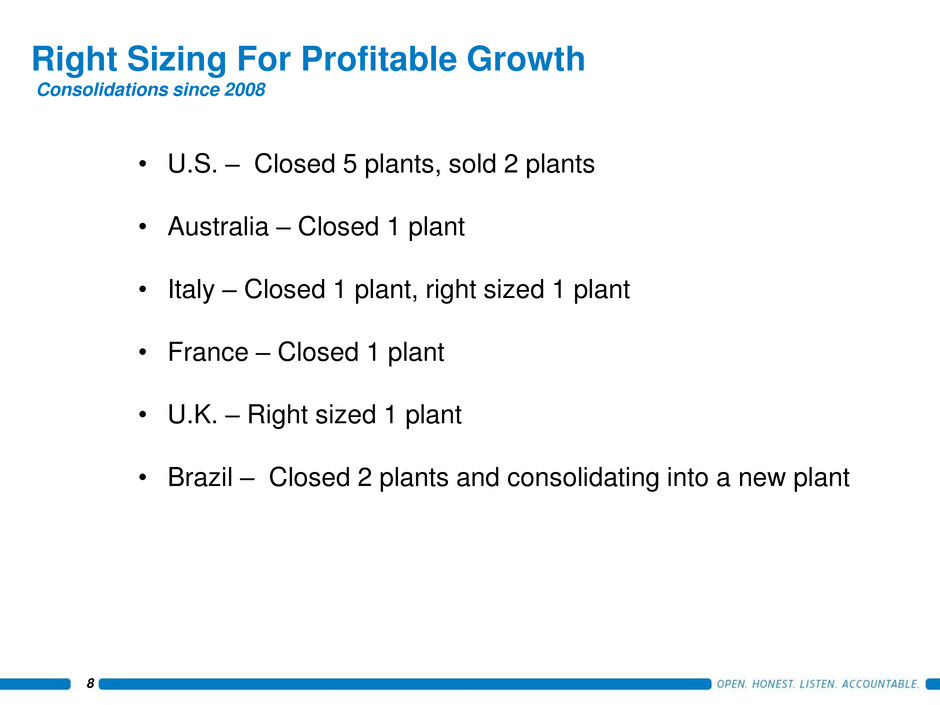
Right Sizing For Profitable Growth Consolidations since 2008 • U.S. – Closed 5 plants, sold 2 plants • Australia – Closed 1 plant • Italy – Closed 1 plant, right sized 1 plant • France – Closed 1 plant • U.K. – Right sized 1 plant • Brazil – Closed 2 plants and consolidating into a new plant 8
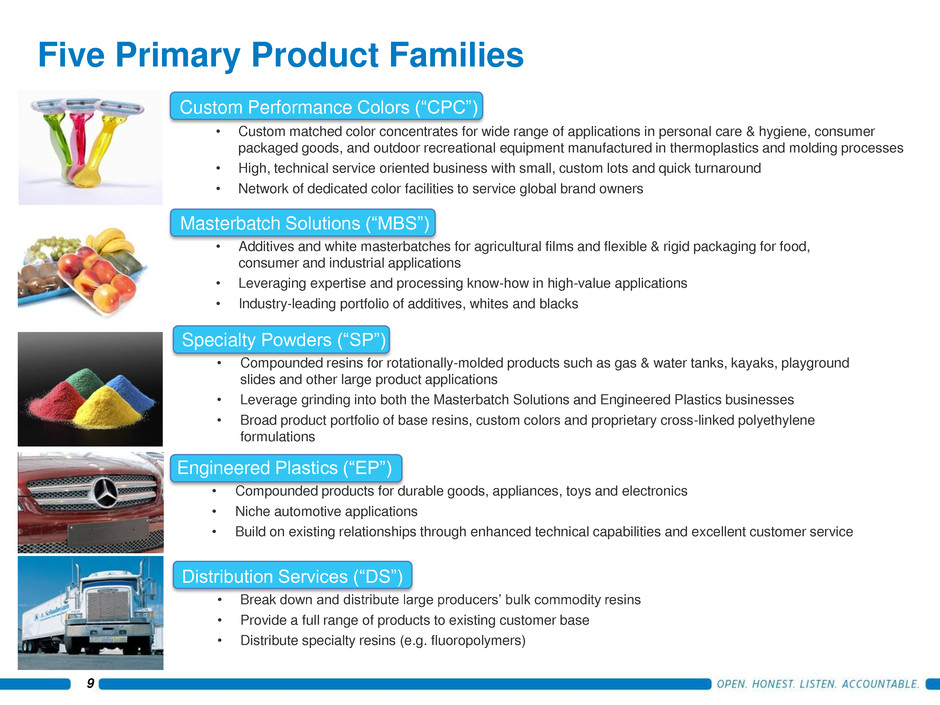
Five Primary Product Families Engineered Plastics (“EP”) • Compounded products for durable goods, appliances, toys and electronics • Niche automotive applications • Build on existing relationships through enhanced technical capabilities and excellent customer service Distribution Services (“DS”) • Break down and distribute large producers’ bulk commodity resins • Provide a full range of products to existing customer base • Distribute specialty resins (e.g. fluoropolymers) Specialty Powders (“SP”) • Compounded resins for rotationally-molded products such as gas & water tanks, kayaks, playground slides and other large product applications • Leverage grinding into both the Masterbatch Solutions and Engineered Plastics businesses • Broad product portfolio of base resins, custom colors and proprietary cross-linked polyethylene formulations Custom Performance Colors (“CPC”) • Custom matched color concentrates for wide range of applications in personal care & hygiene, consumer packaged goods, and outdoor recreational equipment manufactured in thermoplastics and molding processes • High, technical service oriented business with small, custom lots and quick turnaround • Network of dedicated color facilities to service global brand owners Masterbatch Solutions (“MBS”) • Additives and white masterbatches for agricultural films and flexible & rigid packaging for food, consumer and industrial applications • Leveraging expertise and processing know-how in high-value applications • Industry-leading portfolio of additives, whites and blacks 9
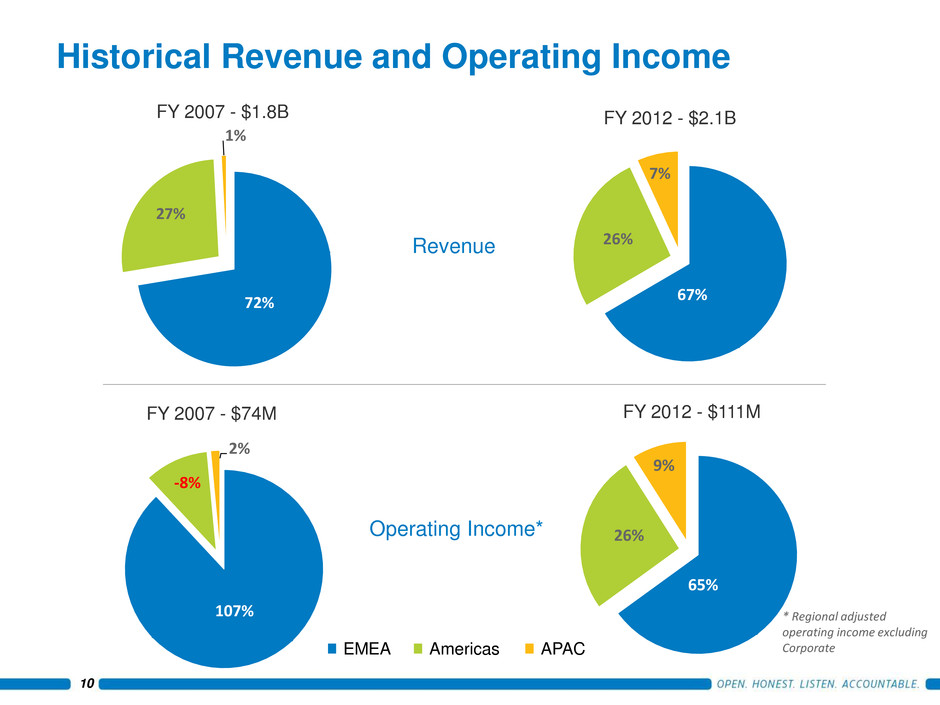
67% 26% 7% Historical Revenue and Operating Income 72% 27% 1% 107% -8% 2% 65% 26% 9% Revenue Operating Income* FY 2007 - $74M FY 2007 - $1.8B FY 2012 - $2.1B FY 2012 - $111M 10 EMEA Americas APAC * Regional adjusted operating income excluding Corporate
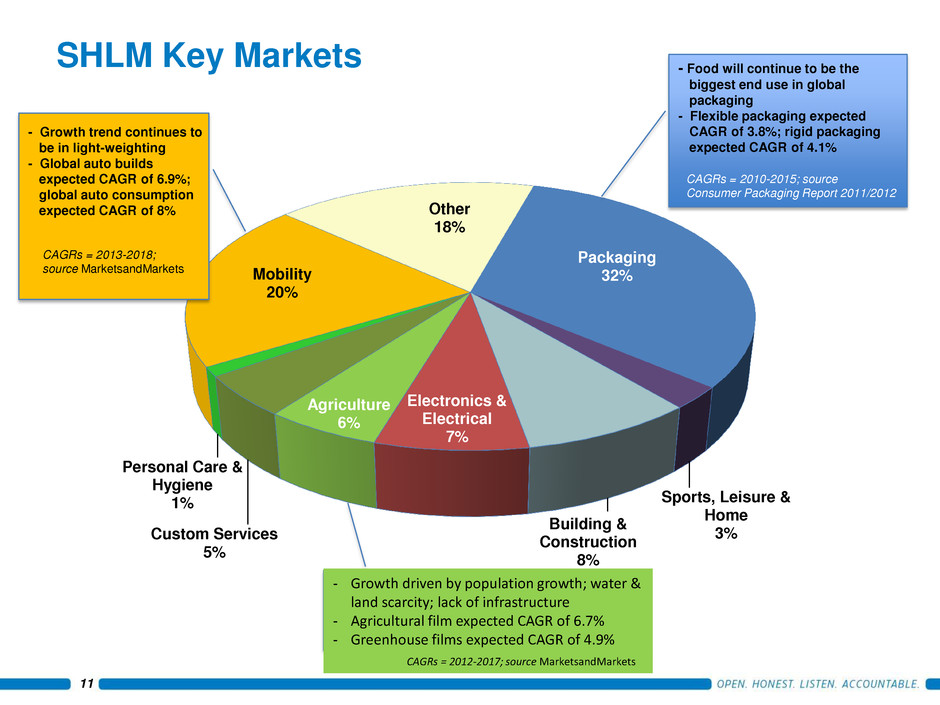
11 SHLM Key Markets Building & Construction 8% Electronics & Electrical 7% Agriculture 6% Custom Services 5% Personal Care & Hygiene 1% Mobility 20% Other 18% Packaging 32% Sports, Leisure & Home 3% - Food will continue to be the biggest end use in global packaging - Flexible packaging expected CAGR of 3.8%; rigid packaging expected CAGR of 4.1% CAGRs = 2010-2015; source Consumer Packaging Report 2011/2012 - Growth trend continues to be in light-weighting - Global auto builds expected CAGR of 6.9%; global auto consumption expected CAGR of 8% - Growth driven by population growth; water & land scarcity; lack of infrastructure - Agricultural film expected CAGR of 6.7% - Greenhouse films expected CAGR of 4.9% CAGRs = 2012-2017; source MarketsandMarkets CAGRs = 2013-2018; source MarketsandMarkets
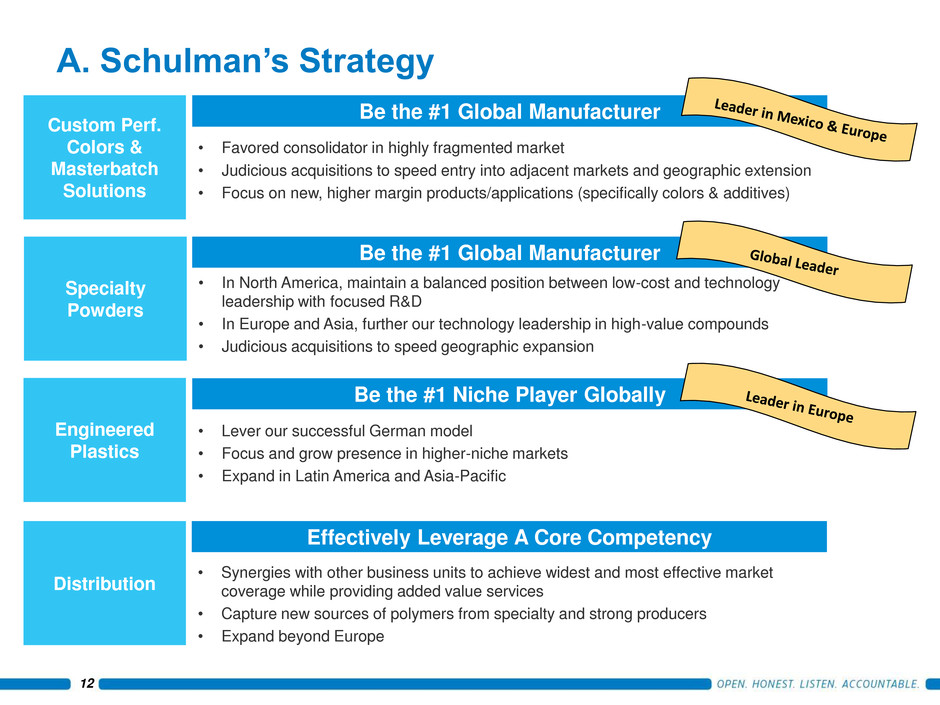
Be the #1 Niche Player Globally Engineered Plastics • Lever our successful German model • Focus and grow presence in higher-niche markets • Expand in Latin America and Asia-Pacific Be the #1 Global Manufacturer Custom Perf. Colors & Masterbatch Solutions • Favored consolidator in highly fragmented market • Judicious acquisitions to speed entry into adjacent markets and geographic extension • Focus on new, higher margin products/applications (specifically colors & additives) Be the #1 Global Manufacturer Specialty Powders • In North America, maintain a balanced position between low-cost and technology leadership with focused R&D • In Europe and Asia, further our technology leadership in high-value compounds • Judicious acquisitions to speed geographic expansion Effectively Leverage A Core Competency Distribution • Synergies with other business units to achieve widest and most effective market coverage while providing added value services • Capture new sources of polymers from specialty and strong producers • Expand beyond Europe 12 A. Schulman’s Strategy
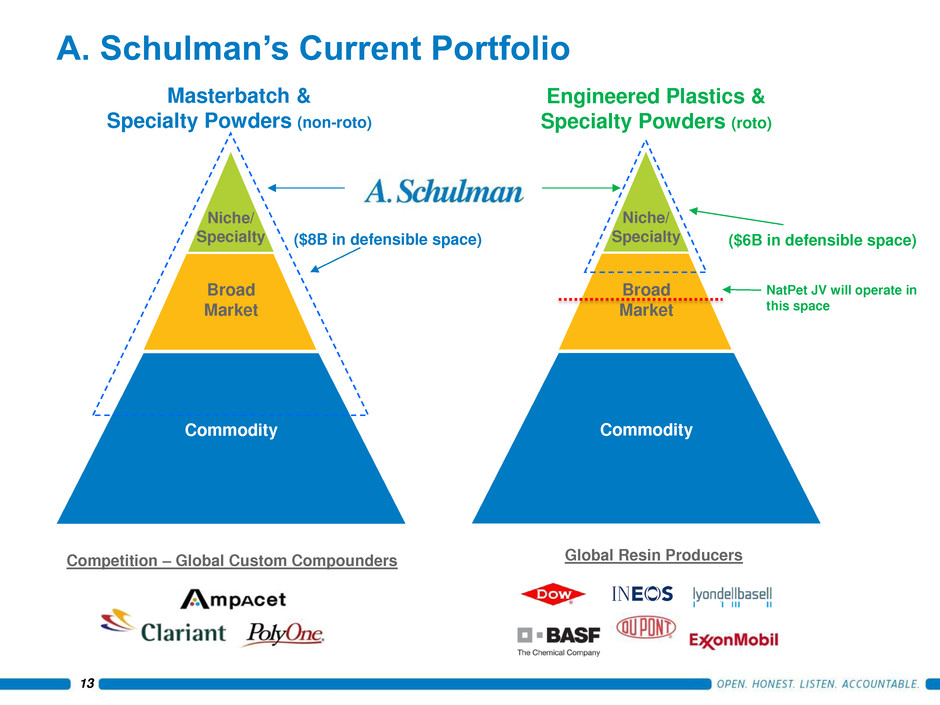
A. Schulman’s Current Portfolio Niche/ Specialty Broad Market Commodity Masterbatch & Specialty Powders (non-roto) Engineered Plastics & Specialty Powders (roto) Niche/ Specialty Broad Market Commodity Competition – Global Custom Compounders Global Resin Producers ($8B in defensible space) ($6B in defensible space) 13 NatPet JV will operate in this space
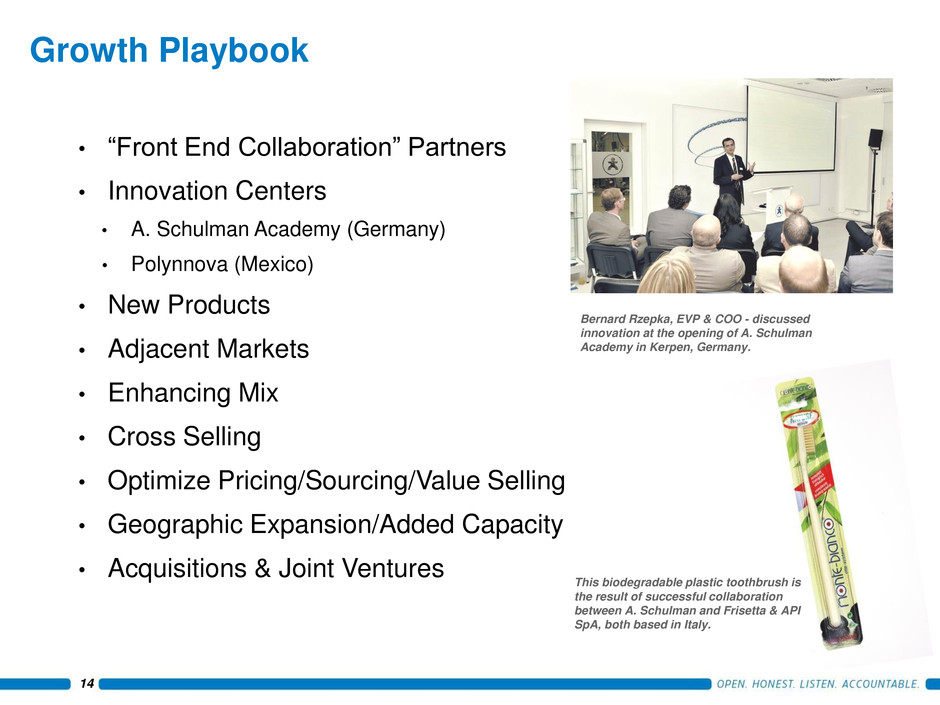
Growth Playbook • “Front End Collaboration” Partners • Innovation Centers • A. Schulman Academy (Germany) • Polynnova (Mexico) • New Products • Adjacent Markets • Enhancing Mix • Cross Selling • Optimize Pricing/Sourcing/Value Selling • Geographic Expansion/Added Capacity • Acquisitions & Joint Ventures Bernard Rzepka, EVP & COO - discussed innovation at the opening of A. Schulman Academy in Kerpen, Germany. This biodegradable plastic toothbrush is the result of successful collaboration between A. Schulman and Frisetta & API SpA, both based in Italy. 14
• Explore horizontal specialty chemical growth platforms (i.e. adhesives, foams, ceramics) • Seek alternative chemistry opportunities that complement our core competencies • Opportunistically add to plastics business if presented with geographic, technical or market advantage 15 Strategic Transformation TRANSFORM A. SCHULMAN BEYOND PLASTICS INTO A PREMIER SPECIALTY CHEMICAL ORGANIZATION
Financials 16
• Track Record of Continued Cash Generation From Operations • Cash was $130 million at 5/31/13; net debt position of $98 million; $184 million of untapped credit lines • Leverage of approximately 1x • Company Looks To Optimize Capital Allocation • Reinvest in business - Tech centers, new products, marketing initiatives, exploration of adjacent markets • Active Share Buy Back Program – Repurchased 43K shares as of 5/31/13 at an average price of $24.86 per share • Dividend Payments – Recent increase provides attractive annual yield of approximately 3% • Company Continues To Improve Working Capital & ROIC • Days of working capital were 57 as of 5/31/13 vs. 59 days at 5/31/12 • Global initiative to improve ROIC underway 17 Financial Strength & Flexibility A. Schulman Will Continue To Use Dry Powder For Strategic Acquisitions That Are Aligned With Company’s Core Capabilities
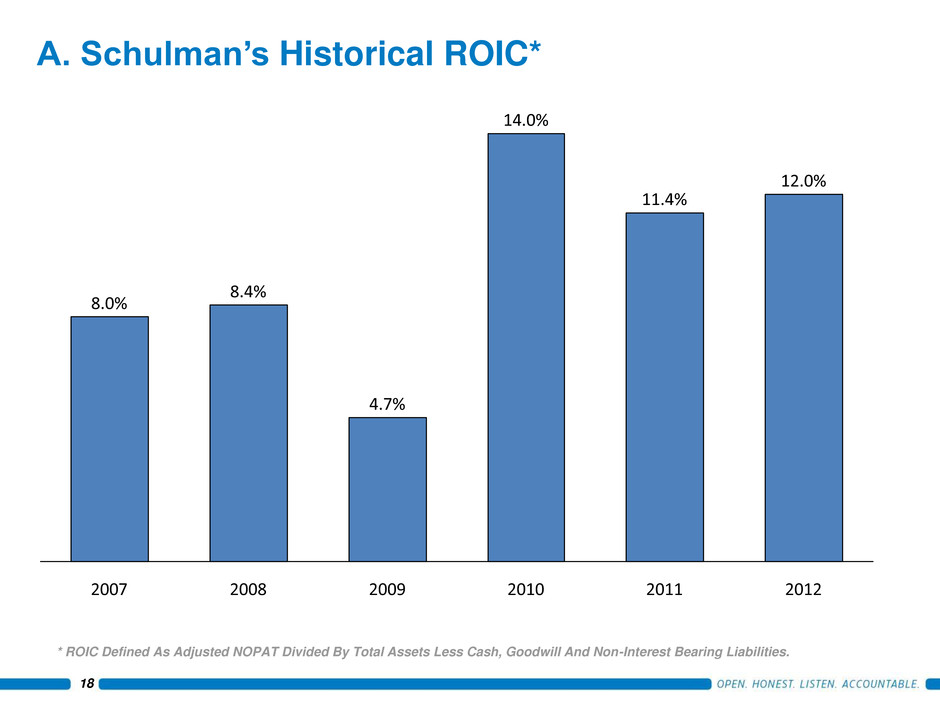
A. Schulman’s Historical ROIC* 18 * ROIC Defined As Adjusted NOPAT Divided By Total Assets Less Cash, Goodwill And Non-Interest Bearing Liabilities. Shshsld gsdjg;ls dj;fgjds lfjsdljfls dkjf;lsj dfl;sdjk f;lsdkjf; lsdjkf;sl djf;lsdjf ;lsdjkfl; sdjf;lds jf;sdljf;l dsj;lsjfd ;sljf;sld kjf;sjfs; fjs; 2012 12.0% 2011 11.4% 2010 14.0% 2009 4.7% 2008 8.4% 2007 8.0%
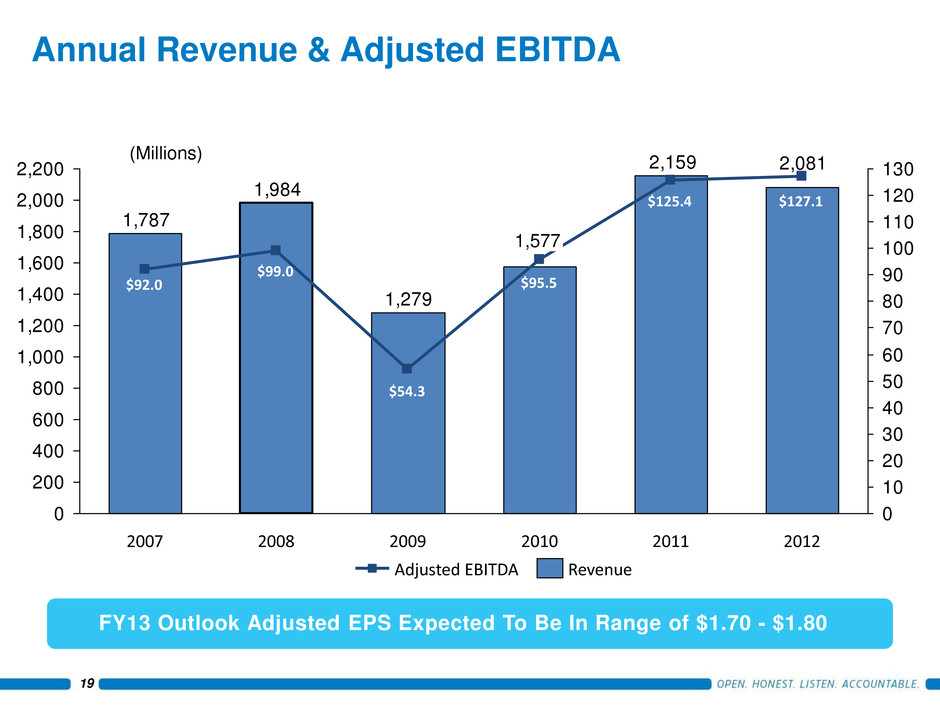
Annual Revenue & Adjusted EBITDA 2,0812,159 1,279 1,984 1,787 0 200 400 600 800 1,000 1,200 1,400 1,600 1,800 2,000 2,200 0 10 20 30 40 50 60 70 80 90 100 110 120 130 2008 2007 2012 2011 2010 1,577 2009 Revenue Adjusted EBITDA (Millions) 19 FY13 Outlook Adjusted EPS Expected To Be In Range of $1.70 - $1.80 $95.5 $54.3 $125.4 $127.1 $99.0 $92.0

20 Historical Financial Summary ($ millions) 20092 20102 20112 20122 LTM 05/31/132 Operating Summary: Revenue $1,279.2 $1577.2 $2159.1 $2081.3 $2113.8 % Growth (35.5%) 23.3% 36.9% (3.6%) -- Gross Profit 170.0 234.2 286.5 275.3 271.5 % Margin 13.3% 14.8% 13.3% 13.2% 12.8% EBITDA1 $54.3 $95.5 $125.4 $127.1 $115.9 % Margin 4.2% 6.1% 5.8% 6.1% 5.5% Depreciation & Amortization $25.0 $27.4 $40.3 $38.8 $41.1 Interest Expense 4.8 4.9 6.4 8.4 7.4 Income from Continuing Operations 11.2 47.5 49.7 51.7 41.5 Cash Flow Summary: Capital Expenditures $24.8 $19.0 $26.4 $34.0 $27.0 Dividends 15.8 16.8 19.4 20.9 22.9 Share Repurchases 1.6 0.0 22.2 26.8 6.4 Balance Sheet Summary: Cash and Equivalents $228.7 $122.8 $155.8 $124.0 $130.1 Total Debt 105.1 154.7 196.1 209.9 228.2 Shareholders’ Equity 371.0 493.1 554.3 507.7 527.5 Total Capitalization 476.1 647.8 750.4 717.6 755.7 1 Refer to the appendix for calculation and reconciliation. 2 Historically reported amounts have been adjusted to exclude the Australian rotational compounding business that has been reported as discontinued operations with effect from 5/31/13.
• Specialty chemical and attribute provider of masterbatch solutions, niche engineered plastics, custom color technologies, specialty powders and size reduction • Global footprint to maximize growth opportunities • Growth Playbook which focuses on adjacent markets, new products & technologies and cross selling • Proven track record of acquisitions to drive growth and restructuring programs to optimize cost structure • Unbroken track record of dividends since going public in 1972 • Experienced management team SHLM Investment Highlights 21
Appendix 22
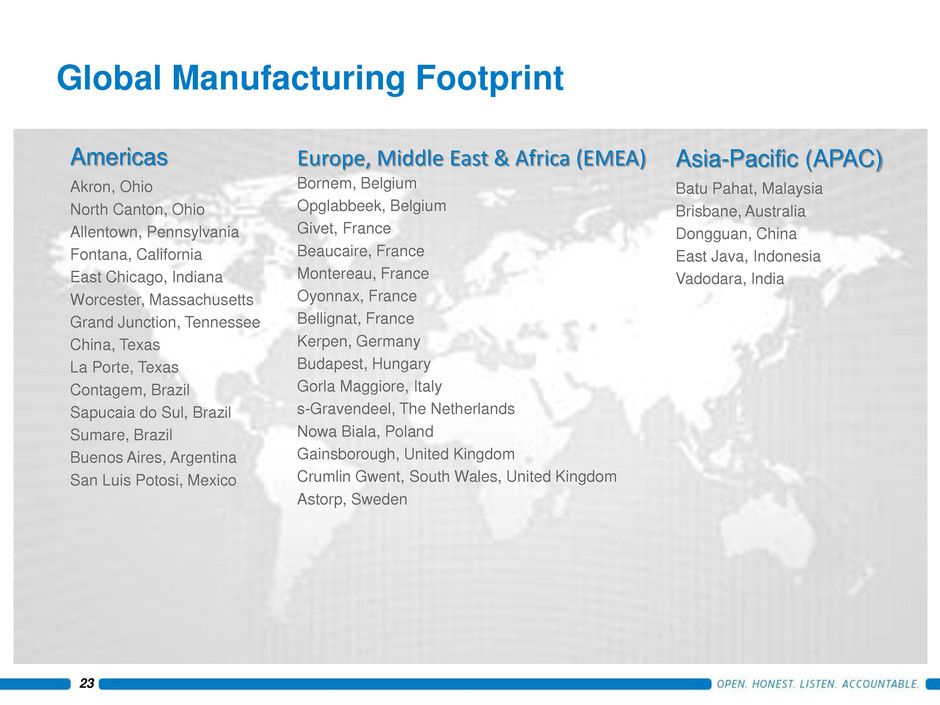
Global Manufacturing Footprint Americas Akron, Ohio North Canton, Ohio Allentown, Pennsylvania Fontana, California East Chicago, Indiana Worcester, Massachusetts Grand Junction, Tennessee China, Texas La Porte, Texas Contagem, Brazil Sapucaia do Sul, Brazil Sumare, Brazil Buenos Aires, Argentina San Luis Potosi, Mexico 23 Europe, Middle East & Africa (EMEA) Bornem, Belgium Opglabbeek, Belgium Givet, France Beaucaire, France Montereau, France Oyonnax, France Bellignat, France Kerpen, Germany Budapest, Hungary Gorla Maggiore, Italy s-Gravendeel, The Netherlands Nowa Biala, Poland Gainsborough, United Kingdom Crumlin Gwent, South Wales, United Kingdom Astorp, Sweden Asia-Pacific (APAC) Batu Pahat, Malaysia Brisbane, Australia Dongguan, China East Java, Indonesia Vadodara, India

Non-GAAP to GAAP Reconciliation 24 Three months ended May 31, Nine months ended May 31, 2013 2012 2013 2012 (In thousands, except per share data) Net income attributable to A. Schulman, Inc.: GAAP, as reported $ 5,217 $ 16,996 $ 28,779 $ 39,651 Loss from discontinued operations, net of tax (4,821 ) (320 ) (5,102 ) (518 ) Net income from continuing operations $ 10,038 $ 17,316 $ 33,881 $ 40,169 Certain items, net of tax: Asset write-downs (1) 1,386 1,917 2,417 1,917 Costs related to acquisitions (2) 890 147 1,799 952 Restructuring related (3) 2,472 1,556 5,554 4,904 Inventory step-up (4) — 53 138 451 Tax benefits (charges) (5) (17 ) (260 ) (6,177 ) (967 ) Total certain items, net of tax $ 4,731 $ 3,413 $ 3,731 $ 7,257 Non-GAAP $ 14,769 $ 20,729 $ 37,612 $ 47,426 Non-GAAP diluted EPS $ 0.50 $ 0.70 $ 1.28 $ 1.60 Weighted-average number of shares outstanding -diluted 29,477 29,569 29,421 29,585 1 - Asset write-downs primarily relate to asset impairments and accelerated depreciation. 2 - Costs related to acquisitions include those costs incurred to pursue intended targets. 3 - Restructuring related costs include items such as employee severance charges, lease termination charges, curtailment gains/losses, other employee termination costs and charges related to the reorganization of the legal entity structure. 4 - Inventory step-up costs include the adjustment for fair value of inventory acquired as a result of acquisition purchase accounting. 5 - Tax benefits (charges) include the effect of the adjustments to the Italian valuation allowance in fiscal 2012 and the adjustments to the Germany and Brazil valuation allowances in fiscal 2013.
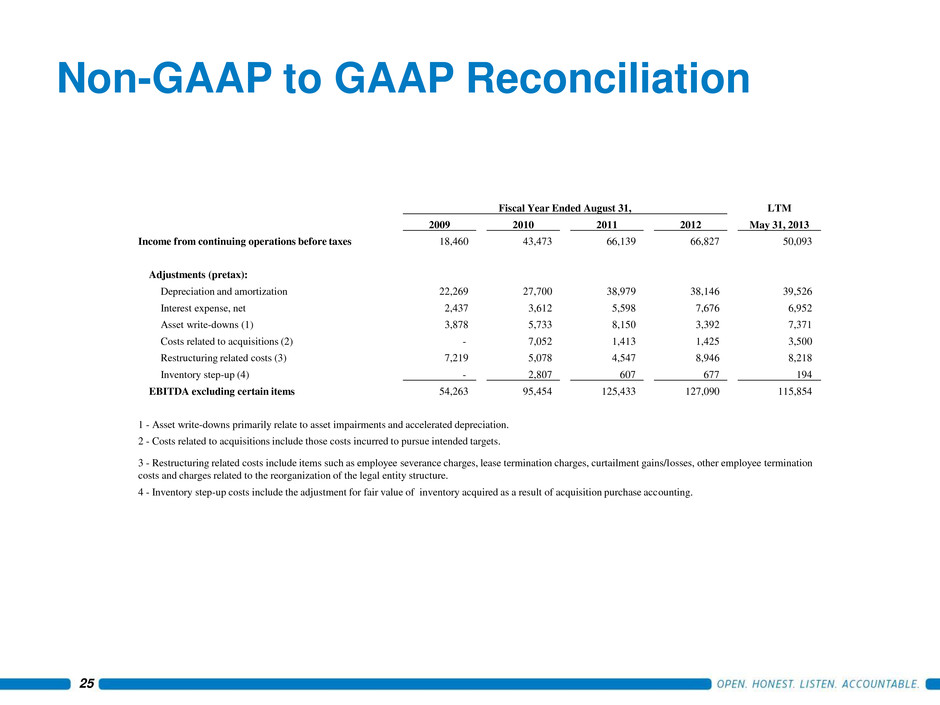
Fiscal Year Ended August 31, LTM 2009 2010 2011 2012 May 31, 2013 Income from continuing operations before taxes 18,460 43,473 66,139 66,827 50,093 Adjustments (pretax): Depreciation and amortization 22,269 27,700 38,979 38,146 39,526 Interest expense, net 2,437 3,612 5,598 7,676 6,952 Asset write-downs (1) 3,878 5,733 8,150 3,392 7,371 Costs related to acquisitions (2) - 7,052 1,413 1,425 3,500 Restructuring related costs (3) 7,219 5,078 4,547 8,946 8,218 Inventory step-up (4) - 2,807 607 677 194 EBITDA excluding certain items 54,263 95,454 125,433 127,090 115,854 1 - Asset write-downs primarily relate to asset impairments and accelerated depreciation. 2 - Costs related to acquisitions include those costs incurred to pursue intended targets. 3 - Restructuring related costs include items such as employee severance charges, lease termination charges, curtailment gains/losses, other employee termination costs and charges related to the reorganization of the legal entity structure. 4 - Inventory step-up costs include the adjustment for fair value of inventory acquired as a result of acquisition purchase accounting. 25 Non-GAAP to GAAP Reconciliation
