Attached files
| file | filename |
|---|---|
| 8-K - 8-K - BROADWIND, INC. | a13-17720_18k.htm |
| EX-99.1 - EX-99.1 - BROADWIND, INC. | a13-17720_1ex99d1.htm |
Exhibit 99.2
|
|
August 1, 2013 Investor Teleconference Q2 2013 Results © 2013 Broadwind Energy, Inc. All Rights Reserved. |

|
|
Industry Data Disclaimer and Forward-Looking Statements Broadwind obtained the industry and market data used throughout this presentation from our own research, internal surveys and studies conducted by third parties, independent industry associations or general publications and other publicly available information. Independent industry publications and surveys generally state that they have obtained information from sources believed to be reliable, but do not guarantee the accuracy and completeness of such information. Forecasts are particularly likely to be inaccurate, especially over long periods of time. We are not aware of any misstatements in the industry data we have presented herein, but estimates involve risks and uncertainties and are subject to change based on various factors beyond our control. This presentation includes various forward-looking statements related to future, not past, events. Statements in this presentation that are not historical are forward-looking statements. These statements are based on current expectations and we undertake no obligation to update these statements to reflect events or circumstances occurring after this presentation. Such statements are subject to various risks and uncertainties that could cause actual results to vary materially from those stated. Such risks and uncertainties include, but are not limited to: expectations regarding our business, end-markets, relationships with customers and management’s ability to diversify our customer base; the impact of competition and economic volatility on the industries in which we compete; our ability to realize revenue from customer orders and backlog; the impact of regulation on end-markets, including the wind energy industry in particular; the sufficiency of our liquidity and working capital; our restructuring plans and the associated cost savings; the ability to preserve and utilize our tax net operating loss carry-forwards; and other risks and uncertainties described in our filings with the Securities and Exchange Commission. This document contains non-GAAP financial information. We believe that certain non-GAAP financial measures may provide users of this financial information meaningful comparisons between current results and results in prior operating periods. We believe that these non-GAAP financial measures can provide additional meaningful reflection of underlying trends of the business because they provide a comparison of historical information that excludes certain infrequently occurring or non-operational items that impact the overall comparability. Non-GAAP financial measures should be viewed in addition to, and not as an alternative to, our reported results prepared in accordance with GAAP. Please see our earnings release dated as of August 1, 2013 for a reconciliation of certain non-GAAP measures presented in this presentation. 2 © 2013 Broadwind Energy, Inc. All Rights Reserved. |
|
|
Q2 2013 Overview 3 Business Highlights New orders of $59 million; cancelled $35 million order from 2010 Gross profit margin (ex. restructuring) doubled to 7.4% Adj. EBITDA more than double Q2 2012 Operating working capital dropped to 5% of sales due to receipt of customer deposits to secure 2013/2014 tower production Idle tower facility sale completed, adding $8 million of cash and reducing debt by $3.5 million Market Highlights Wind Energy PTC renewed in January; modified terms effectively last 2-3 years Strong tower outlook for 2013-2014 Oil & Gas Strong growth in oil sector Natural gas sector still weak although pricing has improved by $2.20 / MMBTU from 2012 low point Mining Market remains slow © 2013 Broadwind Energy, Inc. All Rights Reserved. |

|
|
Orders and Backlog Q2 Orders ($ in millions) Order Backlog New tower orders of $52 million, reduced by $35 million in cancelled orders originally placed in 2010 $70 million in tower orders received after 6/30/13 – 2013 capacity full, filling up 2014 Gearing and Services order activity low Q2 2013 ending backlog down 16% from Q1 2013 93% of total 2013 estimated revenue was booked as of 6/30/13 Backlog approaching $200 million at 7/31/13 4 Q2 12 Q2 13 1H 12 1H 13 Towers/Weldments 11.1 52.1 13.5 132.5 Gearing 15.9 4.8 26.6 16.5 Services 5.3 2.6 10.3 2.2 Gross Orders 32.3 59.5 50.4 151.2 less: tower cancellations -2.2 -34.5 -2.2 -34.5 Net Orders 30.1 25.0 48.2 116.7 © 2013 Broadwind Energy, Inc. All Rights Reserved. |

|
|
Continued Transformation Progress Broadwind ENERGY Rationalization Thousands Sq. Ft. Reduction toward goal Expense Management SGA as % of Revenue Revenue Growth and Diversification Estimate New Wind Installed Base Industrial and Other 2013 Broadwind Energy, Inc. All Rights Reserved. |

|
|
Gearing Revenue Transformation 6 History Shifted from industrial to wind, back to industrial over 10-year period 2008-2010: Lost our market focus and most of sales force As wind declined in 2010, began rebuilding relationships with customers in natural gas and mining In 2011 mining and natural gas covered losses in wind By 2012-13, natural gas orders declined and mining softened Some of the shortfall in mining and natural gas was covered by an increase in oil customers Future Complete consolidation to streamline production flow Expand engineering capabilities to provide customers greater value we know gearing technology sometimes better than they do Deliver on-time with high quality Ensure diversified mix Offer more value-added products such as gear housings and service agreements © 2013 Broadwind Energy, Inc. All Rights Reserved. |

|
|
Continuous Improvement 7 Streamlining Processes Gearing order to shop floor release – recurring products Shop Order Completion – Duration (Days) Low High Current 35 77 Future 1 16 Number of Steps Current 102 Future 32 Number of Handoffs Current 43 Future 10 Comments Questioning every step in process is yielding cycle-time reductions Reducing touch time Streamlining hand-offs between departments Progress Since Program Inception: Cut injury rate in half Reduced injury costs by $.7 million Targeting a 40% drop in injuries in the ‘13-14 policy year (commenced in July) which would lower costs an additional $.3 million EHS Program Progress Building a culture of continuous improvement across the business © 2013 Broadwind Energy, Inc. All Rights Reserved. |

|
|
Consolidated Financial Results 8 Q2 2013 Comments Sales down 9% from Q2 2012 – weak activity in Gearing and Services segments, partly offset by Towers and Weldments revenue – slippage of $4 million into Q3 Gross margin double Q2 2012 – improved Towers throughput and mix Operating expense increased slightly from Q2 2012 – increased amortization and restructuring expense nearly offset by 8% decrease in SGA Adj. EBITDA of $2.7 million well above Q2 2012 Per share loss of $.01 includes +$.21 from sale of assets 2012 2013 2012 2013 56.3 51.4 Revenue-$M 110.8 97.0 1.7 2.6 Gross Profit-$M 3.9 4.8 3.7% 7.4% -% (ex. Restructuring) 4.2% 6.6% 5.8 5.9 Operating Expense-$M 12.0 12.6 10.3% 11.3% -% (ex. Restructuring) 10.7% 12.2% (4.2) (3.3) Operating Loss-$M (8.1) (7.8) 1.1 2.7 Adj. EBITDA-$M 2.4 4.0 (0.30) (0.01) EPS Continuing- $ (0.58) (0.35) Q2 1H © 2013 Broadwind Energy, Inc. All Rights Reserved. |

|
|
Profitability Progress 9 Continued progress on pathway to profitability Gross Margin Improvements Less variable mix and production enhancements – Towers Square footage reduction (restructuring) Challenges Rising share of gearboxes – Gearing Soft end markets for Gearing – mining, natural gas Low point for new wind installs – depressed Services revenue Operating Expense Improvements SGA expense has declined over $6 million since 2010 Reductions in legal, bad debt and employee compensation costs Continued focus on expense management 9-10% © 2013 Broadwind Energy, Inc. All Rights Reserved. |

|
|
Towers and Weldments Second Quarter 2013 10 Strategic Focus Tower section volume decreased 12% compared to Q2 2012 Industrial Weldments revenue increased 42% compared to Q2 2012 Q2 2013 productivity increase from process improvements and more uniform tower types Adj. EBITDA margin improved dramatically due to better productivity and favorable mix Use Continuous Improvement tools to drive increased throughput and efficiency Expanding capacity in our current footprint: >500 towers in 2014 Diversify by growing Industrial Weldments product line Revenue Mix 2012 2013 2012 2013 76 85 Towers-No. 145 158 320 282 Sections-No. 665 556 37.0 37.5 Revenue-$M 72.2 67.5 0.6 4.1 Op Income-$M 1.6 6.1 1.8 5.3 Adj. EBITDA-$M 4.1 8.6 4.9% 14.1% Adj. EBITDA Margin 5.6% 12.8% Q2 1H © 2013 Broadwind Energy, Inc. All Rights Reserved. |

|
|
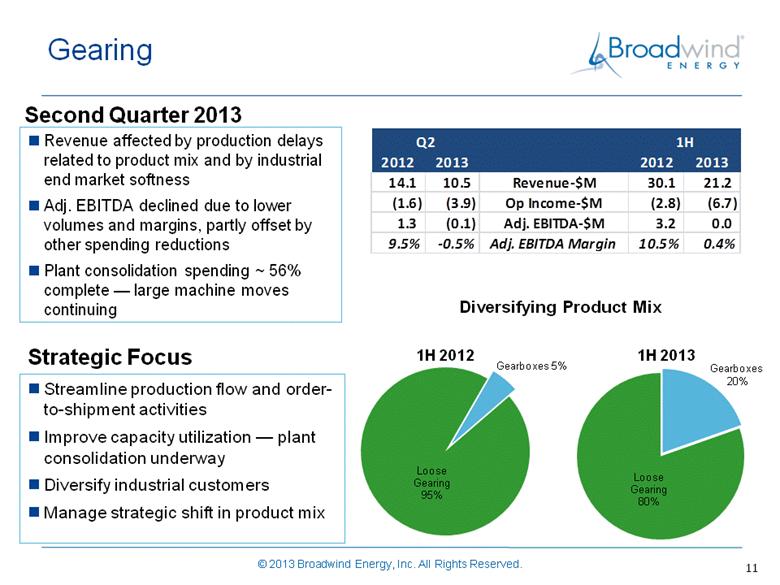
Gearing Second Quarter 2013 Revenue affected by production delays related to product mix and by industrial end market softness Adj. EBITDA declined due to lower volumes and margins, partly offset by other spending reductions Plant consolidation spending ~ 56% complete — large machine moves continuing 11 Streamline production flow and order-to-shipment activities Improve capacity utilization — plant consolidation underway Diversify industrial customers Manage strategic shift in product mix Strategic Focus Diversifying Product Mix Gearboxes 5% 2012 2013 2012 2013 14.1 10.5 Revenue-$M 30.1 21.2 (1.6) (3.9) Op Income-$M (2.8) (6.7) 1.3 (0.1) Adj. EBITDA-$M 3.2 0.0 9.5% -0.5% Adj. EBITDA Margin 10.5% 0.4% Q2 1H © 2013 Broadwind Energy, Inc. All Rights Reserved. |
|
|
Services Revenue down 29% from Q2 2012; new wind installations at all-time industry low, depressing field service activity Aligned cost structure with revenue outlook 12 Diversify revenue base, particularly with industrial customers Further develop proprietary product offerings Launched DriveMAX and BladeMAX campaigns Continue drive toward profitability Strategic Focus Second Quarter 2013 Source: MAKE Consulting 2012 2013 2012 2013 5.7 4.1 Revenue-$M 9.1 11.5 (1.1) (1.3) Op Income-$M (2.8) (2.0) (0.5) (0.6) Adj. EBITDA-$M (1.5) (0.7) -9.3% -15.0% Adj. EBITDA Margin -16.1% -5.6% Q2 1H © 2013 Broadwind Energy, Inc. All Rights Reserved. |

|
|
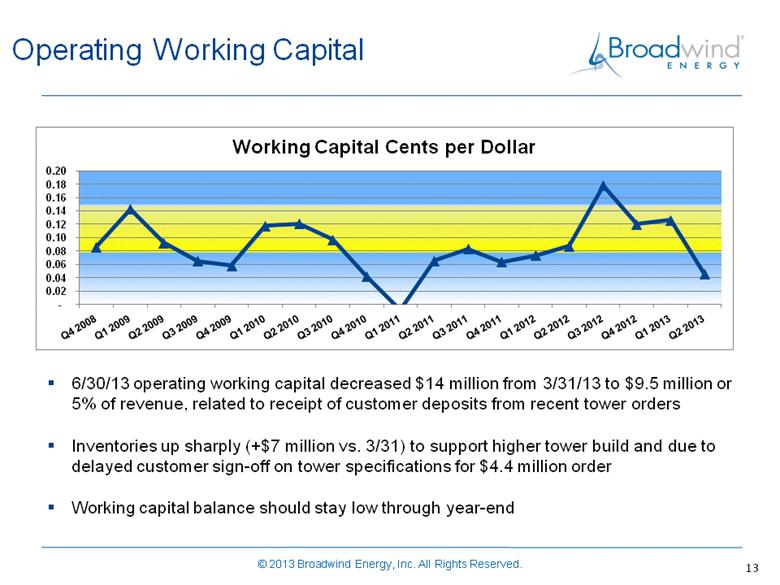
Operating Working Capital 13 6/30/13 operating working capital decreased $14 million from 3/31/13 to $9.5 million or 5% of revenue, related to receipt of customer deposits from recent tower orders Inventories up sharply (+$7 million vs. 3/31) to support higher tower build and due to delayed customer sign-off on tower specifications for $4.4 million order Working capital balance should stay low through year-end © 2013 Broadwind Energy, Inc. All Rights Reserved. |
|
|
Debt and Liquidity 14 Net debt negative – cash increased from customer deposits and sale of Brandon facility Eliminated Brandon mortgage liability with proceeds of sale Debt balance includes $3 million which is either forgivable economic development grants or New Markets Tax Credit financing Line of credit undrawn; expected to remain undrawn through year-end 6/30/2013 $M AloStar line of credit - Long-term debt 0.2 Capital leases 1.7 Subtotal: debt ex. grants 2.0 Grants/tax credits 2.9 Total Debt 4.8 Less: Cash and related assets (17.6) Net Debt (12.8) © 2013 Broadwind Energy, Inc. All Rights Reserved. |

|
|
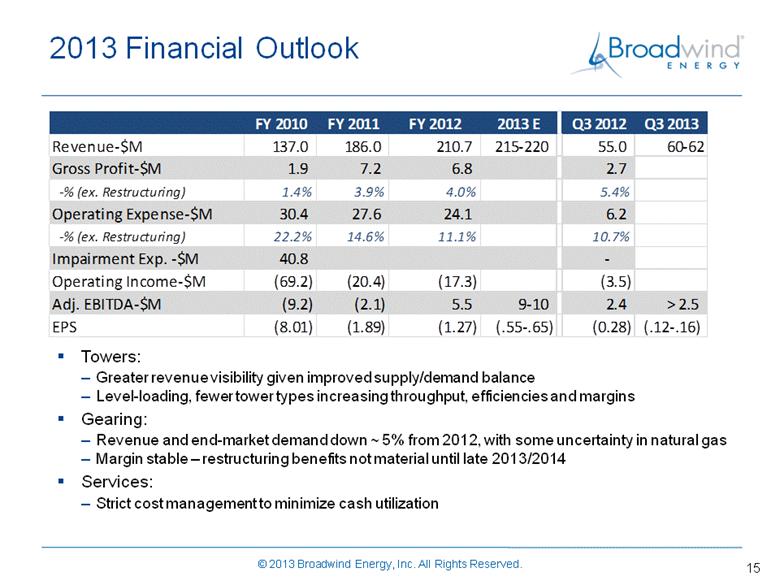
2013 Financial Outlook 15 Towers: Greater revenue visibility given improved supply/demand balance Level-loading, fewer tower types increasing throughput, efficiencies and margins Gearing: Revenue and end-market demand down ~ 5% from 2012, with some uncertainty in natural gas Margin stable – restructuring benefits not material until late 2013/2014 Services: Strict cost management to minimize cash utilization FY 2010 FY 2011 FY 2012 2013 E Q3 2012 Q3 2013 Revenue-$M 137.0 186.0 210.7 215-220 55.0 60-62 Gross Profit-$M 1.9 7.2 6.8 2.7 -% (ex. Restructuring) 1.4% 3.9% 4.0% 5.4% Operating Expense-$M 30.4 27.6 24.1 6.2 -% (ex. Restructuring) 22.2% 14.6% 11.1% 10.7% Impairment Exp. -$M 40.8 - Operating Income-$M (69.2) (20.4) (17.3) (3.5) Adj. EBITDA-$M (9.2) (2.1) 5.5 9-10 2.4 > 2.5 EPS (8.01) (1.89) (1.27) (.55-.65) (0.28) (.12-.16) © 2013 Broadwind Energy, Inc. All Rights Reserved. |
|
|
Restructuring and Other Updates 16 Inception to date Est. Total % Capital Spend $4,054 $5,347 76% Expense $3,829 $5,602 68% Subtotal: Cash Outlay $7,883 $10,949 72% Asset sale gain ($3,586) ($3,586) Non-cash $2,525 $5,373 Grand Total $6,822 $12,736 54% Settlement of shareholder class action litigation 72% of restructuring plan cash outlay has been incurred: © 2013 Broadwind Energy, Inc. All Rights Reserved. |

|
|
17 Broadwind Energy is committed to helping customers maximize performance of their energy and infrastructure investments — quicker, easier and smarter. © 2013 Broadwind Energy, Inc. All Rights Reserved. |