Attached files
| file | filename |
|---|---|
| 8-K - 8-K - EXELON CORP | d574503d8k.htm |
| EX-99.1 - PRESS RELEASE AND EARNINGS RELEASE ATTACHMENTS - EXELON CORP | d574503dex991.htm |
 Earnings Conference Call
2
Quarter 2013
July
31 ,
2013
Exhibit 99.2
nd
st |
 Cautionary Statements Regarding
Forward-Looking Information
1
2013 2Q Earnings Release Slides
This presentation contains certain forward-looking statements within the
meaning of the Private Securities Litigation Reform Act of 1995, that
are subject to risks and uncertainties. The factors that could cause
actual results to differ materially from the forward-looking
statements made by Exelon Corporation, Commonwealth Edison
Company,
PECO
Energy
Company,
Baltimore
Gas
and
Electric
Company
and
Exelon
Generation Company, LLC (Registrants) include those factors discussed herein,
as well as the items discussed in (1)
Exelon’s 2012 Annual Report on Form 10-K in (a)
ITEM 1A. Risk Factors, (b) ITEM 7. Management’s Discussion and Analysis of
Financial Condition and Results of Operations and (c) ITEM 8. Financial
Statements and Supplementary Data: Note 19; (2) Exelon’s First
Quarter 2013 Quarterly Report on Form 10-Q in (a) Part II, Other
Information, ITEM 1A. Risk Factors; (b) Part 1, Financial Information,
ITEM 2. Management’s Discussion and Analysis of Financial Condition
and Results of Operations and (c) Part I, Financial Information, ITEM 1.
Financial Statements: Note 17; and (3) other factors discussed in filings with
the SEC
by
the
Registrants.
Readers
are
cautioned
not
to
place
undue
reliance
on
these
forward-looking statements, which apply only as of the date of this press
release. None of the Registrants undertakes any obligation to publicly
release any revision to its forward-looking statements to reflect
events or circumstances after the date of this presentation.
2013 2Q Earnings Release Slides |
 •
Current 5-year plan includes $16B of
growth CapEx (~$13.5B at Utilities)
•
Installed 99 MW at AVSR YTD with
another 102 MW to come on line in 2013
•
Adding 46 MW to wind portfolio in 2014
with the Beebe 1B project
•
Continued smart meter installation at
PECO, BGE and ComEd
•
2Q13 nuclear capacity factor of 92.8%
and YTD 2013 capacity factor of 94.6%
•
Entered into agreement with EDF to
operate the CENG plants
•
Dispatch match rate for fossil and hydro
fleet of 99.1% and energy capture rate
for wind and solar fleet of 92.4%
•
Top decile safety performance for
ComEd, PECO and BGE
•
SB9 was enacted clarifying language in
EIMA. ComEd made annual filing for
distribution with ICC
•
BGE filed a rate case in May with the
MDPSC
•
Engaged in PJM stakeholder process
around RPM
•
Delivered 2Q earnings within our
guidance range
•
Canceled LaSalle and Limerick EPU
projects
•
On track to achieve $550M of annual
run-rate merger synergies by 2014
•
Identified additional O&M savings at
ExGen
2013 2Q Earnings Release Slides
2
2Q13 In Review
2013 Expectations:
•
Deliver
3Q13
operating
earnings
within
guidance
range
of
$0.60
-
$0.70/share
(1)
•
On-track
to
achieve
full-year
operating
earnings
within
guidance
range
of
$2.35
-
$2.65/share
(1)
as
disclosed on 4Q12 earnings call
(1)
Refer to Earnings Release Attachments for additional details and to the
Appendix for a reconciliation of adjusted (non-GAAP) operating EPS to GAAP EPS.
Financial
Discipline
Operational
Excellence
Opportunistic
Growth &
Investment
Regulatory
Advocacy
AVSR = Antelope Valley Solar Ranch. EIMA = Energy
Infrastructure Modernization Act. EPU = Extended Power Uprate. ICC = Illinois Commerce Commission. MDPSC = Maryland Public Service
Commission. O&M = Operating & Maintenance. RPM =
Reliability Pricing Model. |
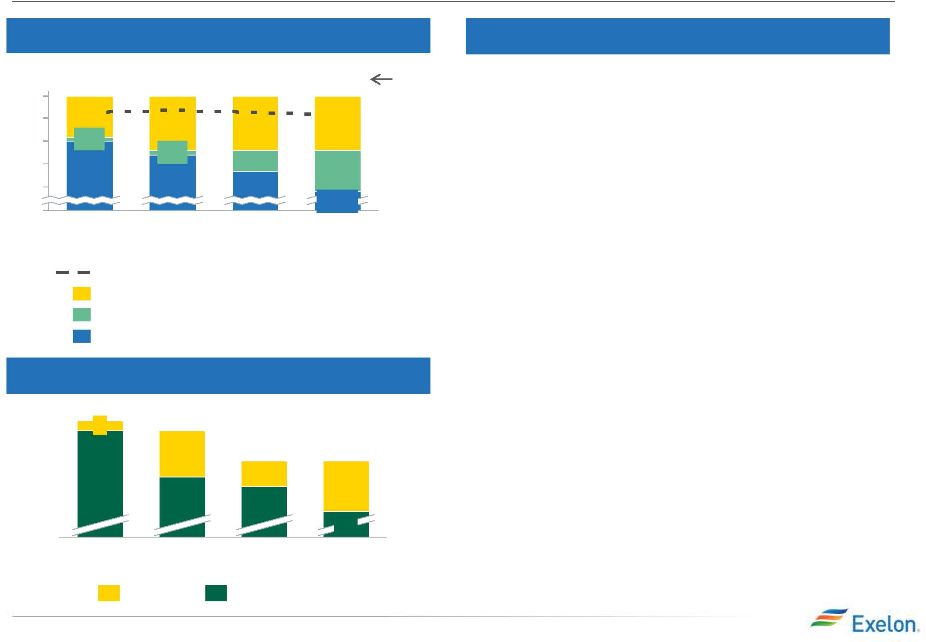 RPM Results
3
Coal
Fired
Gen-BRA
Offers
(2)
(GW)
%
of
Unforced
Capacity
Procured
by
Type
(1)
16/17
59
49
15/16
59
54
14/15
65
56
13/14
67
65
2
Cleared
Uncleared
RPM Clearing Trends
(1)
Sources: (1) PJM RPM Base Residual Auction Results Reports (2) RPM Commitments by
Fuel Type by DY
(2)
Estimated
based
on
PY
16/17
PJM
Base
Residual
Auction
Results.
Includes
imports.
For
comparability, PJM geographical additions included by adding initial BRA offered
and cleared quantities to previous years.
Total
GW
•
Decrease in existing coal-fired
generation
•
6.3 GW of coal retirements in 2012
alone
•
10 GW in the PJM deactivation queue
for 2013 -
2015
•
Internal estimate: ~ 22 GW for 2012 -
2016
•
Increase in planned gas-fired
generation
•
Increase in cleared GW of Energy
Efficiency (EE), Demand Response
(DR), and Imports
95%
85%
90%
100%
80%
0%
169
79%
9%
12%
15/16
165
84%
16/17
14/15
150
87%
1%
5%
153
90%
1%
9%
13/14
Existing Gen as of 13/14 (incl. Wind)
Cumulative New/Gen Uprates since 13/14
Cleared EE, DR and Imports Combined
Recommended Reserve Margin (~15.6%)
12%
12%
9
5
10
2013 2Q Earnings Release Slides
BRA = Base Residual Auction. RPM = Reliability Pricing Model. PY = Plan Year. Notes: (1) PY 13/14
includes ATSI (2) PY 14/15 includes Duke (3) PY 15/16 includes significant portion
of AEP and DEOK zone load previously under FRR alternative (4) PY 16/17
includes EKPC (5) PY 13/14 is base year for cumulative New Gen and
Uprates |
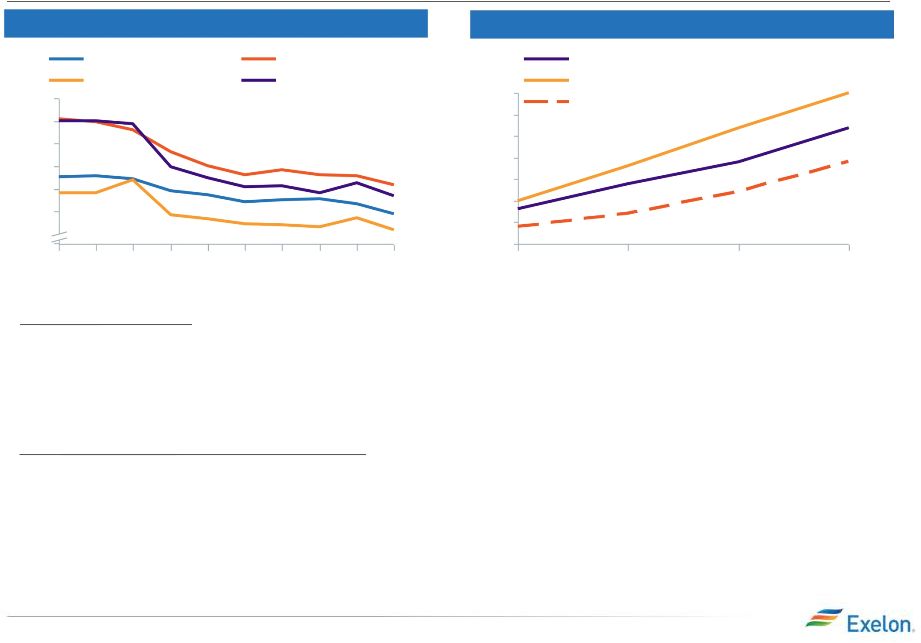 Hedging Activity and Market Fundamentals
4
2013 2Q Earnings Release Slides
Fundamental
View
vs.
Market
-
2015
%
of
Expected
Generation
Hedged
(1)
-
Total
Portfolio
(1)
Mid-point of disclosed hedge % range was used
$60
$55
$50
$45
$40
$35
$15
1Q13
3Q12
1Q12
3Q11
1Q11
2Q13
1Q13
4Q12
3Q12
2015-Ratable
2015-Actual
2015-Actual (excl NG hedges)
Market PJMW
Fundamental View PJMW
Market NiHub
Fundamental View NiHub
50%
45%
40%
35%
30%
25%
15%
20%
•
Structural changes in the stack are expected to increase volatility in the spot
energy market and drive prices higher than current market
•
Continue to see a disconnect in forward heat rates compared to our fundamental
forecast given current natural gas prices, expected retirements, new
generation resources, and load assumptions •
We align our hedging strategies with our fundamental views
•
We have widened our deviation from ratable across our entire portfolio over the
past 6 months to approximately 8%
•
Use of natural gas as a cross-commodity hedge leaves more upside to heat
rate expansion Market Fundamentals
Impacts of our view on our hedging activity
2013 2Q Earnings Release Slides |
 Exelon Generation: Gross Margin Update
June 30, 2013
Delta to March 31, 2013
Gross
Margin
Category
($M)
(1)
(2)
2013
2014
2015
2013
2014
2015
Open Gross Margin
(3)
(including South, West, Canada hedged gross margin)
5,750
5,700
5,900
(250)
(650)
(500)
Mark-to-Market
of
Hedges
(3,4)
1,450
850
400
250
450
150
Power New Business / To Go
200
550
750
(150)
(50)
(50)
Non-Power Margins Executed
350
150
50
50
50
0
Non-Power
New
Business
/
To
Go
(5)
250
450
550
(50)
(50)
0
Total Gross Margin
8,000
7,700
7,650
(150)
(250)
(400)
Key Changes in 2Q 2013
•
2013:
AVSR delays; $50M due to FTR under collection; and $50M due to
lower power new business targets
•
2014:
power new business targets
•
2015:
power new business targets
•
Reducing 2013 ExGen O&M by $100M ($50M at Constellation to
offset lower new business targets) and targeting reductions in
2014 and 2015 to result in a roughly flat O&M CAGR for 2013 -
2015
2013 2Q Earnings Release Slides
Retail & Wholesale Load (TWh)
30-40%
60-70%
150
155
2013E
25-35%
155
2015E
2014E
25-35%
Wholesale Load
Total Contracted
Retail Load
65-75%
65-75%
Numbers and percentages are rounded to the nearest 5.
Index load expected to be 20% to 30% of total forecasted retail load.
5
Reduction of $50M due to unplanned nuclear outages and
$350M reduction due to prices and $50M reduction in
$200M reduction due to prices and $50M reduction in
1)
Gross margin rounded to nearest $50M.
2)
Gross margin does not include revenue related to decommissioning, gross
receipts tax, Exelon Nuclear Partners and entities consolidated solely
as a result of the application of FIN 46R.
3)
Includes CENG Joint Venture.
4)
Mark to Market of Hedges assumes mid-point of hedge percentages.
5)
Any changes to new business estimates for our non-power business are
presented as revenue less costs of sales.
200
150
100
50
0
FTR = Financial Transmission Rights.
CAGR = Compound Annual Growth Rate. |
 Key Financial Messages
6
2013 2Q Earnings Release Slides
•
Delivered non-GAAP operating earnings
in 2Q
of $0.53/share within guidance range
provided of $0.50 -
$0.60/share
2Q 2013 vs. Guidance
•
Reduction of wholesale new business targets
and unplanned nuclear outages
•
Favorable impacts of SB9 at ComEd
Full Year 2013 vs. Guidance
•
Reduction of wholesale new business targets
•
Reduction of 2013 ExGen O&M by $100M
•
Favorable load at ComEd and PECO
•
Lower ExGen effective tax rate
•
Favorable interest related to tax positions
•
Favorable impacts of SB9 at ComEd
•
Lower depreciation and other favorable items at
ExGen
$0.32
$0.11
$0.09
$0.53
($0.01)
$0.03
HoldCo
ExGen
ComEd
PECO
BGE
2013 2Q Results
Expect 3Q 2013 earnings of $0.60 -
$0.70/share and re-affirm full year guidance
range of $2.35-$2.65/share
2013 2Q Earnings Release Slides
(1)
(1)
Refer to Earnings Release Attachments for additional details and to the
Appendix for a reconciliation of adjusted (non-GAAP) operating EPS to GAAP EPS.
Numbers may not add due to rounding. SB9 = Senate Bill 9.
|
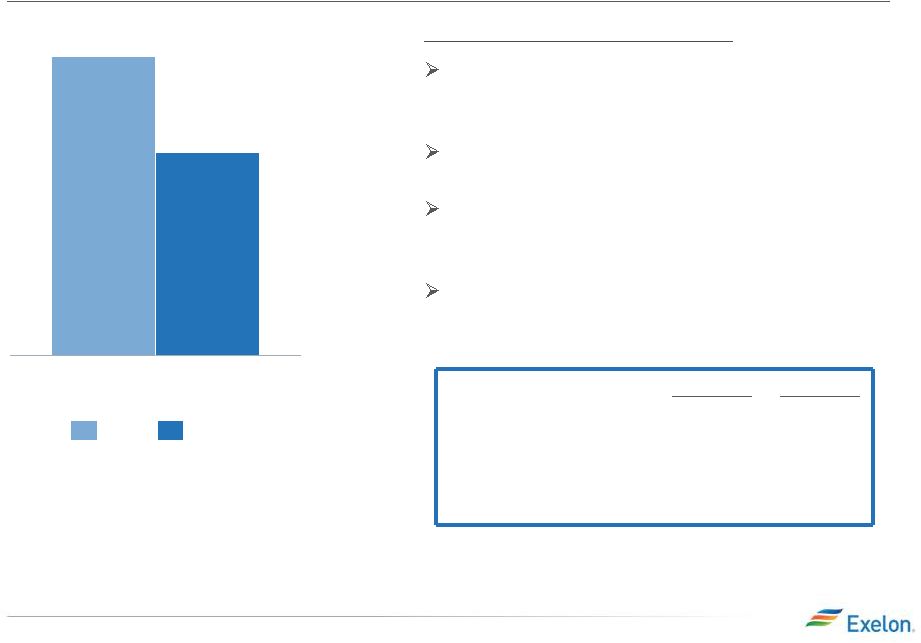 ExGen Operating EPS Contribution
7
2013 2Q Earnings Release Slides
$0.47
$0.32
2Q
2013
2012
(excludes Salem and CENG)
2Q12
Actual
2Q13
Actual
Planned Refueling Outage Days
51
47
Non-refueling Outage Days
16
31
Nuclear Capacity Factor
93.4%
92.8%
Lower RNF, primarily due to lower realized
energy prices, lower capacity pricing and
decreased load volumes: $(0.15)
Increased depreciation expense related to
ongoing capital expenditures: $(0.01)
Lower O&M costs, primarily due to merger
synergies, offset in part by timing of Salem
nuclear refueling outage costs: $0.01
Lower income tax, primarily driven by AVSR
investment tax credit benefits: $0.01
(1)
Refer to the Earnings Release Attachments for additional details and to the
Appendix for a reconciliation of adjusted (non-GAAP) operating EPS to GAAP EPS.
Key
Drivers
–
2Q13
vs.
2Q12
(1)
RNF = Revenue Net Fuel. |
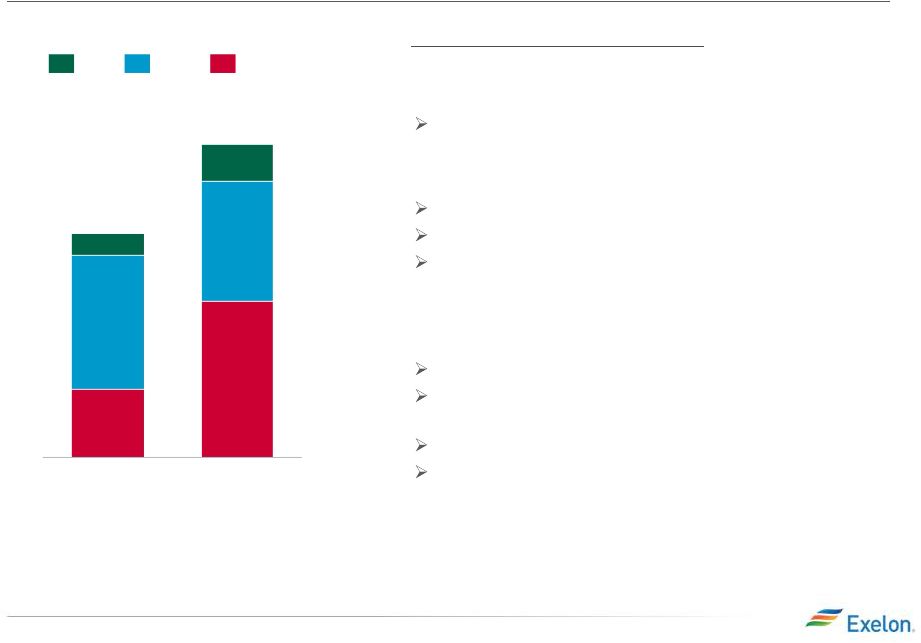 Exelon Utilities Operating EPS Contribution
8
2013 2Q Earnings Release Slides
2Q 2013
2Q 2012
$0.05
$0.11
$0.09
$0.16
$0.10
$0.02
$0.03
$0.22
BGE
PECO
ComEd
Weather
(2)
: $(0.02)
Higher distribution revenue due to higher allowed
ROE
(2)
: $0.01
Impact of Senate Bill 9: $0.01
Discrete impacts of the May 2012 distribution formula
rate order under EIMA
(3)
: $0.07
Higher O&M costs, primarily due to inflation: $(0.01)
Preferred securities redemption: $(0.01)
Lower income tax, primarily due to gas distribution tax
repairs deduction: $0.01
Electric and gas distribution rates: $0.02
PECO
(-0.01):
BGE
(+0.01):
ComEd: (+0.06)
Key
Drivers
–
2Q13
vs.
2Q12
(1):
Numbers may not add due to rounding.
(1)
Refer to the Earnings Release Attachments for additional details and to the Appendix for a
reconciliation of adjusted (non-GAAP) operating EPS to GAAP EPS. (2) Due to the distribution formula rate, changes in ComEd’s
earnings are driven primarily by changes in 30-year U.S. Treasury rates (allowed ROE), rate base and capital structure in
addition to weather, load and changes in customer mix.
(3)
Energy Infrastructure Modernization Act
|
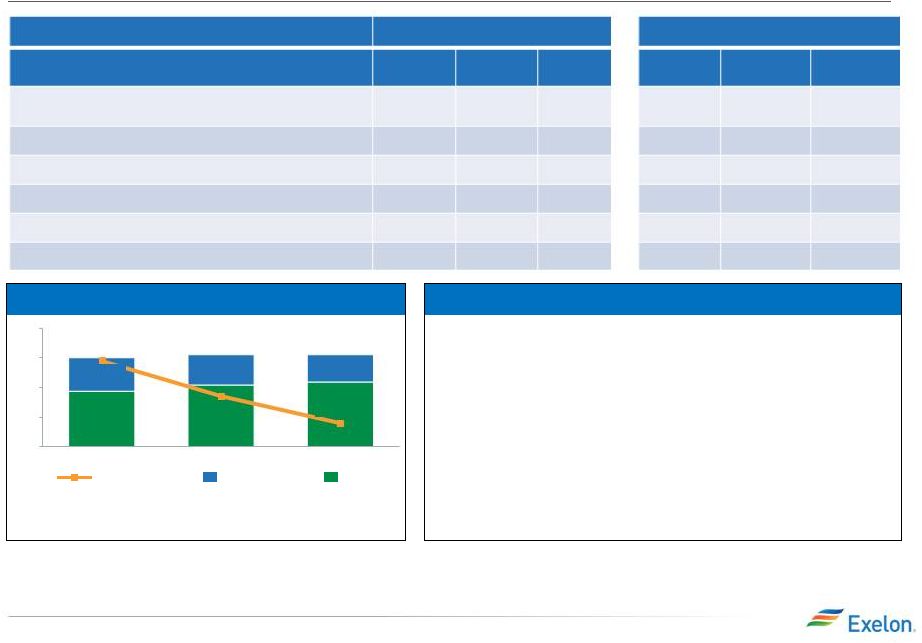
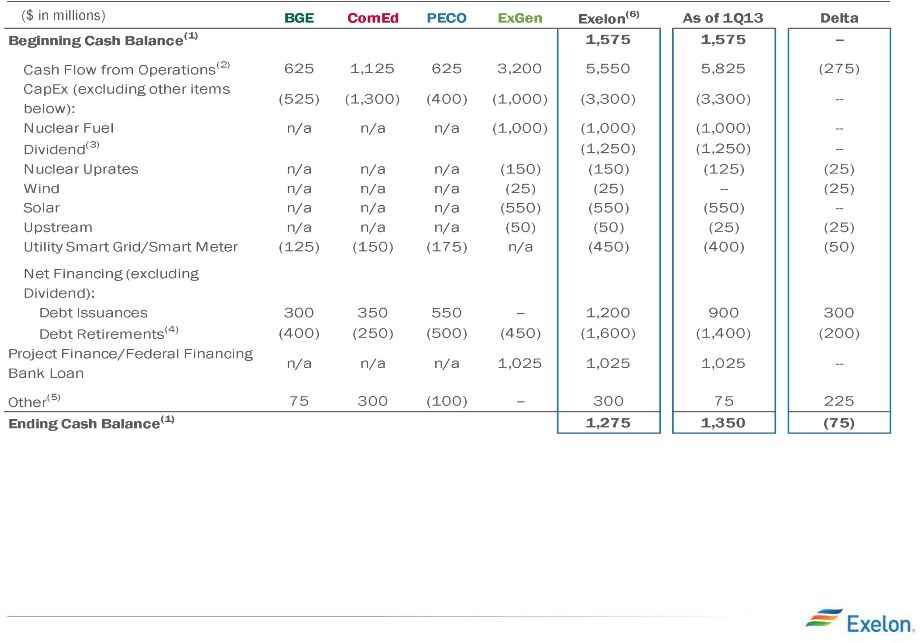 2013 Projected Sources and Uses of Cash
(1)
Exelon beginning cash balance as of 1/1/13. Excludes counterparty
collateral activity. (2)
Cash Flow from Operations primarily includes net cash flows provided by
operating activities and net cash flows used in investing activities other than
capital expenditures.
(3)
Dividends are subject to declaration by the Board of Directors.
(4)
Includes PECO’s $210 million Accounts Receivable (A/R) Agreement with Bank
of Tokyo and excludes BGE’s current portion of its rate stabilization
bonds
(5)
“Other”
includes proceeds from options, redemption of PECO preferred stock and expected
changes in short-term debt. (6)
Includes cash flow activity from Holding Company, eliminations, and other
corporate entities. 9
2013 2Q Earnings Release Slides |
 10
Exelon Generation Disclosures
June 30, 2013
2013 2Q Earnings Release Slides
2013 2Q Earnings Release Slides |
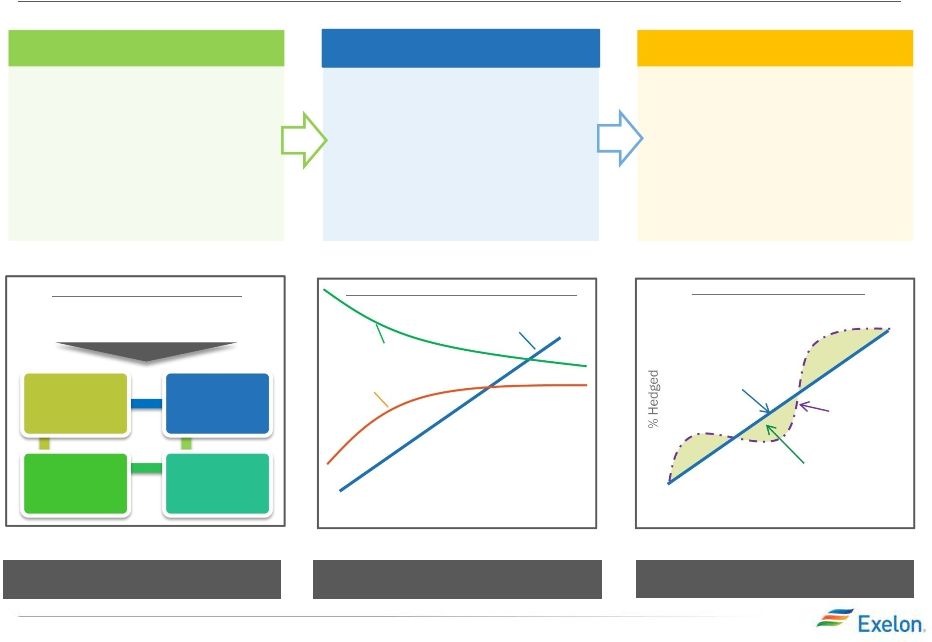 11
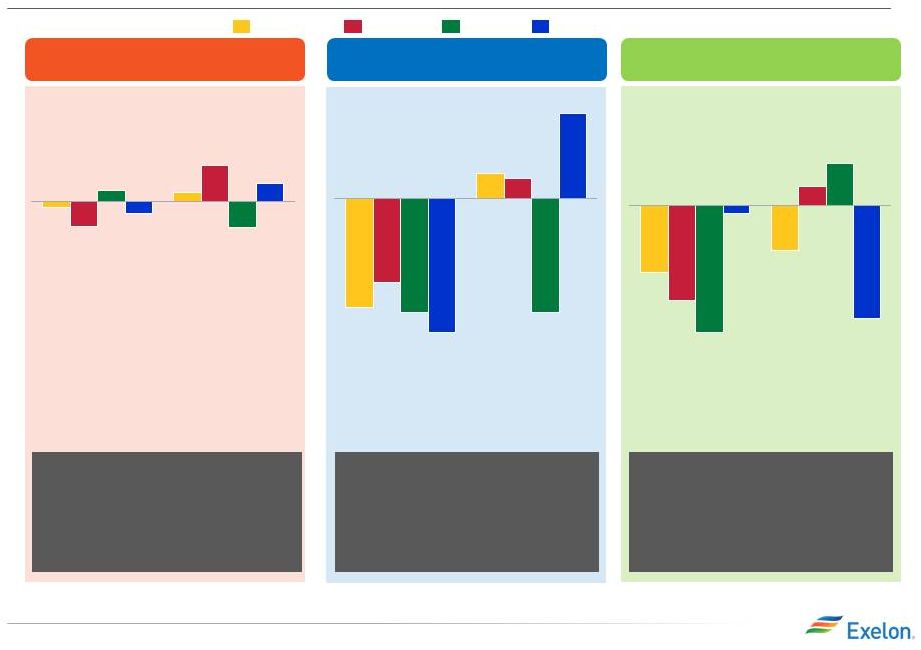
Portfolio Management Strategy
Protect Balance Sheet
Ensure Earnings Stability
Create Value
Exercising
Market
Views
Purely ratable
Actual hedge %
Market views on timing, product
allocation and regional spreads
reflected in actual hedge %
High End of Profit
Low End of Profit
% Hedged
Open Generation
with LT Contracts
Portfolio Management &
Optimization
Portfolio
Management
Over
Time
Align Hedging & Financials
Establishing Minimum Hedge Targets
2013 2Q Earnings Release Slides
•
Aligns hedging program with
financial policies and financial
outlook
•
Establish minimum hedge targets
•
Hedge enough commodity risk to
•
Ensure stability in near-term cash
•
Disciplined approach to hedging
•
Tenor aligns with customer
•
Multiple channels to market that
•
Large open position in outer years
•
Ability to exercise fundamental
market views to create value within
the ratable framework
•
Modified timing of hedges versus
•
Cross-commodity hedging (heat
•
Delivery locations, regional and
Strategic Policy Alignment
Three-Year Ratable Hedging
Bull / Bear Program
Credit Rating
Capital
Structure
Capital &
Operating
Expenditure
Dividend
to meet financial objectives of the
company (dividend, credit rating)
meet future cash requirements
under a stress scenario
flows and earnings
preferences and market liquidity
allow us to maximize margins
to benefit from price upside
purely ratable
rate positions, options, etc.)
zonal spread relationships
2013 2Q Earnings Release Slides |
 12
Components of Gross Margin Categories
Margins move from new business to MtM of hedges over
the course of the year as sales are executed
Margins move from “Non power new business”
to
“Non power executed”
over the course of the year
Gross margin linked to power production and sales
Gross margin from
other business activities
2013 2Q Earnings Release Slides
Hedged gross margins for South, West and Canada region will be included with
Open Gross Margin, and no expected generation, hedge %, EREP or reference prices provided for this region.
Proprietary trading gross margins will remain within “Non Power” New
Business category and not move to “Non Power” Executed category.
(1)
(2)
(3)
MtM of hedges provided directly for the five larger regions. MtM of hedges is
not provided directly at the regional level but can be easily estimated using EREP, reference price and hedged MWh.
Open Gross
Margin
MtM of
Hedges
(2)
“Power”
New
Business
“Non Power”
Executed
“Non Power”
New Business
•Generation Gross
Margin at current
market prices,
including capacity
and ancillary
revenues, nuclear
fuel amortization
and fossils fuels
expense
•Exploration and
Production
•Power Purchase
Agreement (PPA)
Costs and
Revenues
•Provided at a
consolidated level
for all regions
(includes hedged
gross margin for
South, West and
Canada
(1)
)
•Mark to Market
(MtM) of power,
capacity and
ancillary hedges,
including cross
commodity, retail
and wholesale load
transactions
•Provided directly at
a consolidated
level for five major
regions. Provided
indirectly for each
of the five major
regions via
Effective Realized
Energy Price
(EREP), reference
price, hedge %,
expected
generation
•Retail, Wholesale
planned electric
sales
•Portfolio
Management new
business
•Mid marketing new
business
•Retail, Wholesale
executed gas sales
•Load Response
•Energy Efficiency
•BGE Home
•Distributed Solar
•Retail, Wholesale
planned gas sales
•Load Response
•Energy Efficiency
•BGE Home
•Distributed Solar
•Portfolio
Management /
origination fuels
new business
•Proprietary
trading
(3)
2013 2Q Earnings Release Slides |
 ExGen Disclosures
Gross Margin Category ($M)
(1,2)
2013
2014
2015
Open Gross Margin
(including South, West & Canada hedged GM)
(3)
$5,750
$5,700
$5,900
Mark to Market of Hedges
(3,4)
$1,450
$850
$400
Power New Business / To Go
$200
$550
$750
Non-Power Margins Executed
$350
$150
$50
Non-Power New Business / To Go
(5)
$250
$450
$550
Total Gross Margin
$8,000
$7,700
$7,650
Reference Prices
(6)
2013
2014
2015
Henry Hub Natural Gas ($/MMbtu)
$3.68
$3.91
$4.14
Midwest: NiHub ATC prices ($/MWh)
$31.00
$29.90
$31.04
Mid-Atlantic: PJM-W ATC prices ($/MWh)
$37.76
$37.26
$38.53
ERCOT-N ATC Spark Spread ($/MWh)
HSC Gas, 7.2HR, $2.50 VOM
$4.93
$7.90
$8.76
New York: NY Zone A ($/MWh)
$36.82
$35.40
$36.22
New England: Mass Hub ATC Spark Spread($/MWh)
ALQN Gas, 7.5HR, $0.50 VOM
$3.03
$4.59
$3.02
2013 2Q Earnings Release Slides
13
(1)
Gross margin rounded to nearest $50M.
(2)
Gross margin does not include revenue related to decommissioning, gross
receipts tax, Exelon Nuclear Partners and entities consolidated solely
as a result of the application of FIN 46R.
(3)
Includes CENG Joint Venture.
(4)
Mark to Market of Hedges assumes mid-point of hedge percentages.
(5)
Any changes to new business estimates for our non-power business are
presented as revenue less costs of sales.
(6)
Based on June 30, 2013 market conditions. |
 14
ExGen Disclosures
Generation and Hedges
2013
2014
2015
Exp. Gen (GWh)
(1)
215,500
214,400
207,600
Midwest
97,200
97,100
96,400
Mid-Atlantic
(2)
74,200
72,600
69,900
ERCOT
14,600
17,800
18,500
New York
(2)
14,100
12,100
9,300
New England
15,400
14,800
13,500
% of Expected Generation Hedged
(3)
96-99%
78-81%
41-44%
Midwest
95-98%
77-80%
38-41%
Mid-Atlantic
(2)
97-100%
82-85%
48-51%
ERCOT
102-105%
77-80%
34-37%
New York
(2)
96-99%
81-84%
45-48%
New England
97-100%
71-74%
23-26%
Effective Realized Energy Price ($/MWh)
(4)
Midwest
$37.00
$34.00
$34.00
Mid-Atlantic
(2)
$49.00
$46.00
$46.50
ERCOT
(5)
$11.50
$9.00
$7.50
New York
(2)
$32.00
$37.00
$44.00
New England
(5)
$5.50
$3.50
$3.50
2013 2Q Earnings Release Slides
(1) Expected generation represents the amount of energy estimated to be
generated or purchased through owned or contracted for capacity. Expected generation is based upon a
simulated dispatch model that makes assumptions regarding future market
conditions, which are calibrated to market quotes for power, fuel, load following products, and options.
Expected generation assumes 12 refueling outages in 2013 and 14 refueling
outages in 2014 and 2015 at Exelon-operated nuclear plants, Salem and CENG. Expected generation
assumes capacity factors of 93.8%, 93.8%, and 93.3% in 2013, 2014 and
2015 at Exelon-operated nuclear plants excluding Salem and CENG. These estimates of expected generation
in 2014 and 2015 do not represent guidance or a forecast of future results as
Exelon has not completed its planning or optimization processes for those years. (2) Includes CENG Joint
Venture. (3) Percent of expected generation hedged is the amount of equivalent
sales divided by expected generation. Includes all hedging products, such as wholesale and retail sales
of power, options and swaps. Uses expected value on options. (4) Effective
realized energy price is representative of an all-in hedged price, on a per MWh basis, at which expected
generation has been hedged. It is developed by considering the energy
revenues and costs associated with our hedges and by considering the fossil fuel that has been purchased to
lock in margin. It excludes uranium costs and RPM capacity revenue, but
includes the mark-to-market value of capacity contracted at prices other than RPM clearing prices including
our load obligations. It can be compared with the reference prices used
to calculate open gross margin in order to determine the mark-to-market value of Exelon Generation's energy
hedges. (5) Spark spreads shown for ERCOT and New England.
2013 2Q Earnings Release Slides |
 15
ExGen Hedged Gross Margin Sensitivities
Gross Margin Sensitivities (With Existing Hedges)
(1, 2)
2013
2014
2015
Henry Hub Natural Gas ($/Mmbtu)
$35
$190
$430
$(20)
$(130)
$(370)
NiHub ATC Energy Price
$10
$130
$355
$(5)
$(125)
$(350)
PJM-W ATC Energy Price
$0
$75
$205
$5
$(75)
$(200)
NYPP Zone A ATC Energy Price
$0
$10
$25
$0
$(10)
$(25)
Nuclear Capacity Factor
(3)
+/-
1%
+/-
$20
+/-
$40
+/-
$45
2013 2Q Earnings Release Slides
(1) Based on June 30, 2013 market conditions and hedged position. Gas price
sensitivities are based on an assumed gas-power relationship derived from an internal model that is updated
periodically. Power prices sensitivities are derived by adjusting the power
price assumption while keeping all other prices inputs constant. Due to correlation of the various assumptions, the
hedged gross margin impact calculated by aggregating individual sensitivities
may not be equal to the hedged gross margin impact calculated when correlations between the various
assumptions are also considered. (2) Sensitivities based on commodity
exposure which includes open generation and all committed transactions. (3) Includes CENG Joint Venture.
+ $1/Mmbtu
-
$1/Mmbtu
+ $5/MWh
-
$5/MWh
+ $5/MWh
-
$5/MWh
+ $5/MWh
-
$5/MWh
2013 2Q Earnings Release Slides |
 16
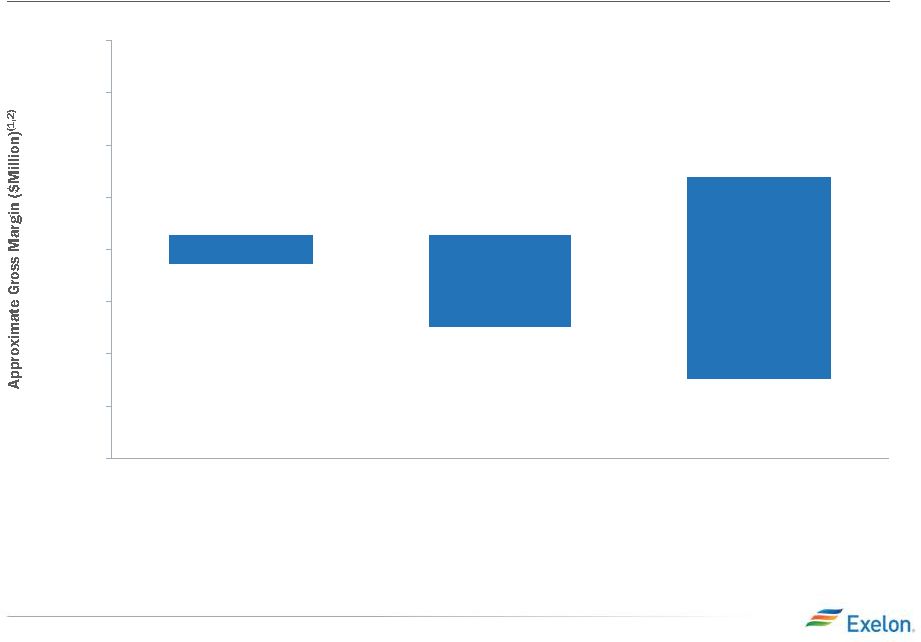
Exelon Generation Hedged Gross Margin Upside/Risk
$6,000
$6,500
$7,000
$7,500
$8,000
$8,500
$9,000
$9,500
$10,000
2015
$8,700
2014
$8,150
2013
$8,150
$7,850
$7,250
$6,750
(1) Represents an approximate range of expected gross margin, taking into
account hedges in place, between the 5th and 95th percent confidence levels assuming all unhedged supply is sold
into the spot market. Approximate gross margin ranges are based upon an
internal simulation model and are subject to change based upon market inputs, future transactions and potential
modeling changes. These ranges of approximate gross margin in 2014 and 2015 do
not represent earnings guidance or a forecast of future results as Exelon has not completed its planning or
optimization processes for those years. The price distributions that generate
this range are calibrated to market quotes for power, fuel, load following products, and options as of June 30, 2013
(2) Gross Margin Upside/Risk based on commodity exposure which includes open
generation and all committed transactions.
2013 2Q Earnings Release Slides |
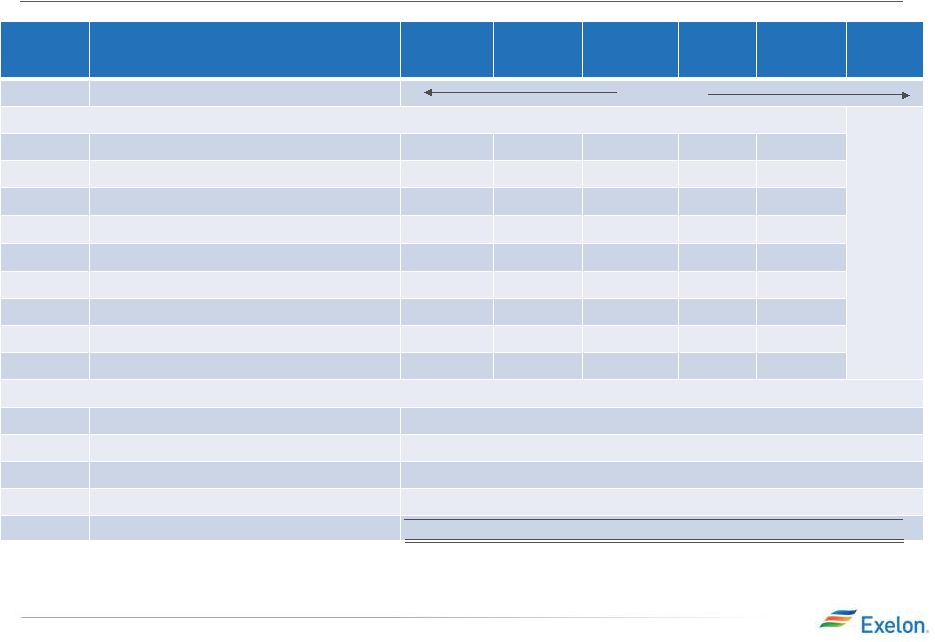 17
Illustrative Example of Modeling Exelon
Generation
2014 Gross Margin
Row
Item
Midwest
Mid-
Atlantic
ERCOT
New York
New
England
South,
West &
Canada
(A)
Start with fleet-wide open gross margin
$5.70 billion
(B)
Expected Generation (TWh)
97.1
72.6
17.8
12.1
14.8
(C)
Hedge % (assuming mid-point of range)
78.5%
83.5%
78.5%
82.5%
72.5%
(D=B*C)
Hedged Volume (TWh)
76.2
60.6
14.0
10.0
10.7
(E)
Effective Realized Energy Price ($/MWh)
$34.00
$46.00
$9.00
$37.00
$3.50
(F)
Reference Price ($/MWh)
$29.90
$37.26
$7.90
$35.40
$4.59
(G=E-F)
Difference ($/MWh)
$4.10
$8.74
$1.10
$1.60
$(1.09)
(H=D*G)
Mark-to-market
value
of
hedges
($
million)
(1)
$315 million
$530 million
$15 million
$15 million
$(10) million
(I=A+H)
Hedged Gross Margin ($ million)
$6,550 million
(J)
Power New Business / To Go ($ million)
$550 million
(K)
Non-Power Margins Executed ($ million)
$150 million
(L)
Non-
Power New Business / To Go ($ million)
$450 million
(N=I+J+K+L)
Total Gross Margin
$7,700 million
(1) Mark-to-market rounded to the nearest $5 million.
2013 2Q Earnings Release Slides |
 18
Additional Disclosures
2013 2Q Earnings Release Slides |
 BGE
2013 load growth largely
driven by the idling of RG Steel
and
energy efficiency partially
offset by improving economic
conditions
19
Exelon Utilities Weather-Normalized Load
2013E
0.4%
0.2%
2012
0.2%
-0.6%
-0.1%
Large C&I
Small C&I
Residential
All Customers
Notes: Data is not adjusted for leap year. Source
of 2013 economic outlook data is Global Insight (May 2013). Assumes 2013 GDP of 1.8% and U.S unemployment of 7.6%.
ComEd has the ROE collar as part of the distribution formula rate and BGE is
decoupled which mitigates the load risk. QTD and YTD actual data can be found in earnings release tables.
BGE amounts have been adjusted for unbilled / true-up load from prior
quarters. ComEd
2013 load growth is similar to
2012, driven by improving
economic conditions & positive
residential load growth partially
offset by energy efficiency
2013E
1.7%
0.5%
2012
-2.3%
-2.2%
PECO
2013 load growth driven by oil
refinery and economic
conditions & customer growth,
offset by energy efficiency
2013E
-2.5%
-1.0%
2012
-2.8%
-1.5%
Chicago GMP
1.7%
Chicago Unemployment
9.4%
Philadelphia GMP
1.7%
Philadelphia Unemployment
7.9%
Baltimore GMP
1.8%
Baltimore Unemployment
7.3%
2013 2Q Earnings Release Slides
0.8%
-0.3%
-0.6%
0.4%
-1.7%
-2.7%
-2.3%
-2.1%
-0.2%
0.4%
0.9% |
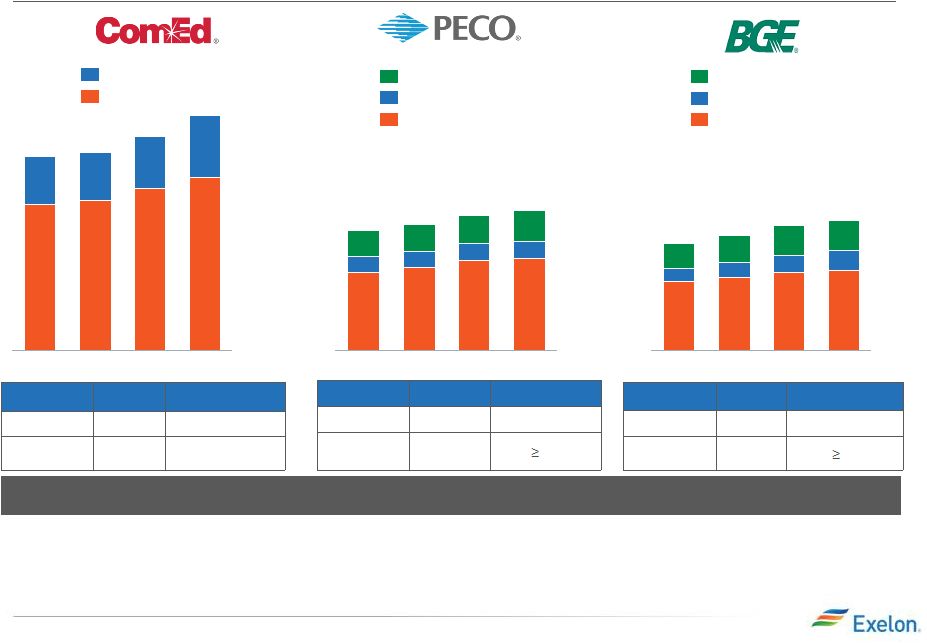 20
Exelon Utilities Rate Base and ROE Targets
2013E
Long-Term Target
Equity Ratio
~50%
~53%
(3)
Earned ROE
7-8%
2013E
Long-Term Target
Equity Ratio
~46%
~53%
(1)
Earned ROE
8 -9%
Continued investment in Utilities will provide stable earnings growth
Based on 30-yr.
US Treasury
(2)
($ in billions)
$1.1
$0.7
$1.1
2012
$5.1
$3.3
$0.7
$5.9
$3.9
2015E
$1.3
$0.7
$1.2
2013E
$5.3
$3.5
2014E
$5.7
$3.8
$0.7
Electric Distribution
Electric Transmission
Gas Delivery
$2.1
$7.6
$2.7
2014E
$8.7
$7.1
$2.3
2013E
$9.4
$6.6
$10.3
$6.4
2015E
$8.5
$2.1
2012
Transmission
Distribution
$5.1
$3.2
$0.6
$4.4
$0.7
$1.1
$1.2
2013E
$3.0
2014E
$0.6
$1.0
$2.8
$4.7
2012
$5.3
2015E
$1.2
$3.3
$0.8
Electric Distribution
Gas Delivery
Electric Transmission
10%
All rate base amounts are presented as year-end rate base.
(1)
Exelon Utilities sets first quartile goals. The timing of the achievement of
each goal will depend upon specific jurisdictional nuances to each
company and how they impact the desired structure. The current
distribution equity ratio for ComEd is ~46% and ComEd will look to grow
this ratio over time. Currently, ComEd's Transmission capital ratio is
limited to 55%.
(2)
Earned ROE will reflect the weighted average of 11.5% allowed transmission ROE
and distribution ROE resulting from 30-year Treasury plus 580 basis
points for each calendar year.
(3)
Per MDPSC merger commitment, BGE is precluded from paying dividends through
2014. Per MDPSC orders, BGE cannot pay out a dividend to its parent
company if said dividend would cause BGE’s equity ratio to fall
below 48% or if BGE is downgraded by two of three rating
agencies. 2013E
Long-Term Target
Equity Ratio
~55%
~53%
Earned ROE
11.5 –
12.5%
10%
2013 2Q Earnings Release Slides |
 2013 2Q Earnings Release Slides
21
ComEd May 2013 Distribution Formula Rate Updated Filing
Note: Disallowance of any items in the 2013 distribution formula rate
filing could impact 2013 earnings in the form of a regulatory asset adjustment.
Docket #
13-0318
Filing Year
Reconciliation Year
Common Equity Ratio
ROE
Rate Base
Revenue Requirement
Increase
Timeline
The 2013 distribution formula rate filing establishes the net revenue
requirement used to set the rates that will take effect in January 2014 after the
ICC’s review. The filing was updated to reflect the impact of Senate
Bill 9. There are two components to the annual distribution formula rate filing:
Filing Year: Based on prior year costs (2012) and current year
(2013) projected plant additions.
Annual Reconciliation: For the prior calendar year (2012), this amount
reconciles the revenue requirement reflected in rates during the prior year (2012)
in effect to the actual costs for that year. The annual reconciliation impacts
cash flow in the following year (2014) but the earnings impact has been
recorded in the prior year (2012) as a regulatory asset. 04/29/13
Filing Date
240 Day Proceeding
ICC order by year end; rates effective January 2014 2012 Calendar Year
Actual Costs and 2013 Projected Net Plant Additions are used to set the
rates for calendar year 2014. Rates currently in effect (docket 12-0321)
for calendar year 2013 were based on 2011 actual costs and 2012 projected
net plant additions. Reconciles
Revenue
Requirement
reflected
in
rates
during
2012
to
2012
Actual
Costs
Incurred.
Revenue
Requirement for 2012 is based on dockets 10-0467, 11-0721 May Order
and 11-0721 October Re-hearing Order. ~ 45%
for both the filing and reconciliation year
8.27%
for both the filing and reconciliation year (2012 30-yr Treasury Yield
of 2.92% + 580 basis point risk premium). For 2013 and 2014, the
actual allowed ROE reflected in net income will ultimately be based on the average of the
30-year Treasury Yield during the respective years plus 580 basis point
spread. ~7%
For the both the filing and reconciliation Year
$6,717 million
$359M
capital additions). 2013 and 2014 earnings will reflect 2013 and 2014
year-end rate base respectively. -
Reconciliation year (represents year-end ate base for 2012)
$6,390 million
($165M is due to the 2012 reconciliation, $194M relates to the filing year). The
2012 reconciliation impact on net income was recorded in 2012 as a
regulatory asset. This increase also reflects the decrease in 2013 rates as
a result of Senate Bill 9.
Filing year (represents projected year-end rate base using 2012 actual plus
2013 projected Requested Rate of Return Given the retroactive
ratemaking provision in the EIMA legislation, ComEd net income during the
year will be based on actual costs with a regulatory asset/liability recorded to
reflect any under/over recovery reflected in rates. Revenue
Requirement in rate filings impacts cash flow. |
 22
BGE Rate Case
Rate Case Request
Electric
Gas
Docket #
9326
Test Year
August 2012 –
July 2013
Common Equity Ratio
49.8%
Requested Returns
ROE: 10.5%; ROR: 7.75%
ROE: 10.35%; ROR: 7.67%
Rate Base (adjusted)
$2.8B
$1.1B
Revenue Requirement Increase
$101.5M
$29.7M
Proposed Distribution Increase as
% of overall bill
3%
4%
Timeline
•5/17/13: BGE filed application with the MDPSC seeking increases in gas
& electric distribution base rates •8/5/13: Staff/Intervenors
file direct testimony •8/23/13: Update 8 months actual/4 month
estimated test period data with actuals for last 4 months (March
- July 2013)
•9/17/13: BGE and staff/intervenors file rebuttal testimony
•10/3/13: Staff/Intervenors and BGE file surrebuttal testimony
•10/15/13 –
10/29/13: Hearings
•11/12/13: Initial Briefs
•11/22/13: Reply Briefs
•12/13/13: Final Order
•New rates are in effect shortly after the final order
2013 2Q Earnings Release Slides |
 2Q GAAP EPS Reconciliation
Three
Months
Ended
June
30,
2013
ExGen
ComEd
PECO
BGE
Other
Exelon
2013 Adjusted (non-GAAP) Operating Earnings (Loss) Per Share
$0.32
$0.11
$0.09
$0.03
$(0.01)
$0.53
Mark-to-market impact of economic hedging activities
0.30
-
-
-
(0.01)
0.30
Unrealized gains related to NDT fund investments
(0.03)
-
-
-
-
(0.03)
Constellation merger and integration costs
(0.01)
-
(0.00)
(0.00)
-
(0.02)
Amortization of commodity contract intangibles
(0.13)
-
-
-
-
(0.13)
Amortization of the fair value of certain debt
0.00
-
-
-
-
0.00
Long-lived asset impairment
(0.07)
-
-
-
(0.01)
(0.08)
2Q 2013 GAAP Earnings (Loss) Per Share
$0.38
$0.11
$0.08
$0.03
$(0.03)
$0.57
NOTE: All amounts shown are per Exelon share and represent contributions
to Exelon's EPS. Amounts may not add due to rounding. Three
Months
Ended
June
30,
2012
ExGen
ComEd
PECO
BGE
Other
Exelon
2012 Adjusted (non-GAAP) Operating Earnings (Loss) Per Share
$0.47
$0.05
$0.10
$0.02
$(0.02)
$0.61
Mark-to-market impact of economic hedging activities
0.14
-
-
-
0.00
0.15
Unrealized losses related to NDT fund investments
(0.02)
-
-
-
-
(0.02)
Plant retirements and divestitures
0.00
-
-
-
-
0.00
Constellation merger and integration costs
(0.07)
-
(0.00)
(0.00)
(0.01)
(0.08)
Amortization of commodity contract intangibles
(0.33)
-
-
-
-
(0.33)
Amortization of the fair value of certain debt
0.00
-
-
-
-
0.00
Non-cash remeasurement of deferred income taxes
-
-
-
-
0.00
0.00
2Q 2012 GAAP Earnings (Loss) Per Share
$0.19
$0.05
$0.09
$0.01
$(0.02)
$0.33
2013 2Q Earnings Release Slides
23 |
 2Q YTD GAAP EPS Reconciliation
Six Months Ended June 30, 2013
ExGen
ComEd
PECO
BGE
Other
Exelon
2013 Adjusted (non-GAAP) Operating Earnings (Loss) Per Share
$0.71
$0.22
$0.23
$0.11
$(0.03)
$1.23
Mark-to-market impact of economic hedging activities
0.02
-
-
-
0.00
0.02
Unrealized gains related to NDT fund investments
0.02
-
-
-
-
0.02
Plant retirements and divestitures
0.02
-
-
-
-
0.02
Constellation merger and integration costs
(0.05)
-
(0.00)
0.00
(0.00)
(0.05)
Amortization of commodity contract intangibles
(0.28)
-
-
-
-
(0.27)
Amortization of the fair value of certain debt
0.01
-
-
-
-
0.01
Remeasurement of like kind exchange tax position
-
(0.20)
-
-
(0.11)
(0.31)
Long lived asset impairment
(0.09)
-
-
-
(0.01)
(0.10)
YTD 2013 GAAP Earnings (Loss) Per Share
$0.36
$0.02
$0.23
$0.12
$(0.15)
$0.57
Six Months Ended June 30, 2012
ExGen
ComEd
PECO
BGE
Other
Exelon
2012 Adjusted (non-GAAP) Operating Earnings (Loss) Per Share
$1.03
$0.17
$0.23
$0.04
$(0.03)
$1.44
Mark-to-market impact of economic hedging activities
0.20
-
-
-
0.01
0.21
Unrealized gains related to NDT fund investments
0.02
-
-
-
-
0.02
Plant retirements and divestitures
(0.01)
-
-
-
-
(0.01)
Constellation merger and integration costs
(0.13)
(0.00)
(0.01)
(0.00)
(0.09)
(0.23)
Maryland commitments
(0.03)
-
(0.11)
(0.16)
(0.29)
Amortization of commodity contract intangibles
(0.46)
-
-
-
-
(0.46)
Amortization of the fair value of certain debt
0.00
-
-
-
-
0.00
FERC Settlement
(0.22)
-
-
-
-
(0.22)
Non-cash remeasurement of deferred income taxes
0.02
-
-
-
0.14
0.16
Other acquisition costs
(0.00)
-
-
-
-
(0.00)
YTD 2012 GAAP Earnings (Loss) Per Share
$0.43
$0.17
$0.22
(0.07)
$(0.13)
$0.62
NOTE: All amounts shown are per Exelon share and represent contributions
to Exelon's EPS. Amounts may not add due to rounding. 2013 2Q
Earnings Release Slides 24 |
 GAAP to Operating Adjustments
2013 2Q Earnings Release Slides
•
Exelon’s 2013 adjusted (non-GAAP) operating earnings excludes the
earnings effects of the following: Mark-to-market adjustments from
economic hedging activities Unrealized gains and losses from NDT fund
investments to the extent not offset by contractual accounting as
described in the notes to the consolidated financial statements
Financial impacts associated with the sale or retirement of generating
stations Certain costs incurred associated with the Constellation merger
and integration initiatives Non-cash amortization of intangible
assets, net, related to commodity contracts recorded at fair value at
the merger date
Non-cash amortization of certain debt recorded at fair value at the merger
date, which was retired in the second quarter of 2013
Non-cash charge to earnings resulting from the remeasurement of
Exelon’s like-kind exchange tax position
Non-cash charge to earnings related to the cancellation of previously
capitalized nuclear uprate projects and the impairment of an investment
in a long term lease. Other unusual items
25 |