Attached files
| file | filename |
|---|---|
| 8-K - 8-K - LegacyTexas Financial Group, Inc. | a8kcoverq22013investorconf.htm |

1 NASDAQ: VPFG Kevin Hanigan – President and Chief Executive Officer Patti McKee – Executive Vice President and Chief Financial Officer Exhibit 99.1

2 Safe Harbor Statement When used in filings by the Company with the Securities and Exchange Commission (the “SEC”) in the Company’s press releases or other public or shareholder communications, and in oral statements made with the approval of an authorized executive officer, the words or phrases “will likely result,” “are expected to,” “will continue,” “is anticipated,” “estimate,” “project,” “intends” or similar expressions are intended to identify “forward- looking statements” within the meaning of the Private Securities Litigation Reform Act of 1995. Such statements are subject to certain risks and uncertainties, including, among other things: changes in economic conditions; legislative changes; changes in policies by regulatory agencies; fluctuations in interest rates; the risks of lending and investing activities, including changes in the level and direction of loan delinquencies and write-offs and changes in estimates of the adequacy of the allowance for loan losses; the Company’s ability to access cost- effective funding; fluctuations in real estate values and both residential and commercial real estate market conditions; demand for loans and deposits in the Company’s market area; the industry-wide decline in mortgage production; competition; changes in management’s business strategies; our ability to successfully integrate any assets, liabilities, customers, systems and management personnel we have acquired or may acquire into our operations and our ability to realize related revenue synergies and cost savings within expected time frames and any goodwill charges related thereto; and other factors set forth under Risk Factors in the Company’s Form 10-K that could cause actual results to differ materially from historical earnings and those presently anticipated or projected. The factors listed above could materially affect the Company’s financial performance and could cause the Company’s actual results for future periods to differ materially from any opinions or statements expressed with respect to future periods in any current statements. The Company does not undertake— and specifically declines any obligation—to publicly release the result of any revisions that may be made to any forward-looking statements to reflect events or circumstances occurring after the date of such statements.

3 Corporate & Geographic Overview Total Assets: $3.59 billion1 Total Net Loans: $2.72 billion1 Total Deposits: $2.19 billion1 31 Community Bank Locations Over 60 years in Texas market #1 in deposit market share in the affluent Collin County market of those banks based in Texas 2 Ranked #4 in deposit market share among Texas-based community banks in DFW Metroplex2 Ranked #20 Fastest Growing Public Company in North Dallas3 Source: VPFG 10-Q for Q2 2013, Company documents 1 At June 30, 2013 2 FDIC market share data as of June 2012, most recent data available 3 As reported in the Dallas Business Journal, June 28, 2013

4 Attractive Demographics: Strengthening Dallas Franchise Source: SNL Financial and the FDIC ViewPoint Bank has a wealthy depositor base and compares favorably to Texas peers. Rank Institution Branches June 30, 2012 Deposits In Market ($mm) June 30, 2012 Market share (%) 1 ViewPoint Bank, National Association 12 1,243 8.5 2 LegacyTexas Bank 9 1,049 7.1 3 Independent Bank 10 467 3.2 4 The American National Bank of Texas 4 324 2.2 5 Comerica Bank 8 274 1.9 6 North Dallas Bank and Trust Co. 2 268 1.8 7 Benchmark Bank 1 219 1.5 8 Texas Capital Bank, National Association 1 212 1.4 1 Includes only banks and thrifts headquartered in Texas Deposit Market share: Collin County 1 ViewPoint Bank is ranked #1 in deposit market share in Collin County of banks based in Texas. Texas Banks Ranked by Projected Income of Depositor Base Company (ranked by 2012 HH) Ticker City Median household income of depositor base - 2012 Median household income of depositor base - projected 2017 ViewPoint Financial Group, Inc. VPFG Plano $64,100 $70,544 MetroCorp Bancshares, Inc. MCBI Houston $55,607 $63,488 OmniAmerican Bancorp, Inc. OABC Fort Worth $54,181 $61,167 Comerica Incorporated CMA Dallas $53,996 $62,054 Cullen/Frost Bankers, Inc. CFR San Antonio $48,961 $56,683 Texas Capital Bancshares, Inc. TCBI Dallas $48,252 $56,230 Prosperity Bancshares, Inc. PB Houston $46,740 $54,268 First Financial Bankshares, Inc. FFIN Abilene $43,078 $50,559 Southside Bancshares, Inc. SBSI Tyler $42,982 $52,403 Guaranty Bancshares, Inc. GNTY Mount Pleasant $38,474 $44,678 International Bancshares Corporation IBOC Laredo $36,471 $42,506

5 Capitalize on a position of balance sheet strength Improve and diversify earning asset mix Migrate from low yielding securities to higher yielding loans Transition to a balanced loan book, leveraging C&I expertise Grow organically, leveraging a strong local economy Achieve greater community banking market share through high-touch service and strategic redeployment of key products Deploy capital opportunistically Continued organic loan growth and selective branching Consistent growth of dividends and opportunistic share repurchase Disciplined M&A Business Strategy

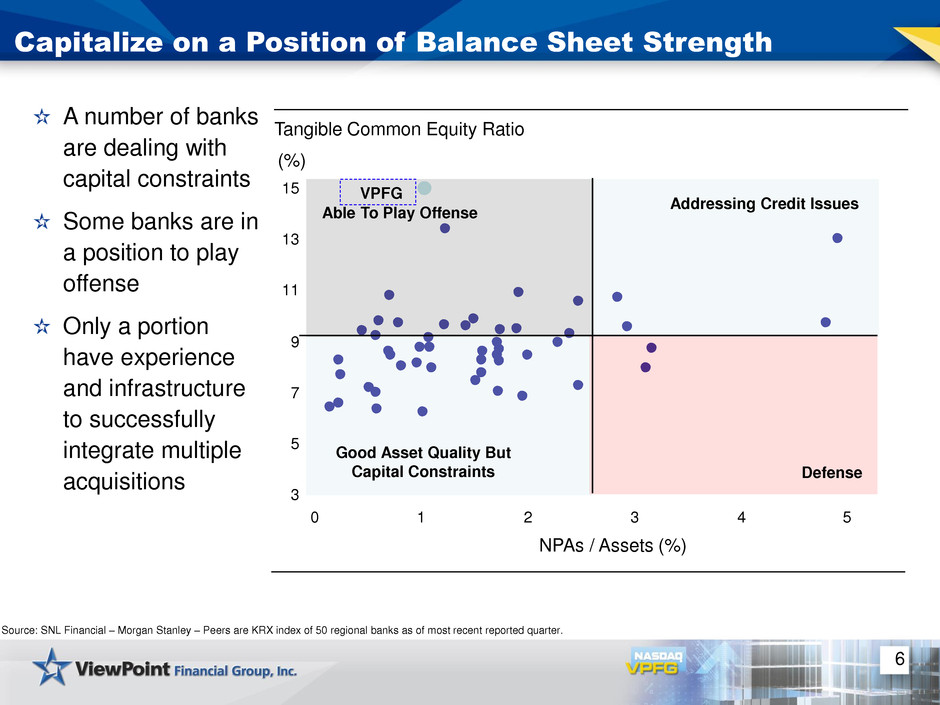
3 5 7 9 11 13 15 0 1 2 3 4 5 Tangible Common Equity Ratio A number of banks are dealing with capital constraints Some banks are in a position to play offense Only a portion have experience and infrastructure to successfully integrate multiple acquisitions (%) NPAs / Assets (%) Able To Play Offense VPFG Addressing Credit Issues Good Asset Quality But Capital Constraints Defense Capitalize on a Position of Balance Sheet Strength Source: SNL Financial – Morgan Stanley – Peers are KRX index of 50 regional banks as of most recent reported quarter. 6

7 Commercial Bank Transformation Update Source: VPFG 10-Q for Q2 2013, Company Documents Strategic actions Results Hire team of experienced commercial lenders Shift earning asset mix away from securities and consumer lending Build out C&I lending with a goal to transition to balanced loan book Continued emphasis on low-cost, core deposits Highlands acquisition accelerated transition to a commercial banking model; made 12 additional hires over past year Commercial portfolio now makes up 72% of loan portfolio, up from 29% in 2007; commercial income accounts for 49% of earning asset revenue up from 16% in 2007 C&I lending volumes increased to 17% of loan portfolio up from 1% in 2007 Quarterly cost of deposits declined from 1.42% at December 2010 to 0.45% at June 2013; non-interest-bearing commercial deposits increased to $248mm up from $37mm in 2007

Consumer RE 25% Comm. RE 55% C&I 17% Consumer 3% 1 Charter change from thrift to national bank on December 8, 2011 Source: SNL Financial, VPFG 10-Q for Q2 2013 Consumer RE 42% Comm. RE 48% C&I 6% Consumer 4% Total=$1,228.0mm 8 Commercial Bank Transformation Loans Held for Investment Composition December 31, 2007 Consumer RE 46% Comm. RE 28% C&I 1% Consumer 25% December 31, 2011 1 June 30, 2013 Total=$914.2mm Total=$1,835.2mm Continued progress in transitioning towards a balanced loan book

9 Commercial Bank Transformation 0% 10% 20% 30% 40% 50% 60% 70% 80% 90% 100% 2007 2008 2009 2010 2011 2012 YTD 2013 Earning Asset Revenue Mix LHS Commercial loans Consumer loans Securities & Cash Improving mix of earning asset revenue Commercial (CRE and C&I) interest income represents 49% of earning asset revenue, up from 16% in 2007 Source: VPFG 10-Q for Q2 2013, Company Documents Consumer loans includes consumer RE

$0 $50,000 $100,000 $150,000 $200,000 $250,000 $300,000 2007 2008 2009 2010 2011 2012 YTD 2013 Commercial Deposits – Non-interest-bearing (in thousands) $0 $50 $100 $150 $200 $250 $300 2007 2008 2009 2010 2011 2012 Jun-12 Jun-13 Treasury Management Fees Billed Analysis (in thousands) 10 Commercial Bank Transformation Significant growth in: Commercial deposits Treasury management fee income Source: VPFG 10-Q for Q2 2013, Company Documents Annual Year to Date

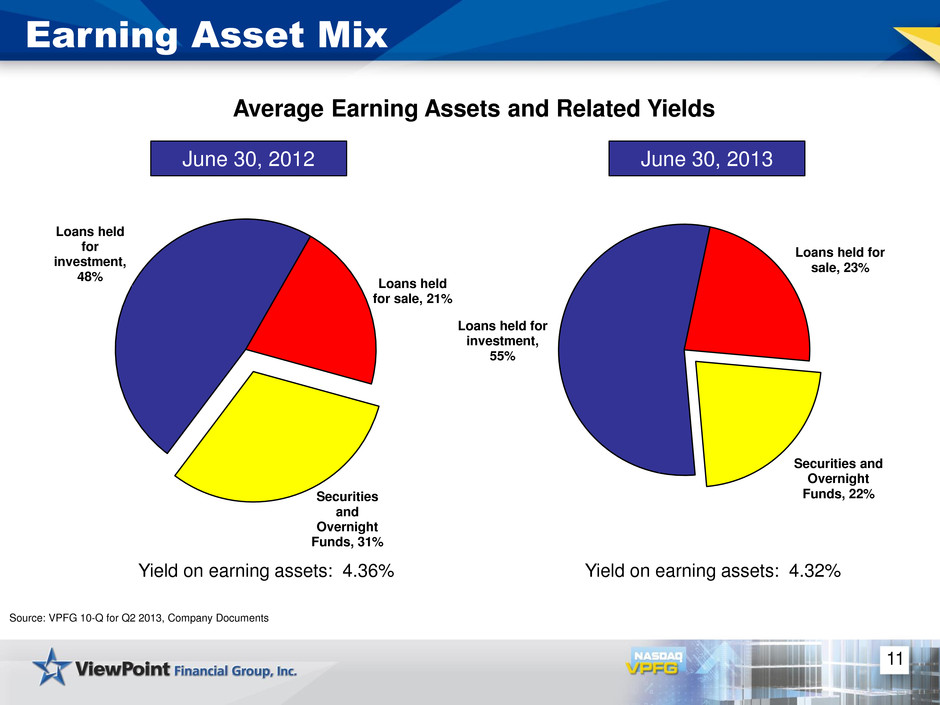
11 Earning Asset Mix Source: VPFG 10-Q for Q2 2013, Company Documents Loans held for investment, 48% Loans held for sale, 21% Securities and Overnight Funds, 31% Average Earning Assets and Related Yields June 30, 2012 June 30, 2013 Yield on earning assets: 4.36% Yield on earning assets: 4.32% Loans held for investment, 55% Loans held for sale, 23% Securities and Overnight Funds, 22%

12 Strong Loan Growth C&I Lending Growth ($ in millions) Source: VPFG 10-Q for Q2 2013; Company Documents $180.7 $226.4 $245.8 $271.6 $288.1 $17.0 $25.9 $32.7 $30.9 $25.0 25 75 125 175 225 275 325 2Q'12 3Q'12 4Q'12 1Q'13 2Q'13 C&I WHLOC $197.7 $252.3 $278.5 $302.5 $313.1 $760.6 $794.6 $839.9 $897.5 $1,004.7 600 650 700 750 800 850 900 950 1000 1050 2Q'12 3Q'12 4Q'12 1Q'13 2Q'13 CRE Lending Growth ($ in millions) C&I and CRE increased a combined 9.8% (linked quarter)

13 Warehouse Purchase Program Average balances increased $93 million, or 14%, from Q2 2012 to Q2 2013 Increased from 39 clients to 50 clients from Q2 2012 to Q2 2013 For Q2 2013 mix was 62% purchase and 38% refinance Yield of 3.87% for Q2 2013 $0 $100 $200 $300 $400 $500 $600 $700 $800 $900 $1,000 $282 $663 $756 (i n m ill io n s ) Average Warehouse Purchase Program Balances Source: VPFG 10-Q for Q2 2013; Company Documents

Agency MBS 50% Agency CMO 38% Muni 11% SBA 1% Investments by Type 14 Low Risk Investment Portfolio Mix 1 Excludes FHLB and FRB stock * Weighted average life of CMO is 2.24 years Source: VPFG 10-Q for 2Q 2013; Company Documents Liquidity - $19 million per month; 46.5% of portfolio is AFS Asset Liability Tool Short duration of 1.7 years Total portfolio of $619 million with a yield of 1.83% Investment Mix1 Hybrids 14% 15 year fixed 34% 20-30 year fixed 2% Fixed CMOs* 31% Floating 8% Fixed Muni avg 10 yr 11% Investments by Fixed and Adjustable

15 Mix of Deposits Source: VPFG 10-Q for Q2 2013, company documents Non-interest-bearing demand 10% Interest-bearing demand 22% Savings 7% Money Market 28% Time 33% Non-interest-bearing demand 18% Interest-bearing demand 21% Savings 9% Money Market 31% Time 21% Commercial transformation improving mix of deposits Non-interest-bearing mix increased from 10% to 18% Quarterly cost of deposits declined from 1.42% to 0.45% Deposit composition as of December 31, 2010 Deposit composition as of June 30, 2013

2008 2009 2010 2011 2012 Q1 2013 Q2 2013 Core Earnings per Share $0.20 $0.35 $0.60 $0.69 $1.04 $0.20 $0.22 $0.10 $0.20 $0.30 $0.40 $0.50 $0.60 $0.70 $0.80 $0.90 $1.00 $1.10 16 Core Earnings Per Share Growth CAGR: 51% See Appendix for reconciliation of core (non-GAAP) to GAAP net income Source: VPFG 10-Q for Q2 2013, Company Documents Share and per share information for periods prior to July 6, 2010, have been revised to reflect the 1.4:1 conversion ratio on publicly traded shares Core Net Income ($ in millions): $5.7 $9.7 $17.9 $22.2 $37.3 $7.7 $8.4 Annual Quarterly

17 Profitability Net Interest Margin Source: VPFG 10-Q for Q2 2013, Company Documents 1 Calculated by dividing total non-interest expense by net interest income plus non-interest income, excluding gain (loss) on assets, impairment of goodwill, amortization of intangible assets, gains (losses) from securities transactions and other non-recurring items. 2 See Appendix for reconciliation of core (non-GAAP) to GAAP net income Efficiency Ratio 1 Core ROAA2 Core ROAE2 2.85% 2.72% 2.80% 2.91% 3.61% 3.72% 2.50% 2.75% 3.00% 3.25% 3.50% 3.75% 4.00% 2008 2009 2010 2011 2012 Q2 2013 82.8% 78.4% 69.6% 67.8% 61.3% 60.5% 30.0% 45.0% 60.0% 75.0% 90.0% 2008 2009 2010 2011 2012 Q2 2013 0.30% 0.42% 0.66% 0.75% 1.10% 0.98% 0.00% 0.25% 0.50% 0.75% 1.00% 1.25% 1.50% 2008 2009 2010 2011 2012 Q2 2013 2.8% 4.9% 5.7% 5.5% 7.7% 6.3% 0.0% 2.0% 4.0% 6.0% 8.0% 2008 2009 2010 2011 2012 Q2 2013

18 Strong Credit Quality Net Charge Offs/ Average Loans NPAs / Loans + OREO (1) (1) Loans represent VPFG loans held for investment Source: Company documents; SNL Financial NPA/ Equity 1.39 1.83 2.06 1.72 1.33 1.00 1.50 2.00 2.50 3.00 3.50 4.00 4.50 2009Y 2010Y 2011Y 2012Y YTD 2013 VPFG Small Cap U.S. Bank Index Regional Southwest U.S. Bank Index 0.31 0.17 0.09 0.11 0.18 0.00 0.20 0.40 0.60 0.80 1.00 1.20 1.40 1.60 2009Y 2010Y 2011Y 2012Y YTD 2013 VPFG Small Cap U.S. Bank Index Regional Southwest U.S. Bank Index 7.58 5.12 6.25 5.59 4.57 0.00 10.00 20.00 30.00 40.00 50.00 60.00 70.00 2009Y 2010Y 2011Y 2012Y YTD 2013 ViewPoint Financial Group Inc Small Cap U.S. Bank Index Southwest U.S. Bank Index

12.2% 8.7% 8.6% 13.5% 12.7% 13.5% 14.1% 2007 2008 2009 2010 2011 2012 Q2 2013 15.8% 10.6% 14.4% 17.6% 24.4% 21.7% 18.0%* 2007 2008 2009 2010 2011 2012 Q2 2013 19 Continued organic loan growth Dividends Share repurchase; 83,800 repurchased in Q2 2013 Disciplined M&A * Reflects change in regulatory risk weighting for Warehouse Purchase Program loans from 50% to 100% Source: Company Documents at June 30, 2013 Robust Capital Tier 1 capital TCE / TA Capital deployment alternatives Well positioned to capitalize on balance sheet strength via a number of capital deployment alternatives

20 Closing Comments We are executing our plan to be a premier Texas community bank Strong core loan growth Credit quality continues to outpace our peers Well positioned for offense with robust capitalization and pristine asset quality

21 Questions?

22 Appendix The subsequent table presents non-GAAP reconciliations of the following calculations: TCE (Tangible Common Equity) to TCA (Tangible Common Assets) ratio TCE per share Core (non-GAAP) net income and earnings per share

23 Appendix TCE to TA, TCE per Share and Price to TBV at June 30, 2013 (Dollar amounts in thousands) Total GAAP equity $533,434 Less: goodwill (29,650) Less: identifiable intangible assets, net (1,446) Total tangible equity $502,338 Total GAAP assets $3,594,484 Less: goodwill (29,650) Less: identifiable intangible assets, net (1,446) Total tangible assets $3,563,388 GAAP Equity to Total Assets 14.84% TCE to TA 14.10% Shares outstanding at June 30, 2013 39,926,716 TCE per Share $12.58

24 Appendix Reconciliation of Core (non-GAAP) to GAAP Net Income and EPS (Dollar amounts in thousands except per share data) Three Months Ended 6/30/2013 3/31/2013 12/31/2012 9/30/2012 6/30/2012 3/31/2012 12/31/2011 9/30/2011 6/30/2011 GAAP net income $ 8,174 $ 8,058 $ 10,361 $ 11,316 $ 6,492 $ 7,072 $ 9,774 $ 5,143 $ 4,857 Highlands acquisition costs - - - 158 2,432 93 306 - - Costs relating to sale of VPM - - - (4) 88 - - - - One time payroll and severance costs 260 - - 238 525 14 - - - One time (gain) loss on assets - (511) (252) (70) (1,040) 9 (97) (17) (472) Goodwill impairment - - - - 532 - - - 176 (Gain) loss on sale of AFS securities - 115 - (584) (75) - (1,854) - - Core (non-GAAP) income $ 8,434 $ 7,662 $ 10,109 $ 11,054 $ 8,954 $ 7,188 $ 8,129 $ 5,126 $ 4,561 Core (non-GAAP) basic and diluted EPS $ 0.22 $ 0.20 $ 0.27 $ 0.30 $ 0.24 $ 0.23 $ 0.26 $ 0.16 $ 0.14 GAAP EPS $ 0.21 $ 0.21 $ 0.28 $ 0.30 $ 0.17 $ 0.22 $ 0.31 $ 0.16 $ 0.15 Average shares for basic EPS 37,545,050 37,529,793 37,460,539 37,362,535 37,116,322 31,545,748 31,617,219 32,468,640 32,445,527

25 Appendix Reconciliation of Core (non-GAAP) to GAAP Net Income and EPS (Dollar amounts in thousands except share and per share data) 2012 2011 2010 2009 2008 GAAP net income (loss) 35,241$ 26,328$ 17,799$ 2,670$ (3,315)$ Highlands acquisition costs 2,683 306 - - - Costs relating to sale of VPM 84 - - - - One time payroll and severance costs 777 - - - - One time (gain) loss on assets (1,353) (497) 135 526 (120) Goodwill impairment 532 176 - - - Gain on sale of AFS securities, net of tax (659) (4,074) - (1,569) - Impairment of collateralized debt obligations (all credit) - - - 8,082 9,114 Core (non-GAAP) income 37,305$ 22,239$ 17,934$ 9,709$ 5,679$ Core (non-GAAP) basic and diluted EPS 1.04$ 0.69$ 0.60$ 0.35$ 0.20$ Average shares for basic EPS 35,879,704 32,219,841 30,128,985 27,881,941 27,768,645 Year Ended December 31,
