Attached files
| file | filename |
|---|---|
| 8-K - 8-K - General Motors Financial Company, Inc. | d575870d8k.htm |
| EX-99.1 - EX-99.1 - General Motors Financial Company, Inc. | d575870dex991.htm |
 July 25, 2013
1
2
nd
Quarter 2013 Earnings Call
Exhibit 99.2 |
 2
Safe Harbor Statement
This presentation contains several “forward-looking statements”.
Forward-looking statements are those that use words such as
“believe”, “expect”, “anticipate”, “intend”, “plan”, “may”, “likely”,
“should”, “estimate”, “continue”,
“future” or other comparable expressions. These words indicate
future events and trends. Forward-looking statements are General Motors
Financial Company, Inc.’s (the “Company’s”) current
views with respect to future events and financial performance. These
forward-looking statements are subject to many assumptions, risks and uncertainties that
could cause actual results to differ significantly from historical results or from
those anticipated by the Company. The most significant risks are detailed
from time to time in the Company’s filings and reports with the
Securities and Exchange Commission, including the Company’s Report on Form
10-K
for
the
year
ended
December
31,
2012.
Such
risks
include
-
but
are
not
limited
to
-
our
ability
to close the acquisition of the remaining portions of Ally Financial Inc.’s
international operations and integrate those operations that we have yet to
acquire into our business successfully, changes in general economic and
business conditions, GM’s ability to sell new vehicles in the areas in which
we operate in North America, Europe and Latin America that we finance, interest
rate fluctuations, our financial condition and liquidity, as well as future
cash flows and earnings, competition, the effect, interpretation or
application of new or existing laws, regulations, court decisions and
accounting pronouncements, the availability of sources of financing, the level of
net credit losses, delinquencies and prepayments on the loans and leases we
originate, the prices at which used cars are sold in the wholesale auction
markets, changes in business strategy, including acquisitions and expansion
of product lines and credit risk appetite, and significant litigation. If one or more of these
risks of uncertainties materializes, or if underlying assumptions prove incorrect,
actual events or results may differ materially. It is advisable not to place
undue reliance on the Company’s forward- looking
statements.
The
Company
undertakes
no
obligation
to,
and
does
not,
publicly
update
or
revise any forward-looking statements, except as required by federal securities
laws, whether as a result of new information, future events or otherwise.
|
 GM
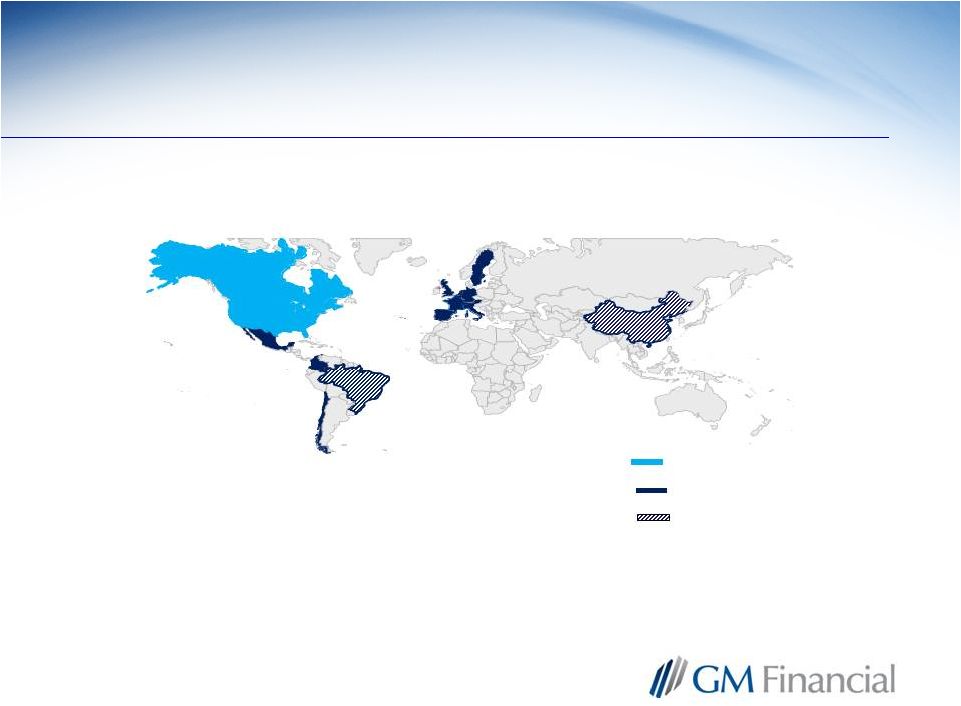
Financial Operations 3
Provide a full spectrum of financing solutions for GM dealers with a focus
at June 30, 2013
Existing markets
Acquired markets
Markets pending close
on specific market segments that are at times underserved
|
 Key
Metrics – June 2013 Quarter
4
($MM)
North
America
1
International
2
Total Co.
Earnings Before Tax
$213
$43
$264
(3)
Ending Earning Assets
$15,198
$11,035
$26,233
Total Originations
(Loan & Lease)
$2,185
$1,117
$3,302
GM as a % of Total Originations
58.8%
86.0%
68.0%
Annualized Net Credit Loss as a % of Avg.
Consumer Finance Receivables
2.1%
0.3%
1.4%
1.
United States and Canada
2.
Beginning April 1, 2013, Germany, the United Kingdom, Italy, Sweden, Switzerland,
Austria, Belgium, the Netherlands, Chile, Colombia, Mexico, Spain,
Greece and beginning June 1, 2013, France and Portugal
3.
Reflects net impact of intercompany allocations |
 North
America – GM and GMF Penetration Statistics
5
GM
Industry Average
(excluding GM)
Sep-10
Jun-13
Sep-10
Jun-13
Sales Penetrations
U.S. Subprime Loans
4.8%
8.6%
4.6%
6.4%
U.S. Leases
8.6%
20.0%
20.5%
24.3%
Canada Leases
2.1%
9.2%
13.8%
21.2%
GM / GMF Linkage
GM as % of GMF Loan and Lease Originations
(GM New / GMF Consumer Loan & Lease)
15.7%
58.8%
GMF as % of GM U.S. Subprime
27.6%
33.9%
GMF as % of GM U.S. Lease
(1)
--
21.0%
GMF wholesale dealer penetration
(1)
--
4.0%
(1) GM Financial did not offer a lease or commercial lending product when acquired
by GM. The lease product was launched in the U.S. and Canada in Q4 2010 and Q2 2011,
respectively. Commercial lending was launched in the U.S. and Canada in Q2
2012 and Q1 2013, respectively. |
 6
North America –
Loan Origination Volume
•
GM Financial and Ally have a dominant share of less than prime lending for new
vehicles sold in GM dealerships •
Market share leaders in the subprime used auto finance space remain consistent (GM
Financial, Wells Fargo, Capital One, and Santander Consumer USA)
–
Capital flowing into the space causing increased competitive conditions as some
lenders seek volume –
Competition
is
driving
extended
loan
terms,
higher
loan
to
value
and
reduced
pricing
in
the
market
$0
$200
$400
$600
$800
$1,000
$1,200
$1,400
$1,600
Jun
-12
Sep-12
Dec-12
Mar-13
Jun
-13
Quarterly
($MM)
Loans originated
on new vehicles
by GM dealers
Loans originated
on used vehicles
by GM dealers
Loans originated
on vehicles by
Non-GM dealers
$1,489
$1,478
$1,216
$1,359
$1,351 |
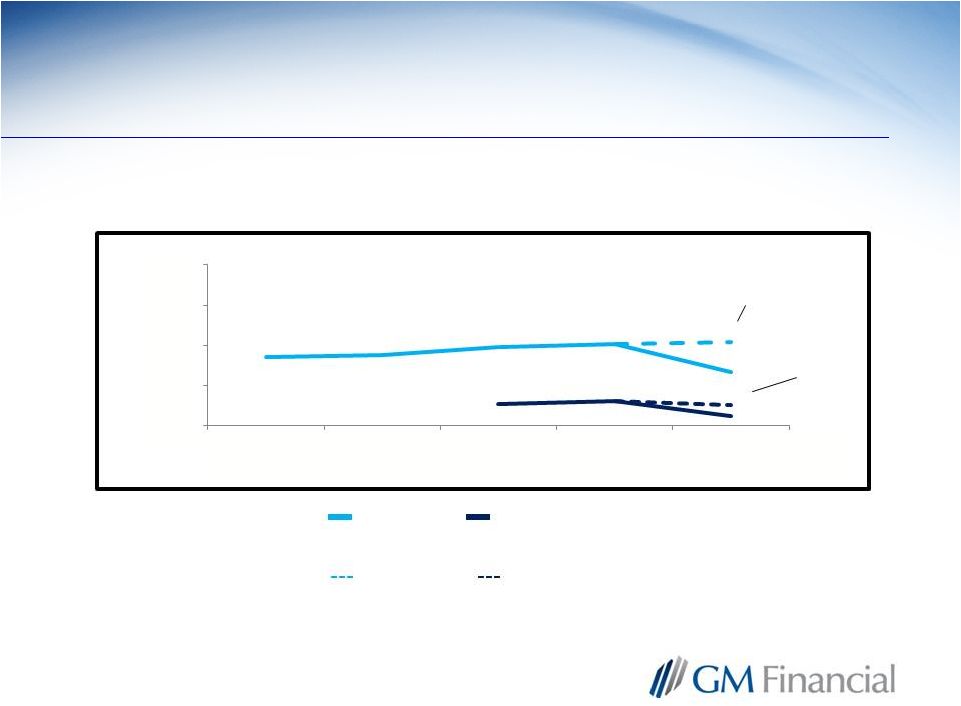
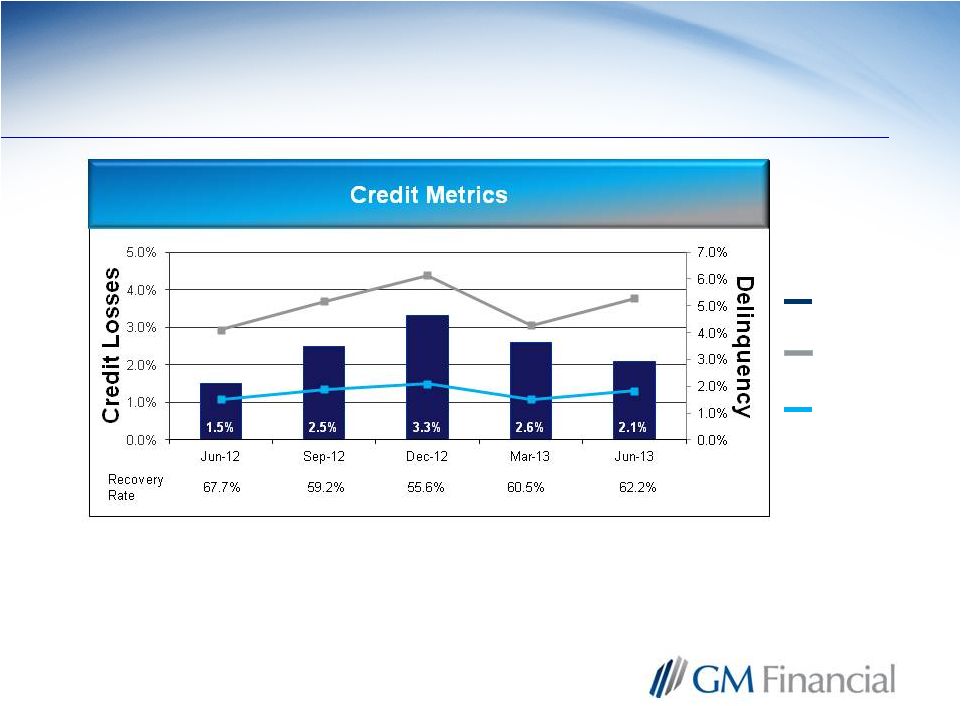 North
America – Consumer Loan Credit Performance
7
NA Annualized
quarterly net credit
losses
NA 31-60 day
delinquency
NA 61+ day
delinquency
•
Credit metrics impacted by seasonality and normalizing of the
credit environment |
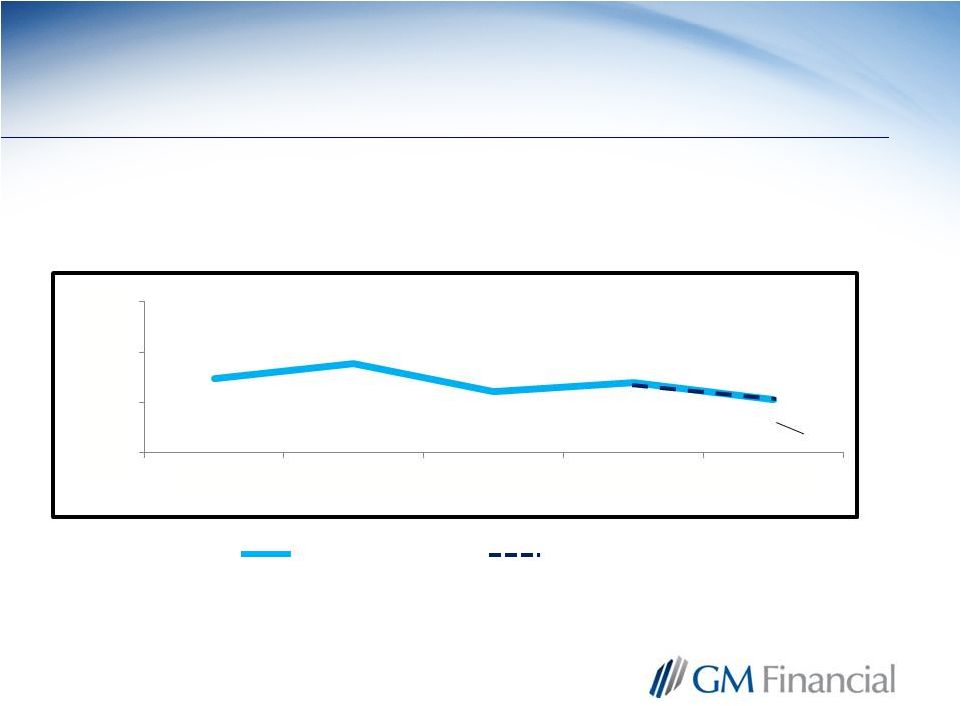
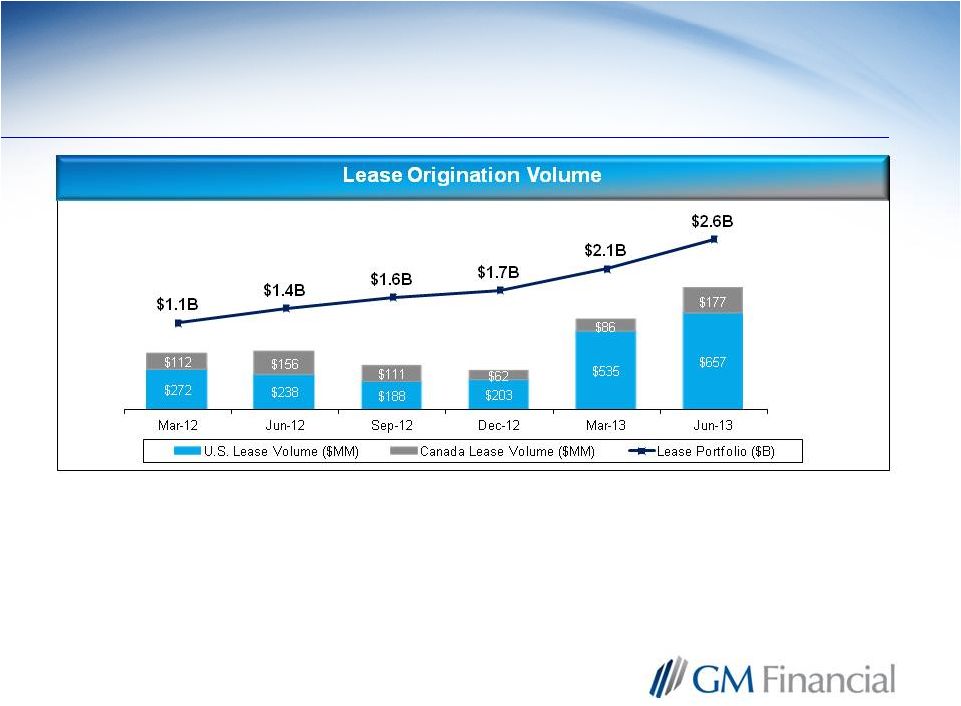 North
America – Lease Originations
8
•
Continued growth of the lease product in both the U.S. and Canada
|
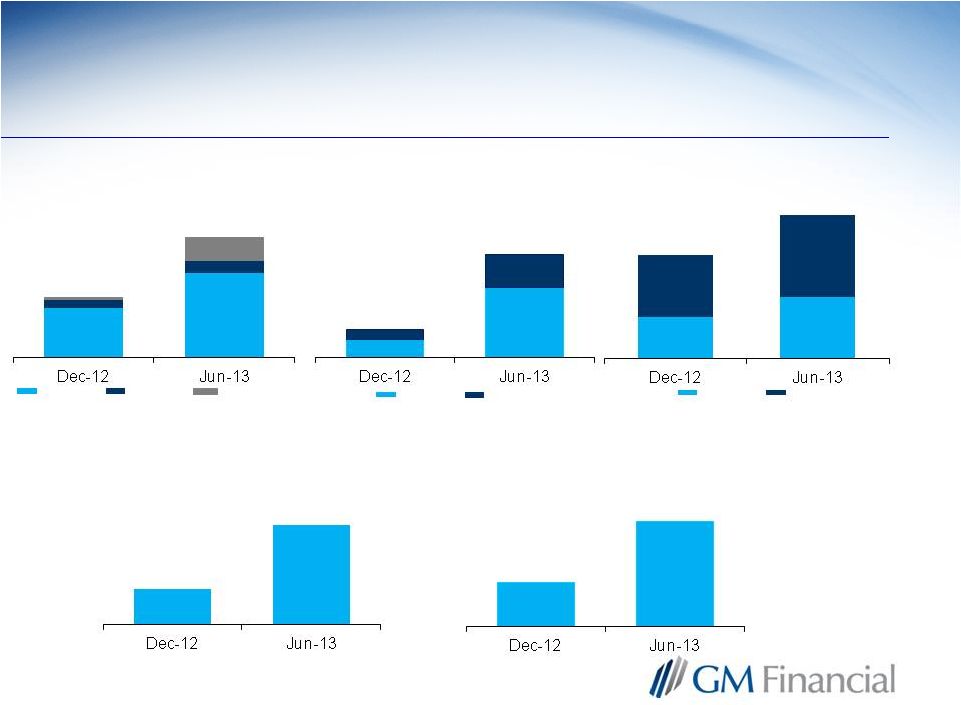
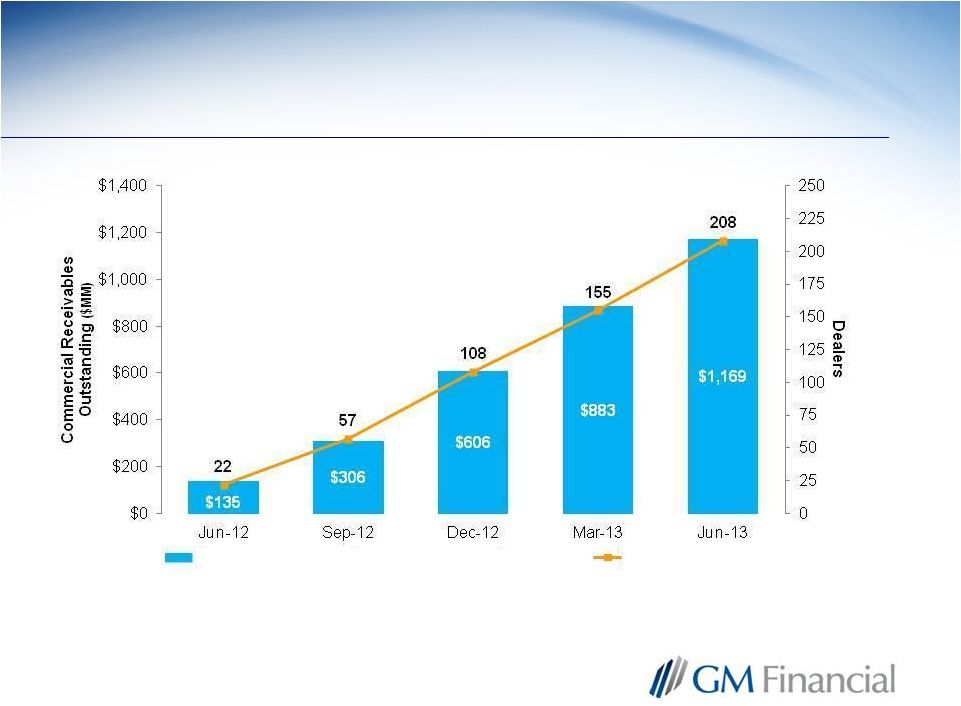 9
North America –
Commercial Lending
Commercial Finance Receivables Outstanding
Number of Dealers |
 International Operations–
GM and GMF Penetration Statistics
10
Jun-13
Sales Penetrations
GMF as a % of GM Retail Sales
30.3%
Europe
27.6%
Latin America
36.0%
GMF wholesale dealer penetration
94.9%
Europe
97.7%
Latin America
88.0%
GM / GMF Linkage
GM as % of GMF Consumer Originations
(GM New / GMF Consumer Loan)
86.0%
Europe
79.7%
Latin America
96.1% |
 International Operations–
Consumer Loan Originations
11
•
Comprised of predominately
prime quality customers
purchasing new GM vehicles
•
Solid performance in the UK
and Mexico …
softer in
continental Europe
Other 7%
$1.1B
Europe
Latin
America
Mexico
19%
Germany
30%
U.K.
31%
Other 7%
June 2013 Quarter
Other 13% |
 International Operations–
Consumer Loan Portfolio
12
Other
8%
Other
18%
•
Credit performance consistent with
prime make up of portfolio
•
For June 2013 quarter
-
Annualized quarterly net credit losses
of 0.3%
-
31-60 day delinquencies of 0.6%
-
61+ day delinquencies of 0.6%
U.K.
23%
Germany
38%
Mexico
13%
At June 30, 2013
$7.2 B
Europe
Latin
America |
 International Operations–
Commercial Lending Portfolio
13
•
Providing a full range of
commercial lending products
…
utilizing a high-
touch/relationship focused
model
•
Strong penetration of GM
dealers at 95 %
•
Floorplan financing
represents the largest share
U.K.
25%
Germany
25%
Other
31%
Mexico
15%
Other
4%
at June 30, 2013
$3.8 B
Europe
Latin
America |
 14
International Acquisition –
Financial Transaction Summary
Sources
Uses
Unsecured senior notes
$2.5
Operations purchase price to date
$2.6
GM equity contribution
1.3
Remaining operations purchase
price`
1.6
Additional GM equity contribution
0.7
Inter-company loan
(1)
1.5
GMF liquidity
1.2
Total sources
$5.7
Total uses
$5.7
(1) Includes $1.4B to repay inter-company loan from Ally to European
Operations ($B)
•
Remaining GM capital contribution to be received in connection with
subsequent closing
–
No additional debt financing needed
•
Preliminary goodwill = $50 million
–
Subject to further adjustment pending closure of Brazil and China, including
potential adjustments from the finalization of the closing balance sheet
audits •
Purchase accounting applied to fair value assets and liabilities
–
Minimal impact |
 15
Financial Results –
Earnings
Before
Taxes
($MM)
Three Months Ended June 30,
Six months ended June 30,
Note: Results from international operations are reflected beginning in Q2 2013
from the date of their acquisition
(1) Total Co. reflects net impact of intercompany allocations
(1)
(1)
$264
$213
$43
$217
$217
Total Co.
North America
International
2013
2012
$434
$397 $398
$37
$398
Total Co.
North America
International
2013
2012 |
 16
Financial Results –
Allowance for Loan Losses
Allowance for Loan Loss as a Percentage of Post-Acquisition Finance
Receivables Consumer
Allowance
Commercial
Allowance
North
America Only
North America
Only
NA Only
3.4%
3.5%
3.9%
4.1%
2.7%
1.1%
1.2%
0.5%
4.2%
1.0%
0.0%
2.0%
4.0%
6.0%
8.0%
Jun-12
Sep-12
Dec-12
Mar-13
Jun-13
NA Only |
 Financial Results –
Operating Expenses
17
Operating Expense as a Percentage of Average Earning Assets
3.0%
NA Only
Total Company
North America Only
3.2%
3.4%
3.1%
3.2%
3.0%
2.50%
3.00%
3.50%
4.00%
Jun
-12
Sep-12
Dec-12
Mar-13
Jun
-13 |
 Solid
Balance Sheet 18
Tangible Net Worth ($B)
Consumer
Lease
Consumer
Loans
Commercial
Loans
(1)
Liquidity includes unrestricted cash, available borrowing capacity on unpledged
eligible receivables, available borrowing capacity on committed unsecured
credit lines and unused balance on GM line of credit (2)
Earning assets to tangible net worth
Unsecured
Debt
Secured
Debt
Other
Cash
$13.3
$26.2
$10.9
$22.8
$2.9
$4.1
$3.3
$4.7
4.1x
5.5x
Earning Assets ($B)
Total Debt ($B)
Liquidity
1
($B)
Leverage
(2) |
 Funding Overview
•
Funding platform evolving
–
Fund locally
–
Expect to be a frequent issuer of senior notes
to support both growth and as credit rating
improves
–
IO funding composition utilizes more
unsecured funding
–
Expand ABS platforms in NA and IO
–
Intercompany funding for Europe
•
$11.2 B committed funding provided
by 20 banks across 21 facilities
•
GM support via
–
$2B equity contribution for international
acquisition
–
$600M Line of Credit
–
$1B tax deferral program through Dec. 2014
–
Co-borrower on GM Revolver (up to $4 billion)
Unsecured
Tangible
Equity
Secured
Unrestricted
Cash
19
$9.4B
66%
$3.3B
23%
$1.3B
$1.5B
11%
$17.5B
64%
$5.2B
19%
$4.7B
17%
$1.8B
6/30/2013
Post –
International Acquisition
12/31/2012
Pre –
International Acquisition |
 20
North America Funding Strategy
•
Utilize secured bank provided credit facilities to support
interim
and
semi-permanent
financing
-
total
capacity
$6.3
billion across five facilities
–
Separate facilities in US and Canada for loans, leases and
commercial lending product lines
–
sized to support
prospective/forecasted volumes from six months to two years
–
Credit facilities to be increased or created as needed to
support product offerings
•
Asset-backed securitizations provide permanent financing
–
Completed over 80 public auto loan securitizations since
1994 with approximately $70 billion in notes issued, including
three in 2013
–
Plan to develop securitization programs for lease and
floorplan
(1) Senior Notes
Funding Composition
June 30, 2013
$15.1B
Unsecured (1)
26.5%
Secured
73.5% |
 International Funding Strategy
21
Affiliate
Funding
Unsecured
Funding
Secured
Funding
IO Funding Composition
June 30, 2013
$9.1 Billion
•
Established funding platform, with credit facilities rolling over
with the acquisition
•
Total committed banks lines of $4.9B
•
Fund primarily with local sources to minimize currency and
country risk
–
Currently, Latin America Operations are entirely funded locally
–
European Operations have $1.5B intercompany loan from
GMF US
•
Mix of funding sources varies by country
–
Utilization of both secured and unsecured credit facilities
–
Access
to
public
securitization
markets
–
in
the
UK
and
Germany
for consumer finance receivables
–
Other funding sources exist in certain countries
–
Maintain and develop strong relationships globally with financial
institutions and investors
16%
13%
71% |