Attached files
| file | filename |
|---|---|
| 8-K - FORM 8-K - CenterState Bank Corp | d571729d8k.htm |
Exhibit 99.1
FOR IMMEDIATE RELEASE
July 22, 2013
CenterState Banks, Inc. Announces
Second Quarter 2013 Operating Results
(All dollar amounts are in thousands, except per share information)
(All earnings per share amounts are reported on a diluted basis unless otherwise noted)
DAVENPORT, FL. – July 22, 2013 – CenterState Banks, Inc. (NASDAQ: CSFL) reported earnings per share of $0.09 on net income of $2,758 for the second quarter of 2013, compared to $0.15 per share on net income of $4,576 reported during the prior quarter. The decrease was primarily due to: (1) higher loan loss provision expense due primarily to significant loan growth during the quarter; (2) higher Indemnification Asset (“IA”) amortization expense due to continued better performance than previously estimated on purchased credit impaired loans acquired pursuant to FDIC assisted transactions of failed financial institutions; and, (3) lower bond sales activity in the correspondent banking division due primarily as a result of the recent interest rate activity in the bond market.
Earnings comparisons between the current year quarter and prior year quarter are presented below.
| Three months ended | ||||||||
| June 30, 2013 | June 30, 2012 | |||||||
| Net income |
$ | 2,758 | $ | 3,714 | ||||
| Earnings per share |
$ | 0.09 | $ | 0.12 | ||||
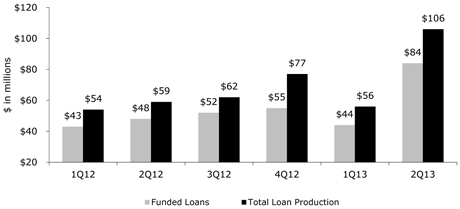
Loan Growth: Non covered loans (i.e. loans not covered by FDIC loss share agreements) grew $41,744, or 14.7% annualized, during the three month period ending June 30, 2013. During the six month period ending June 30, 2013, the annualized growth rate was approximately 6.9%. Total new loans originated during the quarter approximated $105.6 million, of which $84.3 million were funded. The average yield on funded loans was approximately 4.13%. About 41% of the loan production was commercial real estate (“CRE”) and approximately 31% was single family residential. Commercial and industrial (“C&I”) loans approximated 10% of total production. The graph below summarizes total loan production and funded loan production over the past six quarters.
4
FDIC covered loans and the related indemnification asset: Purchased credit impaired loans acquired pursuant to FDIC assisted transactions of failed financial institutions have been performing better than previously estimated. To the extent future estimated cash flows have improved (i.e. future estimated losses have decreased), the additional amount of future estimated cash flows are accreted into interest income over the remaining life of the related loan pool(s), thereby increasing the pool’s yield. The yields on the aggregate covered loan portfolio have been trending upward as a result of a decrease in the estimate of future losses. During the past nine quarters, the yields on the covered loan portfolio were as follows:
| (unaudited) |
2Q13 | 1Q13 | 4Q12 | 3Q12 | 2Q12 | 1Q12 | 4Q11 | 3Q11 | 2Q11 | |||||||||||||||||||||||||||
| FDIC covered loan portfolio |
12.03 | % | 11.06 | % | 7.71 | % | 7.03 | % | 7.51 | % | 6.69 | % | 6.80 | % | 6.21 | % | 5.51 | % | ||||||||||||||||||
The indemnification asset (“IA”) represents the amount that is expected to be collected from the FDIC for reimbursement of 80% of the estimated losses in the covered pools. When the Company decreases its estimate of future losses, the expected reimbursement from the FDIC, or IA, is decreased by 80% of this amount. The decrease in estimated reimbursements is expensed (negative accretion) over the lesser of the remaining expected life of the related loan pool(s) or the remaining term of the related loss share agreement(s), and is included in the Company’s non-interest income as a negative amount.
At June 30, 2013, the total IA on the Company’s balance sheet was $88,716. Of this amount, the Company expects to receive reimbursements from the FDIC of approximately $58,556 related to future estimated losses, and expects to write-off approximately $30,160 for previously estimated losses that are no longer expected. The $30,160 is now expected to be paid by the borrower (or realized upon the sale of OREO) instead of a reimbursement from the FDIC. At June 30, 2013, the $30,160 previously estimated reimbursements from the FDIC will be written off as expense (negative accretion) in the Company’s non-interest income as summarized below.
| Year |
Year |
|||||||||
| 2013 (6 months) |
22.8 | % | 2017 |
5.8 | % | |||||
| 2014 |
31.9 | % | 2018 |
4.8 | % | |||||
| 2015 |
16.1 | % | 2019 thru 2021 |
7.4 | % | |||||
|
|
|
|||||||||
| 2016 |
11.2 | % | Total |
100.0 | % | |||||
|
|
|
|||||||||
5
Quarterly condensed consolidated income statements (unaudited) are shown below for the periods indicated. See notes 1 and 2 below for a discussion related to FDIC revenue and amortization (negative accretion) included in non-interest income.
| Quarterly Condensed Consolidated Statements of Operations (unaudited) | ||||||||||||||||||||
| For the quarter ended: |
6/30/13 | 3/31/13 | 12/31/12 | 9/30/12 | 6/30/12 | |||||||||||||||
| Interest income |
$ | 24,487 | $ | 24,378 | $ | 23,265 | $ | 23,608 | $ | 24,587 | ||||||||||
| Interest expense |
1,507 | 1,556 | 1,726 | 1,941 | 2,304 | |||||||||||||||
|
|
|
|
|
|
|
|
|
|
|
|||||||||||
| Net interest income |
22,980 | 22,822 | 21,539 | 21,667 | 22,283 | |||||||||||||||
| Credit (provision) for loan losses |
(1,374 | ) | 360 | (2,169 | ) | (2,425 | ) | (1,894 | ) | |||||||||||
|
|
|
|
|
|
|
|
|
|
|
|||||||||||
| Net interest income after loan loss provision |
21,606 | 23,182 | 19,370 | 19,242 | 20,389 | |||||||||||||||
| Income from correspondent banking and bond sales division |
4,904 | 6,140 | 6,450 | 8,606 | 9,966 | |||||||||||||||
| Gain on sale of securities available for sale |
1,008 | 30 | 420 | 675 | 726 | |||||||||||||||
| FDIC- IA amortization (negative accretion) (note 1) |
(3,272 | ) | (2,199 | ) | (1,540 | ) | (671 | ) | (348 | ) | ||||||||||
| FDIC- revenue (note 2) |
1,396 | 628 | 2,025 | 2,199 | 1,229 | |||||||||||||||
| All other non-interest income |
5,827 | 5,680 | 5,385 | 5,526 | 4,968 | |||||||||||||||
| Credit related expenses |
(3,134 | ) | (2,021 | ) | (3,573 | ) | (3,844 | ) | (2,198 | ) | ||||||||||
| Acquisition and conversion related expenses |
— | — | (55 | ) | (177 | ) | (614 | ) | ||||||||||||
| Correspondent banking division expenses |
(5,363 | ) | (6,075 | ) | (6,069 | ) | (7,235 | ) | (7,896 | ) | ||||||||||
| Impairment bank owned property held for sale |
— | — | — | (449 | ) | (165 | ) | |||||||||||||
| All other non-interest expense |
(18,876 | ) | (18,994 | ) | (18,833 | ) | (20,001 | ) | (20,785 | ) | ||||||||||
|
|
|
|
|
|
|
|
|
|
|
|||||||||||
| Income before income tax |
4,096 | 6,371 | 3,580 | 3,871 | 5,272 | |||||||||||||||
| Income tax provision |
(1,338 | ) | (1,795 | ) | (1,344 | ) | (1,229 | ) | (1,558 | ) | ||||||||||
|
|
|
|
|
|
|
|
|
|
|
|||||||||||
| NET INCOME |
$ | 2,758 | $ | 4,576 | $ | 2,236 | $ | 2,642 | $ | 3,714 | ||||||||||
|
|
|
|
|
|
|
|
|
|
|
|||||||||||
| Earnings per share (basic) |
$ | 0.09 | $ | 0.15 | $ | 0.07 | $ | 0.09 | $ | 0.12 | ||||||||||
| Earnings per share (diluted) |
$ | 0.09 | $ | 0.15 | $ | 0.07 | $ | 0.09 | $ | 0.12 | ||||||||||
| Average common shares outstanding (basic) |
30,098,853 | 30,089,726 | 30,079,767 | 30,077,933 | 30,072,395 | |||||||||||||||
| Average common shares outstanding (diluted) |
30,161,241 | 30,159,188 | 30,153,775 | 30,142,167 | 30,140,009 | |||||||||||||||
| Common shares outstanding at period end |
30,104,270 | 30,095,520 | 30,079,767 | 30,079,767 | 30,074,927 | |||||||||||||||
| PTPP earnings (note 3) |
$ | 6,200 | $ | 7,343 | $ | 6,932 | $ | 7,892 | $ | 8,188 | ||||||||||
| PTPP diluted earnings per share (note 4) |
$ | 0.21 | $ | 0.24 | $ | 0.23 | $ | 0.26 | $ | 0.27 | ||||||||||
| note 1: | On the date of an FDIC acquisition (with loss share), the Company estimates expected future losses and the timing of those losses by loan pool. The related reimbursements from the FDIC for approximately 80% of those losses are recorded as a receivable from the FDIC, referred to as indemnification asset or “IA.” The Company updates its estimate of future losses and the timing of the losses each quarter. To the extent management estimates that future losses are less than prior expected future losses, management adjusts its estimates of future expected cash flows and this increase is accreted to interest income over the remaining life of those specific loan pools, increasing the yield on loans. Because management no longer expects these incremental future losses on the loan pool(s), then the expected future reimbursements from the FDIC for approximately 80% of these losses are also reduced. Instead of immediately charging down the IA for expected future FDIC reimbursements, the IA is written down over the shorter of the loss share period or the life of the related loan pool(s) by negative accretion (amortization) in this line item. |
| note 2: | Two FDIC related revenue items are included in this line item. The first item is FDIC reimbursement income from the sale of OREO. When OREO (those covered by loss share agreements) is sold for a loss, approximately 80% of the loss is recognized as income and included in this line item. Second, when a loan pool (with loss share) is impaired, the impairment expense is included in provision for loan losses, and approximately 80% of that loss is recognized as income from FDIC reimbursement, and included in this line item. |
| note 3: | Pre-tax pre-provision earnings (“PTPP”) is a non-GAAP measure that is defined as income before income tax excluding the provision for loan losses and gain on sale of available for sale (“AFS”) securities. In addition, the Company also excludes other credit related costs including losses on repossessed real estate and other assets, and other foreclosure related expenses. It also excludes non-recurring items as listed in the following reconciliation table. |
| note 4: | PTPP earnings per share means, PTPP as defined in note 3 above divided by the average number of diluted common shares outstanding. |
6
A reconciliation of the quarterly condensed PTPP is presented below (unaudited):
| For the quarter ended: |
6/30/13 | 3/31/13 | 12/31/12 | 9/30/12 | 6/30/12 | |||||||||||||||
| Income before income tax (GAAP) |
$ | 4,096 | $ | 6,371 | $ | 3,580 | $ | 3,871 | $ | 5,272 | ||||||||||
| exclude provision for loan losses |
1,374 | (360 | ) | 2,169 | 2,425 | 1,894 | ||||||||||||||
| FDIC income from pool impairment |
70 | 21 | (261 | ) | (619 | ) | (886 | ) | ||||||||||||
| exclude other credit related costs |
3,134 | 2,021 | 3,573 | 3,844 | 2,198 | |||||||||||||||
| OREO indemnification income from FDIC |
(1,466 | ) | (649 | ) | (1,764 | ) | (1,580 | ) | (343 | ) | ||||||||||
| exclude gain on sale of AFS securities |
(1,008 | ) | (30 | ) | (420 | ) | (675 | ) | (726 | ) | ||||||||||
| exclude non-recurring items: |
||||||||||||||||||||
| impairment bank owned property held for sale |
— | — | — | 449 | 165 | |||||||||||||||
| gain on sale of bank owned property held for sale |
— | (31 | ) | — | — | — | ||||||||||||||
| acquisition and conversion related expenses |
— | — | 55 | 177 | 614 | |||||||||||||||
|
|
|
|
|
|
|
|
|
|
|
|||||||||||
| PTPP earnings |
$ | 6,200 | $ | 7,343 | $ | 6,932 | $ | 7,892 | $ | 8,188 | ||||||||||
|
|
|
|
|
|
|
|
|
|
|
|||||||||||
The condensed quarterly results of the Company’s correspondent banking and bond sales segment are presented below.
| Quarterly Condensed Segment Information – Correspondent banking and bond sales division (unaudited) |
||||||||||||||||||||
| For the quarter ended: |
6/30/13 | 3/31/13 | 12/31/12 | 9/30/12 | 6/30/12 | |||||||||||||||
| Net interest income |
$ | 607 | $ | 774 | $ | 878 | $ | 925 | $ | 1,042 | ||||||||||
| Total non-interest income (note 1) |
5,609 | 7,005 | 7,193 | 9,453 | 10,707 | |||||||||||||||
| Total non-interest expense (note 2) |
(5,363 | ) | (6,075 | ) | (6,069 | ) | (7,235 | ) | (7,896 | ) | ||||||||||
| Income tax provision |
(329 | ) | (657 | ) | (753 | ) | (1,183 | ) | (1,450 | ) | ||||||||||
|
|
|
|
|
|
|
|
|
|
|
|||||||||||
| Net income |
$ | 524 | $ | 1,047 | $ | 1,249 | $ | 1,960 | $ | 2,403 | ||||||||||
|
|
|
|
|
|
|
|
|
|
|
|||||||||||
| Contribution to diluted earnings per share |
$ | 0.02 | $ | 0.03 | $ | 0.04 | $ | 0.07 | $ | 0.08 | ||||||||||
|
|
|
|
|
|
|
|
|
|
|
|||||||||||
| Allocation of indirect expenses (note 3) |
$ | (460 | ) | $ | (465 | ) | $ | (592 | ) | $ | (641 | ) | $ | (546 | ) | |||||
| Income tax benefit |
177 | 179 | 223 | 241 | 205 | |||||||||||||||
|
|
|
|
|
|
|
|
|
|
|
|||||||||||
| Contribution to diluted earnings per share after deduction of allocated indirect expenses |
$ | 0.01 | $ | 0.03 | $ | 0.03 | $ | 0.05 | $ | 0.07 | ||||||||||
|
|
|
|
|
|
|
|
|
|
|
|||||||||||
| note 1: | The primary component in this line item is gross commissions earned on bond sales (“income from correspondent banking and bond sales division”) which was $4,904, $6,140, $6,450, $8,606 and $9,966 for 2Q13, 1Q13, 4Q12, 3Q12 and 2Q12 respectively. The remaining non interest income items in this category include fees from safe-keeping activities, bond accounting services, asset/liability consulting related activities, international wires, clearing and corporate checking account services, and other correspondent banking related revenue and fees. |
| note 2: | The majority of these expenses are variable in nature and are a derivative of the income from correspondent banking and bond sales division. The amounts do not include any indirect support allocation costs. |
| note 3: | A portion of the cost of the Company’s indirect departments such as human resources, accounting, deposit operations, item processing, information technology, compliance and others have been allocated to the correspondent banking and bond sales division based on management’s estimates. |
Net Interest Margin (“NIM”)
The Company accounts for loans acquired pursuant to acquisitions of failed financial institutions (i.e. purchased credit impaired loans) pursuant to ASC 310-30. If the Company receives a cash payment (or repossessed and transferred an asset to OREO) in an amount in excess of the carrying value of the entire pool, the excess is immediately accreted into interest income, pursuant to ASC 310-30. This event occurred in several loan pools during the current quarter and the prior sequential quarter, resulting in
7
additional income of approximately $1,047 and $1,849, during the second and first quarter of 2013, respectively. Excluding this additional interest income, the yield on the FDIC covered loan portfolio is equal to approximately 10.45% and 8.42% compared to the reported 12.03% and 11.06% during the second and first quarters of 2013, respectively.
The reported NIM decreased 5bps to 4.59% in the current quarter compared to 4.64% in the prior quarter. Excluding the ASC 310-30 events in loans covered by FDIC loss share, as discussed above, the current quarter NIM increased approximately 11 bps to 4.38% compared to 4.27% in the prior quarter as summarized in the table below (presented on a tax equivalent yield basis).
| 2Q13 | 1Q13 | |||||||||||||||
| (unaudited) |
net int income |
NIM | net int income |
NIM | ||||||||||||
| as reported |
$ | 23,322 | 4.59 | % | $ | 23,109 | 4.64 | % | ||||||||
| additional income from increased collections during the quarter: |
||||||||||||||||
| ASC 310-30 – covered loans |
(1,047 | ) | (1,849 | ) | ||||||||||||
|
|
|
|
|
|
|
|
|
|||||||||
| NIM excluding above items |
$ | 22,275 | 4.38 | % | $ | 21,260 | 4.27 | % | ||||||||
|
|
|
|
|
|
|
|
|
|||||||||
The primary reason for the increase in NIM between sequential quarters is the increase in yields, excluding the accelerated cash payments received as discussed above, on FDIC covered loans accounted for pursuant to ASC 310-30. Each quarter, management reviews and evaluates the amount of potential future losses (i.e. estimated future cash flows) and the timing of those estimated future cash flows. To the extent estimated future losses are revised downward, and as such future estimated cash flows are revised upward, the estimated increase in estimated future cash flows are accreted into interest income over the remaining lives of the related loan pools, thereby increasing yields. During the last nine quarters, the yields on the covered loan portfolio were as follows:
| (unaudited) |
2Q13 | 1Q13 | 4Q12 | 3Q12 | 2Q12 | 1Q12 | 4Q11 | 3Q11 | 2Q11 | |||||||||||||||||||||||||||
| FDIC covered loan portfolio |
12.03 | %* | 11.06 | %** | 7.71 | % | 7.03 | % | 7.51 | % | 6.69 | % | 6.80 | % | 6.21 | % | 5.51 | % | ||||||||||||||||||
| * | As described earlier, excluding the $1,047, the yield for 2Q13 is equal to approximately 10.45%. |
| ** | As described earlier, excluding the $1,849, the yield for 1Q13 is equal to approximately 8.42%. |
Loans, excluding FDIC covered loans, the largest category in the Company’s interest earning assets, earned an average yield of 4.86% during the current quarter. New loans funded during the current quarter averaged approximately 4.13%. New loans funded in the prior three quarters averaged 4.27%, 4.31% and 4.40%, respectively. The yield for this category of loans is expected to decrease slightly each quarter until the average yield for the category approaches the average yield of new loans being funded.
8
The table below summarizes yields and costs by various interest earning asset and interest bearing liability account types for the current quarter, the previous calendar quarter and the same quarter last year.
| Yield and cost table (unaudited) |
||||||||||||||||||||||||||||||||||||
| 2Q13 | 1Q13 | 2Q12 | ||||||||||||||||||||||||||||||||||
| average balance |
interest inc/exp |
avg rate |
average Balance |
interest inc/exp |
avg rate |
average balance |
interest inc/exp |
avg rate |
||||||||||||||||||||||||||||
| Loans (TEY)* (note 1) |
$ | 1,155,737 | $ | 13,995 | 4.86 | % | $ | 1,136,076 | $ | 13,796 | 4.92 | % | $ | 1,122,268 | $ | 14,718 | 5.27 | % | ||||||||||||||||||
| Covered loans (note 2) |
264,769 | 7,943 | 12.03 | % | 284,151 | 7,749 | 11.06 | % | 347,191 | 6,480 | 7.51 | % | ||||||||||||||||||||||||
| Taxable securities |
392,974 | 2,097 | 2.14 | % | 417,185 | 2,389 | 2.32 | % | 475,099 | 3,064 | 2.59 | % | ||||||||||||||||||||||||
| Tax-exempt securities (TEY) |
44,841 | 566 | 5.06 | % | 43,043 | 533 | 5.02 | % | 38,755 | 521 | 5.41 | % | ||||||||||||||||||||||||
| Fed funds sold and other |
179,982 | 228 | 0.51 | % | 137,776 | 198 | 0.58 | % | 116,153 | 144 | 0.50 | % | ||||||||||||||||||||||||
|
|
|
|
|
|
|
|
|
|
|
|
|
|
|
|
|
|
|
|||||||||||||||||||
| Tot. interest earning assets (TEY) |
$ | 2,038,303 | $ | 24,829 | 4.89 | % | $ | 2,018,231 | $ | 24,665 | 4.96 | % | $ | 2,099,466 | $ | 24,927 | 4.78 | % | ||||||||||||||||||
|
|
|
|
|
|
|
|
|
|
|
|
|
|
|
|
|
|
|
|||||||||||||||||||
| Interest bearing deposits |
$ | 1,433,806 | $ | 1,330 | 0.37 | % | $ | 1,462,511 | $ | 1,383 | 0.38 | % | $ | 1,590,953 | $ | 2,004 | 0.51 | % | ||||||||||||||||||
| Fed funds purchased |
35,619 | 6 | 0.07 | % | 44,662 | 5 | 0.05 | % | 54,131 | 7 | 0.05 | % | ||||||||||||||||||||||||
| Other borrowings |
23,831 | 21 | 0.35 | % | 20,381 | 18 | 0.36 | % | 34,373 | 136 | 1.58 | % | ||||||||||||||||||||||||
| Corporate debentures |
16,981 | 150 | 3.54 | % | 16,975 | 150 | 3.58 | % | 16,955 | 157 | 3.75 | % | ||||||||||||||||||||||||
|
|
|
|
|
|
|
|
|
|
|
|
|
|
|
|
|
|
|
|||||||||||||||||||
| Total interest bearing liabilities |
$ | 1,510,237 | $ | 1,507 | 0.40 | % | $ | 1,544,529 | $ | 1,556 | 0.41 | % | $ | 1,696,412 | $ | 2,304 | 0.55 | % | ||||||||||||||||||
|
|
|
|
|
|
|
|
|
|
|
|
|
|
|
|
|
|
|
|||||||||||||||||||
| Net Interest Spread (TEY) |
4.49 | % | 4.55 | % | 4.23 | % | ||||||||||||||||||||||||||||||
|
|
|
|
|
|
|
|||||||||||||||||||||||||||||||
| Net Interest Margin (TEY) |
4.59 | % | 4.64 | % | 4.33 | % | ||||||||||||||||||||||||||||||
|
|
|
|
|
|
|
|||||||||||||||||||||||||||||||
| * | TEY = tax equivalent yield |
| note 1: | loans not covered by FDIC loss share agreements |
| note 2: | loans covered by FDIC loss share agreements, and accounted for pursuant to ASC Topic 310-30. |
The table below summarizes the Company’s yields on interest earning assets and costs of interest bearing liabilities over the prior five quarters.
| Five quarter trend of yields and costs (unaudited) |
||||||||||||||||||||
| For the quarter ended: |
6/30/13 | 3/31/13 | 12/31/12 | 9/30/12 | 6/30/12 | |||||||||||||||
| Yield on loans (TEY)* |
4.86 | % | 4.92 | % | 5.12 | % | 5.22 | % | 5.27 | % | ||||||||||
| Yield on FDIC covered loans |
12.03 | % | 11.06 | % | 7.71 | % | 7.03 | % | 7.51 | % | ||||||||||
| Yield on securities (TEY) |
2.44 | % | 2.57 | % | 2.52 | % | 2.66 | % | 2.81 | % | ||||||||||
| Yield on fed funds sold and other |
0.51 | % | 0.58 | % | 0.56 | % | 0.58 | % | 0.50 | % | ||||||||||
| Yield on total interest earning assets |
4.82 | % | 4.90 | % | 4.58 | % | 4.61 | % | 4.71 | % | ||||||||||
| Yield on total interest earning assets (TEY) |
4.89 | % | 4.96 | % | 4.65 | % | 4.67 | % | 4.78 | % | ||||||||||
| Cost of interest bearing deposits |
0.37 | % | 0.38 | % | 0.41 | % | 0.45 | % | 0.51 | % | ||||||||||
| Cost of fed funds purchased |
0.07 | % | 0.05 | % | 0.05 | % | 0.05 | % | 0.05 | % | ||||||||||
| Cost of other borrowings |
0.35 | % | 0.36 | % | 0.38 | % | 0.46 | % | 1.58 | % | ||||||||||
| Cost of corporate debentures |
3.54 | % | 3.58 | % | 3.66 | % | 3.75 | % | 3.75 | % | ||||||||||
| Cost of interest bearing liabilities |
0.40 | % | 0.41 | % | 0.44 | % | 0.48 | % | 0.55 | % | ||||||||||
| Net interest margin (TEY) |
4.59 | % | 4.64 | % | 4.31 | % | 4.30 | % | 4.33 | % | ||||||||||
| Cost of total deposits |
0.27 | % | 0.28 | % | 0.31 | % | 0.34 | % | 0.38 | % | ||||||||||
| * | TEY = tax equivalent yield |
9
The table below summarizes selected financial ratios over the prior five quarters.
| Selected financial ratios (unaudited) |
||||||||||||||||||||
| As of or for the quarter ended: |
6/30/13 | 3/31/13 | 12/31/12 | 9/30/12 | 6/30/12 | |||||||||||||||
| Return on average assets (annualized) |
0.46 | % | 0.78 | % | 0.37 | % | 0.44 | % | 0.60 | % | ||||||||||
| Return on average equity (annualized) |
4.00 | % | 6.76 | % | 3.25 | % | 3.85 | % | 5.59 | % | ||||||||||
| Loan / deposit ratio |
72.6 | % | 70.3 | % | 71.9 | % | 72.8 | % | 71.3 | % | ||||||||||
| Stockholders’ equity (to total assets) |
11.5 | % | 11.6 | % | 11.6 | % | 11.5 | % | 11.0 | % | ||||||||||
| Common tangible equity (to total tangible assets) |
9.5 | % | 9.6 | % | 9.6 | % | 9.5 | % | 9.1 | % | ||||||||||
| Tier 1 capital (to average assets) |
10.3 | % | 10.1 | % | 9.9 | % | 9.7 | % | 9.3 | % | ||||||||||
| Efficiency ratio, including correspondent banking (note 1) |
77.8 | % | 75.6 | % | 76.4 | % | 76.5 | % | 76.1 | % | ||||||||||
| Efficiency ratio, excluding correspondent banking (note 2) |
73.7 | % | 73.0 | % | 74.3 | % | 76.8 | % | 78.1 | % | ||||||||||
| Common equity per common share |
$ | 9.02 | $ | 9.18 | $ | 9.09 | $ | 9.10 | $ | 8.95 | ||||||||||
| Common tangible equity per common share |
$ | 7.30 | $ | 7.45 | $ | 7.36 | $ | 7.36 | $ | 7.19 | ||||||||||
| note 1: | Numerator equals non-interest expense less non-recurring expenses (e.g. merger costs, bank property impairment, etc.) less intangible amortization (both CDI and Trust intangible) less credit related expenses. Denominator equals net interest income on a taxable equivalent yield basis (“TEY”) before the provision for loan losses plus non-interest income less non-recurring income (e.g. bargain purchase gain, gain on sale of securities available for sale, etc.) less FDIC income related to losses on the sales of covered OREO properties and impairment of loan pool(s) covered by FDIC loss share arrangements. |
| note 2: | Numerator starts with the same numerator as in “note 1”, less correspondent bank non-interest expense, including indirect expense allocations. Denominator starts with the same denominator as in “note 1”, less correspondent bank net interest income and less correspondent bank non-interest income. |
10
Loan portfolio mix and covered loans
Approximately 17.9% of the Company’s loans, or $256,828, are covered by FDIC loss sharing agreements related to the acquisition of three failed financial institutions during the third quarter of 2010 and two during the first quarter of 2012. Pursuant to the terms of the loss sharing agreements, the FDIC is obligated to reimburse the Company for 80% of losses with respect to the covered loans beginning with the first dollar of loss incurred, subject to the terms of the agreements. The Company will reimburse the FDIC for its share of recoveries with respect to the covered loans. The loss sharing agreements applicable to single family residential mortgage loans provide for FDIC loss sharing and the Company reimbursement to the FDIC for recoveries for ten years. The loss sharing agreements applicable to commercial loans provides for FDIC loss sharing for five years and Company reimbursement to the FDIC for a total of eight years for recoveries. All of the covered loans acquired are accounted for pursuant to ASC Topic 310-30.
The table below summarizes the Company’s loan mix over the most recent five quarter ends.
| Loan mix (unaudited) |
||||||||||||||||||||
| At quarter ended: |
6/30/13 | 3/31/13 | 12/31/12 | 9/30/12 | 6/30/12 | |||||||||||||||
| Loans not covered by FDIC loss share agreements |
||||||||||||||||||||
| Real estate loans |
||||||||||||||||||||
| Residential |
$ | 437,946 | $ | 432,892 | $ | 428,554 | $ | 428,138 | $ | 422,687 | ||||||||||
| Commercial |
504,487 | 478,790 | 480,494 | 468,261 | 461,405 | |||||||||||||||
| Land, development and construction loans |
60,928 | 59,524 | 55,474 | 56,454 | 66,890 | |||||||||||||||
|
|
|
|
|
|
|
|
|
|
|
|||||||||||
| Total real estate loans |
1,003,361 | 971,206 | 964,522 | 952,853 | 950,982 | |||||||||||||||
| Commercial loans |
124,465 | 115,217 | 124,225 | 131,302 | 127,880 | |||||||||||||||
| Consumer and other loans, (note 1) |
2,851 | 2,818 | 2,732 | 1,998 | 2,072 | |||||||||||||||
| Consumer and other loans |
48,084 | 47,991 | 48,547 | 48,808 | 47,973 | |||||||||||||||
|
|
|
|
|
|
|
|
|
|
|
|||||||||||
| Total loans before unearned fees and costs |
1,178,761 | 1,137,232 | 1,140,026 | 1,134,961 | 1,128,907 | |||||||||||||||
| Unearned fees and costs |
(2 | ) | (217 | ) | (458 | ) | (522 | ) | (644 | ) | ||||||||||
|
|
|
|
|
|
|
|
|
|
|
|||||||||||
| Total loans not covered by FDIC loss share agreements |
1,178,759 | 1,137,015 | 1,139,568 | 1,134,439 | 1,128,263 | |||||||||||||||
|
|
|
|
|
|
|
|
|
|
|
|||||||||||
| Loans covered by FDIC loss share agreements |
||||||||||||||||||||
| Real estate loans |
||||||||||||||||||||
| Residential |
128,930 | 135,068 | 142,480 | 161,827 | 168,786 | |||||||||||||||
| Commercial |
118,999 | 130,549 | 134,413 | 133,069 | 140,628 | |||||||||||||||
| Land, development and construction loans |
4,897 | 7,777 | 13,259 | 18,478 | 19,780 | |||||||||||||||
|
|
|
|
|
|
|
|
|
|
|
|||||||||||
| Total real estate loans |
252,826 | 273,394 | 290,152 | 313,374 | 329,194 | |||||||||||||||
| Commercial loans |
4,002 | 4,577 | 6,143 | 6,374 | 8,248 | |||||||||||||||
|
|
|
|
|
|
|
|
|
|
|
|||||||||||
| Total loans covered by FDIC loss share agreements |
256,828 | 277,971 | 296,295 | 319,748 | 337,442 | |||||||||||||||
|
|
|
|
|
|
|
|
|
|
|
|||||||||||
| Total Loans |
$ | 1,435,587 | $ | 1,414,986 | $ | 1,435,863 | $ | 1,454,187 | $ | 1,465,705 | ||||||||||
|
|
|
|
|
|
|
|
|
|
|
|||||||||||
| note 1: | Consumer loans acquired pursuant to five FDIC assisted transactions of failed financial institutions during the third quarter of 2010 and first quarter of 2012. These loans are not covered by an FDIC loss share agreement and are being accounted for pursuant to ASC Topic 310-30. |
11
Credit quality and allowance for loan losses
During the quarter, excluding loans covered by FDIC loss share agreements, the Company recorded a loan loss provision expense of $1,462 and charge-offs net of recoveries of $2,293.
With regard to loans covered by FDIC loss share agreements, the Company recorded a negative loan loss provision expense of $88. See the table “Allowance for loan losses” for additional information.
The allowance for loan losses (“ALLL”) was $23,820 at June 30, 2013 compared to $25,254 at March 31, 2013, a decrease of $1,434. This decrease is the result of the aggregate effect of a $441 decrease in general loan loss allowance, a $390 decrease in the specific loan loss allowance related to impaired loans and a $603 decrease in the loan loss allowance related to certain impaired loan pools of FDIC covered loans accounted for pursuant to ASC Topic 310-30. The changes in the Company’s ALLL components between June 30, 2013 and March 31, 2013 are summarized in the table below.
| June 30, 2013 | Mar 31, 2013 | increase (decrease) | ||||||||||||||||||||||||||||||||||
| loan balance |
ALLL Balance |
% | Loan Balance |
ALLL balance |
% | loan balance |
ALLL balance |
|||||||||||||||||||||||||||||
| Non impaired loans |
$ | 1,140,066 | $ | 21,200 | 1.86 | % | $ | 1,096,911 | $ | 21,641 | 1.97 | % | $ | 43,155 | $ | (441 | ) | -11 bps | ||||||||||||||||||
| Impaired loans |
38,693 | 600 | 1.55 | % | 40,104 | 990 | 2.47 | % | (1,411 | ) | (390 | ) | -92 bps | |||||||||||||||||||||||
|
|
|
|
|
|
|
|
|
|
|
|
|
|
|
|
|
|
|
|||||||||||||||||||
| Loans (note 1) |
1,178,759 | 21,800 | 1.85 | % | 1,137,015 | 22,631 | 1.99 | % | 41,744 | (831 | ) | -14 bps | ||||||||||||||||||||||||
| Covered loans (note 2) |
256,828 | 2,020 | 277,971 | 2,623 | (21,143 | ) | (603 | ) | ||||||||||||||||||||||||||||
|
|
|
|
|
|
|
|
|
|
|
|
|
|
|
|
|
|
|
|||||||||||||||||||
| Total loans |
$ | 1,435,587 | $ | 23,820 | 1.66 | % | $ | 1,414,986 | $ | 25,254 | 1.78 | % | $ | 20,601 | $ | (1,434 | ) | -12 bps | ||||||||||||||||||
| note 1: | Total loans not covered by FDIC loss share agreements. |
| note 2: | Loans covered by FDIC loss share agreements. Eighty percent of any losses in this portfolio will be reimbursed by the FDIC and recognized as FDIC indemnification income and included in non-interest income within the Company’s condensed consolidated statement of operations. Five loan pools with an aggregate carrying value of $30,109 are impaired at June 30, 2013, and have a specific allowance of $2,020. The aggregate carrying value of $30,109 represents approximately 78% of the underlying loan balances outstanding. |
The general loan loss allowance (non-impaired loans) decreased by a net amount of $441. This decrease was primarily due to the Company’s continued improvement in its credit metrics, partially offset by the growth in its non-impaired loan portfolio.
The specific loan loss allowance (impaired loans) is the aggregate of the results of individual analyses prepared for each one of the impaired loans not covered by an FDIC loss share agreement. The Company recorded partial charge offs in lieu of specific allowance for a number of the impaired loans. The Company’s impaired loans have been written down by $3,543 to $38,693 ($38,093 when the $600 specific allowance is considered) from their legal unpaid principal balance outstanding of $42,236. In the aggregate, total impaired loans have been written down to approximately 90% of their legal unpaid principal balance, and non-performing impaired loans have been written down to approximately 69% of their legal unpaid principal balance. The Company’s total non-performing loans (non-accrual loans plus loans past due greater than 90 days and still accruing, $24,834 at June 30, 2013) have been written down to approximately 77% of their legal unpaid principal balance.
Approximately $29,828 of the Company’s impaired loans (77%) are accruing performing loans. This group of impaired loans is not included in the Company’s non-performing loans or non-performing assets categories.
12
Any losses in loans covered by FDIC loss share agreements, as described in note 2 above, are reimbursable from the FDIC to the extent of 80% of such losses. These loans are being accounted for pursuant to ASC Topic 310-30. Loan pools in this portfolio are evaluated for impairment each quarter. If a pool is impaired, an allowance for loan loss is recorded.
Management believes the Company’s allowance for loan losses is adequate at June 30, 2013. However, management recognizes that many factors can adversely impact various segments of the Company’s market and customers, and therefore there is no assurance as to the amount of losses or probable losses which may develop in the future. The table below summarizes the changes in allowance for loan losses during the previous five quarters.
| Allowance for loan losses (unaudited) |
||||||||||||||||||||
| as of or for the quarter ending |
6/30/13 | 3/31/13 | 12/31/12 | 9/30/12 | 6/30/12 | |||||||||||||||
| Loans not covered by FDIC loss share agreements |
||||||||||||||||||||
| Allowance at beginning of period |
$ | 22,631 | $ | 24,033 | $ | 24,019 | $ | 23,634 | $ | 25,569 | ||||||||||
| Charge-offs |
(2,603 | ) | (1,231 | ) | (2,121 | ) | (2,245 | ) | (3,322 | ) | ||||||||||
| Recoveries |
310 | 163 | 293 | 978 | 601 | |||||||||||||||
|
|
|
|
|
|
|
|
|
|
|
|||||||||||
| Net charge-offs |
(2,293 | ) | (1,068 | ) | (1,828 | ) | (1,267 | ) | (2,721 | ) | ||||||||||
| Provision for loan losses |
1,462 | (334 | ) | 1,842 | 1,652 | 786 | ||||||||||||||
|
|
|
|
|
|
|
|
|
|
|
|||||||||||
| Allowance at end of period for loans not covered by FDIC loss share agreements |
$ | 21,800 | $ | 22,631 | $ | 24,033 | $ | 24,019 | $ | 23,634 | ||||||||||
|
|
|
|
|
|
|
|
|
|
|
|||||||||||
| Loans covered by FDIC loss share agreements |
||||||||||||||||||||
| Allowance at beginning of period |
$ | 2,623 | $ | 2,649 | $ | 2,322 | $ | 1,549 | $ | 441 | ||||||||||
| Charge-offs |
(515 | ) | — | — | — | — | ||||||||||||||
| Recoveries |
— | — | — | — | — | |||||||||||||||
|
|
|
|
|
|
|
|
|
|
|
|||||||||||
| Net charge-offs |
(515 | ) | — | — | — | — | ||||||||||||||
| Provision for loan losses |
(88 | ) | (26 | ) | 327 | 773 | 1,108 | |||||||||||||
|
|
|
|
|
|
|
|
|
|
|
|||||||||||
| Allowance at end of period for loans covered by FDIC loss share agreements |
$ | 2,020 | $ | 2,623 | $ | 2,649 | $ | 2,322 | $ | 1,549 | ||||||||||
|
|
|
|
|
|
|
|
|
|
|
|||||||||||
| Total allowance at end of period |
$ | 23,820 | $ | 25,254 | $ | 26,682 | $ | 26,341 | $ | 25,183 | ||||||||||
|
|
|
|
|
|
|
|
|
|
|
|||||||||||
The Company defines non-performing loans (“NPLs”) as non-accrual loans plus loans past due 90 days or more and still accruing interest. NPLs do not include loans covered by FDIC loss share agreements, which are accounted for pursuant to ASC Topic 310-30. NPLs as a percentage of total loans not covered by FDIC loss share agreements were 2.11% at June 30, 2013 compared to 2.18% at March 31, 2012.
Non-performing assets (“NPAs”) (which the Company defines as NPLs, as defined above, plus (a) OREO (i.e. real estate acquired through foreclosure, in-substance foreclosure, or deed in lieu of foreclosure), excluding OREO covered by FDIC loss share agreement; and (b) other repossessed assets that are not real estate, and are not covered by FDIC loss share agreement), were $30,526 at June 30, 2013, compared to $31,338 at March 31, 2013. NPAs as a percentage of total assets was 1.30% at June 30, 2013 compared to 1.31% at March 31, 2013. NPAs as a percentage of loans plus OREO and other repossessed assets, excluding loans and OREO covered by FDIC loss share agreements, was 2.58% at June 30, 2013 compared to 2.74% at March 31, 2013.
NPA inflows for the quarter were approximately $4,309. Outflows were approximately $5,121, which included approximately $592 of previously non-performing loans upgraded to accrual status during
13
the current quarter. Outflows consist primarily of net charge offs, loan sales, OREO sales, OREO valuation write downs, and loan upgrades. Inflows consist primarily of additions of new nonaccrual loans net of any prior nonaccrual loans returning to accrual status and also net of any principal pay-downs or pay-offs. Prior to the second quarter of 2012, loan upgrades were generally few and small in balance and were included in inflows as a net number. The Company upgraded loans with an aggregate balance of $7,456, $2,873, $1,277, $4,010 and $592 from nonaccrual to accrual status during 2Q12, 3Q12, 4Q12, 1Q13 and 2Q13, respectively. Because these were significant and easily identifiable amounts, they were included as an outflow. Any small homogeneous loan (e.g. single family home mortgages or consumer loans) that may have been upgraded during any of the previous quarters presented below, were netted in the aggregate inflow amount.
The table below summarizes the approximate NPA inflows and outflows during the quarters presented.
| 2Q13 | 1Q13 | 4Q12 | 3Q12 | 2Q12 | 1Q12 | 4Q11 | 3Q11 | 2Q11 | ||||||||||||||||||||||||||||
| Inflows |
$ | 4,309 | $ | 4,866 | $ | 1,887 | $ | 2,384 | $ | 1,463 | $ | 10,519 | $ | 11,584 | $ | 7,220 | $ | 14,828 | ||||||||||||||||||
| Outflows |
(5,121 | ) | (6,914 | ) | (4,134 | ) | (6,134 | ) | (13,358 | ) | (8,550 | ) | (38,260 | ) | (9,264 | ) | (19,133 | ) | ||||||||||||||||||
|
|
|
|
|
|
|
|
|
|
|
|
|
|
|
|
|
|
|
|||||||||||||||||||
| net change incr(decr) |
($ | 812 | ) | ($ | 2,048 | ) | ($ | 2,247 | ) | ($ | 3,750 | ) | ($ | 11,895 | ) | $ | 1,969 | ($ | 26,676 | ) | ($ | 2,044 | ) | ($ | 4,305 | ) | ||||||||||
|
|
|
|
|
|
|
|
|
|
|
|
|
|
|
|
|
|
|
|||||||||||||||||||
| NPA balance qrt end |
$ | 30,526 | $ | 31,338 | $ | 33,386 | $ | 35,633 | $ | 39,383 | $ | 51,278 | $ | 49,309 | $ | 75,985 | $ | 78,029 | ||||||||||||||||||
|
|
|
|
|
|
|
|
|
|
|
|
|
|
|
|
|
|
|
|||||||||||||||||||
14
The table below summarizes selected credit quality data for the periods indicated.
| Selected credit quality ratios (unaudited) |
||||||||||||||||||||
| As of or for the quarter ended: |
6/30/13 | 3/31/13 | 12/31/12 | 9/30/12 | 6/30/12 | |||||||||||||||
| Non-accrual loans (note 1) |
$ | 24,219 | $ | 24,456 | $ | 25,448 | $ | 28,658 | $ | 31,769 | ||||||||||
| Past due loans 90 days or more and still accruing interest (note 1) |
615 | 316 | 293 | 121 | 118 | |||||||||||||||
|
|
|
|
|
|
|
|
|
|
|
|||||||||||
| Total non-performing loans (“NPLs”) (note 1) |
24,834 | 24,772 | 25,741 | 28,779 | 31,887 | |||||||||||||||
| Other real estate owned (OREO) (note 1) |
5,469 | 6,186 | 6,875 | 5,858 | 6,855 | |||||||||||||||
| Repossessed assets other than real estate (note 1) |
223 | 380 | 770 | 996 | 641 | |||||||||||||||
|
|
|
|
|
|
|
|
|
|
|
|||||||||||
| Total non-performing assets (“NPAs”) (note 1) |
$ | 30,526 | $ | 31,338 | $ | 33,386 | $ | 35,633 | $ | 39,383 | ||||||||||
| Non-performing loans as percentage of total loans not covered by FDIC loss share agreements |
2.11 | % | 2.18 | % | 2.26 | % | 2.54 | % | 2.83 | % | ||||||||||
| Non-performing assets as percentage of total assets |
1.30 | % | 1.31 | % | 1.41 | % | 1.50 | % | 1.61 | % | ||||||||||
| Non-performing assets as percentage of loans and OREO plus other repossessed assets (note 1) |
2.58 | % | 2.74 | % | 2.91 | % | 3.12 | % | 3.47 | % | ||||||||||
| Net charge-offs (recoveries) (note 1) |
$ | 2,293 | $ | 1,068 | $ | 1,828 | $ | 1,267 | $ | 2,721 | ||||||||||
| Net charge-offs as a percentage of average loans for the period (note 1) |
0.20 | % | 0.09 | % | 0.16 | % | 0.11 | % | 0.25 | % | ||||||||||
| Net charge-offs as a percentage of average loans for the period on an annualized basis (note 1) |
0.80 | % | 0.36 | % | 0.64 | % | 0.44 | % | 1.00 | % | ||||||||||
| Loans past due 30 thru 89 days and accruing interest as a percentage of total loans (note 1) |
0.99 | % | 1.06 | % | 0.65 | % | 0.87 | % | 0.61 | % | ||||||||||
| Allowance for loan losses as percentage of NPLs (note 1) |
88 | % | 91 | % | 93 | % | 83 | % | 74 | % | ||||||||||
| Troubled debt restructure (“TDRs”) (note 2) |
$ | 13,103 | $ | 14,073 | $ | 14,660 | $ | 15,428 | $ | 11,722 | ||||||||||
| Impaired loans that were not TDRs |
25,590 | 26,031 | 33,519 | 29,383 | 36,373 | |||||||||||||||
|
|
|
|
|
|
|
|
|
|
|
|||||||||||
| Total impaired loans |
38,693 | 40,104 | 48,179 | 44,811 | 48,095 | |||||||||||||||
| Non impaired loans |
1,140,066 | 1,096,911 | 1,091,389 | 1,089,628 | 1,080,168 | |||||||||||||||
|
|
|
|
|
|
|
|
|
|
|
|||||||||||
| Total loans not covered by FDIC loss share agreements |
1,178,759 | 1,137,015 | 1,139,568 | 1,134,439 | 1,128,263 | |||||||||||||||
| Total loans covered by FDIC loss share agreements |
256,828 | 277,971 | 296,295 | 309,743 | 327,325 | |||||||||||||||
|
|
|
|
|
|
|
|
|
|
|
|||||||||||
| Total loans |
$ | 1,435,587 | $ | 1,414,986 | $ | 1,435,863 | $ | 1,444,182 | $ | 1,455,588 | ||||||||||
|
|
|
|
|
|
|
|
|
|
|
|||||||||||
| As of or for the quarter ended: |
6/30/13 | 3/31/13 | 12/31/12 | 9/30/12 | 6/30/12 | |||||||||||||||
| Allowance for loan losses for loans not covered by FDIC loss share agreements |
||||||||||||||||||||
| Specific loan loss allowance- impaired loans |
$ | 600 | $ | 990 | $ | 1,022 | $ | 949 | $ | 634 | ||||||||||
| General loan loss allowance- non impaired |
21,200 | 21,641 | 23,011 | 23,070 | 23,000 | |||||||||||||||
|
|
|
|
|
|
|
|
|
|
|
|||||||||||
| Total allowance for loan losses |
$ | 21,800 | $ | 22,631 | $ | 24,033 | $ | 24,019 | $ | 23,634 | ||||||||||
| Allowance for loan loss percentage of period end loans: |
||||||||||||||||||||
| Impaired loans (note 1) |
1.55 | % | 2.47 | % | 2.12 | % | 2.12 | % | 1.32 | % | ||||||||||
| All other non impaired loans (note 1) |
1.86 | % | 1.97 | % | 2.11 | % | 2.12 | % | 2.13 | % | ||||||||||
|
|
|
|
|
|
|
|
|
|
|
|||||||||||
| Total loans (note 1) |
1.85 | % | 1.99 | % | 2.11 | % | 2.12 | % | 2.09 | % | ||||||||||
|
|
|
|
|
|
|
|
|
|
|
|||||||||||
| Note 1: | Excludes loans, OREO and other repossessed assets covered by FDIC loss share agreements. |
| Note 2: | The Company has approximately $13,103 of TDRs. Of this amount $9,345 are performing pursuant to their modified terms, and $3,758 are not performing and have been placed on non-accrual status and included in non performing loans (“NPLs”). Current accounting standards require TDRs to be included in our impaired loans, whether they are performing or not performing. Only non performing TDRs are included in our NPLs. |
15
As shown in the table on the previous page, the largest component of non-performing assets is non-accrual loans. The Company’s total non-accrual loans decreased from $24,456 at March 31, 2013 to $24,219 at June 30, 2013. Non-accrual loans at June 30, 2013 are further delineated by collateral category and number of loans in the table below.
| collateral category (unaudited) |
total amount | percentage of total non-accrual loans |
number of non-accrual loans in category |
|||||||||
| Residential real estate loans |
$ | 13,115 | 54 | % | 99 | |||||||
| Commercial real estate loans |
7,364 | 30 | % | 31 | ||||||||
| Land, development, construction loans |
1,811 | 8 | % | 13 | ||||||||
| Non real estate commercial loans |
1,661 | 7 | % | 22 | ||||||||
| Non real estate consumer and other loans |
268 | 1 | % | 24 | ||||||||
|
|
|
|
|
|
|
|||||||
| Total non-accrual loans at June 30, 2013 |
$ | 24,219 | 100 | % | 189 | |||||||
|
|
|
|
|
|
|
|||||||
The second largest component of non-performing assets after non-accrual loans is OREO, excluding OREO covered by FDIC loss share agreements. At June 30, 2013, total OREO was $34,001. Of this amount, $28,532 was acquired pursuant to the acquisition of five failed financial institutions. The acquired OREO is covered by FDIC loss share agreements. Pursuant to the terms of the loss sharing agreements, the FDIC is obligated to reimburse the Company for 80% of losses with respect to the covered OREO beginning with the first dollar of loss incurred, subject to the terms of the agreements. The Company will reimburse the FDIC for its share of recoveries with respect to the covered OREO. The loss sharing agreements applicable to single family residential mortgage loans provide for FDIC loss sharing and the Company reimbursement to the FDIC for recoveries for ten years. The loss sharing agreements applicable to commercial loans provide for FDIC loss sharing for five years and Company reimbursement to the FDIC for a total of eight years for recoveries.
OREO not covered by FDIC loss share agreements is $5,469 at June 30, 2013. OREO is carried at the lower of cost or market less the estimated cost to sell. Further declines in real estate values can affect the market value of these assets. Any further decline in market value beyond its cost basis is recorded as a current expense in the Company’s Statement of Operations. The current carrying value represents approximately 44% of the unpaid legal balance of the related loan when the asset was repossessed. OREO is further delineated in the table below.
| (unaudited) Description of repossessed real estate |
carrying amount at June 30, 2013 |
|||
| 8 single family homes |
$ | 754 | ||
| 10 residential building lots |
900 | |||
| 14 commercial buildings |
2,194 | |||
| Land / various acreages |
1,621 | |||
|
|
|
|||
| Total, excluding OREO covered by FDIC loss share agreements |
$ | 5,469 | ||
16
Deposit activity
During the quarter, total deposits decreased by $36,904 (time deposits decreased by $22,941 and non-time deposits decreased by $13,963). The loan to deposit ratio was approximately 72.6% at quarter end. The cost of interest bearing deposits decreased 1 bps to 0.37% in the current quarter compared to 0.38% in the prior quarter. The overall cost of total deposits (i.e. includes non-interest bearing checking accounts) also decreased by 1 bps to 0.27% in the current quarter compared to 0.28% in the prior quarter. The table below summarizes the Company’s deposit mix over the periods indicated.
| Deposit mix (unaudited) |
||||||||||||||||||||
| For the quarter ended: |
6/30/13 | 3/31/13 | 12/31/12 | 9/30/12 | 6/30/12 | |||||||||||||||
| Checking accounts |
||||||||||||||||||||
| Non-interest bearing |
$ | 555,721 | $ | 565,404 | $ | 519,510 | $ | 504,528 | $ | 500,871 | ||||||||||
| Interest bearing |
456,660 | 459,528 | 452,961 | 410,517 | 408,877 | |||||||||||||||
| Savings deposits |
241,609 | 239,127 | 238,216 | 240,326 | 243,390 | |||||||||||||||
| Money market accounts |
312,891 | 316,785 | 311,241 | 314,441 | 325,751 | |||||||||||||||
| Time deposits |
409,811 | 432,752 | 475,304 | 528,037 | 577,208 | |||||||||||||||
|
|
|
|
|
|
|
|
|
|
|
|||||||||||
| Total deposits |
$ | 1,976,692 | $ | 2,013,596 | $ | 1,997,232 | $ | 1,997,849 | $ | 2,056,097 | ||||||||||
|
|
|
|
|
|
|
|
|
|
|
|||||||||||
| Non time deposits as percentage of total deposits |
79 | % | 79 | % | 76 | % | 74 | % | 72 | % | ||||||||||
| Time deposits as percentage of total deposits |
21 | % | 21 | % | 24 | % | 26 | % | 28 | % | ||||||||||
|
|
|
|
|
|
|
|
|
|
|
|||||||||||
| Total deposits |
100 | % | 100 | % | 100 | % | 100 | % | 100 | % | ||||||||||
|
|
|
|
|
|
|
|
|
|
|
|||||||||||
17
Presented below are condensed consolidated balance sheets and average balance sheets for the periods indicated.
| Condensed Consolidated Balance Sheets (unaudited) |
||||||||||||||||||||
| For the quarter ended: |
6/30/13 | 3/31/13 | 12/31/12 | 9/30/12 | 6/30/12 | |||||||||||||||
| Cash and due from banks |
$ | 21,160 | $ | 20,823 | $ | 19,160 | $ | 20,259 | $ | 23,444 | ||||||||||
| Fed funds sold and Fed Res Bank deposits |
82,395 | 155,872 | 117,588 | 82,872 | 93,361 | |||||||||||||||
| Trading securities |
— | — | 5,048 | — | 1,061 | |||||||||||||||
| Investments securities, available for sale |
492,087 | 460,534 | 425,758 | 458,796 | 474,105 | |||||||||||||||
| Loans held for sale |
1,760 | 2,131 | 2,709 | 1,707 | 1,692 | |||||||||||||||
| Loans covered by FDIC loss share agreements |
256,828 | 277,971 | 296,295 | 319,748 | 337,442 | |||||||||||||||
| Loans not covered by FDIC loss share agreements |
1,178,759 | 1,137,015 | 1,139,568 | 1,134,439 | 1,128,263 | |||||||||||||||
| Allowance for loan losses |
(23,820 | ) | (25,254 | ) | (26,682 | ) | (26,341 | ) | (25,183 | ) | ||||||||||
| FDIC indemnification assets |
88,716 | 97,958 | 119,289 | 121,871 | 132,880 | |||||||||||||||
| Premises and equipment, net |
96,506 | 96,946 | 97,954 | 97,749 | 100,902 | |||||||||||||||
| Goodwill |
44,924 | 44,924 | 44,924 | 44,924 | 44,930 | |||||||||||||||
| Core deposit intangible |
5,441 | 5,691 | 5,944 | 6,229 | 6,522 | |||||||||||||||
| Bank owned life insurance |
48,634 | 48,296 | 47,957 | 47,601 | 47,241 | |||||||||||||||
| OREO covered by FDIC loss share agreements |
28,532 | 29,434 | 26,783 | 25,967 | 30,243 | |||||||||||||||
| OREO not covered by FDIC loss share agreements |
5,469 | 6,186 | 6,875 | 5,858 | 6,855 | |||||||||||||||
| Other assets |
27,962 | 30,712 | 34,070 | 35,936 | 36,805 | |||||||||||||||
|
|
|
|
|
|
|
|
|
|
|
|||||||||||
| TOTAL ASSETS |
$ | 2,355,353 | $ | 2,389,239 | $ | 2,363,240 | $ | 2,377,615 | $ | 2,440,563 | ||||||||||
|
|
|
|
|
|
|
|
|
|
|
|||||||||||
| Deposits |
$ | 1,976,692 | $ | 2,013,596 | $ | 1,997,232 | $ | 1,997,849 | $ | 2,056,097 | ||||||||||
| Federal funds purchased |
53,274 | 45,130 | 38,932 | 46,574 | 45,337 | |||||||||||||||
| Other borrowings |
38,873 | 37,398 | 35,762 | 38,005 | 50,725 | |||||||||||||||
| Other liabilities |
15,098 | 16,890 | 17,783 | 21,338 | 19,031 | |||||||||||||||
| Common stockholders’ equity |
271,416 | 276,225 | 273,531 | 273,849 | 269,373 | |||||||||||||||
|
|
|
|
|
|
|
|
|
|
|
|||||||||||
| TOTAL LIABILITIES AND STOCKHOLDERS’ EQUITY |
$ | 2,355,353 | $ | 2,389,239 | $ | 2,363,240 | $ | 2,377,615 | $ | 2,440,563 | ||||||||||
|
|
|
|
|
|
|
|
|
|
|
|||||||||||
| Condensed Consolidated Average Balance Sheets (unaudited) |
||||||||||||||||||||
| For quarter ended: |
6/30/13 | 3/31/13 | 12/31/12 | 9/30/12 | 6/30/12 | |||||||||||||||
| Federal funds sold and other |
$ | 179,982 | $ | 137,776 | $ | 138,236 | $ | 102,627 | $ | 116,153 | ||||||||||
| Security investments |
437,815 | 460,228 | 434,059 | 478,087 | 513,854 | |||||||||||||||
| Loans covered by FDIC loss share agreements |
264,769 | 284,151 | 309,502 | 327,847 | 347,191 | |||||||||||||||
| Loans not covered by FDIC loss share agreements |
1,155,737 | 1,136,076 | 1,138,127 | 1,129,783 | 1,122,268 | |||||||||||||||
| Allowance for loan losses |
(23,962 | ) | (26,782 | ) | (26,930 | ) | (25,893 | ) | (26,254 | ) | ||||||||||
| All other assets |
367,969 | 398,334 | 395,267 | 401,145 | 413,498 | |||||||||||||||
|
|
|
|
|
|
|
|
|
|
|
|||||||||||
| TOTAL ASSETS |
$ | 2,382,310 | $ | 2,389,783 | $ | 2,388,261 | $ | 2,413,596 | $ | 2,486,710 | ||||||||||
|
|
|
|
|
|
|
|
|
|
|
|||||||||||
| Deposits- interest bearing |
$ | 1,433,806 | $ | 1,462,511 | $ | 1,490,327 | $ | 1,532,538 | $ | 1,590,953 | ||||||||||
| Deposits- non interest bearing |
574,345 | 545,579 | 521,890 | 503,654 | 507,138 | |||||||||||||||
| Federal funds purchased |
35,619 | 44,662 | 44,520 | 47,885 | 54,131 | |||||||||||||||
| Other borrowings |
40,812 | 37,356 | 36,972 | 40,164 | 51,328 | |||||||||||||||
| Other liabilities |
22,135 | 25,200 | 20,860 | 16,655 | 15,720 | |||||||||||||||
| Stockholders’ equity |
275,593 | 274,475 | 273,692 | 272,700 | 267,440 | |||||||||||||||
|
|
|
|
|
|
|
|
|
|
|
|||||||||||
| TOTAL LIABILITIES AND STOCKHOLDERS’ EQUITY |
$ | 2,382,310 | $ | 2,389,783 | $ | 2,388,261 | $ | 2,413,596 | $ | 2,486,710 | ||||||||||
|
|
|
|
|
|
|
|
|
|
|
|||||||||||
18
Non interest income and non interest expense
The table below summarizes the Company’s non-interest income for the periods indicated.
| Quarterly Condensed Consolidated Non Interest Income (unaudited) |
||||||||||||||||||||
| For the quarter ended: |
6/30/13 | 3/31/13 | 12/31/12 | 9/30/12 | 6/30/12 | |||||||||||||||
| Income from correspondent banking and bond sales division |
$ | 4,904 | $ | 6,140 | $ | 6,450 | $ | 8,606 | $ | 9,966 | ||||||||||
| Other correspondent banking related revenue |
705 | 865 | 743 | 847 | 741 | |||||||||||||||
| Wealth management related revenue |
1,130 | 1,070 | 942 | 1,000 | 950 | |||||||||||||||
| Service charges on deposit accounts |
2,081 | 1,819 | 1,825 | 1,695 | 1,595 | |||||||||||||||
| Debit, prepaid, ATM and merchant card related fees |
1,342 | 1,285 | 1,242 | 1,160 | 1,172 | |||||||||||||||
| BOLI income |
338 | 339 | 355 | 360 | 363 | |||||||||||||||
| Other service charges and fees |
231 | 302 | 278 | 464 | 147 | |||||||||||||||
| Gain on sale of securities available for sale |
1,008 | 30 | 420 | 675 | 726 | |||||||||||||||
|
|
|
|
|
|
|
|
|
|
|
|||||||||||
| Subtotal |
$ | 11,739 | $ | 11,850 | $ | 12,255 | $ | 14,807 | $ | 15,660 | ||||||||||
| FDIC indemnification asset – amortization (see explanation below) |
(3,272 | ) | (2,199 | ) | (1,540 | ) | (671 | ) | (348 | ) | ||||||||||
| FDIC indemnification income |
1,396 | 628 | 2,025 | 2,199 | 1,229 | |||||||||||||||
|
|
|
|
|
|
|
|
|
|
|
|||||||||||
| Total non-interest income |
$ | 9,863 | $ | 10,279 | $ | 12,740 | $ | 16,335 | $ | 16,541 | ||||||||||
|
|
|
|
|
|
|
|
|
|
|
|||||||||||
The FDIC indemnification asset (“IA”) is producing amortization (versus accretion) due to reductions in the estimated losses in the FDIC covered loan portfolio. To the extent current projected losses in the covered loan portfolio are less than originally projected losses, the related projected reimbursements from the FDIC contemplated in the IA are less, which produces a negative income accretion in non-interest income. This event corresponds to the increase in yields in the FDIC covered loan portfolio, although there is not perfect correlation. Higher expected cash flows (i.e. less expected future losses) on the loan side of the equation is accreted into interest income over the life of the related loan pool. The lower expected reimbursement from the FDIC (i.e. 80% of the lower expected future losses) is amortized over the lesser of the remaining life of the related loan pool(s) or the remaining term of the loss share period.
When a FDIC covered OREO property is sold at a loss, the loss is included in non-interest expense as loss on sale of OREO, and approximately eighty percent of the loss is recorded as FDIC indemnification income and included in non-interest income. Eighty percent of any related loan pool impairments also are reflected in this non-interest income account.
19
The table below summarizes the Company’s non-interest expense for the periods indicated.
| Quarterly Condensed Consolidated Non Interest Expense (unaudited) |
||||||||||||||||||||
| For the quarter ended: |
6/30/13 | 3/31/13 | 12/31/12 | 9/30/12 | 6/30/12 | |||||||||||||||
| Employee salaries and wages |
$ | 12,142 | $ | 12,665 | $ | 12,580 | $ | 14,083 | $ | 15,650 | ||||||||||
| Employee incentive/bonus compensation accrued |
1,171 | 1,094 | 1,032 | 1,247 | 897 | |||||||||||||||
| Employee stock based compensation expense |
143 | 146 | 153 | 154 | 164 | |||||||||||||||
| Deferred compensation expense |
134 | 141 | 124 | 131 | 123 | |||||||||||||||
| Health insurance and other employee benefits |
796 | 951 | 878 | 1,034 | 1,052 | |||||||||||||||
| Payroll taxes |
733 | 1,017 | 610 | 718 | 814 | |||||||||||||||
| 401K employer contributions |
308 | 367 | 236 | 268 | 303 | |||||||||||||||
| Other employee related expenses |
344 | 296 | 336 | 298 | 231 | |||||||||||||||
| Incremental direct cost of loan origination |
(537 | ) | (437 | ) | (228 | ) | (227 | ) | (184 | ) | ||||||||||
|
|
|
|
|
|
|
|
|
|
|
|||||||||||
| Total salaries, wages and employee benefits |
15,234 | 16,240 | 15,721 | 17,706 | 19,050 | |||||||||||||||
|
|
|
|
|
|
|
|
|
|
|
|||||||||||
| Loss (gain) on sale of OREO |
177 | 76 | (17 | ) | 33 | (120 | ) | |||||||||||||
| Loss (gain) on sale of FDIC covered OREO |
386 | (77 | ) | 548 | 120 | 349 | ||||||||||||||
| Valuation write down of OREO |
295 | 342 | 287 | 368 | 418 | |||||||||||||||
| Valuation write down of FDIC covered OREO |
1,385 | 645 | 1,146 | 1,367 | 417 | |||||||||||||||
| Loss (gain) on repossessed assets other than real estate |
104 | 242 | (52 | ) | 37 | 40 | ||||||||||||||
| Loan put back expense |
— | 4 | 734 | 852 | 22 | |||||||||||||||
| Foreclosure and repossession related expenses |
438 | 441 | 355 | 858 | 649 | |||||||||||||||
| Foreclosure and repo expense, FDIC (note 1) |
349 | 348 | 572 | 209 | 423 | |||||||||||||||
|
|
|
|
|
|
|
|
|
|
|
|||||||||||
| Total credit related expenses |
3,134 | 2,021 | 3,573 | 3,844 | 2,198 | |||||||||||||||
|
|
|
|
|
|
|
|
|
|
|
|||||||||||
| Occupancy expense |
1,942 | 1,892 | 1,909 | 2,246 | 2,481 | |||||||||||||||
| Depreciation of premises and equipment |
1,455 | 1,497 | 1,530 | 1,465 | 1,416 | |||||||||||||||
| Supplies, stationary and printing |
285 | 288 | 245 | 261 | 303 | |||||||||||||||
| Marketing expenses |
586 | 528 | 655 | 716 | 609 | |||||||||||||||
| Data processing expenses |
912 | 884 | 1,131 | 890 | 962 | |||||||||||||||
| Legal, auditing and other professional fees |
844 | 783 | 755 | 551 | 601 | |||||||||||||||
| Bank regulatory related expenses |
635 | 581 | 448 | 623 | 658 | |||||||||||||||
| Postage and delivery |
267 | 285 | 279 | 282 | 264 | |||||||||||||||
| ATM and debit card related expenses |
428 | 511 | 377 | 312 | 256 | |||||||||||||||
| Amortization of CDI |
250 | 253 | 284 | 294 | 299 | |||||||||||||||
| Internet and telephone banking |
239 | 224 | 235 | 209 | 224 | |||||||||||||||
| Put back option amortization expense |
— | 37 | 134 | 182 | 182 | |||||||||||||||
| Correspondent account and Federal Reserve charges |
120 | 109 | 115 | 133 | 146 | |||||||||||||||
| Conferences, seminars, education and training |
138 | 153 | 114 | 105 | 161 | |||||||||||||||
| Director fees |
102 | 102 | 103 | 100 | 80 | |||||||||||||||
| Travel expenses |
104 | 74 | 114 | 112 | 63 | |||||||||||||||
| Impairment of bank property held for sale |
— | — | — | 449 | 165 | |||||||||||||||
| Other expenses |
698 | 628 | 753 | 1,049 | 926 | |||||||||||||||
|
|
|
|
|
|
|
|
|
|
|
|||||||||||
| Subtotal |
27,373 | 27,090 | 28,475 | 31,529 | 31,044 | |||||||||||||||
| Merger, acquisition and conversion related expenses |
— | — | 55 | 177 | 614 | |||||||||||||||
|
|
|
|
|
|
|
|
|
|
|
|||||||||||
| Total non- interest expense |
$ | 27,373 | $ | 27,090 | $ | 28,530 | $ | 31,706 | $ | 31,658 | ||||||||||
|
|
|
|
|
|
|
|
|
|
|
|||||||||||
| note 1: | These are foreclosure and repossession related expenses related to FDIC covered assets, and are shown net of FDIC reimbursable amounts pursuant to FDIC loss share agreements. |
20
Explanation of Certain Unaudited Non-GAAP Financial Measures
This press release contains financial information determined by methods other than Generally Accepted Accounting Principles (“GAAP”). The financial highlights provide reconciliations between GAAP interest income, net interest income and tax equivalent basis interest income and net interest income, as well as total stockholders’ equity and tangible common equity. It also reconciles income before income taxes and Pre-tax Pre-Provision (“PTPP”) earnings. Management uses these non-GAAP financial measures in its analysis of the Company’s performance and believes these presentations provide useful supplemental information, and a clearer understanding of the Company’s performance. The Company believes the non-GAAP measures enhance investors’ understanding of the Company’s business and performance. These measures are also useful in understanding performance trends and facilitate comparisons with the performance of other financial institutions. The limitations associated with operating measures are the risk that persons might disagree as to the appropriateness of items comprising these measures and that different companies might calculate these measures differently. The Company provides reconciliations between GAAP and these non-GAAP measures. These disclosures should not be considered an alternative to GAAP.
Reconciliation of GAAP to non-GAAP Measures (unaudited):
| 2Q13 | 1Q13 | 2Q12 | ||||||||||
| Interest income, as reported (GAAP) |
$ | 24,487 | $ | 24,378 | $ | 24,479 | ||||||
| tax equivalent adjustments |
342 | 287 | 340 | |||||||||
|
|
|
|
|
|
|
|||||||
| Interest income (tax equivalent) |
$ | 24,829 | $ | 24,665 | $ | 24,819 | ||||||
|
|
|
|
|
|
|
|||||||
| Net interest income, as reported (GAAP) |
$ | 22,980 | $ | 22,822 | $ | 22,175 | ||||||
| tax equivalent adjustments |
342 | 287 | 340 | |||||||||
|
|
|
|
|
|
|
|||||||
| Net interest income (tax equivalent) |
$ | 23,322 | $ | 23,109 | $ | 22,515 | ||||||
|
|
|
|
|
|
|
|||||||
| 6/30/13 | 3/31/13 | 12/31/12 | 9/30/12 | 6/30/12 | ||||||||||||||||
| Total stockholders’ equity (GAAP) |
$ | 271,416 | $ | 276,225 | $ | 273,531 | $ | 273,849 | $ | 269,373 | ||||||||||
| Goodwill |
(44,924 | ) | (44,924 | ) | (44,924 | ) | (44,924 | ) | (44,930 | ) | ||||||||||
| Core deposit intangible |
(5,441 | ) | (5,691 | ) | (5,944 | ) | (6,229 | ) | (6,522 | ) | ||||||||||
| Trust intangible |
(1,259 | ) | (1,309 | ) | (1,363 | ) | (1,422 | ) | (1,481 | ) | ||||||||||
|
|
|
|
|
|
|
|
|
|
|
|||||||||||
| Tangible common equity |
$ | 219,792 | $ | 224,301 | $ | 221,300 | $ | 221,274 | $ | 216,440 | ||||||||||
|
|
|
|
|
|
|
|
|
|
|
|||||||||||
| 2Q13 | 1Q13 | 4Q12 | 3Q12 | 2Q12 | ||||||||||||||||
| Income before income tax (GAAP) |
$ | 4,096 | $ | 6,371 | $ | 3,580 | $ | 3,871 | $ | 5,272 | ||||||||||
| exclude provision for loan losses |
1,374 | (360 | ) | 2,169 | 2,425 | 1,894 | ||||||||||||||
| FDIC income from pool impairment |
70 | 21 | (261 | ) | (619 | ) | (886 | ) | ||||||||||||
| exclude other credit related costs |
3,134 | 2,021 | 3,573 | 3,844 | 2,198 | |||||||||||||||
| OREO indemnification income from FDIC |
(1,466 | ) | (649 | ) | (1,764 | ) | (1,580 | ) | (343 | ) | ||||||||||
| exclude gain on sale of AFS securities |
(1,008 | ) | (30 | ) | (420 | ) | (675 | ) | (726 | ) | ||||||||||
| exclude non-recurring items: |
||||||||||||||||||||
| impairment bank owned property held for sale |
— | — | — | 449 | 165 | |||||||||||||||
| gain on sale of bank owned property held for sale |
— | (31 | ) | — | — | — | ||||||||||||||
| acquisition and conversion related expenses |
— | — | 55 | 177 | 614 | |||||||||||||||
|
|
|
|
|
|
|
|
|
|
|
|||||||||||
| PTPP earnings |
$ | 6,200 | $ | 7,343 | $ | 6,932 | $ | 7,892 | $ | 8,188 | ||||||||||
|
|
|
|
|
|
|
|
|
|
|
|||||||||||
21
About CenterState Banks, Inc.
The Company, headquartered in Davenport, Florida, between Orlando and Tampa, is a bank holding company that was formed in June 2000 as part of a merger of three independent commercial banks. Currently, the Company operates through one subsidiary bank with 55 full service branch banking locations in 18 counties throughout central Florida. Through its subsidiary bank the Company provides a range of consumer and commercial banking services to individuals, businesses and industries.
In addition to providing traditional deposit and lending products and services to its commercial and retail customers in central Florida, the Company also operates a correspondent banking and bond sales division. The division is integrated with and part of the Company’s subsidiary bank located in Winter Haven, Florida, although the majority of the bond salesmen, traders and operations personnel are physically housed in leased facilities located in Birmingham, Alabama, Atlanta, Georgia and Winston-Salem, North Carolina. The customer base includes small to medium size financial institutions primarily located in southeastern United States.
For additional information contact Ernest S. Pinner, CEO, John C. Corbett, EVP, or James J. Antal, CFO, at 863-419-7750.
“Safe Harbor” Statement under the Private Securities Litigation Reform Act of 1995:
Some of the statements in this report constitute forward-looking statements, within the meaning of the Securities Act of 1933 and the Securities Exchange Act of 1934. These statements related to future events, other future financial and operating performance, costs, revenues, economic conditions in our markets, loan performance, credit risks, collateral values and credit conditions, or business strategies, including expansion and acquisition activities and may be identified by terminology such as “may,” “will,” “should,” “expects,” “scheduled,” “plans,” “intends,” “anticipates,” “believes,” “estimates,” “potential,” or “continue” or the negative of such terms or other comparable terminology. Actual events or results may differ materially. In evaluating these statements, you should specifically consider the factors described throughout this report. We cannot assure you that future results, levels of activity, performance or goals will be achieved, and actual results may differ from those set forth in the forward looking statements.
Forward-looking statements, with respect to our beliefs, plans, objectives, goals, expectations, anticipations, estimates and intentions, involve known and unknown risks, uncertainties and other factors, which may be beyond our control, and which may cause the actual results, performance or achievements of the Company or the Bank to be materially different from future results, performance or achievements expressed or implied by such forward-looking statements. You should not expect us to update any forward-looking statements. All written or oral forward-looking statements attributable to us are expressly qualified in their entirety by this cautionary notice, including, without limitation, those risks and uncertainties described in our annual report on Form 10-K for the year ended December 31, 2012, and otherwise in our SEC reports and filings.
22