Attached files
| file | filename |
|---|---|
| 8-K - AMERICAN CAMPUS COMMUNITIES, INC. 8-K - AMERICAN CAMPUS COMMUNITIES INC | a50645453.htm |
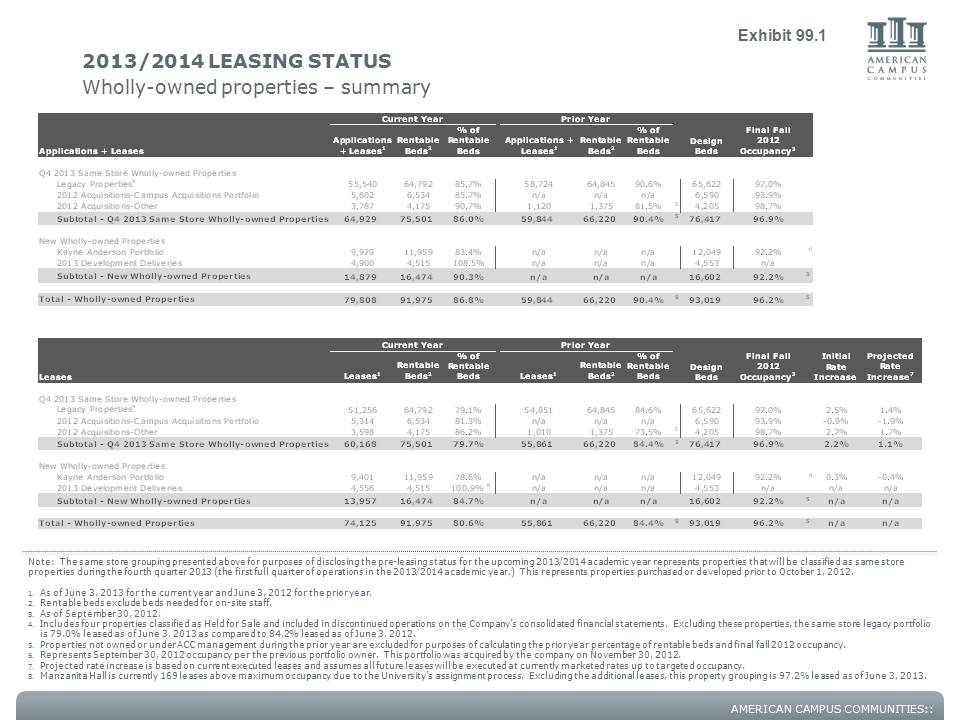
Exhibit 99.1 AMERICAN CAMPUS COMMUNITIES:: 2013/2014 LEASING STATUS Wholly-owned properties – summary Current Year Prior Year Applications + Leases Applications + Leases1 Rentable Beds2 % of Rentable Beds Applications +Leases1 Rentable Beds2 % of Rentable Beds Design Beds Final Fall 2012 Occupancy3 Q4 2013 Same Store Wholly-owned Properties Legacy Properties4 55,540 64,792 85.7% 58,724 64,845 90.6% 65,622 97.0% 2012 Acquisitions-Campus Acquisitions Portfolio 5,602 6,534 85.7% n/a n/a n/a 6,590 93.9% 2012 Acquisitions-Other 3,787 4,175 90.7% 1,120 1,375 81.5% 5 4,205 98.7% Subtotal - Q4 2013 Same Store Wholly-owned Properties 64,929 75,501 86.0% 59,844 66,220 90.4% 5 76,417 96.9% New Wholly-owned Properties Kayne Anderson Portfolio 9,979 11,959 83.4% n/a n/a n/a 12,049 92.2% 6 2013 Development Deliveries 4,900 4,515 108.5% n/a n/a n/a 4,553 n/a Subtotal - New Wholly-owned Properties 14,879 16,474 90.3% n/a n/a n/a 16,602 92.2% 5 Total - Wholly-owned Properties 79,808 91,975 86.8% 59,844 66,220 90.4% 5 93,019 96.2% 5 Current Year Prior Year Leases Leases1 Rentable Beds2 % of Rentable Beds Leases1 Rentable Beds2 % of Rentable Beds Design Beds Final Fall 2012 Occupancy3 Initial Rate Increase Projected Rate Increase7 Q4 2013 Same Store Wholly-owned Properties Legacy Properties4 51,256 64,792 79.1% 54,851 64,845 84.6% 65,622 97.0% 2.5% 1.4% 2012 Acquisitions-Campus Acquisitions Portfolio 5,314 6,534 81.3% n/a n/a n/a 6,590 93.9% -0.9% -1.9% 2012 Acquisitions-Other 3,598 4,175 86.2% 1,010 1,375 73.5% 5 4,205 98.7% 2.7% 1.7% Subtotal - Q4 2013 Same Store Wholly-owned Properties 60,168 75,501 79.7% 55,861 66,220 84.4% 5 76,417 96.9% 2.2% 1.1% New Wholly-owned Properties Kayne Anderson Portfolio 9,401 11,959 78.6% n/a n/a n/a 12,049 92.2% 6 0.3% -0.4% 2013 Development Deliveries 4,556 4,515 100.9% 8 n/a n/a n/a 4,553 n/a n/a n/a Subtotal - New Wholly-owned Properties 13,957 16,474 84.7% n/a n/a n/a 16,602 92.2% 5 n/a n/a Total - Wholly-owned Properties 74,125 91,975 80.6% 55,861 66,220 84.4% 5 93,019 96.2% 5 n/a n/a Note: The same store grouping presented above for purposes of disclosing the pre-leasing status for the upcoming 2013/2014 academic year represents properties that will be classified as same store properties during the fourth quarter 2013 (the first full quarter of operations in the 2013/2014 academic year.) This represents properties purchased or developed prior to October 1, 2012. 1. As of June 3, 2013 for the current year and June 3, 2012 for the prior year. 2. Rentable beds exclude beds needed for on-site staff. 3. As of September 30, 2012. 4. Includes four properties classified as Held for Sale and included in discontinued operations on the Company’s consolidated financial statements. Excluding these properties, the same store legacy portfolio is 79.0% leased as of June 3, 2013 as compared to 84.2% leased as of June 3, 2012. 5. Properties not owned or under ACC management during the prior year are excluded for purposes of calculating the prior year percentage of rentable beds and final fall 2012 occupancy. 6. Represents September 30, 2012 occupancy per the previous portfolio owner. This portfolio was acquired by the company on November 30, 2012. 7. Projected rate increase is based on current executed leases and assumes all future leases will be executed at currently marketed rates up to targeted occupancy. 8. Manzanita Hall is currently 169 leases above maximum occupancy due to the University’s assignment process. Excluding the additional leases, this property grouping is 97.2% leased as of June 3, 2013.