Attached files
| file | filename |
|---|---|
| 8-K - 8-K - CVB FINANCIAL CORP | d539987d8k.htm |
 1Q
Results 2013 | cbbank.com th
38
Annual Shareholder’s Meeting
May 15
2013
th
Exhibit 99.1 |
 Safe
Harbor Certain
matters
set
forth
herein
(including
the
exhibits
hereto)
constitute
forward-looking
statements
within
the
meaning
of
the
Private
Securities
Litigation
Reform
Act
of
1995,
including
forward-looking
statements
relating
to
the
Company's
current
business
plans
and
expectations
regarding
future
operating
results.
These
forward-looking
statements
are
subject
to
risks
and
uncertainties
that
could
cause
actual
results,
performance
or
achievements
to
differ
materially
from
those
projected.
These
risks
and
uncertainties
include,
but
are
not
limited
to,
local,
regional,
national
and
international
economic
conditions
and
events
and
the
impact
they
may
have
on
us
and
our
customers;
ability
to
attract
deposits
and
other
sources
of
liquidity;
ability
to
make
loans
and
generate
assets;
oversupply
of
inventory
and
continued
deterioration
in
values
of
real
estate
in
California
and
other
states
where
our
bank
makes
loans,
both
residential and commercial; a prolonged slowdown in business, manufacturing, retail
or construction activity; changes in the financial performance and/or
condition
of
our
borrowers;
changes
in
the
level
of
non-performing
assets
and
charge-offs;
the
effect
of
changes
in
laws
and
regulations
(including
laws
and
regulations
concerning
taxes,
banking,
business
and
consumer
credit,
capital
levels,
limits
on
bank
products
and
fees,
securities,
executive
compensation
and
insurance)
with
which
we
and
our
subsidiaries
must
comply;
changes
in
estimates
of
future
reserve
requirements
based
upon
the
periodic
review
thereof
under
relevant
regulatory
and
accounting
requirements;
inflation,
interest
rate,
securities
market
and
monetary
fluctuations;
the
availability
and
effectiveness
of
hedging
instruments
and
strategies;
political
instability;
acts
of
war
or
terrorism,
or
natural
disasters,
such
as
earthquakes,
or
the
effects
of
pandemic
flu;
the
timely
development
and
acceptance
of
new
banking
products
and
services
and
perceived
overall
value
of
these
products
and
services
by
users;
changes
in
consumer
spending,
borrowing
and
savings
habits;
technological
changes
(including
mobile
banking
and
cloud
computing);
threats
to
the
stability
and
security
of
our
technology
hardware
and
software,
and
to
the
stability
and
security
of
any
related
vendor
or
customer
hardware
and
software;
the
ability
to
increase
market
share
and
control
expenses;
changes
in
the
competitive
environment
among
financial
and
bank
holding
companies
and
other
financial
service
providers;
continued
volatility
in
the
credit
and
equity
markets
and
its
effects
on
the
general
economy;
the
effect
of
changes
in
accounting
policies
and
practices,
as
may
be
adopted
by
the
regulatory
agencies,
as
well
as
the
Public
Company
Accounting
Oversight
Board,
the
Financial
Accounting
Standards
Board
and
other
accounting
standard
setters;
changes
in
our
organization,
management,
compensation
and
benefit
plans;
the
costs
and
effects
of
legal
and
regulatory
developments
including
the
resolution
of
legal
proceedings
or
regulatory
or
other
governmental
inquiries
and
the
results
of
regulatory
examinations
or
reviews;
our
success
at
managing
the
risks
involved
in
the
foregoing
items
and
other
factors
set
forth
in
the
Company's
public
reports
including
its
Annual
Report
on
Form
10-K
for
the
year
ended
December
31,
2012,
and
particularly
the
discussion
of
risk
factors
within
that
document.
The
Company
does
not
undertake,
and
specifically
disclaims
any
obligation
to
update
any
forward-looking
statements
to
reflect
occurrences
or
unanticipated
events
or
circumstances
after
the
date
of
such
statements
except
as
required
by
law.
2
1Q Results 2013 | cbbank.com |
 Senior
Leadership Team Name
Position
Banking Experience
CVBF Service
Christopher D. Myers
President & CEO
29 Years
7 Years
Richard C. Thomas
Executive Vice President
Chief Financial Officer
3 Years
2 Years
James F. Dowd
Executive Vice President
Chief Credit Officer
36 Years
5 Years
David C. Harvey
Executive Vice President
Chief Operations Officer
23 Years
3 Years
David A. Brager
Executive Vice President
Sales Division
25 Years
10 Years
R. Daniel Banis
Executive Vice President
CitizensTrust
31 Years
1 Year
Yamynn De Angelis
Executive Vice President
Chief Risk Officer
34 Years
26 Years
Richard Wohl
Executive Vice President
General Counsel
25 Years
2 Years
Elsa Zavala
Executive Vice President
Chief Information Officer
33 Years
20 Years
Larry Zivelonghi
Executive Vice President
Dairy & Livestock Industries Group
33 Years
20 Years
3
1Q Results 2013 | cbbank.com |
 Senior
Leadership Team Name
Position
Banking
Experience
CVBF Service
Ted Dondanville
Senior Vice President
Senior Lender
31 Years
15 Years
Hector Gutierrez
Senior Vice President
Deputy Chief Credit Officer
31 Years
2 Years
David Krebs
Senior Vice President
Human Resources
19 Years
10 Years
Eric Lucero
Senior Vice President
The Marketing Group
12 Years
NEW
James Mead
Senior Vice President
Region Manager (Inland Empire)
38 Years
20 Years
Michael Mulcahy
Senior Vice President
Region Manager (Los Angeles)
35 Years
5 Years
Tim Noone
Senior Vice President
Specialty Banking
30 Years
5 Years
Mark Richardson
Senior Vice President
Real Estate Banking Group
23 Years
19 Years
Michael Stain
Senior Vice President
Region Manager (Central Valley)
32 Years
NEW
Average:
Average:
27 Years
27 Years
10 Years
10 Years
4
1Q Results 2013 | cbbank.com |
 Senior
Managers Steven Caseldine
SVP |Corona Manager
Francene LaPoint
SVP | Controller
Ken Clark
SVP | Riverside Manager
Thomas Trine
SVP | Trust Services Manager
Mary Wilson
SVP | Tri-City Manager
Mary Hernandez
SVP | Specialty Banking Group
Greg Armstrong
SVP | Upland CBC Manager
John Hillier
SVP | Specialty Banking Group
Duane Keene
SVP | Covina Manager
Mary McElwee
SVP | Credit Management
LaVon Short
SVP | Treasury Services Manager
Terry Naffziger
SVP | Asset Based Lending
Sue Haynes
SVP | Bankcard Services Manager
Vince Gottuso
SVP | Ontario Airport Manager
Greg Grande
SVP | Pasadena Manager
Ron Fields
SVP | Chino Manager
5
1Q Results 2013 | cbbank.com |
 1Q
Results 2013 | cbbank.com |
 Total Assets:
$6.3 Billion
Gross Loans:
$3.4 Billion
Total Deposits (Including Repos):
$5.2 Billion
Total Equity:
$768 Million
Source: Q1 2013 earnings release & company filings. *non-covered loans
CVB Financial Corp. (CVBF)
Largest financial institution headquartered in the Inland Empire
region of Southern California. Founded in 1974.
Average Cost of Deposits = 0.11%
7
1Q Results 2013 | cbbank.com |
 Largest Banks Headquartered in California
8
Source: SNL Financial
Rank
Name
Asset Size (3/31/13)
1
Wells Fargo
$1,436,634
2
Union Bank
$96,959
3
Bank of the West
$62,493
4
First Republic Bank
$35,083
5
City National Bank
$27,434
6
OneWest Bank
$25,369
7
East West Bank
$23,102
8
SVB Financial
$22,796
9
Cathay Bank
$10,521
10
CapitalSource Inc.
$8,483
11
11
CVB Financial Corp.
CVB Financial Corp.
$6,266
$6,266
12
BBCN
$5,839
13
Pacific Western Bank
$5,300
14
Farmers & Merchants of Long Beach
$5,071
15
Westamerica Bank
$4,888
In millions
In millions
1Q Results 2013 | cbbank.com |
 Bank
Accomplishments & Ratings 144 Consecutive Quarters of Profitability
94 Consecutive Quarters of Cash Dividends
#6 Rated Bank: BankDirector Magazine
Bank Performance Scorecard (July 2012)
BauerFinancial Report
Five Star Rating (September 2012)
Fitch Rating
BBB (October 2012)
1Q Results 2013 | cbbank.com |
 1Q
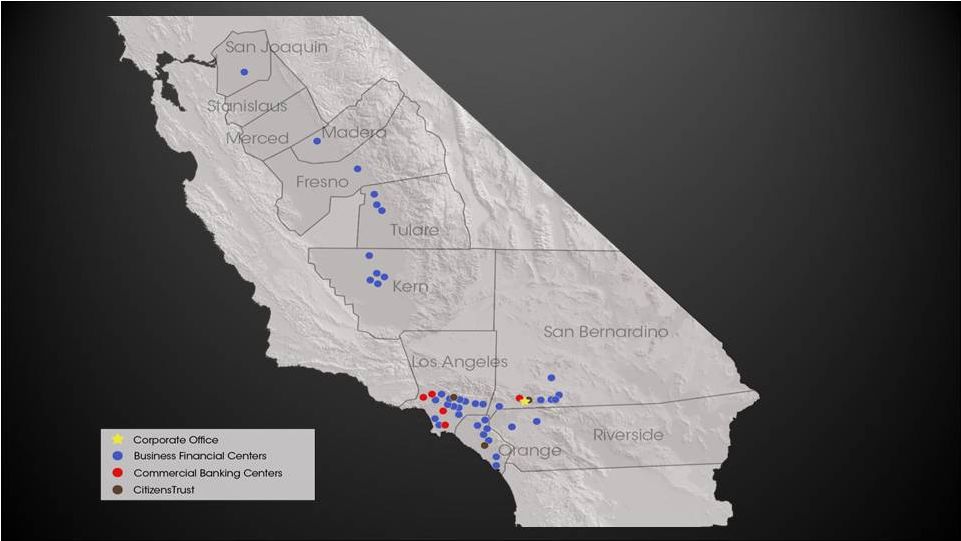
Results 2013 | cbbank.com Our Markets |
 1Q
Results 2013 | cbbank.com Existing Locations
11
40
Business Financial Centers
5
Commercial Banking Centers
3
CitizensTrust Locations
1Q Results 2013 | cbbank.com |
 Deposits*
(000’s)
# of Center
Locations
Total Deposits
(3/31/12)
Total Deposits
(3/31/13)
Los Angeles County
17
Inland Empire
(Riverside & San Bernardino Counties)
10
Central Valley
11
Orange County
7
Other
0
Total
45
*Includes Customer Repurchase Agreements; Balance as of balance sheet date
1Q Results 2013 | cbbank.com
Average Cost of Deposits (year to date)
0.17%
0.12%
$1,932,495
$1,617,447
$817,461
$545,356
$244,916
$5,157,675
$1,818,916
$1,698,844
$834,170
$572,867
$261,479
$5,186,276 |
 Non-Interest Bearing Deposits
(000’s)
1Q Results 2013 | cbbank.com
$1,000,000
$1,200,000
$1,400,000
$1,600,000
$1,800,000
$2,000,000
$2,200,000
$2,400,000
$2,600,000
Q1
Q1
Q2
Q3
Q4
2013
2012
2011
2010
2009
2008
2007
Q1
Q2
Q3
Q4
Q1
Q2
Q3
Q4
Q1
Q2
Q3
Q4
Q1
Q2
Q3
Q4
Q1
Q2
Q3
Q4 |
 Loans*
*Prior to MTM discount and loan loss reserve (Includes loans Held for Sale) | As of
3/31/13 1Q Results 2013 | cbbank.com
(000’s)
Los Angeles County
Central Valley
Inland Empire
(Riverside & San Bernardino Counties)
Orange County
Other
Total
Non-Covered
Loans*
$1,198,804
$646,987
$601,204
$455,543
$294,463
$3,197,001
Covered
Loans*
$14,194
$173,133
$1,034
$0
$11,241
$199,602
Total Loans*
$1,212,998
$820,120
$602,238
$455,543
$305,704
$3,396,603
%
35.71%
24.15%
17.73%
13.41%
9.00%
100.00%
1Q Results 2013 | cbbank.com |
 Loan
Portfolio Composition* 15
1Q Results 2013 | cbbank.com
Other, 1.8%
SFR Mortgage,
5.1%
Municipal Lease
Finance
Receivables, 3.4%
Multi-Family, 3.6%
Dairy, Livestock &
Agribusiness,
8.9%
Commercial &
Industrial, 16.7%
Commercial RE-
Non-Owner,
37.2%
Construction RE,
1.7%
Commercial RE –
Owner Occupied,
21.6%
Total Loans by Type
Source: Q1 2013 earnings release & company reports |
*Non-covered loans |
 Dairy
& Livestock as of 03/31/2013
Territory
Number of
Loan Outstandings
Total
Loan Outstandings
Central Valley
65
$123,862
Inland Empire
40
$38,284
Idaho
13
$47,051
New Mexico
15
$32,017
Washington
8
$26,394
Other Areas
13
$10,894
Total
154
$278,502
Dairy: Real Estate
53
$137,964
Grand Total
Grand Total
207
207
$416,466
$416,466
16
1Q Results 2013 | cbbank.com |
 Loans*
*Covered Loans net of SJB purchase discount
$4,000,000
$3,500,000
$3,000,000
$2,500,000
$2,000,000
$1,500,000
$1,000,000
$500,000
$0
(000’s)
Q1
Q2
Q3
Q4
Q1
Q2
Q3
Q4
Q1
Q2
Q3
Q4
Q1
Q2
Q3
Q4
Q1
Q2
Q3
Q4
Q1
Q2
Q3
Q4
Q1
2007
2008
2009
2010
2011
2012
2013
Non Covered Loans
Covered Loans*
1Q Results 2013 | cbbank.com
17 |
 •
Residential Real Estate
•
Multi-Family (Apartments)
•
Asset Based Lending
18
2013
New/Enhanced Lending Initiatives
1Q Results 2013 | cbbank.com |
 Other
Lending Areas For Future Consideration/Expansion
•
SBA 7A
•
Medical Equipment/Office
•
Equipment Lending & Leasing
•
Private Banking
19
1Q Results 2013 | cbbank.com |
 Profits
1Q Results 2013 | cbbank.com |
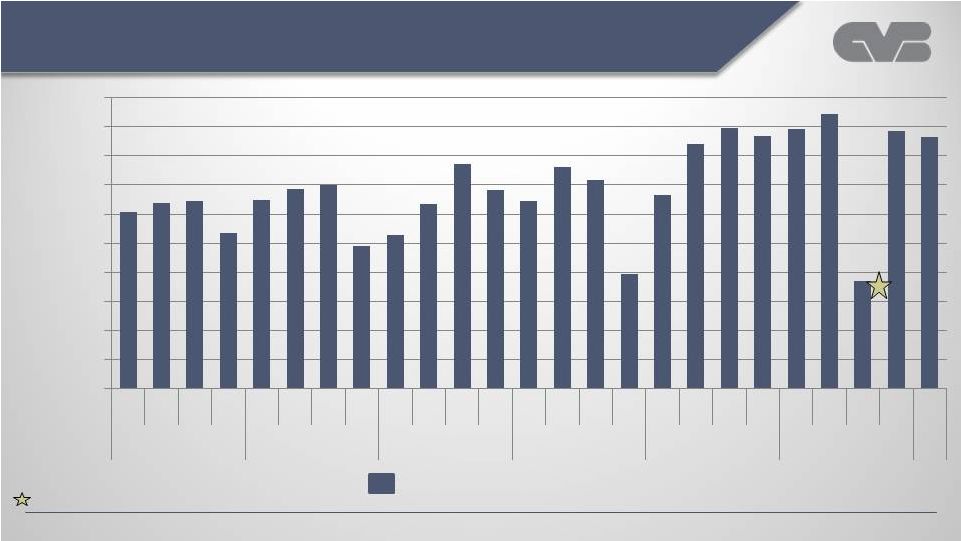 Net
Income (000’s)
Net Income After Taxes
$20.4 million FHLB prepayment charge
$25,000
$22,500
$20,000
$17,500
$12,500
$15,000
$10,000
$7,500
$5,000
$2,500
$0
Q1
Q2
Q3
Q4
Q1
Q2
Q3
Q4
Q1
Q2
Q3
Q4
Q1
Q2
Q3
Q4
Q1
Q2
Q3
Q4
Q1
Q2
Q3
Q4
Q1
2007
2008
2009
2010
2011
2012
2013
1Q Results 2013 | cbbank.com |
 22
(000’s)
2009
2010
2011
2012
3 Months to
3/31/2013
Net Interest Income
$222,264
$259,317
$234,681
$236,950
$54,589
Provision for Credit Losses
($80,500)
($61,200)
($7,068)
$0
$0
Other Operating
Income/Expenses (Net)
($52,515)
($111,378)
($106,809)
($122,257)
($24,053)
Income Taxes
($23,830)
($23,804)
($39,071)
($37,413)
($8,921)
Net Profit After Tax
$65,419
$62,935
$81,733
$77,280
$21,615
$21,615
1Q Results 2013 | cbbank.com
Earnings |
 Net
Interest Margin 23
*Normalized excludes accelerated accretion on covered loans
Normalized*
1Q Results 2013 | cbbank.com
Q1
Q2
Q3
Q4
Q1
Q2
Q3
Q4
Q1
Q2
Q3
Q4
Q1
Q2
Q3
Q4
Q1
Q2
Q3
Q4
Q1
Q2
Q3
Q4
Q1
2007
2008
2009
2010
2011
2012
2013
4.25%
1.50%
1.75%
2.00%
2.25%
2.50%
2.75%
3.00%
3.25%
3.50%
3.75%
4.00% |
 Bank Borrowings
1Q Results 2013 | cbbank.com |
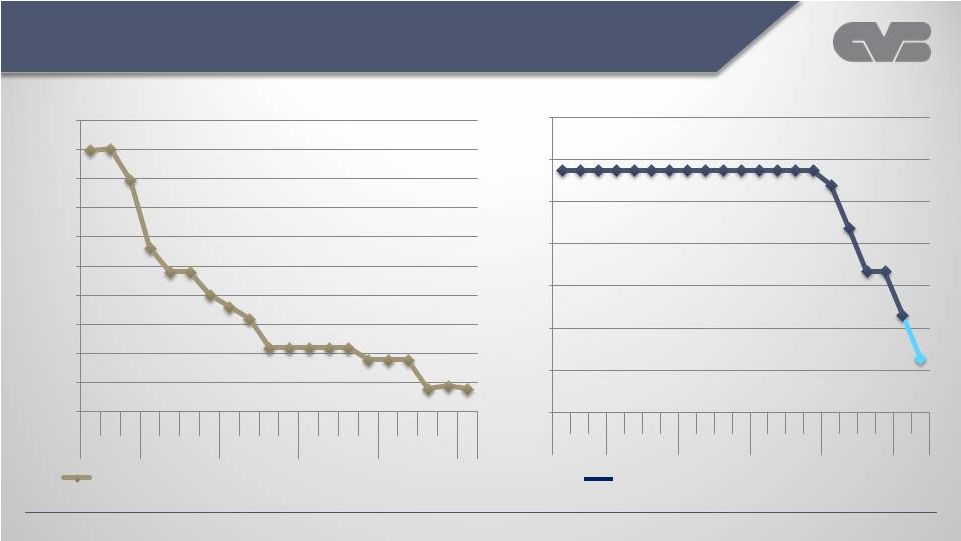 Bank
Borrowings 25
(000’s)
Trust Preferred (Jr. Subordinated Debentures)
Federal Home Loan Bank Debt & Other Borrowings
1Q Results 2013 | cbbank.com
Q2
Q3
Q4
Q1
Q2
Q3
Q4
Q1
Q2
Q3
Q4
Q1
Q2
Q3
Q4
Q1
Q2
Q3
Q4
Q1
Q2
Q3
Q4
Q1
Q2
Q3
Q4
Q1
Q2
Q3
Q4
Q1
Q2
Q3
Q4
Q1
Q2
Q3
Q4
Q1
Q2
2008
2009
2010
2011
2012
2013
2008
2009
2010
2011
2012
2013
$2,500,000
$0
$250,000
$500,000
$750,000
$1,000,000
$1,250,000
$1,500,000
$1,750,000
$2,000,000
$2,250,000
$140,000
$0
$20,000
$40,000
$60,000
$80,000
$100,000
$120,000 |
 Debt
Repayment Activity 2013
Type of Debt
Payoff Date
Amount
Weighted Average
Interest Rate
CVB Statutory Trust II
1/7/2013
$20,619
3-Month LIBOR +
2.85%
CVB Statutory Trust II
4/7/2013
$20,619
3-Month LIBOR +
2.85%
Total:
$41,238
26
(000’s)
1Q Results 2013 | cbbank.com |
 Type
of Debt Balance at
4/30/2013
Interest Rate
Maturity
FHLB Advance
$199,002
4.52% Fixed
11/28/2016
CVB Statutory Trust III
$25,774
3-Month LIBOR + 1.38%
3/15/2036
Total
$224,776
Outstanding Debt
27
(000’s)
1Q Results 2013 | cbbank.com |
 Capital
1Q Results 2013 | cbbank.com |
 Capital Ratios
Regulatory
Minimum Ratio
Regulatory
Well-Capitalized Ratio
March 31,2013*
Tier 1 Risk-based Capital Ratio
4.0%
6.0%
18.36%
Total Risk-based Capital Ratio
8.0%
10.0%
19.63%
Tier 1 Leverage Ratio
4.0%
5.0%
11.54%
Tangible Capital Ratio
4.0%
5.0%
11.44%
Core Tier 1 Capital Ratio
17.21%
29
*CVB Financial Corp.
-
Consolidated
1Q Results 2013 | cbbank.com |
 Total
Shareholder Equity 30
(000’s)
$825,000
$0
1Q Results 2013 | cbbank.com
$75,000
$150,000
$225,000
$300,000
$375,000
$450,000
$525,000
$600,000
$675,000
$750,000
2006
2012
2011
2010
2009
2008
2007 |
 Securities & Investments
1Q Results 2013 | cbbank.com |
 *Securities Available For Sale
Yield on securities
portfolio = 2.39%
for the 1st Quarter 2013
Securities Portfolio*
--$2.39 Billion--
CMO’s /
REMIC’s 19.98%
MBS 37.34%
Trust Preferred
0.21%
Municipal
Bonds 26.13%
Government
Agency &
GSEs 16.34%
Source:
Q1
2013
earnings
release.
As
of
3/31/2013
securities
held-to-maturity
were
valued
at
approximately
$2.0
million
|
Yield
on
securities
represents
the
fully
taxable
equivalent
1Q Results 2013 | cbbank.com |
 Securities Portfolio*
$2.39 Billion
Mark-to-Market (Pre-tax) (000’s)
*Securities Available For Sale
$60,781
$60,781
MBS & CMO’s
$24,607
Municipal
Bonds $36,850
Other Securities
($676)
$89,000
$79,000
$69,000
$59,000
$49,000
$39,000
$29,000
$19,000
$9,000
-$1,000
Jun
Sep
Dec
Mar
Jun
Sep
Dec
Mar
Mar
Jun
Jun
Sep
Dec
Sep
Dec
Mar
13
12
12
12
12
11
11
11
11
10
10
10
10
09
09
09
1Q Results 2013 | cbbank.com |
 Yield
on Securities vs. Yield on Loans *Excluding Discount Accretion
Yield on Loans*
Yield on Securities
6.00%
Q1
2013
2012
2011
2010
2009
1Q Results 2013 | cbbank.com
1.00%
1.50%
2.00%
2.50%
3.00%
3.50%
4.00%
4.50%
5.00%
5.50%
Q2
Q3
Q4
Q1
Q2
Q3
Q4
Q1
Q2
Q3
Q4
Q1
Q2
Q3
Q4
Q1 |
 CVBF
Assets 35
*Includes
overnight
funds
held
at
the
Federal
Reserve,
Interest
earning
-
due
from
Correspondent Banks, other short-term money market accounts or certificates of
deposit 3/31/13
$6.3 Billion
12/31/06
$6.1 Billion
Loans
49.9%
Securities
42.4%
Fed
Balance*
2.4%
Other 4.6%
Goodwill &
Intangibles
0.7%
Loans,
52.3%
Securities,
38.2%
Fed
Balance*,
0.9%
Other, 7.7%
Goodwill &
Intangibles,
0.9%
1Q Results 2013 | cbbank.com |
 CVBF
Liabilities 12/31/06
$5.7 Billion
3/31/13
$5.5 Billion
*Includes Customer Repurchase Agreements
Junior
subordinated
Debentures,
1.9%
Borrowings,
36.0%
Total
Deposits*,
61.4%
Other
Liabilities,
0.7%
Other
Liabilities,
1.2%
Junior
subordinated
Debentures,
0.9%
Total
Deposits*,
94.3%
1Q Results 2013 | cbbank.com
Borrowings,
3.6% |
 May
2013 -Shareholder Update-
37
1Q Results 2013 | cbbank.com |
 SEC
Investigation 38
•
SEC investigation related to CBB loan loss reserves was
initiated in late July 2010
•
CVBF and outside counsel have fully cooperated with
the SEC
•
We are hopeful the investigation will be positively
resolved but have no specific insight as to timing or
outcome
1Q Results 2013 | cbbank.com |
 Lawsuits: Shareholder & Derivative
39
•
The federal securities class action was initiated in January 2011, and
the complaint was dismissed by the district court judge in January
2012. An amended complaint was filed in February 2012 and was
dismissed by the court in August 2012.
•
Plaintiffs filed another amended complaint in September 2012, which
was dismissed (for the third time) by the court in May 2013. However,
plaintiffs were given leave to re-file yet another amended complaint.
•
We intend to continue to vigorously contest the plaintiff’s claims,
which we believe are without merit.
•
The companion state law derivative action has been deferred
pending the outcome of the federal class action lawsuit.
1Q Results 2013 | cbbank.com |
 CVBF
Stock Price 40
$10.38
Shareholders Meeting
05/18/10
$9.22
Shareholders Meeting
05/18/11
$11.35
05/15/13
$6.56
Shareholders Meeting
05/13/09
--Press Release--
SEC Investigation
08/10/10
$11.07
Shareholders Meeting
05/16/12
1Q Results 2013 | cbbank.com
1Q Results 2013 | cbbank.com
$4
$5
$6
$7
$8
$9
$10
$11
$12
$13
$14 |
 1Q
Results 2013 | cbbank.com --2013 & Beyond—
Our Growth Strategy |
 1Q
Results 2013 | cbbank.com Our Mission
42
“The mission of CVB Financial Corp. is to achieve
superior performance and rank in the top 10% of all
financial institutions in the nation in return on equity
and return on assets. This will be achieved by
delivering the finest in financial products and services
through relationship banking commitments with
businesses and professionals in the Inland Empire, Los
Angeles County, Orange County and the Central
Valley areas of California. It will be supported by an
unqualified commitment to our five core values.” |
 1Q
Results 2013 | cbbank.com Five Core Values
43
1.
Financial Strength
2.
Superior People
3.
Customer Focus
4.
Cost Effective Operation
5.
Having Fun |
 1Q
Results 2013 | cbbank.com Our Vision
Citizens Business Bank will strive to become the
dominant financial services company operating
throughout the state of California, servicing the
comprehensive financial needs of successful small to
medium sized businesses and their owners.
44 |
 1Q
Results 2013 | cbbank.com Target Customer
The best privately-held and/or family-owned
businesses throughout California
Annual revenues of $1-200 million
Top 25% in their respective industry
Full relationship banking
Build 20-year relationships
45 |
 Three
Areas of Growth 46
Acquisitions
--Banks--
--Trust--
DeNovo
Same Store
Sales
1Q Results 2013 | cbbank.com |
 •
Target size: $200 million to $2 billion in assets
•
Financial & Strategic
•
In-market and/or adjacent geographic market (California
only) Acquisition Strategy
--Banks--
--Trust/Investment--
•
Target size: AUM of $200 million to $1 billion
•
In California
--Banking Teams--
•
In-
market & ‘new’
markets
1Q Results 2013 | cbbank.com |
 2013 Strategy:
Key Objectives
48
1Q Results 2013 | cbbank.com |
 Our
‘Critical Few’ •
Loan Growth
•
Expand Credit Product Offerings & Capabilities
•
Build Core Deposits
•
Drive Service Charge & Fee Income Growth
•
Manage Operating Efficiency
•
Grow Through Acquisition
1Q Results 2013 | cbbank.com |
 Copy of presentation at
www.cbbank.com
1Q Results 2013 | cbbank.com |